Commercial Operation of Electrostatic Precipitator High Frequency Energization in Intermittent Energization Mode at Labadie Energy Center, Units 1 & 2 David E. Boll, P.E. Supervising Engineer Ameren Missouri 3700 S. Lindbergh Blvd St. Louis, MO 63127 Nicolas Pelech, P.E., P.M.P Consulting Engineer Ameren Missouri 3700 S. Lindbergh Blvd St. Louis, MO 63127 P.E. “Mick” Chambers Director, Pre-Contract Operations Southern Environmental Inc. 6690 West Nine Mile Road Pensacola, FL 32526 Hardik Shah Applications Engineer Southern Environmental Inc. 6690 West Nine Mile Road Pensacola, FL 32526 Gary J. Grieco, P.E. Consulting Engineer Air Consulting Associates, L.L.C. 790 Park Road Morris Plains, NJ 07950
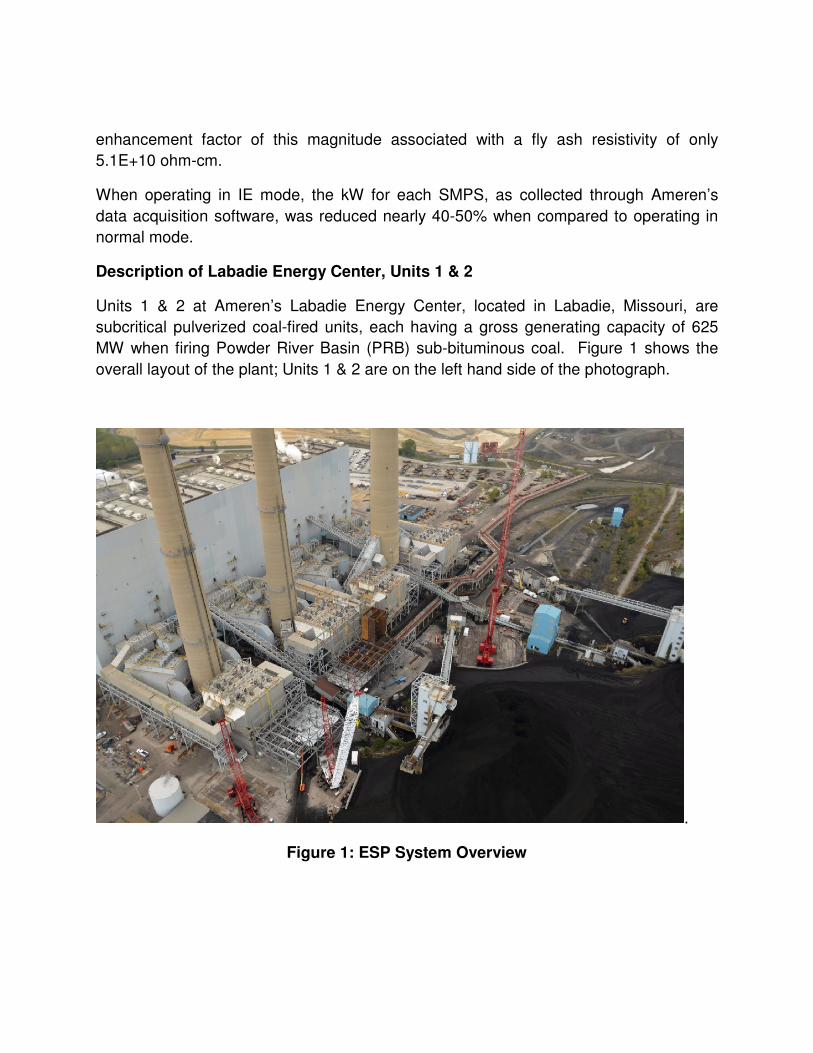
Transcript
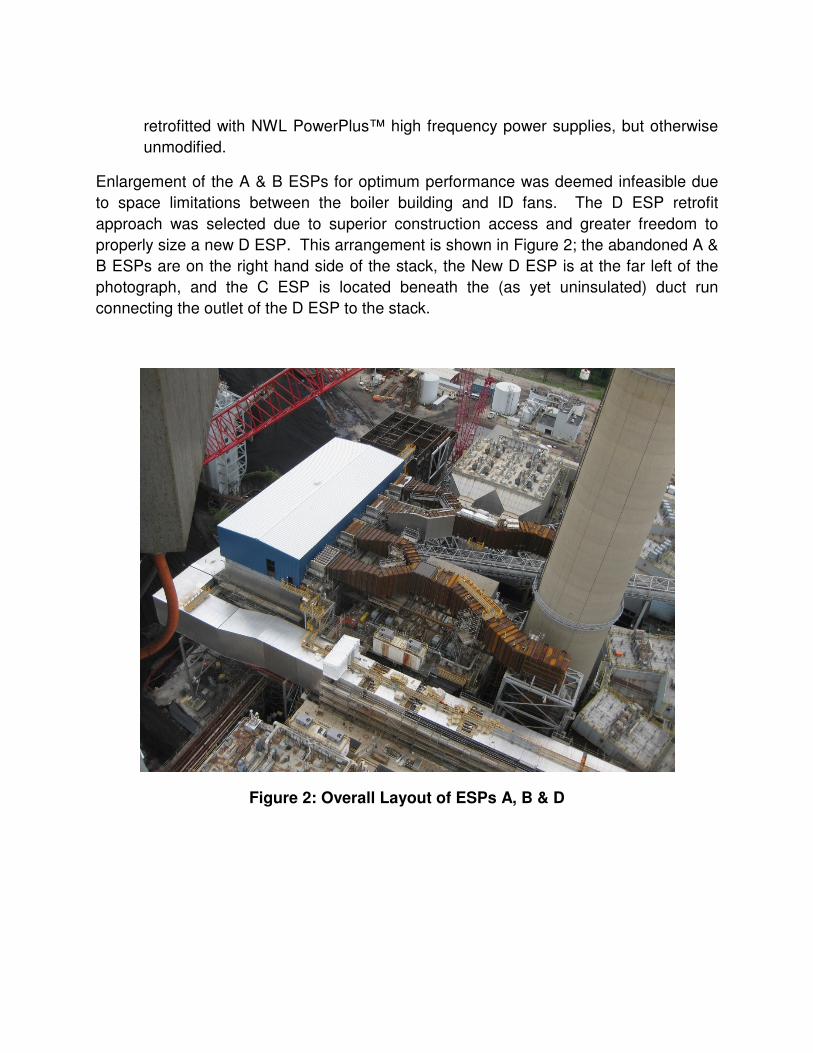
Commercial Operation of Electrostatic Precipitator
High Frequency Energization in Intermittent
Energization Mode at Labadie Energy Center, Units 1 & 2
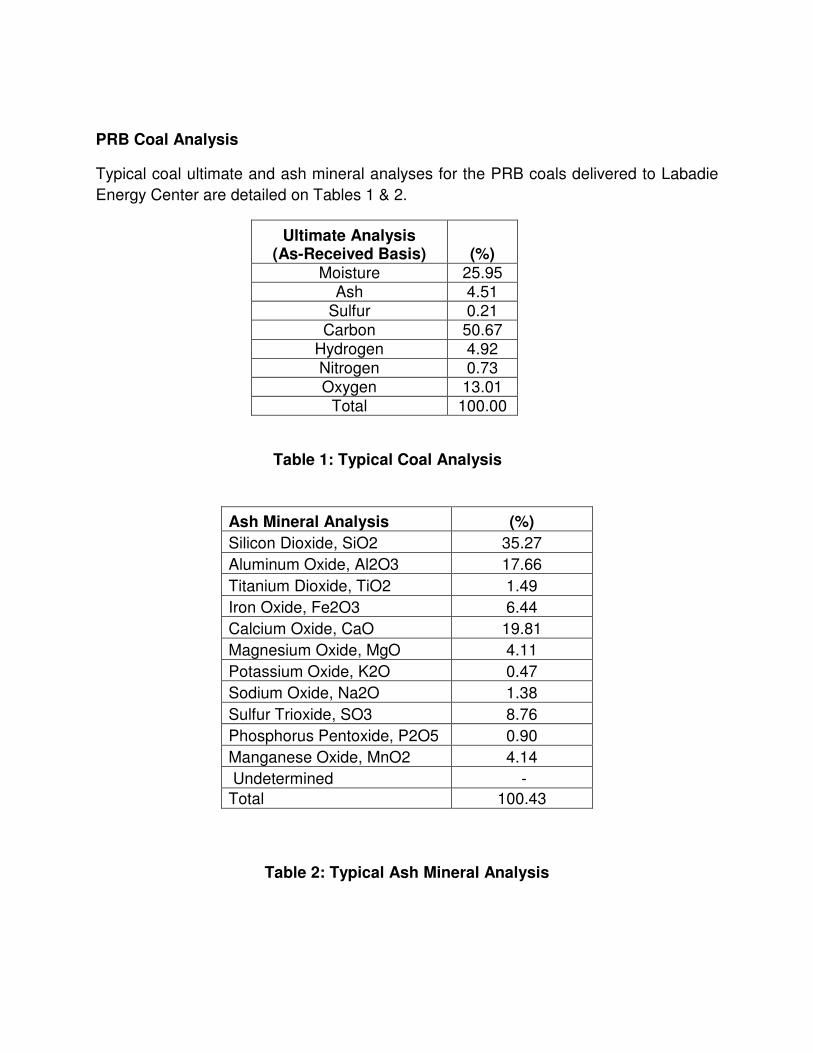
The PRB coal’s combination of low sulfur and relatively low sodium produce fly ash
resistivities between 3.9E+10 and 5.2E+10 ohm-cm at an operating flue gas
temperature range of 300 to 360 deg F. This temperature window straddles the peak of
the PM resistivity versus gas temperature’s bell-shaped relationship.
ESP inlet PM loading was moderately light, ranging from 3.1 to 4.8 lb/mmBtu, which is
typical of tangentially-fired boilers originally designed to fire Eastern bituminous coal but
were converted to PRB coal firing.
ESP System Startup and Tuning
During ESP system startup the tenacity of this “pure” PRB fly ash demanded that
special care be taken with regard to rapping cycle frequency and intensity. Also the gas
flow split between the C and D ESPs was adjusted to ensure maximum performance
relevant to the capability of these very differently designed ESPs.
Over a four week span, each of these parameters was fine-tuned in sequence until
optimum ESP system performance was achieved. However it was noted that on hot
summer days, when the flue gas temperature climbed above 340 deg F due to elevated
ambient air temperature, stack opacity gradually crept up throughout the afternoon
hours. Secondary voltage versus current (V-I) curves were obtained in order to
evaluate the extent of back corona ionization. It was observed that hot afternoon V-I
curves displayed signs of mild back corona when compared to V-I curves produced
earlier in the day.
This investigation suggested that the implementation of IE mode would be of benefit. In
this manner, the potential for developing back corona ionization was reduced, resulting
in better and more consistent ESP performance. An additional benefit of IE mode is a
reduction in ESP power consumption.
High Frequency Energization in IE Mode
High frequency energization provides a low-ripple secondary waveform that allows for
ESP operation at higher secondary voltage and current. IE mode then superimposes
corona on/off-times onto this low ripple D-C waveform. When operated in IE mode, high
frequency energization is capable of delivering “on-times” from 0.10 to 10 milliseconds
and “off- times” from 0.10 to 99 milliseconds. This favorably compares to a one half
cycle (8.33 milliseconds) on-time and a full cycle (16.67 milliseconds) off-time for
conventional 60 Hz power supplies. Hence high frequency energization in IE mode
provides significantly greater operating flexibility when compared to conventional
energization.
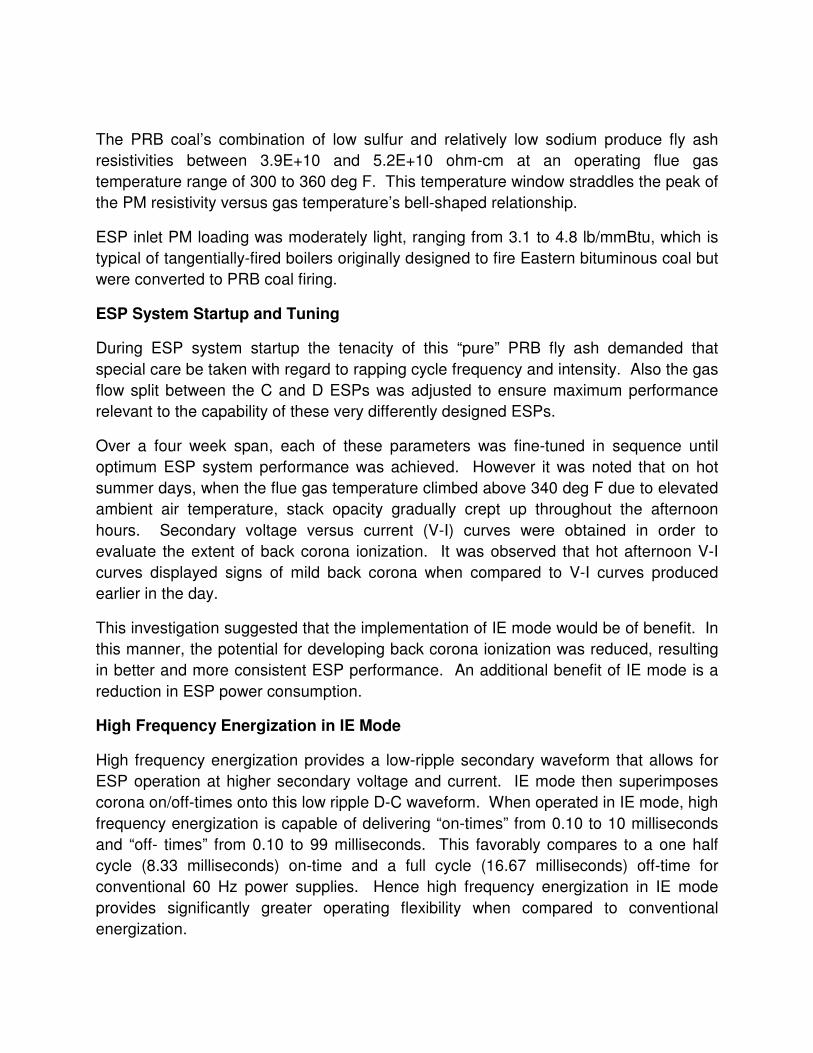
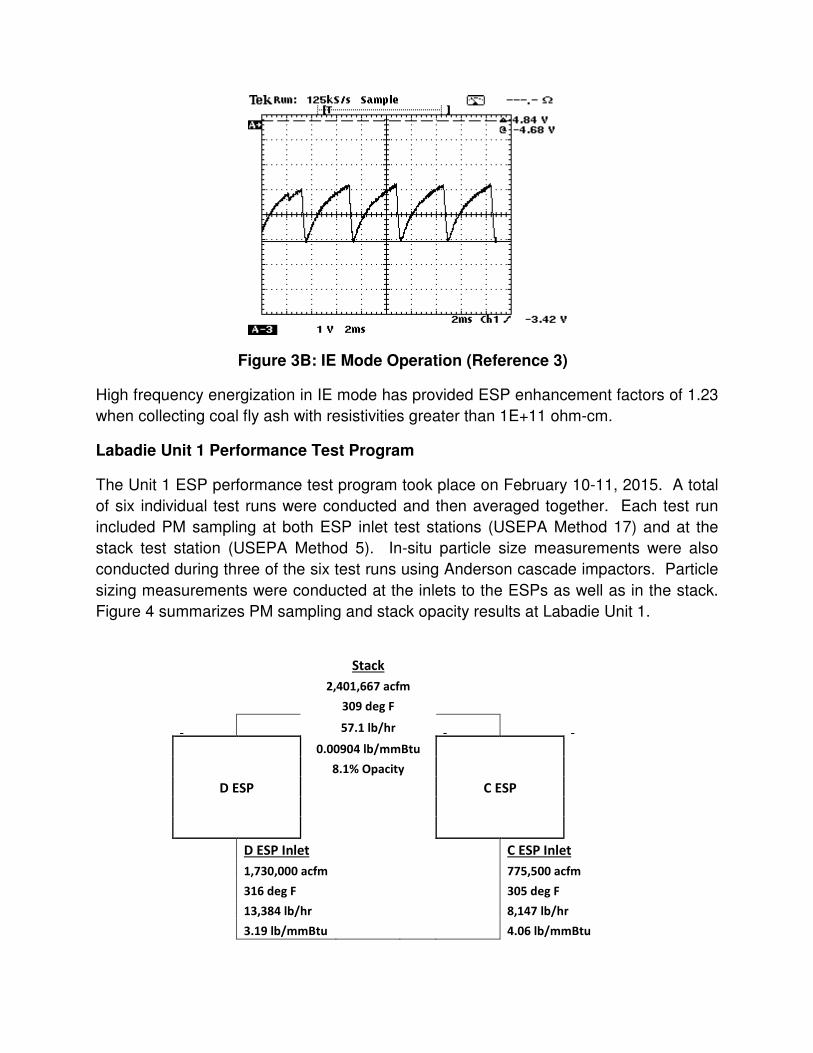
Figures 3A & 3B compare a NWL PowerPlus™ set operating in DC mode versus IE
mode. Note that this data was not taken at Labadie Energy Center but rather at a
similar installation. Figure 3A is an oscilloscope trace of DC mode operation where
kVavg = 29.4 and kVp = 30.7. Figure 3B demonstrates IE mode operation with 0.30
milliseconds on-time and 3.3 milliseconds off-time, where kVavg = 26.6 and kVp = 37.4.
The 21.8% increase in kVp provides improved charging and precipitation of high
resistivity particles without the onset of back corona ionization. Also, the 3.3
milliseconds off-time provides electric energy savings.
Figure 3A: DC Mode Operation (Reference 3)
Figure 3B: IE Mode Operation (Reference 3)
High frequency energization in IE mode has provided ESP enhancement factors of 1.23
when collecting coal fly ash with resistivities greater than 1E+11 ohm-cm.
Labadie Unit 1 Performance Test Program
The Unit 1 ESP performance test program took place on February 10-11, 2015. A total
of six individual test runs were conducted and then averaged together. Each test run
included PM sampling at both ESP inlet test stations (USEPA Method 17) and at the
stack test station (USEPA Method 5). In-situ particle size measurements were also
conducted during three of the six test runs using Anderson cascade impactors. Particle
sizing measurements were conducted at the inlets to the ESPs as well as in the stack.
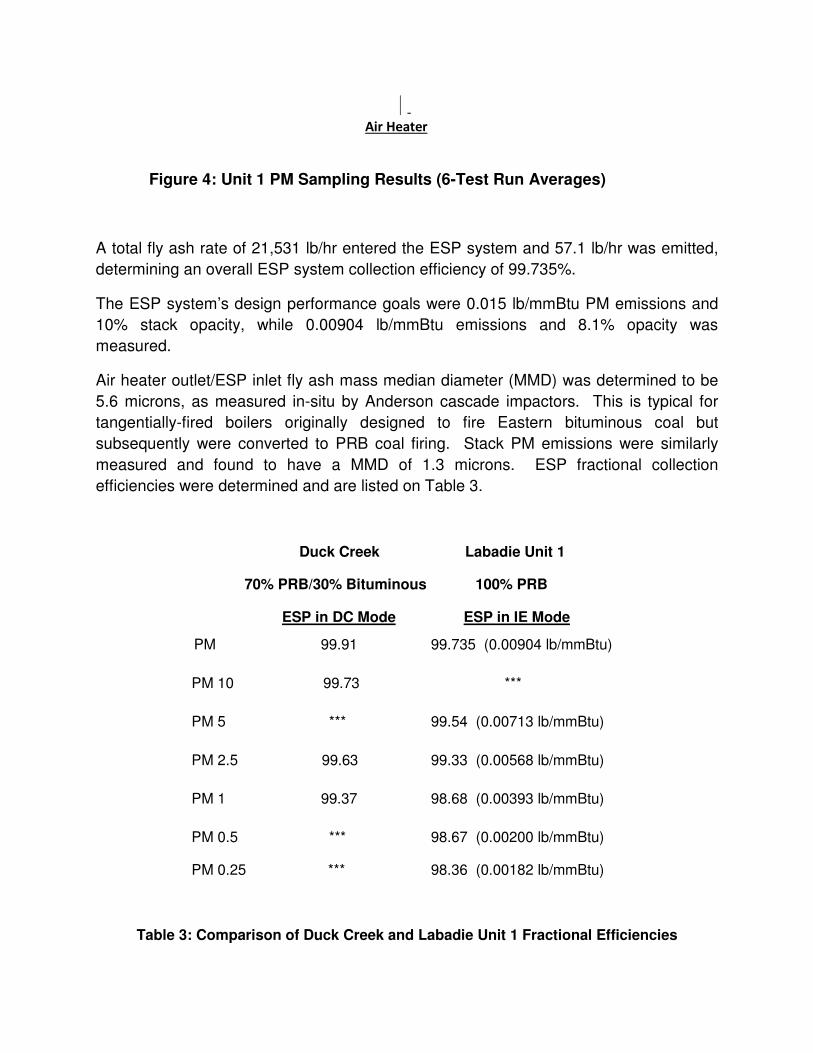
Figure 4 summarizes PM sampling and stack opacity results at Labadie Unit 1.
Stack
2,401,667 acfm
309 deg F
57.1 lb/hr
0.00904 lb/mmBtu
8.1% Opacity
D ESP C ESP
D ESP Inlet C ESP Inlet
1,730,000 acfm 775,500 acfm
316 deg F 305 deg F
13,384 lb/hr 8,147 lb/hr
3.19 lb/mmBtu 4.06 lb/mmBtu
Air Heater
Figure 4: Unit 1 PM Sampling Results (6-Test Run Averages)
A total fly ash rate of 21,531 lb/hr entered the ESP system and 57.1 lb/hr was emitted,
determining an overall ESP system collection efficiency of 99.735%.
The ESP system’s design performance goals were 0.015 lb/mmBtu PM emissions and
10% stack opacity, while 0.00904 lb/mmBtu emissions and 8.1% opacity was
measured.
Air heater outlet/ESP inlet fly ash mass median diameter (MMD) was determined to be
5.6 microns, as measured in-situ by Anderson cascade impactors. This is typical for
tangentially-fired boilers originally designed to fire Eastern bituminous coal but
subsequently were converted to PRB coal firing. Stack PM emissions were similarly
measured and found to have a MMD of 1.3 microns. ESP fractional collection
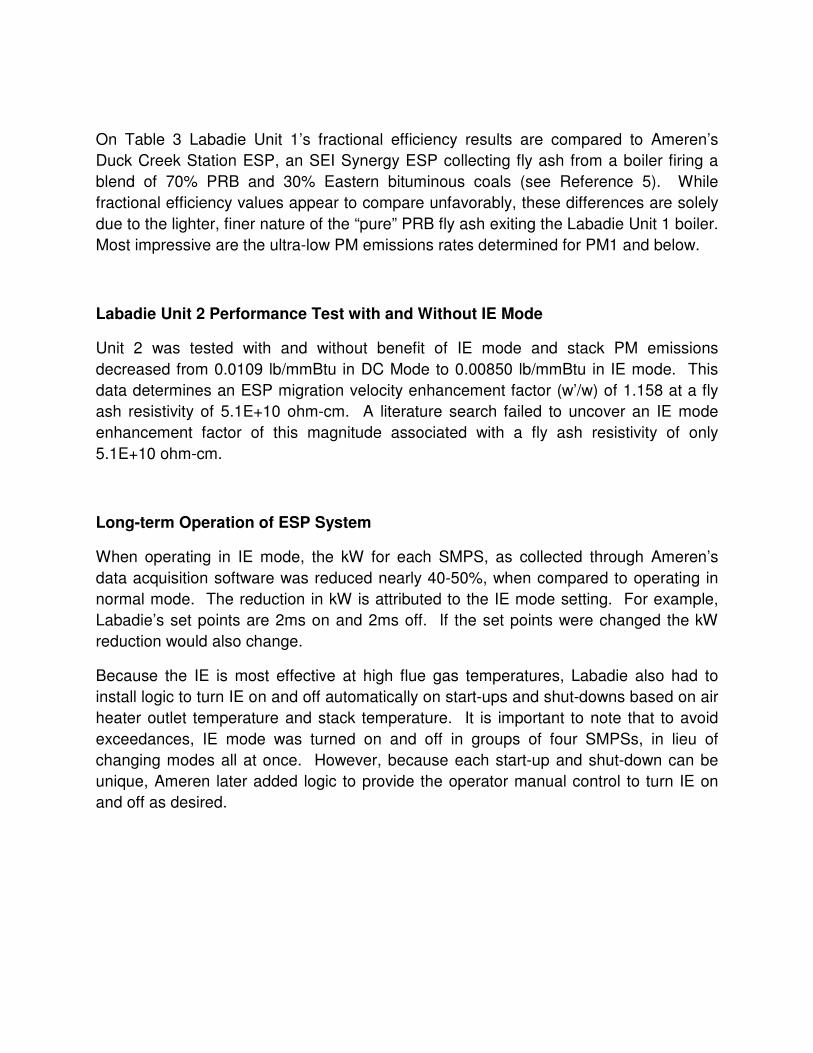
efficiencies were determined and are listed on Table 3.
Duck Creek Labadie Unit 1
70% PRB/30% Bituminous 100% PRB
ESP in DC Mode ESP in IE Mode
PM 99.91 99.735 (0.00904 lb/mmBtu)
PM 10 99.73 ***
PM 5 *** 99.54 (0.00713 lb/mmBtu)
PM 2.5 99.63 99.33 (0.00568 lb/mmBtu)
PM 1 99.37 98.68 (0.00393 lb/mmBtu)
PM 0.5 *** 98.67 (0.00200 lb/mmBtu)
PM 0.25 *** 98.36 (0.00182 lb/mmBtu)
Table 3: Comparison of Duck Creek and Labadie Unit 1 Fractional Efficiencies
On Table 3 Labadie Unit 1’s fractional efficiency results are compared to Ameren’s
Duck Creek Station ESP, an SEI Synergy ESP collecting fly ash from a boiler firing a
blend of 70% PRB and 30% Eastern bituminous coals (see Reference 5). While
fractional efficiency values appear to compare unfavorably, these differences are solely
due to the lighter, finer nature of the “pure” PRB fly ash exiting the Labadie Unit 1 boiler.
Most impressive are the ultra-low PM emissions rates determined for PM1 and below.
Labadie Unit 2 Performance Test with and Without IE Mode
Unit 2 was tested with and without benefit of IE mode and stack PM emissions
decreased from 0.0109 lb/mmBtu in DC Mode to 0.00850 lb/mmBtu in IE mode. This
data determines an ESP migration velocity enhancement factor (w’/w) of 1.158 at a fly
ash resistivity of 5.1E+10 ohm-cm. A literature search failed to uncover an IE mode
enhancement factor of this magnitude associated with a fly ash resistivity of only
5.1E+10 ohm-cm.
Long-term Operation of ESP System
When operating in IE mode, the kW for each SMPS, as collected through Ameren’s
data acquisition software was reduced nearly 40-50%, when compared to operating in
normal mode. The reduction in kW is attributed to the IE mode setting. For example,
Labadie’s set points are 2ms on and 2ms off. If the set points were changed the kW
reduction would also change.
Because the IE is most effective at high flue gas temperatures, Labadie also had to
install logic to turn IE on and off automatically on start-ups and shut-downs based on air
heater outlet temperature and stack temperature. It is important to note that to avoid
exceedances, IE mode was turned on and off in groups of four SMPSs, in lieu of
changing modes all at once. However, because each start-up and shut-down can be
unique, Ameren later added logic to provide the operator manual control to turn IE on
and off as desired.
References
1. CHANDRA, A., “Performance Improvement of Electrostatic Precipitators: Some Experimental Studies,” Proceedings of the 10th International Conference on Electrostatic Precipitation, Cairns, Australia, June 25-29, 2006
4. JINGLING, Y., DIGUANG, Z. and LIYA, R., “Electrostatic Precipitator Performance of Improved RS Wire,” Proceedings of the 4th International Conference on Electrostatic Precipitation, Beijing, China, September 14-17, 1990
5. CHAMBERS, P.E. and GRIECO, G.J., Synergistic Effect of Modern ESP Design Produces Particulate Emissions Comparable to Fabric Filters, paper presented at the A&WMA 103rd Annual Conference & Exhibition, Calgary, Alberta, Canada, June 22-25, 2010