Page 1
10 February 2016
Commonwealth Bank (CBA)
Ordeal and triumph
Recommendation
Buy (unchanged) Price
$74.20 Target (12 months)
$83.50 (previously $85.50)
Analyst
TS Lim 612 8224 2810
Authorisation
Chris Savage 612 8224 2835
Expected Return
Capital growth 12.5%
Dividend yield 5.7%
Total expected return 18.2%
Company Data & Ratios
Enterprise value n/m
Market cap $126,700m
Issued capital 1,708m
Free float 100%
Avg. daily val. (52wk) $302.6m
12 month price range $70.15 - $96.27
GICS sector
Banks
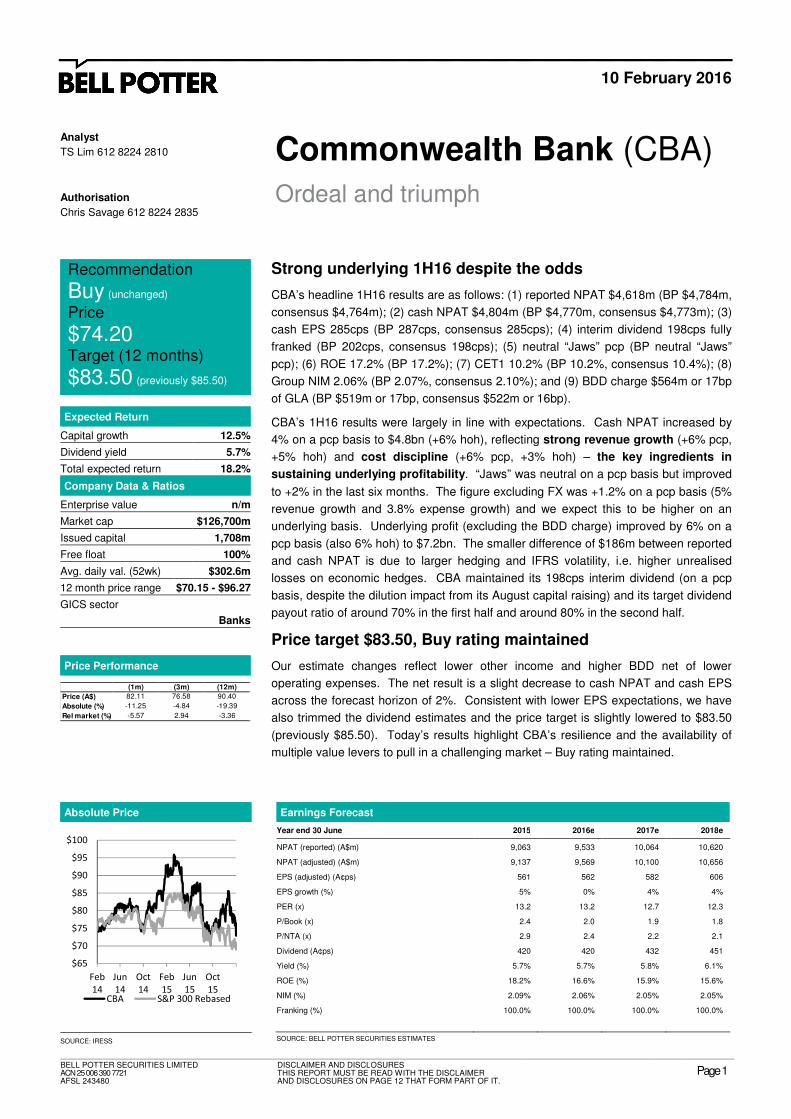
Price Performance
BELL POTTER SECURITIES LIMITED ACN 25 006 390 7721 AFSL 243480
DISCLAIMER AND DISCLOSURES THIS REPORT MUST BE READ WITH THE DISCLAIMER AND DISCLOSURES ON PAGE 12 THAT FORM PART OF IT.
Page 1
(1m) (3m) (12m)
Price (A$) 82.11 76.58 90.40
Absolute (%) -11.25 -4.84 -19.39
Rel market (%) -5.57 2.94 -3.36
Strong underlying 1H16 despite the odds
CBA’s headline 1H16 results are as follows: (1) reported NPAT $4,618m (BP $4,784m,
consensus $4,764m); (2) cash NPAT $4,804m (BP $4,770m, consensus $4,773m); (3)
cash EPS 285cps (BP 287cps, consensus 285cps); (4) interim dividend 198cps fully
franked (BP 202cps, consensus 198cps); (5) neutral “Jaws” pcp (BP neutral “Jaws”
pcp); (6) ROE 17.2% (BP 17.2%); (7) CET1 10.2% (BP 10.2%, consensus 10.4%); (8)
Group NIM 2.06% (BP 2.07%, consensus 2.10%); and (9) BDD charge $564m or 17bp
of GLA (BP $519m or 17bp, consensus $522m or 16bp).
CBA’s 1H16 results were largely in line with expectations. Cash NPAT increased by
4% on a pcp basis to $4.8bn (+6% hoh), reflecting strong revenue growth (+6% pcp,
+5% hoh) and cost discipline (+6% pcp, +3% hoh) – the key ingredients in
sustaining underlying profitability. “Jaws” was neutral on a pcp basis but improved
to +2% in the last six months. The figure excluding FX was +1.2% on a pcp basis (5%
revenue growth and 3.8% expense growth) and we expect this to be higher on an
underlying basis. Underlying profit (excluding the BDD charge) improved by 6% on a
pcp basis (also 6% hoh) to $7.2bn. The smaller difference of $186m between reported
and cash NPAT is due to larger hedging and IFRS volatility, i.e. higher unrealised
losses on economic hedges. CBA maintained its 198cps interim dividend (on a pcp
basis, despite the dilution impact from its August capital raising) and its target dividend
payout ratio of around 70% in the first half and around 80% in the second half.
Price target $83.50, Buy rating maintained
Our estimate changes reflect lower other income and higher BDD net of lower
operating expenses. The net result is a slight decrease to cash NPAT and cash EPS
across the forecast horizon of 2%. Consistent with lower EPS expectations, we have
also trimmed the dividend estimates and the price target is slightly lowered to $83.50
(previously $85.50). Today’s results highlight CBA’s resilience and the availability of
multiple value levers to pull in a challenging market – Buy rating maintained.
Absolute Price Earnings Forecast
Year end 30 June 2015 2016e 2017e 2018e
NPAT (reported) (A$m) 9,063 9,533 10,064 10,620
NPAT (adjusted) (A$m) 9,137 9,569 10,100 10,656
EPS (adjusted) (A¢ps) 561 562 582 606
EPS growth (%) 5% 0% 4% 4%
PER (x) 13.2 13.2 12.7 12.3
P/Book (x) 2.4 2.0 1.9 1.8
P/NTA (x) 2.9 2.4 2.2 2.1
Dividend (A¢ps) 420 420 432 451
Yield (%) 5.7% 5.7% 5.8% 6.1%
ROE (%) 18.2% 16.6% 15.9% 15.6%
NIM (%) 2.09% 2.06% 2.05% 2.05%
Franking (%) 100.0% 100.0% 100.0% 100.0%
SOURCE: IRESS SOURCE: BELL POTTER SECURITIES ESTIMATES
$65
$70
$75
$80
$85
$90
$95
$100
Feb
14
Jun
14
Oct
14
Feb
15
Jun
15
Oct
15CBA S&P 300 Rebased
Page 2
Page 2
Commonwealth Bank (CBA) 10 February 2016
Ordeal and triumph
Strong underlying 1H16 despite the odds
CBA’s headline 1H16 results are as follows:
� Reported NPAT $4,618m (BP $4,784m, consensus $4,764m);
� Cash NPAT $4,804m (BP $4,770m, consensus $4,773m);
� Cash EPS 285cps (BP 287cps, consensus 285cps);
� Interim dividend 198cps fully franked (BP 202cps, consensus 198cps);
� Neutral “Jaws” pcp (BP neutral “Jaws” pcp);
� ROE 17.2% (BP 17.2%);
� CET1 10.2% (BP 10.2%, consensus 10.4%);
� Group NIM 2.06% (BP 2.07%, consensus 2.10%); and
� BDD charge $564m or 17bp of GLA (BP $519m or 17bp, consensus $522m or 16bp).
CBA’s 1H16 results were largely in line with expectations. Cash NPAT increased by 4%
on a pcp basis to $4.8bn (+6% hoh), reflecting strong revenue growth (+6% pcp, +5%
hoh) and cost discipline (+6% pcp, +3% hoh) – the key ingredients in sustaining
underlying profitability. “Jaws” was neutral on a pcp basis but improved to +2% in the
last six months. The figure excluding FX was +1.2% on a pcp basis (5% revenue growth
and 3.8% expense growth) and we expect this to be higher on an underlying basis.
Underlying profit (excluding the BDD charge) improved by 6% on a pcp basis (also 6%
hoh) to $7.2bn. The smaller difference of $186m between reported and cash NPAT is due
to larger hedging and IFRS volatility, i.e. higher unrealised losses on economic hedges.
NIE increased by 6% on a pcp basis (+6% hoh) to $8.4bn, largely driven by strong volume
effect (and stable rate effect hoh). While NIM fell by 5bp on a pcp basis to 206bp and the
spread was roughly unchanged at 194bp, the more important factor in our view is the
change in the six months to 31 December. At the Group level, the spread improved by 1bp
and NIM was stable at 206bp with the difference being a 1bp lower free fund effect
(impacted by a low rate environment). Group spread and NIM were favourably impacted
by repricing in the Australian operations (spread unchanged pcp and +1bp hoh, NIM -2bp
pcp and +5bp hoh). We note mortgage repricing in Australia only took place in November
and there should be some tailwind from full repricing in the second half.
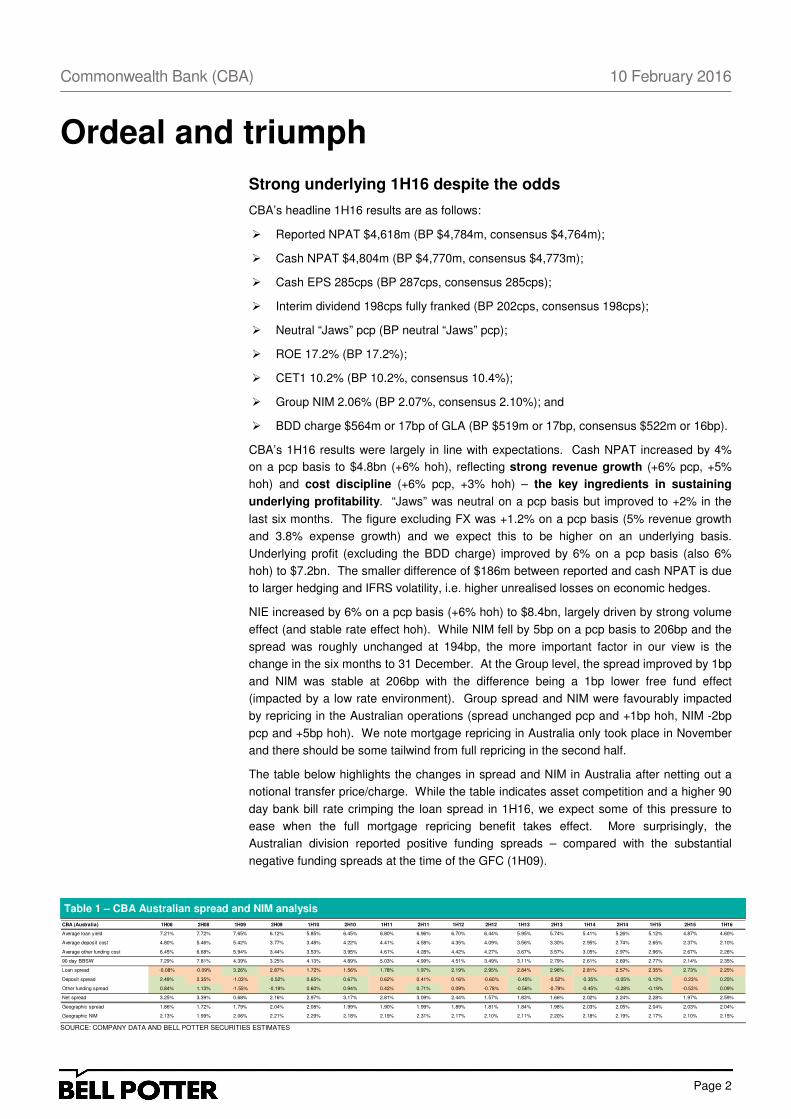
The table below highlights the changes in spread and NIM in Australia after netting out a
notional transfer price/charge. While the table indicates asset competition and a higher 90
day bank bill rate crimping the loan spread in 1H16, we expect some of this pressure to
ease when the full mortgage repricing benefit takes effect. More surprisingly, the
Australian division reported positive funding spreads – compared with the substantial
negative funding spreads at the time of the GFC (1H09).
Table 1 – CBA Australian spread and NIM analysis
SOURCE: COMPANY DATA AND BELL POTTER SECURITIES ESTIMATES
CBA (Australia) 1H08 2H08 1H09 2H09 1H10 2H10 1H11 2H11 1H12 2H12 1H13 2H13 1H14 2H14 1H15 2H15 1H16
Average loan yield 7.21% 7.72% 7.65% 6.12% 5.85% 6.45% 6.80% 6.96% 6.70% 6.44% 5.95% 5.74% 5.41% 5.26% 5.12% 4.87% 4.60%
Average deposit cost 4.80% 5.46% 5.42% 3.77% 3.48% 4.22% 4.41% 4.58% 4.35% 4.09% 3.56% 3.30% 2.95% 2.74% 2.65% 2.37% 2.10%
Average other funding cost 6.45% 6.68% 5.94% 3.44% 3.53% 3.95% 4.61% 4.28% 4.42% 4.27% 3.67% 3.57% 3.05% 2.97% 2.96% 2.67% 2.26%
90 day BBSW 7.29% 7.81% 4.39% 3.25% 4.13% 4.89% 5.03% 4.99% 4.51% 3.49% 3.11% 2.79% 2.61% 2.69% 2.77% 2.14% 2.35%
Loan spread -0.08% -0.09% 3.26% 2.87% 1.72% 1.56% 1.78% 1.97% 2.19% 2.95% 2.84% 2.96% 2.81% 2.57% 2.35% 2.73% 2.25%
Deposit spread 2.49% 2.35% -1.03% -0.52% 0.65% 0.67% 0.62% 0.41% 0.16% -0.60% -0.45% -0.52% -0.35% -0.05% 0.12% -0.23% 0.25%
Other funding spread 0.84% 1.13% -1.55% -0.19% 0.60% 0.94% 0.42% 0.71% 0.09% -0.78% -0.56% -0.79% -0.45% -0.28% -0.19% -0.53% 0.09%
Net spread 3.25% 3.39% 0.68% 2.16% 2.97% 3.17% 2.81% 3.09% 2.44% 1.57% 1.83% 1.66% 2.02% 2.24% 2.28% 1.97% 2.59%
Geographic spread 1.86% 1.72% 1.79% 2.04% 2.08% 1.99% 1.90% 1.99% 1.89% 1.81% 1.84% 1.98% 2.03% 2.05% 2.04% 2.03% 2.04%
Geographic NIM 2.13% 1.99% 2.06% 2.21% 2.29% 2.18% 2.19% 2.31% 2.17% 2.10% 2.11% 2.20% 2.18% 2.19% 2.17% 2.10% 2.15%
Page 3
Page 3
Commonwealth Bank (CBA) 10 February 2016
Other banking income increased by 4% on a pcp basis to $2.5bn (unchanged hoh). While
commissions and lending fees were up strongly (pcp and hoh) and in line with volume
growth, these were offset by lower trading income (lower treasury earnings and
unfavourable derivative valuation adjustments on a pcp and hoh basis, and lower asset
sales and a loss on New Zealand earnings hedge on a hoh basis). Offsetting the latter and
lower investment experience (impacted by market volatility) were strong performances in
funds management (higher net FUA and FUM) and insurance income (new volumes,
repricing and lower claims and lapse experience).
Operating expenses increased by 6% on a pcp basis to $5.2bn (+3% hoh), driven by
inflation-related SAW increases (+6% pcp and hoh) including the impact of a weaker A$,
higher occupancy and equipment expenses (+4% pcp, +2% hoh) due to rental reviews and
a weaker A$, and higher IT expenses (+20% pcp, +13% hoh) largely related to risk and
compliance projects. These were offset by lower general costs (-2% pcp, -14% hoh)
reflecting lower professional fees and non-lending losses.
The cost-to-income ratio was unchanged at 42% on a pcp basis (1.1% improvement on a
hoh basis) while the banking component improved from 39.3% in 1H15 to 39.0% in 2H15
and 38.6% in 1H16. Efficiency gains at Group level are also reflected in costs as a
percentage of average assets (1.20% in 1H15, 1.18% in 2H15 and 1.17% in 1H16).
At least the market cannot blame CBA for relying on a lower BDD charge this time around
to boost the bottom line. The BDD charge increased by 28% on a pcp basis to $564m
(+3% hoh) reflecting higher Retail Banking Services arrears (WA and QLD mining towns
and personal lending), higher volume-driven collective charges in Business and Private
Banking, higher individual provisions in Institutional Banking and Markets and higher
commercial lending provisions in International.
The overall BDD charge was however largely unchanged at 17bp of GLA, confirming our
views that any increase towards the through-the-cycle charge of 20-30bp would be gradual
and thus manageable. Gross impaired assets were unchanged at $2.8bn since 30 June
while total provisions in relation to impaired assets and GLA were unchanged at around
37% and 0.55% respectively. Overlays are unchanged and CBA’s overall credit quality
remains in good order.
Figure 1 – Credit quality sound
SOURCE: COMPANY DATA
Page 4
Page 4
Commonwealth Bank (CBA) 10 February 2016
We expected a higher dividend and this was also a function of our higher EPS estimate. In
the end, CBA maintained its 198cps interim dividend (on a pcp basis, despite the dilution
impact from its August capital raising) and maintained its target dividend payout ratio of
around 70% in the first half and around 80% in the second half (around 75% on a full year
basis). Organic capital generation remains strong – excluding higher APRA credit RWA
requirements covered by the capital raising, net organic capital generation in 1H16 was
+17bp. APRA CET1 capital ratio of 10.2% translates into 14.3% on a harmonised basis,
and this ranks CBA at third place among its global peers.
Figure 2 – Ahead of the pack
SOURCE: COMPANY DATA
Funding capability continues to be strong with deposit funding improving to 64% of total
funding (2015 63%) and incremental lending ($30bn) again largely funded by incremental
deposits ($22bn) in 1H16. The average wholesale funding tenor has been maintained at
3.9 years while liquidity coverage further improved to 123% of total net cash outflows
(120% in 2H15, 116% in 1H15).
Figure 3 – Strong prudentials
SOURCE: COMPANY DATA
Page 5
Page 5
Commonwealth Bank (CBA) 10 February 2016
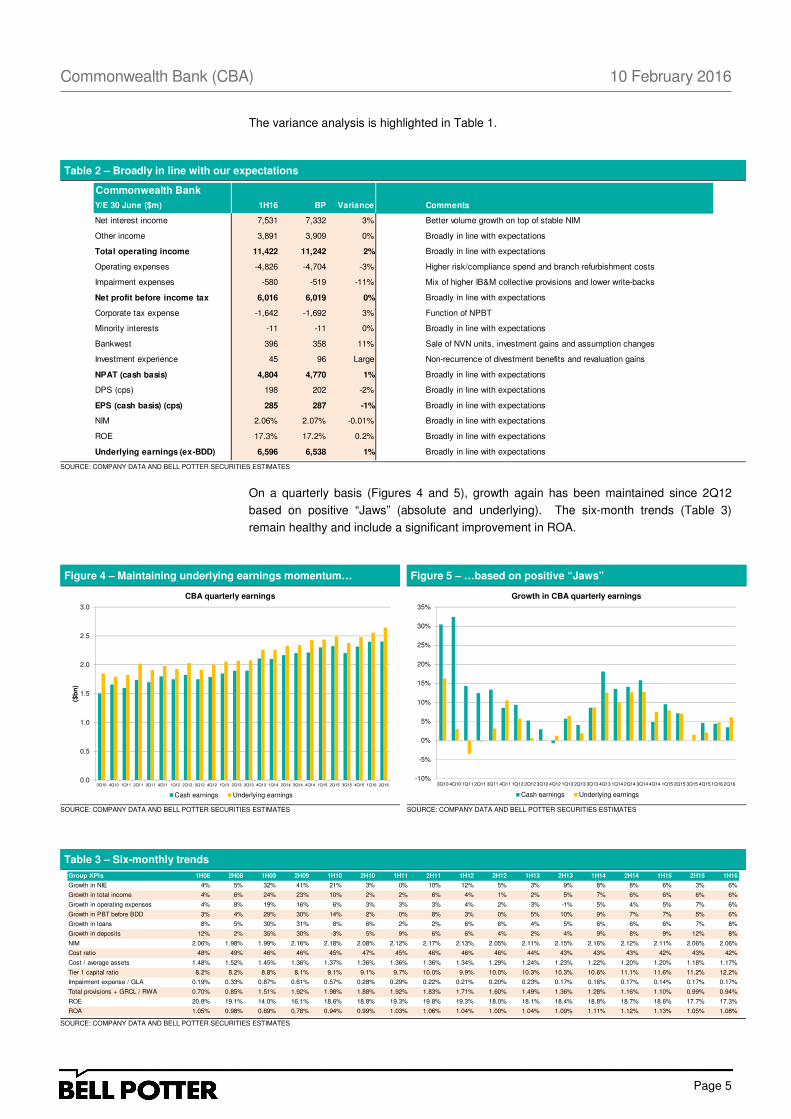
The variance analysis is highlighted in Table 1.
Table 2 – Broadly in line with our expectations
SOURCE: COMPANY DATA AND BELL POTTER SECURITIES ESTIMATES
On a quarterly basis (Figures 4 and 5), growth again has been maintained since 2Q12
based on positive “Jaws” (absolute and underlying). The six-month trends (Table 3)
remain healthy and include a significant improvement in ROA.
Figure 4 – Maintaining underlying earnings momentum… Figure 5 – …based on positive “Jaws”
SOURCE: COMPANY DATA AND BELL POTTER SECURITIES ESTIMATES SOURCE: COMPANY DATA AND BELL POTTER SECURITIES ESTIMATES
Table 3 – Six-monthly trends
SOURCE: COMPANY DATA AND BELL POTTER SECURITIES ESTIMATES
Commonwealth Bank
Y/E 30 June ($m) 1H16 BP Variance Comments
Net interest income 7,531 7,332 3% Better volume growth on top of stable NIM
Other income 3,891 3,909 0% Broadly in line with expectations
Total operating income 11,422 11,242 2% Broadly in line with expectations
Operating expenses -4,826 -4,704 -3% Higher risk/compliance spend and branch refurbishment costs
Impairment expenses -580 -519 -11% Mix of higher IB&M collective provisions and lower write-backs
Net profit before income tax 6,016 6,019 0% Broadly in line with expectations
Corporate tax expense -1,642 -1,692 3% Function of NPBT
Minority interests -11 -11 0% Broadly in line with expectations
Bankwest 396 358 11% Sale of NVN units, investment gains and assumption changes
Investment experience 45 96 Large Non-recurrence of divestment benefits and revaluation gains
NPAT (cash basis) 4,804 4,770 1% Broadly in line with expectations
DPS (cps) 198 202 -2% Broadly in line with expectations
EPS (cash basis) (cps) 285 287 -1% Broadly in line with expectations
NIM 2.06% 2.07% -0.01% Broadly in line with expectations
ROE 17.3% 17.2% 0.2% Broadly in line with expectations
Underlying earnings (ex-BDD) 6,596 6,538 1% Broadly in line with expectations
0.0
0.5
1.0
1.5
2.0
2.5
3.0
3Q10 4Q10 1Q11 2Q11 3Q11 4Q11 1Q12 2Q12 3Q12 4Q12 1Q13 2Q13 3Q13 4Q13 1Q14 2Q14 3Q14 4Q14 1Q15 2Q15 3Q15 4Q15 1Q16 2Q16
($b
n)
CBA quarterly earnings
Cash earnings Underlying earnings
-10%
-5%
0%
5%
10%
15%
20%
25%
30%
35%
3Q10 4Q10 1Q11 2Q11 3Q11 4Q11 1Q12 2Q12 3Q12 4Q12 1Q13 2Q13 3Q13 4Q13 1Q14 2Q14 3Q14 4Q14 1Q15 2Q15 3Q15 4Q15 1Q16 2Q16
Growth in CBA quarterly earnings
Cash earnings Underlying earnings
Group KPIs 1H08 2H08 1H09 2H09 1H10 2H10 1H11 2H11 1H12 2H12 1H13 2H13 1H14 2H14 1H15 2H15 1H16
Growth in NIE 4% 5% 32% 41% 21% 3% 0% 10% 12% 5% 3% 9% 8% 8% 6% 3% 6%
Growth in total income 4% 6% 24% 23% 10% 2% 2% 6% 4% 1% 2% 5% 7% 6% 6% 6% 6%
Growth in operating expenses 4% 8% 19% 16% 6% 3% 3% 3% 4% 2% -3% -1% 5% 4% 5% 7% 6%
Growth in PBT before BDD 3% 4% 29% 30% 14% 2% 0% 8% 3% 0% 5% 10% 9% 7% 7% 5% 6%
Growth in loans 8% 5% 30% 31% 8% 6% 2% 2% 6% 6% 4% 5% 6% 6% 6% 7% 8%
Growth in deposits 12% 2% 35% 30% -3% 5% 9% 6% 6% 4% 2% 4% 9% 8% 9% 12% 8%
NIM 2.06% 1.98% 1.99% 2.16% 2.18% 2.08% 2.12% 2.17% 2.13% 2.05% 2.11% 2.15% 2.16% 2.12% 2.11% 2.06% 2.06%
Cost ratio 48% 49% 46% 46% 45% 47% 45% 46% 46% 46% 44% 43% 43% 43% 42% 43% 42%
Cost / average assets 1.48% 1.52% 1.45% 1.36% 1.37% 1.36% 1.36% 1.36% 1.34% 1.29% 1.24% 1.23% 1.22% 1.20% 1.20% 1.18% 1.17%
Tier 1 capital ratio 8.2% 8.2% 8.8% 8.1% 9.1% 9.1% 9.7% 10.0% 9.9% 10.0% 10.3% 10.3% 10.6% 11.1% 11.6% 11.2% 12.2%
Impairment expense / GLA 0.19% 0.33% 0.87% 0.61% 0.57% 0.28% 0.29% 0.22% 0.21% 0.20% 0.23% 0.17% 0.16% 0.17% 0.14% 0.17% 0.17%
Total provisions + GRCL / RWA 0.70% 0.85% 1.51% 1.92% 1.98% 1.88% 1.92% 1.83% 1.71% 1.60% 1.49% 1.36% 1.28% 1.16% 1.10% 0.99% 0.94%
ROE 20.8% 19.1% 14.0% 16.1% 18.6% 18.8% 19.3% 19.8% 19.3% 18.0% 18.1% 18.4% 18.8% 18.7% 18.6% 17.7% 17.3%
ROA 1.05% 0.98% 0.69% 0.78% 0.94% 0.99% 1.03% 1.06% 1.04% 1.00% 1.04% 1.09% 1.11% 1.12% 1.13% 1.05% 1.08%
Page 6
Page 6
Commonwealth Bank (CBA) 10 February 2016
Key segment comments
Retail Banking Services (RBS) (positive outcome) – RBS remains a key value driver for
CBA. Cash NPAT increased by 8% on a pcp basis to $2,215m (+14% hoh) based on
strong revenue growth (+7% pcp, +8% hoh) including better NIM (estimated at +3bp pcp,
+12bp hoh), better other income, cost discipline (+4% pcp, +2% hoh) including flat costs as
a percentage of footings and positive “Jaws” throughout, and a lower BDD charge.
Table 4 – Six-monthly trends
SOURCE: COMPANY DATA AND BELL POTTER SECURITIES ESTIMATES
Business and Private Banking (B&PB) (positive outcome) – This is another key value
driver for CBA. Cash NPAT increased by 5% on a pcp basis to $803m (+10% hoh) based
on strong revenue growth (5-6% growth pcp and hoh) and cost discipline (3-4% growth pcp
and hoh). Credit quality was stable and estimated NIM improved by 3bp on a pcp basis
and by 8bp on a hoh basis.
Institutional Banking and Markets (IB&M) (neutral outcome) – The market’s worst fears
were unrealised with cash NPAT just down slightly to $608m (-6% pcp, -4% hoh) due to
higher BDD charges (mix of higher individual and collective provisions net of recoveries
and lower write-backs) and unfavourable derivative value adjustments offsetting positive
markets sales flows and trading income.
Table 5 – Six-monthly trends
SOURCE: COMPANY DATA AND BELL POTTER SECURITIES ESTIMATES
Wealth Management (positive outcome) – Cash NPAT was 7% higher on a pcp basis to
$372m (+22% hoh). A better insurance outcome (better volumes, repricing, lower lapses
and lower claims) and a turnaround in platform contributions more than offset subdued
results in funds management (spot AUM 2% higher on a pcp basis or -3% hoh to $195bn
but overall result impacted by investment market volatility).
Table 6 – Six-monthly trends
SOURCE: COMPANY DATA AND BELL POTTER SECURITIES ESTIMATES
RBS 1H08 2H08 1H09 2H09 1H10 2H10 1H11 2H11 1H12 2H12 1H13 2H13 1H14 2H14 1H15 2H15 1H16
Market share
- Home loans 9.8% 10.1% 10.5% 11.8% 12.6% 12.8% 12.9% 12.9% 11.2% 11.1% 11.1% 11.4% 11.9% 11.9% 11.9% 12.0% 12.1%
- Consumer loans 0.6% 0.6% 0.6% 0.6% 0.7% 0.7% 0.7% 0.7% 0.7% 0.8% 0.8% 0.8% 0.7% 0.7% 0.7% 0.7% 0.7%
- Deposits 11.2% 11.3% 11.9% 11.5% 12.0% 12.2% 12.1% 12.1% 11.1% 11.0% 11.3% 11.2% 12.0% 11.8% 12.0% 12.0% 12.1%
NIM n/a 2.28% 2.35% 2.23% 2.35% 2.17% 2.25% 2.37% 2.46% 2.38% 2.51% 2.53% 2.59% 2.60% 2.68% 2.59% 2.71%
Other income / footings 0.22% 0.22% 0.22% 0.21% 0.17% 0.16% 0.16% 0.15% 0.18% 0.17% 0.17% 0.17% 0.18% 0.17% 0.17% 0.16% 0.17%
Operating expense / footings 0.43% 0.42% 0.39% 0.38% 0.35% 0.34% 0.33% 0.34% 0.37% 0.35% 0.35% 0.34% 0.34% 0.32% 0.32% 0.31% 0.31%
Cost ratio 45% 47% 42% 43% 39% 40% 39% 39% 40% 40% 38% 37% 36% 34% 34% 35% 33%
Impairment expense / loans 0.08% 0.10% 0.11% 0.19% 0.15% 0.13% 0.09% 0.11% 0.14% 0.09% 0.10% 0.11% 0.11% 0.10% 0.09% 0.12% 0.10%
Effective tax rate 30% 30% 30% 29% 31% 29% 30% 29% 29% 30% 30% 30% 30% 30% 30% 30% 30%
B&PB / IB&M 1H08 2H08 1H09 2H09 1H10 2H10 1H11 2H11 1H12 2H12 1H13 2H13 1H14 2H14 1H15 2H15 1H16
Market share
- Loans 6.7% 6.5% 7.0% 6.6% 6.4% 6.3% 6.0% 6.0% 8.2% 8.2% 8.1% 8.3% 8.0% 8.0% 8.0% 8.2% 8.2%
- Other IEA 1.2% 1.0% 1.5% 1.7% 1.5% 1.5% 1.8% 1.6% 1.7% 1.6% 1.6% 1.6% 2.2% 1.9% 1.0% 1.2% 1.2%
- IBL 12.5% 11.8% 12.2% 10.3% 9.8% 10.0% 9.8% 10.0% 12.1% 11.7% 11.3% 11.3% 11.2% 10.9% 9.3% 10.2% 10.2%
NIM n/a 1.65% 1.91% 1.92% 1.93% 1.93% 1.95% 1.92% 2.15% 2.17% 2.07% 2.05% 1.92% 1.82% 2.11% 2.03% 1.98%
Other income / footings 0.34% 0.37% 0.33% 0.36% 0.48% 0.43% 0.44% 0.43% 0.24% 0.22% 0.27% 0.26% 0.26% 0.24% 0.27% 0.24% 0.23%
Operating expense / footings 0.32% 0.35% 0.31% 0.35% 0.38% 0.39% 0.37% 0.38% 0.29% 0.28% 0.29% 0.29% 0.27% 0.28% 0.29% 0.28% 0.28%
Cost ratio 43% 44% 39% 39% 37% 41% 39% 40% 35% 36% 35% 36% 36% 38% 36% 38% 38%
Impairment expense / AIEA 0.12% 0.18% 0.82% 0.44% 0.34% 0.04% 0.21% 0.17% 0.08% 0.12% 0.12% 0.09% 0.04% 0.09% 0.08% 0.07% 0.09%
Effective tax rate 26% 18% -12% 19% 22% 28% 27% 26% 27% 26% 27% 27% 27% 28% 28% 26% 26%
Wealth 1H08 2H08 1H09 2H09 1H10 2H10 1H11 2H11 1H12 2H12 1H13 2H13 1H14 2H14 1H15 2H15 1H16
Growth in FUA 24% 10% -21% -9% 18% 6% 3% 5% -4% 2% 19% 25% 12% 5% 30% 32% 3%
Funds management return 0.63% 0.59% 0.57% 0.47% 0.51% 0.50% 0.53% 0.52% 0.51% 0.50% 0.41% 0.39% 0.35% 0.34% 0.32% 0.28% 0.29%
Growth in insurance income 0% 0% 26% 11% 8% 1% -4% -14% 7% 15% -24% -19% 1% 11% -2% -22% 20%
Volume expenses / TOI 18% 18% 19% 21% 20% 20% 19% 21% 22% 20% 22% 23% 23% 24% 23% 29% 23%
Growth in operating expenses 0% 0% 5% -5% -1% 2% 3% 9% 10% 4% -27% -29% -2% 3% 5% 21% 5%
Effective tax rate 28% 26% 27% 31% 28% 24% 27% 27% 26% 27% 27% 26% 23% 25% 26% 20% 28%
Page 7
Page 7
Commonwealth Bank (CBA) 10 February 2016
New Zealand (positive outcome) – Cash NPAT in NZ$ terms was 4% higher on a pcp
basis to NZ$515m (+7% hoh), driven by strong revenue growth across banking, funds
management and insurance, effective cost management and a better BDD outcome more
than offsetting some NIM softness.
Table 7 – Six-monthly trends
SOURCE: COMPANY DATA AND BELL POTTER SECURITIES ESTIMATES
Bankwest (neutral outcome) – Cash NPAT was flat on a pcp basis at $396m (-1% hoh)
with top line growth impacted by lower volumes from a slowing WA economy and price
competition. The positives relate to cost discipline (flat operating expenses) and a lower
BDD charge given ongoing net write-back.
Table 8 – Six-monthly trends
SOURCE: COMPANY DATA AND BELL POTTER SECURITIES ESTIMATES
Price target $83.50, Buy rating maintained
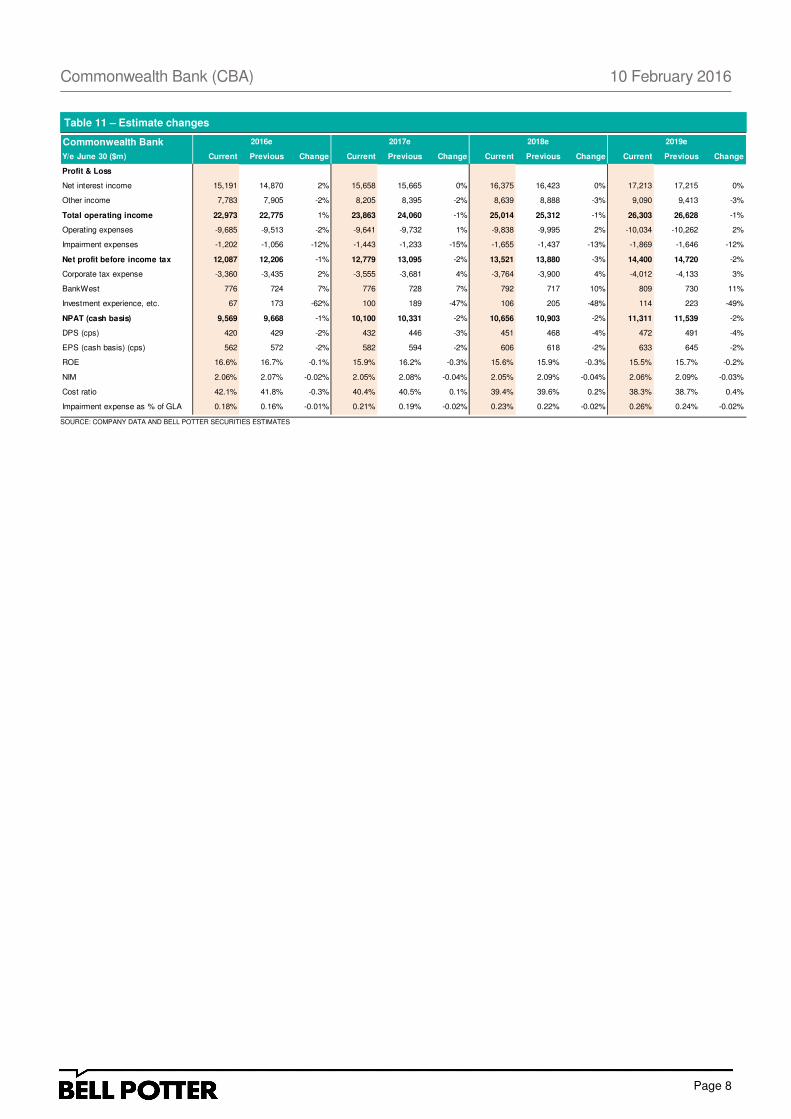
Our estimate changes (Table 11, next page) reflect lower other income and higher BDD
net of lower operating expenses. The net result is a slight decrease to cash NPAT and
cash EPS across the forecast horizon of 2%. Consistent with lower EPS expectations, we
have also trimmed the dividend estimates and the price target is slightly lowered to $83.50
(previously $85.50). Today’s results highlight CBA’s resilience and the availability of
multiple value levers to pull in a challenging market – Buy rating maintained.
Table 9 – Composite valuation Table 10 – SOP valuation
SOURCE: COMPANY DATA AND BELL POTTER SECURITIES ESTIMATES SOURCE: COMPANY DATA AND BELL POTTER SECURITIES ESTIMATES
New Zealand 1H08 2H08 1H09 2H09 1H10 2H10 1H11 2H11 1H12 2H12 1H13 2H13 1H14 2H14 1H15 2H15 1H16
NIM - - - - 2.80% 1.50% 1.77% 1.83% 2.08% 2.12% 2.17% 2.16% 2.29% 2.32% 2.43% 2.30% 2.25%
Other income / footings - - - - 0.16% 0.10% 0.14% 0.15% 0.12% 0.12% 0.14% 0.13% 0.13% 0.12% 0.13% 0.13% 0.15%
Operating expense / footings - - - - 0.34% 0.37% 0.39% 0.41% 0.38% 0.41% 0.35% 0.36% 0.36% 0.36% 0.36% 0.35% 0.34%
Cost ratio - - - - 52% 56% 52% 53% 47% 49% 43% 44% 43% 42% 40% 40% 39%
Impairment expense / AIEA - - - - 0.20% 0.00% 0.06% 0.06% 0.02% 0.05% 0.04% 0.04% 0.03% 0.05% 0.05% 0.07% 0.05%
Effective tax rate - - - - 21% 20% 23% 24% 24% 25% 24% 25% 25% 24% 25% 25% 27%
Bankwest 1H08 2H08 1H09 2H09 1H10 2H10 1H11 2H11 1H12 2H12 1H13 2H13 1H14 2H14 1H15 2H15 1H16
Market share
- Home loans - - 1.8% 1.8% 2.0% 2.1% 2.2% 2.3% 2.4% 2.4% 2.4% 2.4% 2.5% 2.6% 2.5% 2.6% 2.5%
- Consumer loans - - 1.3% 1.4% 1.4% 1.3% 1.2% 1.1% 1.1% 1.1% 1.0% 0.9% 0.9% 0.8% 0.8% 0.7% 0.7%
- Deposits - - 5.4% 5.3% 5.5% 5.5% 5.2% 5.1% 3.2% 3.1% 2.7% 2.6% 2.6% 2.7% 2.6% 2.7% 2.6%
NIM - - 1.81% 1.97% 2.07% 2.04% 2.02% 2.19% 2.17% 1.97% 2.07% 2.13% 2.18% 2.05% 2.16% 2.11% 2.10%
Other income / footings - - 0.07% 0.14% 0.09% 0.08% 0.09% 0.07% 0.09% 0.08% 0.10% 0.09% 0.09% 0.09% 0.09% 0.08% 0.08%
Operating expense / footings - - 0.36% 0.39% 0.34% 0.32% 0.32% 0.32% 0.37% 0.35% 0.36% 0.36% 0.35% 0.33% 0.32% 0.30% 0.30%
Cost ratio - - 69% 64% 57% 55% 54% 52% 50% 52% 48% 47% 45% 46% 42% 42% 41%
Impairment expense / loans - - 0.59% 0.18% 0.48% 0.65% 0.07% 0.09% 0.05% 0.03% 0.12% 0.04% 0.01% 0.01% -0.03% -0.03% -0.02%
Effective tax rate - - 30% 31% 32% 31% 30% 30% 30% 30% 30% 30% 30% 31% 30% 30% 30%
Composite Valuation Value ($m) Per share Weighting
Composite
value per
share
DCF 154,745 $90.62 40% $36.25
Dividend yield (sustainable) 134,120 $78.55 40% $31.42
ROE (sustainable) 133,600 $78.24 10% $7.82
Sum-of-Parts 137,411 $80.47 10% $8.05
Total $83.54
Sum-of-Parts (As Is)2017e
NPAT
Pros. PE
(times)Value ($m) Per share
Retail Banking 4,667 13.5 63,009 $36.90
B&PB / IB&M 3,025 13.5 40,841 $23.92
Wealth Management 774 15.0 11,605 $6.80
New Zealand 1,025 14.0 14,357 $8.41
BankWest & Other 608 12.5 7,600 $4.45
Total 10,100 13.6 137,411 $80.47
Page 8
Page 8
Commonwealth Bank (CBA) 10 February 2016
Table 11 – Estimate changes
SOURCE: COMPANY DATA AND BELL POTTER SECURITIES ESTIMATES
Commonwealth Bank 2016e 2017e 2018e 2019e
Y/e June 30 ($m) Current Previous Change Current Previous Change Current Previous Change Current Previous Change
Profit & Loss
Net interest income 15,191 14,870 2% 15,658 15,665 0% 16,375 16,423 0% 17,213 17,215 0%
Other income 7,783 7,905 -2% 8,205 8,395 -2% 8,639 8,888 -3% 9,090 9,413 -3%
Total operating income 22,973 22,775 1% 23,863 24,060 -1% 25,014 25,312 -1% 26,303 26,628 -1%
Operating expenses -9,685 -9,513 -2% -9,641 -9,732 1% -9,838 -9,995 2% -10,034 -10,262 2%
Impairment expenses -1,202 -1,056 -12% -1,443 -1,233 -15% -1,655 -1,437 -13% -1,869 -1,646 -12%
Net profit before income tax 12,087 12,206 -1% 12,779 13,095 -2% 13,521 13,880 -3% 14,400 14,720 -2%
Corporate tax expense -3,360 -3,435 2% -3,555 -3,681 4% -3,764 -3,900 4% -4,012 -4,133 3%
BankWest 776 724 7% 776 728 7% 792 717 10% 809 730 11%
Investment experience, etc. 67 173 -62% 100 189 -47% 106 205 -48% 114 223 -49%
NPAT (cash basis) 9,569 9,668 -1% 10,100 10,331 -2% 10,656 10,903 -2% 11,311 11,539 -2%
DPS (cps) 420 429 -2% 432 446 -3% 451 468 -4% 472 491 -4%
EPS (cash basis) (cps) 562 572 -2% 582 594 -2% 606 618 -2% 633 645 -2%
ROE 16.6% 16.7% -0.1% 15.9% 16.2% -0.3% 15.6% 15.9% -0.3% 15.5% 15.7% -0.2%
NIM 2.06% 2.07% -0.02% 2.05% 2.08% -0.04% 2.05% 2.09% -0.04% 2.06% 2.09% -0.03%
Cost ratio 42.1% 41.8% -0.3% 40.4% 40.5% 0.1% 39.4% 39.6% 0.2% 38.3% 38.7% 0.4%
Impairment expense as % of GLA 0.18% 0.16% -0.01% 0.21% 0.19% -0.02% 0.23% 0.22% -0.02% 0.26% 0.24% -0.02%
Page 9
Page 9
Commonwealth Bank (CBA) 10 February 2016
CBA Profile
Company description
CBA is Australia’s leading integrated financial services organisation, providing banking and
wealth management (funds management, superannuation, insurance and investment
advice) products and services to over 10m customers. It currently occupies pole positions
in home lending and retail deposits. The bank’s strategic strengths of scale, brand and
diversified mix is supported by an irreplaceable infrastructure consisting of 1,150+
branches, 3,800 Australia Post agencies, 3,300 ATMs and 155,000 merchant relationships.
Investment strategy
CBA’s strategy is built upon continuous service and sales improvement backed by IT and
operational excellence, and a leadership position in retail banking. Incremental value add
is expected to come from opportunities in the SME banking, ECM / DCM and wealth
management space (particularly in advice, private banking and life risk where the market is
80% underinsured) and selective Asian expansion (East Asia, Indonesia and Singapore).
Valuation
The price target is roughly based on a composite valuation weighted as follows. In CBA’s
case, this is more closely aligned to the DCF and sustainable dividend yield play values as
earnings continue to normalise post the GFC and capital raising. The bank is viewed as a
consistent yield story.
Table 12 – Composite valuation Table 13 – SOP valuation
SOURCE: COMPANY DATA AND BELL POTTER SECURITIES ESTIMATES SOURCE: COMPANY DATA AND BELL POTTER SECURITIES ESTIMATES
SWOT analysis
Strengths
1. Retail banking (sales and service) and wealth management expertise;
2. Strong management and execution capabilities;
3. Low risk banking assets;
4. Scale in all aspects of diversified financial services and IT capabilities; and
5. Access to high level government and regulatory contacts in China, opening doors to
further expansion opportunities.
Composite Valuation Value ($m) Per share Weighting
Composite
value per
share
DCF 154,745 $90.62 40% $36.25
Dividend yield (sustainable) 134,120 $78.55 40% $31.42
ROE (sustainable) 133,600 $78.24 10% $7.82
Sum-of-Parts 137,411 $80.47 10% $8.05
Total $83.54
Sum-of-Parts (As Is)2017e
NPAT
Pros. PE
(times)Value ($m) Per share
Retail Banking 4,667 13.5 63,009 $36.90
B&PB / IB&M 3,025 13.5 40,841 $23.92
Wealth Management 774 15.0 11,605 $6.80
New Zealand 1,025 14.0 14,357 $8.41
BankWest & Other 608 12.5 7,600 $4.45
Total 10,100 13.6 137,411 $80.47
Page 10
Page 10
Commonwealth Bank (CBA) 10 February 2016
Weaknesses
1. Ongoing liquidity drag that is a systemic issue.
Opportunities
1. Rationalising BankWest;
2. Value add from ECM / DCM opportunities in capitalising on the bank’s AA- rating and
balance sheet strength;
3. Leveraged to an underinsured Australian life risk and GI market;
4. Offshore banking and wealth opportunities, e.g. Europe and US; and
5. Leveraged to wealth management and strength of NSW economy.
Threats
1. Macroeconomic factors such as higher unemployment and slowing credit growth;
2. Changes in regulatory environment, especially the potential capping of fees that
would crimp earnings growth;
3. Disruptors;
4. Negative fallout from financial planning review;
5. Bank re-regulation; and
6. Some sovereign risk – exposed to sometimes unstable governments in Asia.
Sensitivities
Table 14 – Sensitivities
SOURCE: COMPANY DATA AND BELL POTTER SECURITIES ESTIMATES
Y/e June 30 2016e 2017e 2018e 2019e 2020e 2021e 2022e 2023e 2024e
Sensitivities
Group NIM +10bp 517 536 560 585 612 640 669 701 733
- NPAT upside (cash basis) 5.4% 5.3% 5.3% 5.2% 5.1% 5.1% 5.1% 5.1% 5.1%
- Price target upside $4.46 $4.38 $4.33 $4.27 $4.22 $4.20 $4.21 $4.20 $4.19
Group Loans +1% 71 75 79 84 89 93 97 101 106
- NPAT upside (cash basis) 0.7% 0.7% 0.7% 0.7% 0.7% 0.7% 0.7% 0.7% 0.7%
- Price target upside $0.61 $0.62 $0.61 $0.61 $0.61 $0.61 $0.61 $0.61 $0.61
RBS loans +1% 45 47 49 52 56 58 61 65 68
- NPAT upside (cash basis) 0.5% 0.5% 0.5% 0.5% 0.5% 0.5% 0.5% 0.5% 0.5%
- Price target upside $0.39 $0.38 $0.38 $0.38 $0.38 $0.38 $0.39 $0.39 $0.39
B&PB/IB&M loans +1% 29 30 32 34 36 37 39 40 42
- NPAT upside (cash basis) 0.3% 0.3% 0.3% 0.3% 0.3% 0.3% 0.3% 0.3% 0.3%
- Price target upside $0.25 $0.25 $0.25 $0.25 $0.25 $0.24 $0.24 $0.24 $0.24
NZ loans +1% 9 10 11 12 12 13 13 14 15
- NPAT upside (cash basis) 0.1% 0.1% 0.1% 0.1% 0.1% 0.1% 0.1% 0.1% 0.1%
- Price target upside $0.08 $0.08 $0.08 $0.08 $0.08 $0.08 $0.08 $0.08 $0.08
Other income +1% 54 57 60 64 67 70 74 78 82
- NPAT upside (cash basis) 0.6% 0.6% 0.6% 0.6% 0.6% 0.6% 0.6% 0.6% 0.6%
- Price target upside $0.47 $0.47 $0.47 $0.46 $0.46 $0.46 $0.47 $0.47 $0.47
BDD +1% -8 -10 -12 -13 -14 -15 -17 -18 -19
- NPAT upside (cash basis) -0.1% -0.1% -0.1% -0.1% -0.1% -0.1% -0.1% -0.1% -0.1%
- Price target upside -$0.07 -$0.08 -$0.09 -$0.10 -$0.10 -$0.10 -$0.10 -$0.11 -$0.11
Costs +1% -68 -67 -69 -70 -73 -76 -80 -84 -88
- NPAT upside (cash basis) -0.7% -0.7% -0.6% -0.6% -0.6% -0.6% -0.6% -0.6% -0.6%
- Price target upside -$0.58 -$0.55 -$0.53 -$0.51 -$0.50 -$0.50 -$0.50 -$0.50 -$0.50
Page 11
Page 11
Commonwealth Bank (CBA) 10 February 2016
Commonwealth Bank as at 10 February 2016
Recommendation Buy
Price $74.20
Target (12 months) $83.50
Table 15 – Financial summary
SOURCE: BELL POTTER SECURITIES ESTIMATES
Commonwealth Bank of Australia Share Price (A$) 74.20As at 10-Feb-16 Market Cap (A$M) 126,700
PROFIT AND LOSS VALUATION DATA
Y/e June 30 ($m) 2014 2015 2016e 2017e 2018e Y/e June 30 2014 2015 2016e 2017e 2018eNet interest income 13,514 14,107 15,191 15,658 16,375 NPAT (cash basis) ($m) 8,680 9,137 9,569 10,100 10,656
Other banking income 4,117 4,657 4,808 5,071 5,348 EPS (statutory basis) (cps) 534 557 561 581 604
Total banking income 17,631 18,764 19,998 20,730 21,723 - Growth 13% 4% 1% 4% 4%
Funds management income 1,796 1,938 2,083 2,182 2,290 EPS (cash basis) (cps) 536 561 562 582 606
Insurance income 819 792 892 951 1,001 - Growth 11% 5% 0% 4% 4%
Total operating income 20,246 21,494 22,973 23,863 25,014 P / E ratio (times) 13.8 13.2 13.2 12.7 12.3
Operating expenses -8,622 -9,206 -9,685 -9,641 -9,838 P / Book ratio (times) 2.6 2.4 2.0 1.9 1.8
Impairment expenses -942 -1,038 -1,202 -1,443 -1,655 P / NTA ratio (times) 3.2 2.9 2.4 2.2 2.1
Net profit before income tax 10,682 11,250 12,087 12,779 13,521 Net DPS (cps) 401 420 420 432 451
Corporate tax expense -2,902 -3,038 -3,360 -3,555 -3,764 Yield 5.4% 5.7% 5.7% 5.8% 6.1%
Minority interests -19 -21 -22 -22 -22 Franking 100% 100% 100% 100% 100%
BankWest NPAT (cash basis) 675 795 776 776 792 Payout (cash basis) 75% 75% 75% 74% 74%
Investment experience 244 151 89 122 128
NPAT (cash basis) 8,680 9,137 9,569 10,100 10,656 CAPITAL ADEQUACYAdjustments -49 -74 -36 -36 -36 Y/e June 30 2014 2015 2016e 2017e 2018e
NPAT (statutory basis) 8,631 9,063 9,533 10,064 10,620 Risk weighted assets ($m) 337,715 368,721 434,049 482,893 509,948
Average risk weight 44% 44% 49% 52% 52%
CASHFLOW Tier 1 ratio 11.1% 11.2% 11.5% 11.3% 11.6%
Y/e June 30 ($m) 2014 2015 2016e 2017e 2018e Core Tier 1 ratio 9.3% 9.1% 9.7% 9.6% 10.0%
NPAT (cash basis) 8,680 9,137 9,569 10,100 10,656 Total capital ratio 12.0% 12.7% 13.2% 12.8% 13.0%
Equity ratio 6.2% 6.1% 6.7% 6.9% 7.0%
Increase in loans -35,157 -43,951 -36,380 -34,359 -36,227
Increase in other assets 2,805 -31,137 -14,373 -14,723 -15,549 DIVISIONALCapital expenditure -98 -22 -533 -102 -105 Y/e June 30 ($m) 2014 2015 2016e 2017e 2018eInvesting cashflow -32,450 -75,110 -51,285 -49,184 -51,881 Retail Banking Services
Net interest income 7,307 7,848 8,568 8,841 9,240
Increase in deposits & borrowings 34,489 58,214 37,299 38,726 41,379 Other income 1,695 1,754 1,877 1,990 2,110
Increase in other liabilities -706 20,136 3,265 5,891 5,629 Total banking income 9,002 9,602 10,445 10,831 11,350
Equity raised 713 583 6,476 1,832 1,916 Operating expenses -3,173 -3,276 -3,420 -3,427 -3,508
Other -4,951 -6,253 -6,853 -7,365 -7,698 Impairment expenses -582 -626 -620 -743 -854
Financing cashflow 29,545 72,680 40,187 39,084 41,225 Net profit before tax 5,247 5,700 6,406 6,661 6,988
Corporate tax expense -1,569 -1,706 -1,917 -1,993 -2,091
Net change in cash 5,775 6,707 -1,529 0 0 Cash net profit after tax 3,678 3,994 4,489 4,667 4,897
Cash at end of period 26,409 33,116 31,587 31,587 31,587 Home loans 271,244 289,633 308,030 324,007 340,799
Consumer loans 16,387 16,897 17,900 19,234 20,652
BALANCE SHEET Deposits 196,162 213,827 231,310 247,502 264,827
Y/e June 30 ($m) 2014 2015 2016e 2017e 2018e Deposits non bearing interest 7,222 8,123 8,625 9,228 9,874
Cash and liquid assets 26,409 33,116 31,587 31,587 31,587
Divisional gross loans 598,117 641,811 678,712 713,717 750,485 B&PB / IB&M
Provisions -3,906 -3,649 -4,170 -4,816 -5,357 Net interest income 4,099 4,367 4,668 4,792 5,049
Divisional IEA 48,328 35,613 37,633 39,724 41,948 Other income 2,026 2,153 2,176 2,299 2,442
Other IEA & other loans 80,909 127,090 139,604 150,996 163,317 Total banking income 6,125 6,520 6,844 7,091 7,491
Intangibles 9,792 9,970 10,018 10,018 10,018 Operating expenses -2,281 -2,398 -2,493 -2,447 -2,494
PP&E 2,816 2,838 3,371 3,473 3,578 Impairment expenses -298 -319 -450 -545 -626
Insurance assets 15,142 14,088 15,497 16,737 17,741 Net profit before tax 3,546 3,803 3,901 4,099 4,371
Other assets 13,843 12,569 10,999 10,999 10,999 Corporate tax expense -973 -1,023 -1,022 -1,074 -1,145
Total assets 791,451 873,446 923,250 972,434 1,024,315 Cash net profit after tax 2,573 2,780 2,879 3,025 3,225
Loans 181,970 196,469 208,317 219,807 231,910
Divisional deposits & borrowings 483,820 542,034 579,332 618,058 659,438 Other IEA 43,524 28,981 30,430 31,799 33,230
Other borrowings 226,090 248,572 255,573 261,464 267,092 IBL 181,795 182,098 194,845 208,484 223,078
Other liabilities 32,193 29,847 26,112 26,112 26,112 Deposits non bearing interest 5,081 32,169 34,421 36,830 39,408
Total liabilities 742,103 820,453 861,017 905,634 952,642Wealth Management
Ordinary share capital 27,036 27,619 34,095 35,927 37,843 Funds management income 1,699 1,846 1,947 2,040 2,142
Other equity instruments 939 939 939 939 939 Insurance income 575 503 582 628 666
Reserves 2,009 2,345 2,554 2,554 2,554 Total operating income 2,274 2,349 2,529 2,668 2,808
Retained profits 18,827 21,528 24,091 26,826 29,784 Volume expenses -538 -610 -586 -560 -590
Minority interests 537 562 554 554 554 Operating expenses -984 -1,116 -1,158 -1,193 -1,229
Total shareholders' equity 49,348 52,993 62,233 66,800 71,673 Net profit before tax 752 623 785 915 990
Corporate tax expense -182 -148 -222 -259 -281
Total sh. equity & liabs. 791,451 873,446 923,250 972,434 1,024,315 Investment experience 118 178 83 118 125
Cash net profit after tax 688 653 645 774 834
WANOS - statutory (m) 1,608 1,618 1,691 1,725 1,750 FUA 253,483 334,071 347,434 364,806 383,046
WANOS - cash (m) 1,611 1,620 1,693 1,727 1,752New Zealand
PROFITABILITY RATIOS Net interest income 1,378 1,527 1,530 1,602 1,661
Y/e June 30 2014 2015 2016e 2017e 2018e Other income 192 286 371 398 413
Return on assets 1.1% 1.1% 1.0% 1.1% 1.1% Total banking income 1,570 1,813 1,901 2,000 2,074
Return on equity 18.7% 18.2% 16.6% 15.9% 15.6% Funds management income 60 71 79 86 92
Leverage ratio 4.8% 4.8% 5.5% 5.6% 5.8% Insurance income 202 232 250 263 275
Net interest margin 2.14% 2.09% 2.06% 2.05% 2.05% Total operating income 1,832 2,116 2,231 2,349 2,441
Cost / income ratio 43% 43% 42% 40% 39% Operating expenses -805 -861 -861 -848 -852
Cost / average assets 1.20% 1.16% 1.15% 1.09% 1.06% Impairment expenses -51 -83 -79 -101 -120
Growth in operating income 7% 6% 6% 4% 5% Net profit before tax 976 1,172 1,291 1,400 1,469
Growth in operating expenses 5% 6% 5% 0% 2% Corporate tax expense -237 -296 -349 -378 -397
Jaws 2% 0% 2% 4% 3% Minority interests 0 0 0 0 0
Investment experience 3 6 6 4 4
ASSET QUALITY Cash net profit after tax 742 882 948 1,025 1,076
Y/e June 30 2014 2015 2016e 2017e 2018e Loans 52,153 59,592 62,366 64,875 67,470
Impairment expense / GLA 0.16% 0.15% 0.18% 0.21% 0.23% Other IEA 4,804 6,632 7,203 7,925 8,717
Impairment expense / RWA 0.28% 0.27% 0.28% 0.31% 0.35% Deposits 34,454 42,492 44,050 46,263 48,576
Total provisions ($m) 3,906 3,649 4,170 4,816 5,357 Other IBL 14,514 13,883 13,706 13,709 13,709
Total provisions / RWA 1.16% 0.99% 0.96% 1.00% 1.05%
Indiv ass prov / gross imp assets 33% 31% 33% 33% 34%
IBL / IEA 98% 99% 98% 98% 97%
Total provisions + GRCL / RWA 1.16% 0.99% 0.96% 1.00% 1.05%
Page 12
Page 12
Commonwealth Bank (CBA) 10 February 2016
Bell Potter Securities Limited ACN 25 006 390 7721
Level 38, Aurora Place 88 Phillip Street, Sydney 2000
Telephone +61 2 9255 7200 www.bellpotter.com.au
Recommendation structure
Buy: Expect >15% total return on a
12 month view. For stocks regarded
as ‘Speculative’ a return of >30% is
expected.
Hold: Expect total return between -5%
and 15% on a 12 month view
Sell: Expect <-5% total return on a
12 month view
Speculative Investments are either start-up
enterprises with nil or only prospective
operations or recently commenced
operations with only forecast cash flows, or
companies that have commenced
operations or have been in operation for
some time but have only forecast cash
flows and/or a stressed balance sheet.
Such investments may carry an
exceptionally high level of capital risk and
volatility of returns.
Research Team
Staff Member
TS Lim
Industrials
Sam Haddad
John O’Shea
Chris Savage
Jonathan Snape
Sam Byrnes
John Hester
Tanushree Jain
Financials
TS Lim
Lafitani Sotiriou
Resources
Peter Arden
David Coates
Quantitative
Tim Piper
Hamish Murray
Title/Sector
Head of Research
Industrials
Industrials
Industrials
Industrials
Industrials
Healthcare
Healthcare/Biotech
Banks/Regionals
Diversified
Resources
Resources
Associate Analyst
Associate Analyst
Phone
612 8224 2810
612 8224 2819
613 9235 1633
612 8224 2835
613 9235 1601
612 8224 2886
612 8224 2871
612 8224 2849
612 8224 2810
613 9235 1668
613 9235 1833
612 8224 2887
612 8224 2825
613 9256 8761
@bellpotter.com.au
tslim
shaddad
joshea
csavage
jsnape
sbyrnes
jhester
tnjain
tslim
lsotiriou
parden
dcoates
tpiper
hmurray
The following may affect your legal rights. Important Disclaimer:
This document is a private communication to clients and is not intended for public circulation or for the use of any third party, without the prior approval of Bell Potter Securities Limited. In the USA and the UK this research is only for institutional investors. It is not for release, publication or distribution in whole or in part to any persons in the two specified countries. In Hong Kong this research is being distributed by Bell Potter Securities (HK) Limited which is licensed and regulated by the Securities and Futures Commission, Hong Kong. This is general investment advice only and does not constitute personal advice to any person. Because this document has been prepared without consideration of any specific client’s financial situation, particular needs and investment objectives (‘relevant personal circumstances’), a Bell Potter Securities Limited investment adviser (or the financial services licensee, or the representative of such licensee, who has provided you with this report by arraignment with Bell Potter Securities Limited) should be made aware of your relevant personal circumstances and consulted before any investment decision is made on the basis of this document.
While this document is based on information from sources which are considered reliable, Bell Potter Securities Limited has not verified independently the information contained in the document and Bell Potter Securities Limited and its directors, employees and consultants do not represent, warrant or guarantee, expressly or impliedly, that the information contained in this document is complete or accurate. Nor does Bell Potter Securities Limited accept any responsibility for updating any advice, views opinions, or recommendations contained in this document or for correcting any error or omission which may become apparent after the document has been issued.
Except insofar as liability under any statute cannot be excluded. Bell Potter Securities Limited and its directors, employees and consultants do not accept any liability (whether arising in contract, in tort or negligence or otherwise) for any error or omission in this document or for any resulting loss or damage (whether direct, indirect, consequential or otherwise) suffered by the recipient of this document or any other person.
Disclosure of interest:
Bell Potter Securities Limited, its employees, consultants and its associates within the meaning of Chapter 7 of the Corporations Law may receive commissions, underwriting and management fees from transactions involving securities referred to in this document (which its representatives may directly share) and may from time to time hold interests in the securities referred to in this document.
TS Lim owns 3,734 shares in CBA.
ANALYST CERTIFICATION Each research analyst primarily responsible for the content of this research report, in whole or in part, certifies that with respect to each security or issuer that the analyst covered in this report: (1) all of the views expressed accurately reflect his or her personal views about those securities or issuers and were prepared in an independent manner, including with respect to Bell Potter, and (2) no part of his or her compensation was, is, or will be, directly or indirectly, related to the specific recommendations or views expressed by that research analyst in the research report.