48
VOTE 3 ESTIMATES OF NATIONAL EXPENDITURE Photos provided by GCIS. COMMUNICATIONS

VOTE 3ESTIMATES OF NATIONAL EXPENDITURE
Photos provided by GCIS.
COMMUNICATIONS


Estimates of
National Expenditure
2015
National Treasury
Republic of South Africa
25 February 2015

ISBN: 978-0-621-43285-5 RP: 08/2015 The 2015 Estimates of National Expenditure e-publications are compiled with the latest available information from departmental and other sources. Some of this information is unaudited or subject to revision. The Estimates of National Expenditure e-publications for individual votes are available on www.treasury.gov.za. Compared to the abridged version of the 2015 ENE, the 2015 ENE e-publications provide more detailed information, including on goods and services, transfers and subsidies, as well as on programme specific personnel expenditure. The abridged version of the ENE contains one additional table at the end of a chapter that shows expenditure on infrastructure, whereas the vote ENE e-publications’ additional tables also contain summaries of expenditure on conditional allocations to provinces and municipalities; departmental public private partnerships; and donor funding. Budget information is also provided for the public entities that are not shown in detail in the abridged publication. In some e-publications more detailed information at the level of site service delivery is included.

Foreword
Some of the tough economic conditions occasioned by the 2008 to 2009 global financial crisis continue to plague most parts of the world: Economic growth remains sluggish, unemployment and inequality levels are elevated, while financial markets tend to reposition themselves substantially at the slightest sign of unsettling news. As an open economy, South Africa is highly susceptible to global economic developments, often disproportionately so. In the face of all of this, the 2015 Medium Term Expenditure Framework (MTEF) response provides for positive real growth in expenditure averaging 2.1 per cent per year. The annual budget reaches R1.6 trillion by 2017/18.
True to the commitment government made in the Medium Term Budget Policy Statement (MTBPS) in October 2014, the budget framework sets out departmental programmes and plans that fit within the broad expenditure envelope published last year. To keep our fiscal accounts firmly on a sustainable path, the MTBPS proposed a fiscal policy package that has trimmed overall spending by R25 billion, which is the combined amount for 2015/16 and 2016/17. Government spending does continue to surpass inflation after these adjustments in both years, but growth is marginally slower. In addition, for 2017/18, R45 billion is placed in an unallocated reserve to cushion our plans against unforeseeable eventualities. Further, to achieve our fiscal objectives, government has had to institute carefully selected tax measures too. These are implemented within the framework of a progressive tax system and have been informed by the work of the Davies Tax Committee. The tax proposals are set out in detail in chapter 4 of the Budget Review.
The process of realigning expenditure in response to the closing of the fiscal space is being actively managed, in the context of government’s 2014-2019 medium term strategic framework. Some of our aspirations might take longer to realise. Within government’s institutions, more urgent and essential existing programmes are being prioritised above other programmes that are reduced. The implementation of some newly proposed programmes will either be phased in over a longer period or, in some cases, possibly even delayed. Social sector spending and key infrastructure spending, as well as other key areas of spending, continue to grow in real terms.
In addition to the reprioritisation of government programmes, the policy frameworks and implementation methodology of programmes are being re-evaluated, with a focus on service delivery of programmes. In line with the 2013/14 National Treasury instruction on cost containment measures, financing programmes must entail a greater share of goods and services budgets being devoted towards core areas of service delivery. The focus of government programmes is being sharpened, both in terms of spatial distribution, and in terms of their nature and emphasis. Effectiveness and efficiency of expenditure is our guiding mantra.
The spending plans contained in the 2015 Budget do respond to our short term needs for economic growth. However, to achieve our ambition of faster growth, which we unquestionably need for pushing back the frontiers of unemployment, poverty and inequality, we must continue to strive towards shifting the composition of expenditure more towards investment, away from consumption. Institutional spending, as always, is being closely monitored, and the ongoing process of realignment continues. The details of the spending of national government departments and its entities are encompassed in the chapters of this publication.
All the expenditure and service delivery information contained in the chapters of this publication result from a wide ranging intergovernmental consultative process, leading to executive approval of reprioritised and realigned spending allocations. Many people have contributed to making this publication possible, particularly my colleagues in national departments and agencies. Their collaboration and understanding during the budget allocation and document drafting processes has been invaluable. Appreciation is also due to the dedicated team at National Treasury for the publication of this highly valuable resource.
Lungisa Fuzile Director-General: National Treasury


Introduction
The Estimates of National Expenditure publications
The Estimates of national Expenditure (ENE) publications provide comprehensive information on how budget resources are generated, how institutions have spent their budgets in previous years, and how institutions plan to spend the resources allocated to them over the MTEF period. Key performance indicators are included for each national government vote and entity showing what the institutions aim to achieve by spending their budget allocations in a particular manner. This information provides Parliament and the public with the necessary tools to hold government accountable against the 14 outcomes set out in the 2014-2019 medium term strategic framework.
The 2015 ENE publications largely retain the scope of information presented in previous years’ publications. For ease of comprehension, however, in the 2015 publications information is presented in a more succinct and concise manner in data tables and their accompanying explanatory narratives. The reader can thus more readily understand what each institution is planning to spend its budget on and what it aims to achieve. Each chapter in the abridged 2015 ENE publication relates to a specific budget vote. A separate, more detailed, e-publication is also available for each vote.
Compared to the abridged version of the 2015 ENE, the 2015 ENE e-publications provide more detailed information, including on goods and services, transfers and subsidies, as well as on programme specific personnel expenditure. The abridged version of the ENE contains one additional table at the end of a chapter that shows expenditure on infrastructure, whereas the vote ENE e-publications’ additional tables also contain summaries of expenditure on conditional allocations to provinces and municipalities; departmental public private partnerships; and donor funding. Budget information is also provided for the public entities that are not shown in detail in the abridged publication. In some e-publications more detailed information at the level of site service delivery is included.
A separate 2015 ENE Overview e-publication is also available, which contains a description at the main budget non-interest spending level, summarising the ENE publication information across votes. The 2015 ENE Overview contains this narrative explanation and summary tables; a description of the budgeting approach; and also has a write-up on how to interpret the information that is contained in each section of the publications.


Communications
National Treasury
Republic of South Africa

Contents
Budget summary ................................................................................................................................ 1
Vote purpose ....................................................................................................................................... 1
Selected performance indicators ...................................................................................................... 2
Expenditure analysis .......................................................................................................................... 2
Expenditure trends ............................................................................................................................. 3
Expenditure estimates ....................................................................................................................... 3
Personnel information ....................................................................................................................... 4
Programme 1: Administration ........................................................................................................... 5
Programme 2: Communications Policy, Research and Development ........................................... 6
Programme 3: Industry and Capacity Development ....................................................................... 7
Programme 4: Entity oversight ......................................................................................................... 8
Public entities and other agencies .................................................................................................. 22

1
Vote 3 Communications
Budget summary 2015/16 2016/17 2017/18
R million Total Current
payments Transfers and
subsidies Payments for capital assets Total Total
MTEF allocation Administration 42.4 42.4 – 0.0 45.1 47.5Communications Policy, Research and Development
7.9 7.7 – 0.2 8.4 8.9
Industry and Capacity Development 10.2 10.0 – 0.2 10.9 11.6Entity Oversight 1 220.4 9.9 1 210.2 0.3 1 280.3 1 350.9Total expenditure estimates 1 280.9 70.1 1 210.2 0.7 1 344.7 1 418.9Executive authority Minister of Communications Accounting officer Director General of Communications Website address www.doc.gov.za The Estimates of National Expenditure e-publications for individual votes are available on www.treasury.gov.za. These publications provide more comprehensive coverage of vote specific information, particularly about goods and services, transfers and subsidies, personnel, public entities, donor funding, public private partnerships, conditional allocations to provinces and municipalities and expenditure information at the level of service delivery, where appropriate.
Vote purpose Create an enabling environment for the provision of inclusive communication services to all South Africans in a manner that promotes socioeconomic development and investment through broadcasting, new media, print media and other new technologies, and brand the country locally and internationally.
Mandate The reorganisation of some national departments, announced by the president in May 2014, included a reconstituted Ministry of Communications, which will be responsible for overarching communications policy and strategy, information dissemination and publicity, and the branding of the country abroad. Improved communication and marketing will promote an informed citizenry and also assist the country to promote investments, economic growth and job creation. The department is guided by Section 192 of the Constitution which provides for the independence of broadcasting regulation in the public interest, the International Telecommunications Union and the World Intellectual Property Organisation, among others.
The department is responsible for the administration and implementation of the following legislation:
• Films and Publications Act (1996)
• Broadcasting Act (1999)
• Media Development and Diversity Agency Act (2002)
• Independent Communications Authority of South Africa Act (2000) – joint responsibility with the Minister of Telecommunications and Postal Services
• Electronic Communications and Transactions Act (2002) – joint responsibility with the Minister of Telecommunications and Postal Services
• Electronic Communications and Transactions Act (2005) – joint responsibility with the Minister of Telecommunications and Postal Services.
The department is also responsible for the oversight of its entities.
2015 Estimates of National Expenditure
2
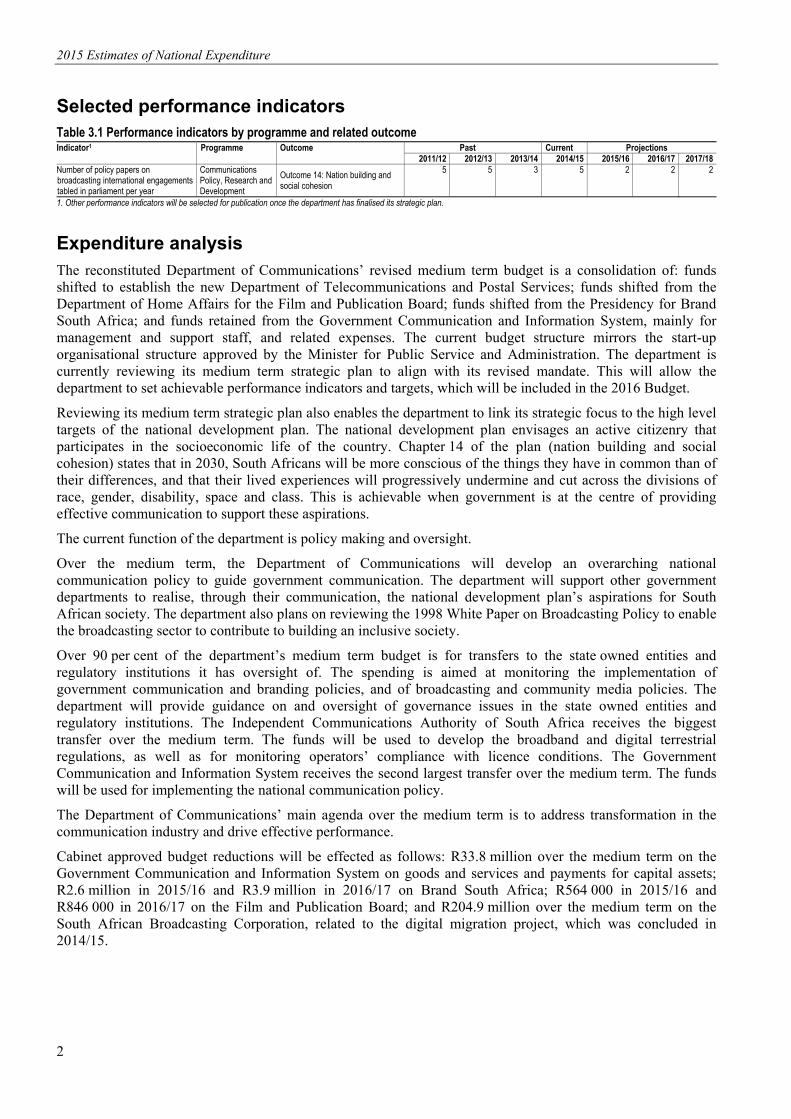
Selected performance indicators Table 3.1 Performance indicators by programme and related outcome Indicator1 Programme Outcome Past Current Projections
2011/12 2012/13 2013/14 2014/15 2015/16 2016/17 2017/18 Number of policy papers on broadcasting international engagements tabled in parliament per year
Communications Policy, Research and Development
Outcome 14: Nation building and social cohesion
5 5 3 5 2 2 2
1. Other performance indicators will be selected for publication once the department has finalised its strategic plan.
Expenditure analysis The reconstituted Department of Communications’ revised medium term budget is a consolidation of: funds shifted to establish the new Department of Telecommunications and Postal Services; funds shifted from the Department of Home Affairs for the Film and Publication Board; funds shifted from the Presidency for Brand South Africa; and funds retained from the Government Communication and Information System, mainly for management and support staff, and related expenses. The current budget structure mirrors the start-up organisational structure approved by the Minister for Public Service and Administration. The department is currently reviewing its medium term strategic plan to align with its revised mandate. This will allow the department to set achievable performance indicators and targets, which will be included in the 2016 Budget.
Reviewing its medium term strategic plan also enables the department to link its strategic focus to the high level targets of the national development plan. The national development plan envisages an active citizenry that participates in the socioeconomic life of the country. Chapter 14 of the plan (nation building and social cohesion) states that in 2030, South Africans will be more conscious of the things they have in common than of their differences, and that their lived experiences will progressively undermine and cut across the divisions of race, gender, disability, space and class. This is achievable when government is at the centre of providing effective communication to support these aspirations.
The current function of the department is policy making and oversight.
Over the medium term, the Department of Communications will develop an overarching national communication policy to guide government communication. The department will support other government departments to realise, through their communication, the national development plan’s aspirations for South African society. The department also plans on reviewing the 1998 White Paper on Broadcasting Policy to enable the broadcasting sector to contribute to building an inclusive society.
Over 90 per cent of the department’s medium term budget is for transfers to the state owned entities and regulatory institutions it has oversight of. The spending is aimed at monitoring the implementation of government communication and branding policies, and of broadcasting and community media policies. The department will provide guidance on and oversight of governance issues in the state owned entities and regulatory institutions. The Independent Communications Authority of South Africa receives the biggest transfer over the medium term. The funds will be used to develop the broadband and digital terrestrial regulations, as well as for monitoring operators’ compliance with licence conditions. The Government Communication and Information System receives the second largest transfer over the medium term. The funds will be used for implementing the national communication policy.
The Department of Communications’ main agenda over the medium term is to address transformation in the communication industry and drive effective performance.
Cabinet approved budget reductions will be effected as follows: R33.8 million over the medium term on the Government Communication and Information System on goods and services and payments for capital assets; R2.6 million in 2015/16 and R3.9 million in 2016/17 on Brand South Africa; R564 000 in 2015/16 and R846 000 in 2016/17 on the Film and Publication Board; and R204.9 million over the medium term on the South African Broadcasting Corporation, related to the digital migration project, which was concluded in 2014/15.

Vote 3: Communications
3
Expenditure trends
Table 3.2 Vote expenditure trends by programme and economic classification Programmes 1. Administration 2. Communications Policy, Research and Development 3. Industry and Capacity Development 4. Entity Oversight Programme
Ann
ual b
udge
t
Adj
uste
d ap
prop
riatio
n
Aud
ited
outc
ome
Ann
ual b
udge
t
Adj
uste
d ap
prop
riatio
n
Aud
ited
outc
ome
Ann
ual b
udge
t
Adj
uste
d ap
prop
riatio
n
Aud
ited
outc
ome
Ann
ual b
udge
t
Adj
uste
d ap
prop
riatio
n
Rev
ised
es
timat
e
Out
com
e/A
nnua
l bu
dget
Ave
rage
(%
)
Out
com
e/A
djus
ted
appr
opria
tion
Ave
rage
(%
)
R million 2011/12 2012/13 2013/14 2014/15 2011/12 - 2014/15 Programme 1 8.7 8.7 8.7 12.4 9.0 9.0 11.4 11.4 11.4 12.8 24.8 24.8 118.9% 100.0%Programme 2 4.2 4.2 4.2 5.0 3.7 3.7 5.7 5.7 5.7 6.5 6.5 6.5 94.0% 100.0%Programme 3 5.5 5.5 5.5 7.6 6.3 6.3 9.0 9.0 9.0 9.3 9.3 9.3 95.9% 100.0%Programme 4 1 021.1 1 019.1 999.6 1 179.6 1 304.9 1 238.9 1 249.1 1 327.8 1 322.4 1 193.0 1 226.6 1 226.6 103.1% 98.1%Total 1 039.6 1 037.6 1 018.1 1 204.6 1 323.9 1 257.9 1 275.2 1 353.9 1 348.4 1 221.6 1 267.2 1 267.2 103.2% 98.2%Change to 2014 Budget estimate
45.6
Economic classification Current payments 20.0 20.0 20.0 26.7 20.7 20.7 26.2 26.2 27.9 32.0 44.0 44.0 107.4% 101.6%Compensation of employees
17.2 17.2 17.2 23.7 17.7 17.7 23.0 23.0 24.7 28.1 40.1 40.1 108.4% 101.8%
Goods and services 2.9 2.9 2.9 3.0 3.0 3.0 3.2 3.2 3.2 3.9 3.9 3.9 100.0% 100.0%of which: Consultants and professional services: Business and advisory services
0.6 0.6 0.6 0.6 0.6 0.6 0.7 0.7 0.7 0.7 0.7 0.7 100.0% 100.0%
Consultants and professional services: Infrastructure and planning
2.1 2.1 2.1 2.2 2.2 2.2 2.3 2.3 2.3 2.4 2.4 2.4 100.0% 100.0%
Travel and subsistence 0.2 0.2 0.2 0.2 0.2 0.2 0.2 0.2 0.2 0.8 0.8 0.8 100.0% 100.0%Transfers and subsidies
1 019.6 1 017.6 997.9 1 177.8 1 303.2 1 237.0 1 249.0 1 327.5 1 320.3 1 189.3 1 222.9 1 222.9 103.1% 98.1%
Departmental agencies and accounts
875.8 873.8 854.1 1 027.0 1 087.3 1 021.6 1 019.9 1 060.4 1 063.7 1 024.1 1 057.7 1 057.7 101.3% 98.0%
Public corporations and private enterprises
143.8 143.8 143.8 150.8 215.8 215.4 229.1 267.1 256.6 165.2 165.2 165.2 113.4% 98.6%
Payments for capital assets
– – 0.1 – – 0.2 – 0.2 0.2 0.3 0.3 0.3 244.4% 154.5%
Machinery and equipment
– – 0.1 – – 0.2 – 0.2 0.2 0.3 0.3 0.3 244.4% 154.5%
Total 1 039.6 1 037.6 1 018.1 1 204.6 1 323.9 1 257.9 1 275.2 1 353.9 1 348.4 1 221.6 1 267.2 1 267.2 103.2% 98.2%
Expenditure estimates
Table 3.3 Vote expenditure estimates by programme and economic classification Programmes 1. Administration 2. Communications Policy, Research and Development 3. Industry and Capacity Development
4. Entity Oversight Programme
Revised estimate
Averagegrowth
rate(%)
Expenditure/total:
Average(%) Medium-term expenditure estimate
Averagegrowth
rate(%)
Expenditure/total:
Average(%)
R million 2014/15 2011/12 - 2014/15 2015/16 2016/17 2017/18 2014/15 - 2017/18 Programme 1 24.8 41.7% 1.1% 42.4 45.1 47.5 24.3% 3.0%Programme 2 6.5 15.8% 0.4% 7.9 8.4 8.9 10.9% 0.6%Programme 3 9.3 19.1% 0.6% 10.2 10.9 11.6 7.5% 0.8%Programme 4 1 226.6 6.4% 97.9% 1 220.4 1 280.3 1 350.9 3.3% 95.6%Total 1 267.2 6.9% 100.0% 1 280.9 1 344.7 1 418.9 3.8% 100.0%Change to 2014 Budget estimate
(62.5) (73.0) (72.3)

2015 Estimates of National Expenditure
4
Table 3.3 Vote expenditure estimates by programme and economic classification Economic classification
Revised estimate
Average growth
rate (%)
Expenditure/total:
Average(%) Medium-term expenditure estimate
Average growth
rate (%)
Expenditure/total:
Average(%)
R million 2014/15 2011/12 - 2014/15 2015/16 2016/17 2017/18 2014/15 - 2017/18 Current payments 44.0 30.0% 2.3% 70.1 74.8 79.1 21.5% 5.0%Compensation of employees 40.1 32.7% 2.0% 56.0 59.2 62.5 16.0% 4.1%Goods and services 3.9 11.0% 0.3% 14.1 15.6 16.5 61.3% 0.9%of which: Catering: Departmental activities – – – 0.1 0.1 0.1 – –Communication – – – 0.3 0.4 0.4 – –Computer services – 3.8% – 1.0 1.1 1.2 245.0% 0.1%Consultants and professional services: Business and advisory services
0.7 5.3% 0.1% – – – -100.0% –
Consultants and professional services: Infrastructure and planning
2.4 5.3% 0.2% – – – -100.0% –
Contractors – – – 3.4 3.6 3.8 – 0.2%Fleet services (including government motor transport)
– – – 2.9 3.2 3.4 – 0.2%
Consumable supplies – – – 0.1 0.1 0.1 – –Consumables: Stationery, printing and office supplies
– – – 0.3 0.3 0.3 – –
Operating leases – – – 0.1 0.1 0.1 – –Travel and subsistence 0.8 59.3% – 5.7 6.3 6.7 102.1% 0.4%Training and development – – – 0.1 – – – –Operating payments – – – – 0.4 0.4 – –Transfers and subsidies 1 222.9 6.3% 97.7% 1 210.2 1 269.5 1 339.4 3.1% 94.9%Departmental agencies and accounts
1 057.7 6.6% 81.7% 1 037.2 1 087.4 1 148.2 2.8% 81.5%
Public corporations and private enterprises
165.2 4.7% 16.0% 172.9 182.1 191.2 5.0% 13.4%
Payments for capital assets 0.3 – – 0.7 0.4 0.4 8.6% –Machinery and equipment 0.3 – – 0.7 0.4 0.4 8.6% –Total 1 267.2 6.9% 100.0% 1 280.9 1 344.7 1 418.9 3.8% 100.0%
Personnel information
Table 3.4 Vote personnel numbers and cost by salary level and programme1 Programmes 1. Administration 2. Communications Policy, Research and Development 3. Industry and Capacity Development 4. Entity Oversight
Number of posts estimated for 31 March 2015 Number and cost2 of personnel posts filled / planned for on funded establishment Number
Number of
funded posts
Number of posts
additional to the
establishment Actual Revised estimate Medium-term expenditure estimate
Averagegrowth
rate(%)
Salary level/total:
Average(%)
2013/14 2014/15 2015/16 2016/17 2017/18 2014/15 - 2017/18
Communications
Number Cost Unit Cost
Number Cost
Unit Cost
Number Cost
Unit Cost
Number Cost
Unit Cost
Number Cost
Unit Cost
Salary level 393 20 52 24.7 0.5 194 39.8 0.2 401 56.0 0.1 401 59.2 0.1 401 62.5 0.2 27.4% 100.0%1 – 6 50 3 8 1.5 0.2 50 3.0 0.1 50 3.8 0.1 50 4.0 0.1 50 4.2 0.1 – 14.3%7 – 10 146 3 22 7.9 0.4 60 7.1 0.1 147 14.9 0.1 147 15.7 0.1 147 16.6 0.1 34.8% 35.9%11 – 12 108 4 10 5.4 0.5 37 8.8 0.2 109 11.1 0.1 109 11.7 0.1 109 12.4 0.1 43.4% 26.1%13 – 16 89 10 12 10.0 0.8 47 20.9 0.4 95 26.3 0.3 95 27.8 0.3 95 29.4 0.3 26.4% 23.8%Programme 393 20 52 24.7 0.5 194 39.8 0.2 401 56.0 0.1 401 59.2 0.1 401 62.5 0.2 27.4% 100.0%Programme 1 170 20 29 11.3 0.4 170 24.4 0.1 170 34.1 0.2 170 36.0 0.2 170 37.9 0.2 – 48.7%Programme 2 62 – 9 4.6 0.5 9 5.4 0.6 62 5.8 0.1 62 6.2 0.1 62 6.6 0.1 90.3% 14.0%Programme 3 84 – 11 7.0 0.6 11 7.1 0.6 92 7.6 0.1 92 8.1 0.1 92 8.7 0.1 103.0% 20.5%Programme 4 77 – 3 1.8 0.6 4 2.8 0.7 77 8.6 0.1 77 8.9 0.1 77 9.5 0.1 168.0% 16.8%1. Data has been provided by the department and may not necessarily reconcile with official government personnel data. 2. Rand million.
Vote 3: Communications
5
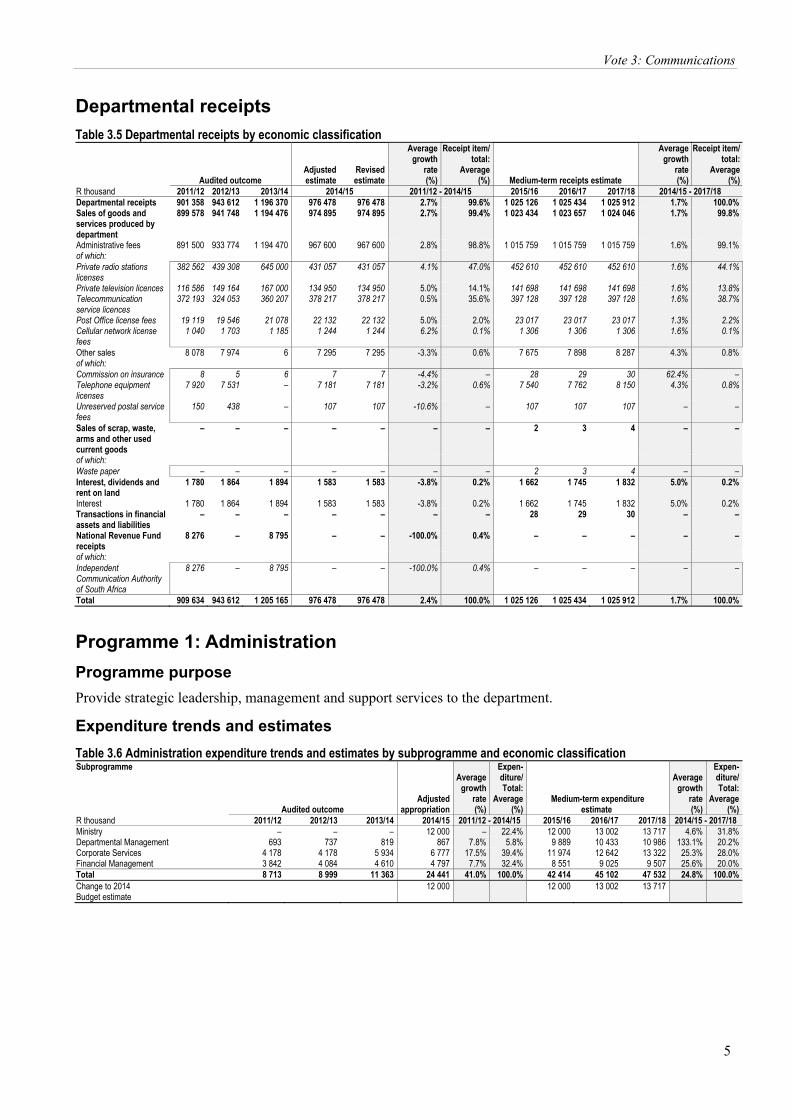
Departmental receipts
Table 3.5 Departmental receipts by economic classification
Audited outcome Adjusted estimate
Revised estimate
Averagegrowth
rate (%)
Receipt item/total:
Average(%) Medium-term receipts estimate
Averagegrowth
rate (%)
Receipt item/total:
Average(%)
R thousand 2011/12 2012/13 2013/14 2014/15 2011/12 - 2014/15 2015/16 2016/17 2017/18 2014/15 - 2017/18 Departmental receipts 901 358 943 612 1 196 370 976 478 976 478 2.7% 99.6% 1 025 126 1 025 434 1 025 912 1.7% 100.0%Sales of goods and services produced by department
899 578 941 748 1 194 476 974 895 974 895 2.7% 99.4% 1 023 434 1 023 657 1 024 046 1.7% 99.8%
Administrative fees 891 500 933 774 1 194 470 967 600 967 600 2.8% 98.8% 1 015 759 1 015 759 1 015 759 1.6% 99.1%of which: Private radio stations licenses
382 562 439 308 645 000 431 057 431 057 4.1% 47.0% 452 610 452 610 452 610 1.6% 44.1%
Private television licences 116 586 149 164 167 000 134 950 134 950 5.0% 14.1% 141 698 141 698 141 698 1.6% 13.8%Telecommunication service licences
372 193 324 053 360 207 378 217 378 217 0.5% 35.6% 397 128 397 128 397 128 1.6% 38.7%
Post Office license fees 19 119 19 546 21 078 22 132 22 132 5.0% 2.0% 23 017 23 017 23 017 1.3% 2.2%Cellular network license fees
1 040 1 703 1 185 1 244 1 244 6.2% 0.1% 1 306 1 306 1 306 1.6% 0.1%
Other sales 8 078 7 974 6 7 295 7 295 -3.3% 0.6% 7 675 7 898 8 287 4.3% 0.8%of which: Commission on insurance 8 5 6 7 7 -4.4% – 28 29 30 62.4% – Telephone equipment licenses
7 920 7 531 – 7 181 7 181 -3.2% 0.6% 7 540 7 762 8 150 4.3% 0.8%
Unreserved postal service fees
150 438 – 107 107 -10.6% – 107 107 107 – –
Sales of scrap, waste, arms and other used current goods
– – – – – – – 2 3 4 – –
of which: Waste paper – – – – – – – 2 3 4 – – Interest, dividends and rent on land
1 780 1 864 1 894 1 583 1 583 -3.8% 0.2% 1 662 1 745 1 832 5.0% 0.2%
Interest 1 780 1 864 1 894 1 583 1 583 -3.8% 0.2% 1 662 1 745 1 832 5.0% 0.2%Transactions in financial assets and liabilities
– – – – – – – 28 29 30 – –
National Revenue Fund receipts
8 276 – 8 795 – – -100.0% 0.4% – – – – –
of which: Independent Communication Authority of South Africa
8 276 – 8 795 – – -100.0% 0.4% – – – – –
Total 909 634 943 612 1 205 165 976 478 976 478 2.4% 100.0% 1 025 126 1 025 434 1 025 912 1.7% 100.0%
Programme 1: Administration
Programme purpose
Provide strategic leadership, management and support services to the department.
Expenditure trends and estimates
Table 3.6 Administration expenditure trends and estimates by subprogramme and economic classification Subprogramme
Audited outcome Adjusted
appropriation
Averagegrowth
rate(%)
Expen-diture/Total:
Average(%)
Medium-term expenditure estimate
Averagegrowth
rate(%)
Expen-diture/Total:
Average(%)
R thousand 2011/12 2012/13 2013/14 2014/15 2011/12 - 2014/15 2015/16 2016/17 2017/18 2014/15 - 2017/18 Ministry – – – 12 000 – 22.4% 12 000 13 002 13 717 4.6% 31.8%Departmental Management 693 737 819 867 7.8% 5.8% 9 889 10 433 10 986 133.1% 20.2%Corporate Services 4 178 4 178 5 934 6 777 17.5% 39.4% 11 974 12 642 13 322 25.3% 28.0%Financial Management 3 842 4 084 4 610 4 797 7.7% 32.4% 8 551 9 025 9 507 25.6% 20.0%Total 8 713 8 999 11 363 24 441 41.0% 100.0% 42 414 45 102 47 532 24.8% 100.0%Change to 2014 Budget estimate
12 000 12 000 13 002 13 717

2015 Estimates of National Expenditure
6
Table 3.6 Administration expenditure trends and estimates by subprogramme and economic classification Economic classification
Audited outcome Adjusted
appropriation
Averagegrowth
rate(%)
Expen-diture/Total:
Average(%)
Medium-term expenditure estimate
Averagegrowth
rate(%)
Expen-diture/Total:
Average(%)
R thousand 2011/12 2012/13 2013/14 2014/15 2011/12 - 2014/15 2015/16 2016/17 2017/18 2014/15 - 2017/18 Current payments 8 706 8 992 11 355 24 432 41.1% 99.9% 42 374 45 058 47 486 24.8% 99.9%Compensation of employees 8 681 8 966 11 328 24 404 41.1% 99.7% 34 067 35 953 37 861 15.8% 82.9%Goods and services 25 26 27 28 3.8% 0.2% 8 307 9 105 9 625 600.5% 17.0%of which: Advertising – – – – – – 30 33 35 – 0.1%Catering: Departmental activities – – – – – – 24 26 28 – – Communication 25 26 27 28 3.8% 0.2% 222 243 256 109.1% 0.5%Entertainment – – – – – – 40 44 46 – 0.1%Fleet services (including government motor transport)
– – – – – – 2 901 3 180 3 361 – 5.9%
Consumable supplies – – – – – – 46 51 53 – 0.1%Consumables: Stationery, printing and office supplies
– – – – – – 70 77 81 – 0.1%
Operating leases – – – – – – 35 38 41 – 0.1%Travel and subsistence – – – – – – 4 935 5 409 5 719 – 10.1%Operating payments – – – – – – 4 4 5 – – Payments for capital assets 7 7 8 9 8.7% 0.1% 40 44 46 72.3% 0.1%Machinery and equipment 7 7 8 9 8.7% 0.1% 40 44 46 72.3% 0.1%Total 8 713 8 999 11 363 24 441 41.0% 100.0% 42 414 45 102 47 532 24.8% 100.0%Proportion of total programme expenditure to vote expenditure
0.9% 0.7% 0.8% 1.9% – – 3.3% 3.4% 3.3% – –
Personnel information
Table 3.7 Administration personnel numbers and cost by salary level¹
Number of posts estimated for
31 March 2015 Number and cost2 of personnel posts filled / planned for on funded establishment Number
Number of
funded posts
Number of posts
additional to the
establishment Actual Revised estimate
Medium-term expenditure estimate
Averagegrowth
rate(%)
Salary level/total:
Average(%)
2013/14 2014/15 2015/16 2016/17 2017/18 2014/15 - 2017/18
Administration
Number Cost Unit Cost
Number Cost
Unit Cost
Number Cost
Unit Cost
Number Cost
Unit Cost
Number Cost
Unit Cost
Salary level 170 20 29 11.3 0.4 170 24.4 0.1 170 34.1 0.2 170 36.0 0.2 170 37.9 0.2 – 100.0%1 – 6 48 3 6 1.2 0.2 48 2.7 0.1 48 2.8 0.1 48 2.9 0.1 48 3.1 0.1 – 28.2%7 – 10 55 3 17 6.2 0.4 55 5.4 0.1 55 13.2 0.2 55 13.8 0.3 55 14.6 0.3 – 32.4%11 – 12 31 4 4 2.0 0.5 31 5.3 0.2 31 6.9 0.2 31 7.2 0.2 31 7.6 0.2 – 18.2%13 – 16 36 10 2 1.9 0.9 36 10.9 0.3 36 11.3 0.3 36 12.0 0.3 36 12.6 0.3 – 21.2%1. Data has been provided by the department and may not necessarily reconcile with official government personnel data. 2. Rand million.
Programme 2: Communications Policy, Research and Development
Programme purpose
Conduct research and develop communications and broadcasting policies.
Objectives
• Conduct research in order to improve universal access to broadcasting services by 31 March 2019.
• Conduct research and develop media policies in order to broaden access to information to all citizens by 31 March 2019.
• Conduct research and develop the broadcasting spectrum policy and plan in order to ensure equitable allocation of spectrum to public, private and community players by 31 March 2017.
• Conduct research and develop branding policies that positively market the country locally and internationally in a manner that promotes socioeconomic development and investment by 31 March 2019.
Subprogrammes
• Broadcasting Policy oversees the development and implementation of public and community broadcasting policies and strategies, and policies and strategies to promote the commercial broadcasting tier; and facilitates the implementation of policies by regulatory institutions in the sector.

Vote 3: Communications
7
Expenditure trends and estimates
Table 3.8 Communications Policy, Research and Development expenditure trends and estimates by subprogramme and economic classification Subprogramme
Audited outcome Adjusted
appropriation
Averagegrowth
rate(%)
Expen-diture/Total:
Average(%)
Medium-term expenditure estimate
Averagegrowth
rate(%)
Expen-diture/Total:
Average(%)
R thousand 2011/12 2012/13 2013/14 2014/15 2011/12 - 2014/15 2015/16 2016/17 2017/18 2014/15 - 2017/18 Broadcasting Policy 4 216 3 714 5 671 6 547 15.8% 100.0% 7 897 8 400 8 931 10.9% 100.0%Total 4 216 3 714 5 671 6 547 15.8% 100.0% 7 897 8 400 8 931 10.9% 100.0% Economic classification Current payments 4 188 3 628 5 581 6 452 15.5% 98.5% 7 719 8 212 8 733 10.6% 97.9%Compensation of employees 3 292 2 682 4 588 5 407 18.0% 79.3% 5 769 6 156 6 568 6.7% 75.2%Goods and services 896 946 993 1 045 5.3% 19.3% 1 950 2 056 2 165 27.5% 22.7%of which: Contractors 896 946 993 1 045 5.3% 19.3% 1 950 2 056 2 165 27.5% 22.7%Payments for capital assets 28 86 90 95 50.3% 1.5% 178 188 198 27.7% 2.1%Machinery and equipment 28 86 90 95 50.3% 1.5% 178 188 198 27.7% 2.1%Total 4 216 3 714 5 671 6 547 15.8% 100.0% 7 897 8 400 8 931 10.9% 100.0%Proportion of total programme expenditure to vote expenditure
0.4% 0.3% 0.4% 0.5% – – 0.6% 0.6% 0.6% – –
Personnel information
Table 3.9 Communications Policy, Research and Development personnel numbers and cost by salary level¹
Number of posts estimated for
31 March 2015 Number and cost2 of personnel posts filled / planned for on funded establishment Number
Number of
funded posts
Number of posts
additional to the
establishment Actual Revised estimate
Medium-term expenditure estimate
Averagegrowth
rate(%)
Salary level/total:
Average(%)
2013/14 2014/15 2015/16 2016/17 2017/18 2014/15 - 2017/18 Communications Policy, Research and Development
Number Cost
Unit Cost
Number Cost
Unit Cost
Number Cost
Unit Cost
Number Cost
Unit Cost
Number Cost
Unit Cost
Salary level 62 – 9 4.6 0.5 9 5.4 0.6 62 5.8 0.1 62 6.2 0.1 62 6.6 0.1 90.3% 100.0%7 – 10 25 – 3 1.0 0.3 3 1.0 0.3 25 1.1 0.0 25 1.2 0.0 25 1.3 0.1 102.7% 40.0%11 – 12 22 – 3 1.7 0.6 3 1.7 0.6 22 1.9 0.1 22 2.0 0.1 22 2.1 0.1 94.3% 35.4%13 – 16 15 – 3 1.8 0.6 3 2.6 0.9 15 2.8 0.2 15 3.0 0.2 15 3.2 0.2 71.0% 24.6%1. Data has been provided by the department and may not necessarily reconcile with official government personnel data. 2. Rand million.
Programme 3: Industry and Capacity Development
Programme purpose
Manage enterprise development, broadcasting digital migration, industry research and analysis. Implement a structured programme of engagement with stakeholders in support of the department's programmes and projects.
Objectives
• Build a competitive communications industry through the implementation of targeted interventions to support the growth and development of the creative industries by 31 March 2019.
• Manage digital broadcasting migration to ensure the successful migration from analogue to digital television in South Africa within 2 years.
• Manage industry research and analysis on an ongoing basis to ensure evidence based policy making through the provision of qualitative and quantitative analysis.
• Develop and implement structured programmes of intergovernmental and stakeholders engagement in order to leverage support for strategic priorities of the department by 31 March 2018.
Subprogrammes
• Enterprise Development manages enterprise development; implements policy; manages and supports creative industries and media transformation; compiles skills profiles; and develops skills development programmes, including the development and implementation of broadcasting industry development strategies and plans.

2015 Estimates of National Expenditure
8
• Broadcasting Digital Migration manages broadcasting digital migration with the aim of migrating from analogue to digital broadcasting, and plays an important role in creating and supporting SMMEs in the digital domain.
Expenditure trends and estimates
Table 3.10 Industry and Capacity Development expenditure trends and estimates by subprogramme and economic classification Subprogramme
Audited outcome Adjusted
appropriation
Averagegrowth
rate(%)
Expen-diture/Total:
Average(%)
Medium-term expenditure estimate
Averagegrowth
rate(%)
Expen-diture/Total:
Average(%)
R thousand 2011/12 2012/13 2013/14 2014/15 2011/12 - 2014/15 2015/16 2016/17 2017/18 2014/15 - 2017/18 Enterprise Development 4 929 4 155 5 878 6 000 6.8% 69.5% 6 381 6 790 7 220 6.4% 62.9%Broadcasting Digital Migration 586 2 135 3 138 3 323 78.3% 30.5% 3 816 4 104 4 356 9.4% 37.1%Total 5 515 6 290 9 016 9 323 19.1% 100.0% 10 197 10 894 11 576 7.5% 100.0% Economic classification Current payments 5 439 6 218 8 928 9 181 19.1% 98.7% 10 047 10 736 11 410 7.5% 98.5%Compensation of employees 3 681 4 367 6 978 7 129 24.6% 73.5% 7 607 8 116 8 660 6.7% 75.0%Goods and services 1 758 1 851 1 950 2 052 5.3% 25.2% 2 440 2 620 2 750 10.3% 23.5%of which: Computer services 586 617 650 684 5.3% 8.4% 1 000 1 100 1 150 18.9% 9.4%Contractors 1 172 1 234 1 300 1 368 5.3% 16.8% 1 440 1 520 1 600 5.4% 14.1%Payments for capital assets 76 72 88 142 23.2% 1.3% 150 158 166 5.3% 1.5%Machinery and equipment 76 72 88 142 23.2% 1.3% 150 158 166 5.3% 1.5%Total 5 515 6 290 9 016 9 323 19.1% 100.0% 10 197 10 894 11 576 7.5% 100.0%Proportion of total programme expenditure to vote expenditure
0.5% 0.5% 0.7% 0.7% – – 0.8% 0.8% 0.8% – –
Personnel information
Table 3.11 Industry and Capacity Development personnel numbers and cost by salary level¹
Number of posts estimated for 31 March 2015 Number and cost2 of personnel posts filled / planned for on funded establishment Number
Number of
funded posts
Number of posts
additional to the
establishment Actual Revised estimate
Medium-term expenditure estimate
Averagegrowth
rate(%)
Salary level/total:
Average(%)
2013/14 2014/15 2015/16 2016/17 2017/18 2014/15 - 2017/18
Industry and Capacity Development
Number Cost Unit Cost
Number Cost
Unit Cost
Number Cost
Unit Cost
Number Cost
Unit Cost
Number Cost
Unit Cost
Salary level 84 – 11 7.0 0.6 11 7.1 0.6 92 7.6 0.1 92 8.1 0.1 92 8.7 0.1 103.0% 100.0%1 – 6 2 – 2 0.3 0.1 2 0.3 0.1 2 0.3 0.1 2 0.3 0.2 2 0.3 0.2 – 2.8%7 – 10 35 – 1 0.3 0.3 1 0.3 0.3 36 0.3 0.0 36 0.4 0.0 36 0.4 0.0 230.2% 38.0%11 – 12 27 – 2 1.0 0.5 2 1.0 0.5 28 1.1 0.0 28 1.2 0.0 28 1.2 0.0 141.0% 30.0%13 – 16 20 – 6 5.4 0.9 6 5.5 0.9 26 5.9 0.2 26 6.3 0.2 26 6.7 0.3 63.0% 29.3%1. Data has been provided by the department and may not necessarily reconcile with official government personnel data. 2. Rand million.
Programme 4: Entity oversight
Programme purpose
Monitor the implementation of policies by state owned enterprises and regulatory institutions and provide guidance and oversight on their governance matters.
Objectives
• Provide guidance in and oversight of the governance matters of state owned entities on an ongoing basis.
• Monitor the implementation of communications and branding policies by state owned entities to ensure the strategic alignment with the department’s priorities, by 31 March 2018.
• Issue policy directions to the regulatory institutions as required from time to time.
• Ensure timeous submission of entity funding requests within the stipulated timelines in order to ensure their viability and sustainability.
Vote 3: Communications
9
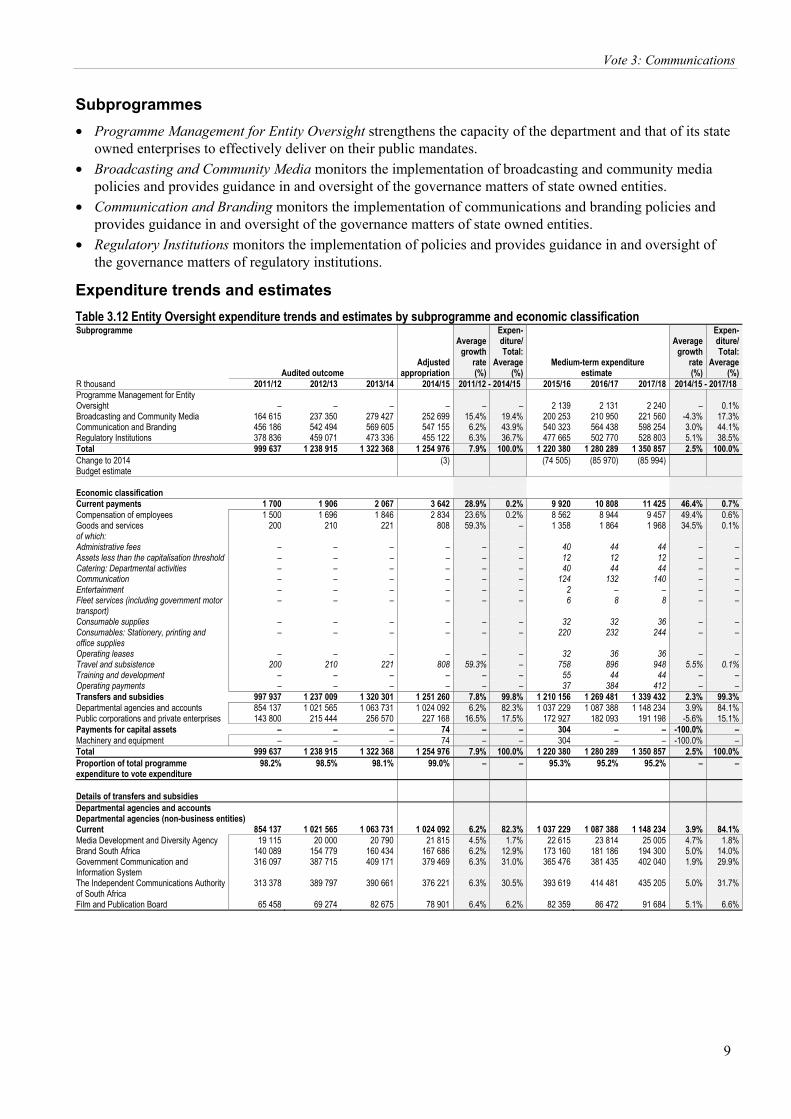
Subprogrammes
• Programme Management for Entity Oversight strengthens the capacity of the department and that of its state owned enterprises to effectively deliver on their public mandates.
• Broadcasting and Community Media monitors the implementation of broadcasting and community media policies and provides guidance in and oversight of the governance matters of state owned entities.
• Communication and Branding monitors the implementation of communications and branding policies and provides guidance in and oversight of the governance matters of state owned entities.
• Regulatory Institutions monitors the implementation of policies and provides guidance in and oversight of the governance matters of regulatory institutions.
Expenditure trends and estimates
Table 3.12 Entity Oversight expenditure trends and estimates by subprogramme and economic classification Subprogramme
Audited outcome Adjusted
appropriation
Averagegrowth
rate(%)
Expen-diture/Total:
Average(%)
Medium-term expenditure estimate
Averagegrowth
rate(%)
Expen-diture/Total:
Average(%)
R thousand 2011/12 2012/13 2013/14 2014/15 2011/12 - 2014/15 2015/16 2016/17 2017/18 2014/15 - 2017/18 Programme Management for Entity Oversight – – – – – – 2 139 2 131 2 240 – 0.1%Broadcasting and Community Media 164 615 237 350 279 427 252 699 15.4% 19.4% 200 253 210 950 221 560 -4.3% 17.3%Communication and Branding 456 186 542 494 569 605 547 155 6.2% 43.9% 540 323 564 438 598 254 3.0% 44.1%Regulatory Institutions 378 836 459 071 473 336 455 122 6.3% 36.7% 477 665 502 770 528 803 5.1% 38.5%Total 999 637 1 238 915 1 322 368 1 254 976 7.9% 100.0% 1 220 380 1 280 289 1 350 857 2.5% 100.0%Change to 2014 Budget estimate
(3) (74 505) (85 970) (85 994)
Economic classification Current payments 1 700 1 906 2 067 3 642 28.9% 0.2% 9 920 10 808 11 425 46.4% 0.7%Compensation of employees 1 500 1 696 1 846 2 834 23.6% 0.2% 8 562 8 944 9 457 49.4% 0.6%Goods and services 200 210 221 808 59.3% – 1 358 1 864 1 968 34.5% 0.1%of which: Administrative fees – – – – – – 40 44 44 – – Assets less than the capitalisation threshold – – – – – – 12 12 12 – – Catering: Departmental activities – – – – – – 40 44 44 – – Communication – – – – – – 124 132 140 – – Entertainment – – – – – – 2 – – – – Fleet services (including government motor transport)
– – – – – – 6 8 8 – –
Consumable supplies – – – – – – 32 32 36 – – Consumables: Stationery, printing and office supplies
– – – – – – 220 232 244 – –
Operating leases – – – – – – 32 36 36 – – Travel and subsistence 200 210 221 808 59.3% – 758 896 948 5.5% 0.1%Training and development – – – – – – 55 44 44 – – Operating payments – – – – – – 37 384 412 – – Transfers and subsidies 997 937 1 237 009 1 320 301 1 251 260 7.8% 99.8% 1 210 156 1 269 481 1 339 432 2.3% 99.3%Departmental agencies and accounts 854 137 1 021 565 1 063 731 1 024 092 6.2% 82.3% 1 037 229 1 087 388 1 148 234 3.9% 84.1%Public corporations and private enterprises 143 800 215 444 256 570 227 168 16.5% 17.5% 172 927 182 093 191 198 -5.6% 15.1%Payments for capital assets – – – 74 – – 304 – – -100.0% – Machinery and equipment – – – 74 – – 304 – – -100.0% – Total 999 637 1 238 915 1 322 368 1 254 976 7.9% 100.0% 1 220 380 1 280 289 1 350 857 2.5% 100.0%Proportion of total programme expenditure to vote expenditure
98.2% 98.5% 98.1% 99.0% – – 95.3% 95.2% 95.2% – –
Details of transfers and subsidies Departmental agencies and accounts Departmental agencies (non-business entities) Current 854 137 1 021 565 1 063 731 1 024 092 6.2% 82.3% 1 037 229 1 087 388 1 148 234 3.9% 84.1%Media Development and Diversity Agency 19 115 20 000 20 790 21 815 4.5% 1.7% 22 615 23 814 25 005 4.7% 1.8%Brand South Africa 140 089 154 779 160 434 167 686 6.2% 12.9% 173 160 181 186 194 300 5.0% 14.0%Government Communication and Information System
316 097 387 715 409 171 379 469 6.3% 31.0% 365 476 381 435 402 040 1.9% 29.9%
The Independent Communications Authority of South Africa
313 378 389 797 390 661 376 221 6.3% 30.5% 393 619 414 481 435 205 5.0% 31.7%
Film and Publication Board 65 458 69 274 82 675 78 901 6.4% 6.2% 82 359 86 472 91 684 5.1% 6.6%

2015 Estimates of National Expenditure
10
Table 3.12 Entity Oversight expenditure trends and estimates by subprogramme and economic classification Details of transfers and subsidies
Audited outcome Adjusted
appropriation
Averagegrowth
rate(%)
Expen-diture/Total:
Average(%)
Medium-term expenditure estimate
Averagegrowth
rate(%)
Expen-diture/Total:
Average(%)
R thousand 2011/12 2012/13 2013/14 2014/15 2011/12 - 2014/15 2015/16 2016/17 2017/18 2014/15 - 2017/18 Public corporations and private enterprises Public corporations Other transfers to public corporations Current 143 800 215 444 256 570 227 168 16.5% 17.5% 172 927 182 093 191 198 -5.6% 15.1%South African Broadcasting Corporation: Channel Africa
41 230 43 292 44 673 47 413 4.8% 3.7% 49 640 52 271 54 885 5.0% 4.0%
South African Broadcasting Corporation: Public Broadcaster
84 907 154 152 127 055 97 199 4.6% 9.6% 101 785 107 180 112 539 5.0% 8.2%
South African Broadcasting Corporation: Community radio stations
7 663 8 000 8 842 9 373 6.9% 0.7% 9 804 10 324 10 840 5.0% 0.8%
South African Broadcasting Corporation: Programme productions
10 000 10 000 – 11 183 3.8% 0.6% 11 698 12 318 12 934 5.0% 0.9%
South African Broadcasting Corporation: Broadcasting digital migration
– – 76 000 62 000 – 2.9% – – – -100.0% 1.2%
Personnel information
Table 3.13 Entity Oversight personnel numbers and cost by salary level¹
Number of posts estimated for
31 March 2015 Number and cost2 of personnel posts filled / planned for on funded establishment Number
Number of
funded posts
Number of posts
additional to the
establishment Actual Revised estimate
Medium-term expenditure estimate
Averagegrowth
rate(%)
Salary level/total:
Average(%)
2013/14 2014/15 2015/16 2016/17 2017/18 2014/15 - 2017/18
Entity Oversight
Number Cost Unit Cost
Number Cost
Unit Cost
Number Cost
Unit Cost
Number Cost
Unit Cost
Number Cost
Unit Cost
Salary level 77 – 3 1.8 0.6 4 2.8 0.7 77 8.6 0.1 77 8.9 0.1 77 9.5 0.1 168.0% 100.0%
1 – 6 – – – – – – – – – 0.7 – – 0.7 – – 0.8 – – – 7 – 10 31 – 1 0.3 0.3 1 0.3 0.3 31 0.3 0.0 31 0.3 0.0 31 0.4 0.0 214.1% 40.0%11 – 12 28 – 1 0.7 0.7 1 0.7 0.7 28 1.3 0.0 28 1.4 0.0 28 1.4 0.1 203.7% 36.2%13 – 16 18 – 1 0.9 0.9 2 1.9 0.9 18 6.3 0.3 18 6.5 0.4 18 6.9 0.4 108.0% 23.8%1. Data has been provided by the department and may not necessarily reconcile with official government personnel data. 2. Rand million.
Other departments within the vote
Government Communication and Information System
Table 3.14 Budget summary 2015/16 2016/17 2017/18
R million Total Current
payments Transfers and
subsidies Payments for capital assets Total Total
MTEF allocation Administration 139.8 139.4 – 0.3 145.8 153.5Content Processing and Dissemination
86.6 86.4 – 0.1 91.1 95.4
Intergovernmental Coordination and Stakeholder Management
94.7 94.5 – 0.2 99.5 105.2
Communication Service Agency 44.3 44.1 – 0.2 45.1 48.1Total expenditure estimates 365.5 364.5 0.1 0.9 381.4 402.0Executive authority Minister of Communications Accounting officer Director General of Government Communication and Information System Website address www.gcis.gov.za The Estimates of National Expenditure e-publications for individual votes are available on www.treasury.gov.za. These publications provide more comprehensive coverage of vote specific information, particularly about goods and services, transfers and subsidies, personnel, public entities, donor funding, public private partnerships, conditional allocations to provinces and municipalities and expenditure information at the level of service delivery, where appropriate.
Department purpose Provide a comprehensive communication service on behalf of government to facilitate the involvement of the majority of South Africans in governance, reconstruction and development, nation building, and reconciliation.
Mandate The Department of Government Communication and Information System’s mandate is derived from section 195(g) of the Constitution of South Africa (1996), which stipulates that the public should be provided

Vote 3: Communications
11
with information that is timely, accurate and accessible. This is in support of the constitutional principles of freedom of expression, and transparency and openness of government. The department is accordingly mandated to: develop overarching communication policies and strategies for government; disseminate information, publicity and marketing on government programmes; and promote an informed citizenry through facilitating integrated, coordinated and clear communication between government and South African citizens, to enable citizens to be involved in the country’s transformation.
Selected performance indicators
Table 3.15 Performance indicators by programme and related outcome Indicator Programme Outcome Past Current Projections
2011/12 2012/13 2013/14 2014/15 2015/16 2016/17 2017/18 Number of cluster reports on perceptions of government delivery and performance reports issued per year
Content Processing and Dissemination
Outcome 12: An efficient, effective and development-oriented public service
–1 35 14 14 14 14 14
Number of copies of Vuk'uzenzele newspaper published per year
Content Processing and Dissemination
18.5 million 20.7 million 21 million 20.4 million 20.4 million 20.4 million 20.4 million
Number of media briefing requests per year
Intergovernmental Coordination and Stakeholder Management
68 93 22 100 100 100 100
Number of community and stakeholder liaison visits per year
Intergovernmental Coordination and Stakeholder Management
4 516 3 588 3 588 2 750 1 800 1 800 1 800
Number of development communication projects aligned to the government communication programme per year
Intergovernmental Coordination and Stakeholder Management
3 200 3 010 2 184 1 806 1 200 1 200 1 200
Number of rapid response facilitated reports per year
Intergovernmental Coordination and Stakeholder Management
–1 337 301 311 311 311 311
Number of marketing events per Thusong service centre per year
Intergovernmental Coordination and Stakeholder Management
170 519 484 486 486 486 486
Number of radio advertisements and dramas produced per year
Communication Service Agency
51 42 51 48 100 48 48
Number of video programmes produced per year
Communication Service Agency
30 316 383 120 120 120 120
Number of requests for photographic coverage handled per year
Communication Service Agency
553 926 819 500 500 500 500
Number of live broadcasts on community radio stations per year
Communication Service Agency
114 205 70 54 54 54 54
Number of government and national events covered on video per year
Communication Service Agency
386 341 540 400 400 400 400
Number of graphic designs produced per year
Communication Service Agency
254 359 315 160 160 160 160
1. Indicators with limited or no historical information were introduced in 2012/13.
Expenditure analysis The national development plan rallies South Africans towards a common goal of being active in their own development and working towards building a capable and developmental state. The Government Communication and Information System supports the achievement of this goal by facilitating a two-way interaction between government and the citizenry. The department provides information about government policies, plans, programmes and activities, thus empowering citizens to take advantage of government programmes and to hold government accountable. The interactions contribute to outcome 12 (an efficient, effective and development oriented public service) and outcome 14 (nation building and social cohesion) of government’s 2014-2019 medium term strategic framework. In addition, the department’s medium term and annual programmes are guided by the 2014-2019 national communication strategic framework.
Cabinet approved budget reductions of R33.8 million over the medium term are to be effected mainly on operating leases for office accommodation costs, operating payments mainly for printing and publication costs, and travel and subsistence. In accordance with the reorganisation of some national departments announced by the president in May 2014, some of the department’s budget, mainly its personnel budget, will be retained in the reconstituted Department of Communications.

2015 Estimates of National Expenditure
12
As the department’s work is labour intensive, requiring personnel to write, interact and advise on communication content, compensation of employees is a significant spending item, set to comprise 48.8 per cent of the department’s budget over the medium term. The department is expected to have 432 funded posts over the medium term.
The department will focus over the medium term on coordinating and professionalising government communication and making it as cost effective as possible.
Coordinating and professionalising government communication
The Government Communication and Information System will work with other government departments to implement the national communication strategy and intensify the implementation of the national development plan. The department will work with key individual departments as well as with the clusters. It will work in all three spheres of government, and support government’s transversal communication campaigns, such as 16 Days of Activism for No Violence Against Women and Children, the state of the nation address, and National Disability Rights Awareness Month, among others. It will also provide communication support on national days. These campaigns contribute to nation building and social cohesion.
The department will support the national development plan priority of a capable and developmental state by extending and strengthening provincial and district communication forums. These forums are hubs for driving government communication programmes and processes in the different spheres. The hubs serve to cascade downwards content that is derived largely from the national communication strategy. They also develop the capacity of government communicators and deal with the coordination and management of communication programmes, such as the various imbizo programmes. There are 84 forums, and a further 25 planned.
In partnership with the National School of Government, over the medium term the department will provide content for training courses and identify, coordinate and implement training programmes for government communicators.
Providing cost effective communication
The Government Communication and Information System has been assigned the responsibility for advertising government vacancies in a cost effective, centralised way, using Vuk’uzenzele, the government newspaper. The newspaper is published in all South African languages, including Braille, and is aimed at rural and semi-urban people. It is the most widely distributed government publication. Due to the high demand for government information, the department intends to increase the projected print run of 20.4 million copies per year to 48 million copies per year over the MTEF period. Currently, Vuk’uzenzele is published monthly, but the department plans to enable a fortnightly print run of 2 million copies per month in 2015/16, increasing to 4 million per month by 2017/18. These increases, however, will depend on funding. In 2015/16, working with National Treasury, the department will explore a funding model for Vuk’uzenzele, which it expects to conclude over the medium term. The growth rate of expenditure on Vuk’uzenzele could increase as the department begins providing advertisements for vacancies.
The department has, in some instances, replaced its established marketing modes for government events with alternatives modes, such as social media. The department will explore working more closely with community based media to maximise limited resources to gain access to its target audience.

Vote 3: Communications
13
Expenditure trends
Table 3.16 Departmental expenditure trends by programme and economic classification Programmes 1. Administration 2. Content Processing and Dissemination 3. Intergovernmental Coordination and Stakeholder Management 4. Communication Service Agency Programme
Ann
ual b
udge
t
Adj
uste
d
appr
opria
tion
Aud
ited
ou
tcom
e
Ann
ual b
udge
t
Adj
uste
d
appr
opria
tion
Aud
ited
ou
tcom
e
Ann
ual b
udge
t
Adj
uste
d
appr
opria
tion
Aud
ited
ou
tcom
e
Ann
ual b
udge
t
Adj
uste
d
appr
opria
tion
Rev
ised
es
timat
e
Out
com
e/A
nnua
l bu
dget
Ave
rage
(%
)
Out
com
e/A
djus
ted
ap
prop
riatio
n
Ave
rage
(%
)
R million 2011/12 2012/13 2013/14 2014/15 2011/12 - 2014/15 Programme 1 113.2 122.5 97.5 170.8 192.6 149.2 132.6 181.4 178.8 141.4 135.5 141.4 101.6% 89.7%Programme 2 96.0 99.5 92.0 109.1 94.9 82.2 97.0 89.3 78.3 99.9 90.3 97.9 87.2% 93.7%Programme 3 118.6 113.8 90.6 116.5 126.1 105.5 120.0 118.2 99.4 121.7 99.3 121.7 87.5% 91.2%Programme 4 28.5 28.5 36.1 32.6 47.4 51.0 47.2 48.2 52.7 50.1 54.4 52.1 121.1% 107.5%Total 356.3 364.3 316.2 429.1 461.0 387.7 396.7 437.2 409.2 413.1 379.5 413.1 95.7% 92.9%Change to 2014 Budget estimate
(33.6)
Economic classification Current payments 334.8 342.8 308.2 405.6 427.5 332.2 374.3 367.5 362.2 388.0 375.5 387.3 92.5% 91.8%Compensation of employees
165.4 166.9 152.0 176.4 178.3 165.1 188.4 178.1 171.3 200.1 188.3 200.1 94.3% 96.8%
Goods and services 169.3 175.8 156.2 229.3 249.3 167.1 185.9 189.4 190.9 187.9 187.2 187.2 90.8% 87.5%of which: Communication 8.0 8.6 10.0 8.5 9.2 12.5 10.9 10.4 14.2 12.8 12.6 12.6 122.5% 120.9%Computer services 13.3 13.1 11.1 14.3 14.2 15.2 16.0 15.0 15.3 15.4 16.1 16.1 97.8% 98.9%Agency and support / outsourced services
9.6 9.7 5.5 21.7 11.0 9.2 9.4 8.9 8.1 11.8 10.9 10.9 64.1% 83.4%
Operating leases 32.9 32.2 14.0 37.9 33.9 12.4 35.4 35.6 39.4 39.3 40.0 40.0 72.7% 74.7%Travel and subsistence 19.3 19.6 20.0 21.3 19.5 20.8 23.1 18.5 19.5 19.7 19.4 19.4 95.5% 103.4%Operating payments 40.0 40.2 39.4 41.8 43.5 41.2 42.9 42.1 41.2 43.2 45.3 45.3 99.5% 97.7%Transfers and subsidies
19.1 19.1 0.3 20.0 20.0 0.7 20.8 21.1 0.8 21.8 0.0 21.8 29.1% 39.4%
Departmental agencies and accounts
19.1 19.1 0.1 20.0 20.0 0.1 20.8 20.8 0.0 21.8 – 21.8 26.9% 36.7%
Households – – 0.3 – – 0.7 – 0.3 0.8 – – – – 554.2%Payments for capital assets
2.4 2.4 7.6 3.4 13.4 54.7 1.6 38.0 46.0 3.3 3.9 3.9 1046.9% 194.4%
Buildings and other fixed structures
– – – – 10.0 40.7 – 36.1 26.2 – – – – 145.2%
Machinery and equipment
2.1 2.1 7.1 2.7 2.7 13.9 1.3 1.6 19.7 3.0 3.7 3.7 488.6% 443.0%
Software and other intangible assets
0.4 0.4 0.5 0.7 0.7 0.1 0.3 0.3 – 0.3 0.3 0.3 55.0% 55.0%
Payments for financial assets
– – – – – – – – 0.1 – – – – –
Total 356.3 364.3 316.2 429.1 461.0 387.7 396.7 426.6 409.2 413.1 379.4 413.1 95.7% 93.6%
Expenditure estimates
Table 3.17 Departmental expenditure estimates by programme and economic classification Programmes 1. Administration
2. Content Processing and Dissemination 3. Intergovernmental Coordination and Stakeholder Management 4. Communication Service Agency Programme
Revised estimate
Averagegrowth
rate(%)
Expenditure/total:
Average(%) Medium-term expenditure estimate
Averagegrowth
rate(%)
Expenditure/total:
Average(%)
R million 2014/15 2011/12 - 2014/15 2015/16 2016/17 2017/18 2014/15 - 2017/18 Programme 1 141.4 4.9% 37.1% 139.8 145.8 153.5 2.8% 37.2%Programme 2 97.9 -0.5% 23.0% 86.6 91.1 95.4 -0.9% 23.7%Programme 3 121.7 2.2% 27.3% 94.7 99.5 105.2 -4.7% 27.0%Programme 4 52.1 22.3% 12.6% 44.3 45.1 48.1 -2.7% 12.1%Total 413.1 4.3% 100.0% 365.5 381.4 402.0 -0.9% 100.0%Change to 2014 Budget estimate
(6.5) (13.0) (14.3)

2015 Estimates of National Expenditure
14
Table 3.17 Departmental expenditure estimates by programme and economic classification Economic classification
Revised estimate
Average growth
rate (%)
Expenditure/total:
Average(%) Medium-term expenditure estimate
Average growth
rate (%)
Expenditure/total:
Average(%)
R million 2014/15 2011/12 - 2014/15 2015/16 2016/17 2017/18 2014/15 - 2017/18 Current payments 387.3 4.2% 91.1% 364.5 380.4 401.0 1.2% 98.2%Compensation of employees 200.1 6.2% 45.1% 210.0 221.7 233.5 5.3% 55.4%Goods and services 187.2 2.1% 46.0% 154.5 158.7 167.5 -3.6% 42.8%of which: Communication 12.6 13.5% 3.2% 8.4 8.6 8.5 -12.1% 2.4%Computer services 16.1 7.1% 3.8% 12.5 15.4 15.4 -1.4% 3.8%Agency and support / outsourced services
10.9 4.1% 2.2% 6.7 7.5 8.3 -8.5% 2.1%
Operating leases 40.0 7.5% 6.9% 48.0 47.7 50.2 7.9% 11.9%Travel and subsistence 19.4 -0.4% 5.2% 17.4 17.9 19.8 0.6% 4.8%Operating payments 45.3 4.1% 10.9% 35.3 35.6 37.2 -6.3% 9.8%Transfers and subsidies 21.8 4.5% 1.6% 0.1 0.1 0.1 -86.4% 1.4%Departmental agencies and accounts
21.8 4.5% 1.4% 0.1 0.1 0.1 -86.4% 1.4%
Payments for capital assets 3.9 17.4% 7.4% 0.9 1.0 1.0 -36.2% 0.4%Machinery and equipment 3.7 21.2% 2.9% 0.7 0.7 0.8 -40.0% 0.4%Software and other intangible assets 0.3 -11.4% 0.1% 0.2 0.2 0.2 -3.9% 0.1%Total 413.1 4.3% 100.0% 365.5 381.4 402.0 -0.9% 100.0%
Personnel information
Table 3.18 Departmental personnel numbers and cost by salary level and programme1 Programmes 1. Administration 2. Content Processing and Dissemination 3. Intergovernmental Coordination and Stakeholder Management 4. Communication Service Agency
Number of posts estimated for 31 March 2015 Number and cost2 of personnel posts filled / planned for on funded establishment Number
Number of
funded posts
Number of posts
additional to the
establishment Actual Revised estimate Medium-term expenditure estimate
Averagegrowth
rate(%)
Salary level/total:
Average(%)
2013/14 2014/15 2015/16 2016/17 2017/18 2014/15 - 2017/18 Government Communication and Information System
Number Cost
Unit Cost
Number Cost
Unit Cost
Number Cost
Unit Cost
Number Cost
Unit Cost
Number Cost
Unit Cost
Salary level 490 55 474 171.3 0.4 477 188.3 0.4 432 210.0 0.5 431 221.7 0.5 432 233.5 0.5 -3.2% 100.0%1 – 6 116 14 110 19.5 0.2 112 24.3 0.2 101 23.0 0.2 101 24.6 0.2 101 25.9 0.3 -3.4% 23.4%7 – 10 218 14 206 64.1 0.3 210 67.9 0.3 202 79.8 0.4 202 84.4 0.4 202 89.1 0.4 -1.3% 46.0%11 – 12 80 1 88 42.5 0.5 80 48.4 0.6 80 53.3 0.7 80 55.9 0.7 80 58.9 0.7 – 18.1%13 – 16 51 1 47 44.3 0.9 50 46.7 0.9 49 53.9 1.1 48 56.8 1.2 49 59.6 1.2 -0.7% 11.1%Other 25 25 23 0.9 – 25 0.9 – – – – – – – – – – -100.0% 1.4%Programme 490 55 474 171.3 0.4 477 188.3 0.4 432 210.0 0.5 431 221.7 0.5 432 233.5 0.5 -3.2% 100.0%Programme 1 173 44 164 49.7 0.3 163 54.7 0.3 128 63.2 0.5 128 66.4 0.5 128 69.8 0.5 -7.7% 30.9%Programme 2 95 8 100 37.3 0.4 95 40.9 0.4 88 47.3 0.5 88 51.0 0.6 88 53.1 0.6 -2.5% 20.3%Programme 3 166 1 155 65.0 0.4 166 71.1 0.4 165 74.5 0.5 164 78.8 0.5 165 83.3 0.5 -0.2% 37.2%Programme 4 56 2 55 19.3 0.4 53 21.6 0.4 51 25.0 0.5 51 25.5 0.5 51 27.3 0.5 -1.3% 11.6%1. Data has been provided by the department and may not necessarily reconcile with official government personnel data. 2. Rand million.
Departmental receipts
Table 3.19 Departmental receipts by economic classification
Audited outcome Adjusted estimate
Revised estimate
Averagegrowth
rate (%)
Receipt item/total:
Average(%) Medium-term receipts estimate
Averagegrowth
rate (%)
Receipt item/total:
Average(%)
R thousand 2011/12 2012/13 2013/14 2014/15 2011/12 - 2014/15 2015/16 2016/17 2017/18 2014/15 - 2017/18 Departmental receipts 948 1 013 794 803 – -100.0% 100.0% 814 814 814 – 100.0%Sales of goods and services produced by department 213 405 225 321 – -100.0% 30.6% 332 332 332 – 40.8%Other sales 213 405 225 321 – -100.0% 30.6% 332 332 332 – 40.8%of which: Commission on insurance
51 53 53 76 – -100.0% 5.7% 76 76 76 – 9.3%
Departmental publications
27 223 32 100 – -100.0% 10.2% 100 100 100 – 12.3%
Replacements of security cards
1 1 – – – -100.0% 0.1% – – – – –
Rental: Parking 134 128 140 145 – -100.0% 14.6% 156 156 156 – 19.2%

Vote 3: Communications
15
Table 3.19 Departmental receipts by economic classification Departmental receipts
Audited outcome Adjusted estimate
Revised estimate
Averagegrowth
rate (%)
Receipt item/total:
Average(%) Medium-term receipts estimate
Averagegrowth
rate (%)
Receipt item/total:
Average(%)
R thousand 2011/12 2012/13 2013/14 2014/15 2011/12 - 2014/15 2015/16 2016/17 2017/18 2014/15 - 2017/18 Sales of scrap, waste, arms and other used current goods
– – – 2 – – – 2 2 2 – 0.2%
of which: List item – – – 2 – – – 2 2 2 – 0.2%Interest, dividends and rent on land
352 118 79 122 – -100.0% 19.9% 122 122 122 – 15.0%
Interest 352 118 79 122 – -100.0% 19.9% 122 122 122 – 15.0%Transactions in financial assets and liabilities
383 490 490 358 – -100.0% 49.5% 358 358 358 – 44.0%
Total 948 1 013 794 803 – -100.0% 100.0% 814 814 814 – 100.0%
Programme 1: Administration
Programme purpose Provide strategic leadership, management and administrative support services to the department.
Expenditure trends and estimates
Table 3.20 Administration expenditure trends and estimates by subprogramme and economic classification Subprogramme
Audited outcome Adjusted
appropriation
Averagegrowth
rate(%)
Expen-diture/Total:
Average(%)
Medium-term expenditure estimate
Averagegrowth
rate(%)
Expen-diture/Total:
Average(%)
R thousand 2011/12 2012/13 2013/14 2014/15 2011/12 - 2014/15 2015/16 2016/17 2017/18 2014/15 - 2017/18 Departmental Management 7 771 7 796 6 391 7 271 -2.2% 5.2% 6 688 6 921 7 209 -0.3% 4.9%Corporate Services 42 827 50 596 48 411 53 179 7.5% 34.8% 48 660 53 240 55 167 1.2% 36.6%Financial Administration 27 868 70 187 75 210 26 294 -1.9% 35.6% 28 259 29 465 31 999 6.8% 20.2%Internal Audit 6 029 7 077 6 912 6 594 3.0% 4.7% 7 289 7 585 7 988 6.6% 5.1%Office Accommodation 12 991 13 498 41 905 42 180 48.1% 19.7% 48 932 48 571 51 089 6.6% 33.2%Total 97 486 149 154 178 829 135 518 11.6% 100.0% 139 828 145 782 153 452 4.2% 100.0%Change to 2014 Budget estimate
(5 870) (6 986) (9 662) (10 659)
Economic classification Current payments 94 444 96 062 134 207 133 650 12.3% 81.7% 139 436 145 369 153 018 4.6% 99.5%Compensation of employees 42 243 47 269 49 667 54 672 9.0% 34.6% 63 228 66 401 69 777 8.5% 44.2%Goods and services 52 201 48 793 84 540 78 978 14.8% 47.2% 76 208 78 968 83 241 1.8% 55.2%of which: Administrative fees 123 241 180 228 22.8% 0.1% 253 184 186 -6.6% 0.1%Advertising 1 077 348 806 841 -7.9% 0.5% 479 431 454 -18.6% 0.4%Assets less than the capitalisation threshold 644 255 5 682 55 -56.0% 1.2% 20 4 4 -58.3% – Audit costs: External 1 911 1 860 2 467 1 999 1.5% 1.5% 1 800 1 807 1 828 -2.9% 1.3%Bursaries: Employees 445 372 301 500 4.0% 0.3% 450 475 500 – 0.3%Catering: Departmental activities 367 513 445 251 -11.9% 0.3% 31 55 56 -39.3% 0.1%Communication 2 741 2 546 2 916 2 300 -5.7% 1.9% 1 261 1 256 1 291 -17.5% 1.1%Computer services 8 611 12 232 11 893 11 371 9.7% 7.9% 9 428 11 887 11 662 0.8% 7.7%Consultants and professional services: Business and advisory services
167 95 322 133 -7.3% 0.1% 80 80 83 -14.5% 0.1%
Consultants and professional services: Legal costs 4 238 1 847 591 706 -45.0% 1.3% 107 143 149 -40.5% 0.2%Contractors 5 485 769 2 763 2 123 -27.1% 2.0% 1 549 2 405 2 515 5.8% 1.5%Agency and support / outsourced services 255 902 169 836 48.6% 0.4% 355 375 394 -22.2% 0.3%Fleet services (including government motor transport)
167 226 165 131 -7.8% 0.1% 37 99 100 -8.6% 0.1%
Consumable supplies 675 488 907 816 6.5% 0.5% 270 519 525 -13.7% 0.4%Consumables: Stationery, printing and office supplies
972 1 052 1 397 1 567 17.3% 0.9% 902 874 393 -36.9% 0.7%
Operating leases 12 743 10 904 38 349 39 151 45.4% 18.0% 47 167 47 022 49 439 8.1% 31.8%Property payments 2 320 4 973 6 787 6 789 43.0% 3.7% 6 381 4 839 6 852 0.3% 4.3%Travel and subsistence 4 036 4 277 4 006 4 475 3.5% 3.0% 2 523 2 738 3 141 -11.1% 2.2%Training and development 1 707 1 591 1 563 2 402 12.1% 1.3% 900 1 460 1 231 -20.0% 1.0%Operating payments 2 691 2 103 2 493 2 302 -5.1% 1.7% 2 215 2 315 2 438 1.9% 1.6%Venues and facilities 826 811 293 – -100.0% 0.3% – – – – – Rental and hiring – 388 45 2 – 0.1% – – – -100.0% – Transfers and subsidies 120 244 304 568 67.9% 0.2% 44 46 48 -56.1% 0.1%Departmental agencies and accounts 44 10 38 565 134.2% 0.1% 44 46 48 -56.0% 0.1%Households 76 234 266 3 -66.0% 0.1% – – – -100.0% – Payments for capital assets 2 903 52 831 44 317 1 300 -23.5% 18.1% 348 367 386 -33.3% 0.4%Buildings and other fixed structures – 40 679 26 224 – – 11.9% – – – – – Machinery and equipment 2 414 12 071 18 093 1 300 -18.6% 6.0% 348 367 386 -33.3% 0.4%Software and other intangible assets 489 81 – – -100.0% 0.1% – – – – – Payments for financial assets 19 17 1 – -100.0% – – – – – – Total 97 486 149 154 178 829 135 518 11.6% 100.0% 139 828 145 782 153 452 4.2% 100.0%Proportion of total programme expenditure to vote expenditure
30.8% 38.5% 43.7% 35.7% – – 38.3% 38.2% 38.2% – –

2015 Estimates of National Expenditure
16
Table 3.20 Administration expenditure trends and estimates by subprogramme and economic classification Details of transfers and subsidies
Audited outcome Adjusted
appropriation
Averagegrowth
rate(%)
Expen-diture/Total:
Average(%)
Medium-term expenditure estimate
Averagegrowth
rate(%)
Expen-diture/Total:
Average(%)
R thousand 2011/12 2012/13 2013/14 2014/15 2011/12 - 2014/15 2015/16 2016/17 2017/18 2014/15 - 2017/18 Households Social benefits Current 76 234 266 3 -66.0% 0.1% – – – -100.0% – Employee social benefits 76 234 266 3 -66.0% 0.1% – – – -100.0% – Departmental agencies and accounts Departmental agencies (non-business entities)
Current 44 10 38 565 134.2% 0.1% 44 46 48 -56.0% 0.1%Communication 44 10 38 35 -7.3% – 44 46 48 11.1% – Public Service Sector Education and Authority
– – – 530 – 0.1% – – – -100.0% 0.1%
Personnel information
Table 3.21 Administration personnel numbers and cost by salary level¹
Number of posts estimated for
31 March 2015 Number and cost2 of personnel posts filled / planned for on funded establishment Number
Number of
funded posts
Number of posts
additional to the
establishment Actual Revised estimate
Medium-term expenditure estimate
Averagegrowth
rate(%)
Salary level/total:
Average(%)
2013/14 2014/15 2015/16 2016/17 2017/18 2014/15 - 2017/18
Administration
Number Cost Unit Cost
Number Cost
Unit Cost
Number Cost
Unit Cost
Number Cost
Unit Cost
Number Cost
Unit Cost
Salary level 173 44 164 49.7 0.3 163 54.7 0.3 128 63.2 0.5 128 66.4 0.5 128 69.8 0.5 -7.7% 100.0%1 – 6 58 13 54 8.9 0.2 55 13.4 0.2 45 11.2 0.2 45 12.1 0.3 45 12.7 0.3 -6.5% 34.7%7 – 10 52 5 49 14.5 0.3 46 12.0 0.3 46 17.7 0.4 46 18.0 0.4 46 19.2 0.4 – 33.6%11 – 12 21 – 24 11.8 0.5 21 12.5 0.6 21 15.6 0.7 21 16.9 0.8 21 17.6 0.8 – 15.4%13 – 16 17 1 14 13.5 1.0 16 15.9 1.0 16 18.7 1.2 16 19.4 1.2 16 20.2 1.3 – 11.7%Other 25 25 23 0.9 – 25 0.9 – – – – – – – – – – -100.0% 4.6%1. Data has been provided by the department and may not necessarily reconcile with official government personnel data. 2. Rand million.
Programme 2: Content Processing and Dissemination
Programme purpose Provide strategic leadership in government communication to ensure coherence, coordination, consistency, quality, impact and responsiveness of government communication.
Objectives
• Provide strategic leadership and support in government communication through public opinion research and analysis of media coverage to understand the communication environment and inform government messages, over the MTEF period.
• Enhance government’s communication products and services to grow the share of government’s voice and messages in the public domain, over the MTEF period.
Subprogrammes
• Programme Management for Content Processing and Dissemination coordinates strategic planning for communication in the department and other government departments, and ensures adherence to government communication standards.
• Policy and Research conducts research to assess how government should better address the public’s communication needs; monitors national and international media coverage relating to government programmes and campaigns; provides analyses on media interpretation of government policies and programmes; formulates policy proposals where required; proposes government responses to media related issues; and assesses public perceptions in relation to government performance.
• Products and Platforms develops information products and communication platforms that enable government to communicate directly to citizens and public servants; and is responsible for the development of the government communication strategy.

Vote 3: Communications
17
Expenditure trends and estimates Table 3.22 Content Processing and Dissemination expenditure trends and estimates by subprogramme and economic classification Subprogramme
Audited outcome Adjusted
appropriation
Averagegrowth
rate(%)
Expen-diture/Total:
Average(%)
Medium-term expenditure estimate
Averagegrowth
rate(%)
Expen-diture/Total:
Average(%)
R thousand 2011/12 2012/13 2013/14 2014/15 2011/12 - 2014/15 2015/16 2016/17 2017/18 2014/15 - 2017/18 Programme Management for Content Processing and Dissemination 3 410 2 491 2 481 3 015 -4.0% 3.3% 3 290 3 465 3 643 6.5% 3.7%Policy and Research 27 468 29 260 28 259 33 478 6.8% 34.6% 31 554 34 491 35 676 2.1% 37.2%Products and Platforms 61 129 50 399 47 538 53 829 -4.2% 62.1% 51 743 53 109 56 048 1.4% 59.1%Total 92 007 82 150 78 278 90 322 -0.6% 100.0% 86 587 91 065 95 367 1.8% 100.0%Change to 2014 Budget estimate
(9 606) (17 383) (19 038) (20 907)
Economic classification Current payments 90 924 81 568 77 710 89 799 -0.4% 99.2% 86 447 90 928 95 212 2.0% 99.7%Compensation of employees 35 282 34 988 37 315 40 864 5.0% 43.3% 47 270 51 048 53 108 9.1% 52.9%Goods and services 55 642 46 580 40 395 48 935 -4.2% 55.9% 39 177 39 880 42 104 -4.9% 46.8%of which: Administrative fees 37 47 42 48 9.1% 0.1% 41 39 43 -3.6% – Advertising 1 044 870 1 588 5 -83.1% 1.0% 10 10 11 30.1% – Assets less than the capitalisation threshold 163 68 62 336 27.3% 0.2% 20 (21) (24) -141.5% 0.1%Catering: Departmental activities 56 61 75 208 54.9% 0.1% 102 97 100 -21.7% 0.1%Communication 1 003 1 634 853 1 140 4.4% 1.4% 1 042 1 070 1 127 -0.4% 1.2%Computer services 2 481 2 582 2 854 4 296 20.1% 3.6% 2 635 3 118 3 314 -8.3% 3.7%Consultants and professional services: Business and advisory services
1 108 921 966 1 085 -0.7% 1.2% 1 180 198 163 -46.8% 0.7%
Consultants and professional services: Legal costs
– 996 – 30 – 0.3% – – – -100.0% –
Contractors 916 621 276 467 -20.1% 0.7% 150 (15) (24) -137.2% 0.2%Agency and support / outsourced services 5 225 7 830 7 932 9 653 22.7% 8.9% 6 332 7 140 7 955 -6.2% 8.6%Fleet services (including government motor transport)
33 53 11 31 -2.1% – 26 24 25 -6.9% –
Consumable supplies 83 85 101 125 14.6% 0.1% 98 12 9 -58.4% 0.1%Consumables: Stationery, printing and office supplies
4 241 1 630 554 3 064 -10.3% 2.8% 838 1 609 1 735 -17.3% 2.0%
Operating leases 905 1 011 511 204 -39.1% 0.8% 215 219 232 4.4% 0.2%Property payments 104 118 28 – -100.0% 0.1% – – – – – Travel and subsistence 2 473 2 225 2 125 2 818 4.4% 2.8% 1 894 1 839 1 933 -11.8% 2.3%Training and development 1 089 897 356 912 -5.7% 0.9% 300 103 71 -57.3% 0.4%Operating payments 34 206 24 679 21 962 24 144 -11.0% 30.6% 24 274 24 395 25 387 1.7% 27.0%Venues and facilities 475 252 99 369 -8.1% 0.3% 20 43 47 -49.7% 0.1%Transfers and subsidies 167 91 105 12 -58.4% 0.1% – – – -100.0% – Departmental agencies and accounts – 3 – – – – – – – – – Households 167 88 105 12 -58.4% 0.1% – – – -100.0% – Payments for capital assets 900 491 398 511 -17.2% 0.7% 140 137 155 -32.8% 0.3%Machinery and equipment 876 463 398 511 -16.4% 0.7% 140 137 155 -32.8% 0.3%Software and other intangible assets 24 28 – – -100.0% – – – – – – Payments for financial assets 16 – 65 – -100.0% – – – – – – Total 92 007 82 150 78 278 90 322 -0.6% 100.0% 86 587 91 065 95 367 1.8% 100.0%Proportion of total programme expenditure to vote expenditure
29.1% 21.2% 19.1% 23.8% – – 23.7% 23.9% 23.7% – –
Details of transfers and subsidies Households Social benefits Current 167 88 105 12 -58.4% 0.1% – – – -100.0% – Employee social benefits 167 88 105 12 -58.4% 0.1% – – – -100.0% – Departmental agencies and accounts Departmental agencies (non-business entities)
Current – 3 – – – – – – – – – Communication – 3 – – – – – – – – –

2015 Estimates of National Expenditure
18
Personnel information
Table 3.23 Content Processing and Dissemination personnel numbers and cost by salary level¹
Number of posts estimated for
31 March 2015 Number and cost2 of personnel posts filled / planned for on funded establishment Number
Number of
funded posts
Number of posts
additional to the
establishment Actual Revised estimate
Medium-term expenditure estimate
Averagegrowth
rate(%)
Salary level/total:
Average(%)
2013/14 2014/15 2015/16 2016/17 2017/18 2014/15 - 2017/18 Content Processing and Dissemination
Number Cost
Unit Cost
Number Cost
Unit Cost
Number Cost
Unit Cost
Number Cost
Unit Cost
Number Cost
Unit Cost
Salary level 95 8 100 37.3 0.4 95 40.9 0.4 88 47.3 0.5 88 51.0 0.6 88 53.1 0.6 -2.5% 100.0%1 – 6 12 – 13 2.9 0.2 12 2.7 0.2 12 2.8 0.2 12 2.9 0.2 12 3.1 0.3 – 13.4%7 – 10 48 7 48 11.7 0.2 48 12.5 0.3 41 17.8 0.4 41 19.4 0.5 41 20.0 0.5 -5.1% 47.6%11 – 12 24 1 28 12.7 0.5 24 14.9 0.6 24 14.9 0.6 24 15.9 0.7 24 16.6 0.7 – 26.7%13 – 16 11 – 11 10.1 0.9 11 10.7 1.0 11 11.8 1.1 11 12.9 1.2 11 13.5 1.2 – 12.3%1. Data has been provided by the department and may not necessarily reconcile with official government personnel data. 2. Rand million.
Programme 3: Intergovernmental Coordination and Stakeholder Management
Programme purpose Implement development communication through mediated and unmediated communication channels and foster sound stakeholder relations and partnerships.
Objectives
• Improve interdepartmental coordination by jointly planning and sharing communication messages across the three spheres of government to ensure coherence and alignment of government messages, over the MTEF period.
• Ensure an informed and empowered citizenry on government’s policies, plans, programmes and achievements to increase public participation in government’s activities, over the MTEF period.
• Implement a proactive media engagement system by building, maintaining and improving relations with the media and drive the government’s communication agenda, over the MTEF period.
Subprogrammes
• Programme Management for Intergovernmental Coordination and Stakeholder Management ensures a well functioning communication system that proactively informs and engages the public; and manages and oversees roles regarding the implementation of development communication. It does this by building sound stakeholder relations and partnerships, and ensuring that the public is informed about government policies and programmes.
• Provincial and Local Liaison ensures that the national communication strategy is presented to all provinces and aligned with provincial and local communication strategies; implements development communication campaigns and programmes aligned with the government communication programme; ensures that government departments send different print products and materials to Thusong Service Centres; and coordinates the imbizo programme of government.
• Media Engagement promotes and facilitates effective communication between government and the media, ensures effective liaison between ministers and the media, and leads and drives the communication of government’s programme of action and policies by building, maintaining and strengthening relations with the media.
• Cluster Supervision (Human Development, Social Protection and Governance and Administration) provides strategic cluster communication advice and support to national departments and leadership on key cluster communication issues and campaigns; and coordinates Cabinet cluster communications and the development of the government communications programme. It also develops communication strategies and key messages for the campaigns of the human development, social protection, and governance and administration clusters.
• Cluster Supervision (Economic and Infrastructure, Justice and International) provides strategic communication advice to the economic and infrastructure, justice and international clusters; supports national departments; provides leadership on key cluster communication issues and campaigns; coordinates

Vote 3: Communications
19
Cabinet cluster communications; and develops communication strategies and key messages for the campaigns of the clusters.
Expenditure trends and estimates
Table 3.24 Intergovernmental Coordination and Stakeholder Management expenditure trends and estimates by subprogramme and economic classification Subprogramme
Audited outcome Adjusted
appropriation
Averagegrowth
rate(%)
Expen-diture/Total:
Average(%)
Medium-term expenditure estimate
Averagegrowth
rate(%)
Expen-diture/Total:
Average(%)
R thousand 2011/12 2012/13 2013/14 2014/15 2011/12 - 2014/15 2015/16 2016/17 2017/18 2014/15 - 2017/18 Programme Management for Intergovernmental Coordination and Stakeholder Management 6 249 2 091 2 495 2 627 -25.1% 3.4% 2 577 2 782 2 925 3.6% 2.7%Provincial and Local Liaison 72 034 71 776 71 933 72 979 0.4% 73.1% 68 281 71 742 75 567 1.2% 72.4%Media Engagement 12 314 12 844 12 876 14 144 4.7% 13.2% 13 922 14 488 15 635 3.4% 14.6%Cluster Supervision (Human Development, Social Protection and Governance and Administration)
– 14 916 8 426 4 935 – 7.2% 4 941 5 212 5 488 3.6% 5.2%
Cluster Supervision (Economic and Infrastructure, Justice and International)
– 3 833 3 676 4 573 – 3.1% 5 000 5 274 5 553 6.7% 5.1%
Total 90 597 105 460 99 406 99 258 3.1% 100.0% 94 721 99 498 105 168 1.9% 100.0%Change to 2014 Budget estimate
(22 396) (32 707) (35 666) (37 806)
Economic classification Current payments 88 216 104 368 98 784 98 528 3.8% 98.8% 94 529 99 304 104 963 2.1% 99.7%Compensation of employees 58 653 63 609 65 043 71 106 6.6% 65.5% 74 478 78 786 83 298 5.4% 77.2%Goods and services 29 563 40 759 33 741 27 422 -2.5% 33.3% 20 051 20 518 21 665 -7.6% 22.5%of which: Administrative fees 66 243 212 284 62.7% 0.2% 267 106 109 -27.3% 0.2%Advertising 4 010 7 315 4 801 1 759 -24.0% 4.5% 1 234 1 269 1 340 -8.7% 1.4%Assets less than the capitalisation threshold 363 1 304 117 208 -16.9% 0.5% 61 203 213 0.8% 0.2%Catering: Departmental activities 747 1 161 1 122 1 086 13.3% 1.0% 803 607 652 -15.6% 0.8%Communication 2 805 5 646 5 685 4 890 20.4% 4.8% 4 155 4 297 3 998 -6.5% 4.3%Computer services 10 – – – -100.0% – – 1 1 – – Consultants and professional services: Business and advisory services
241 52 18 45 -42.8% 0.1% 10 30 31 -11.7% –
Consultants and professional services: Legal costs
1 466 – 57 284.9% 0.1% – – – -100.0% –
Contractors 1 003 3 861 4 918 1 919 24.1% 3.0% 876 1 078 1 140 -15.9% 1.3%Agency and support / outsourced services 14 13 29 – -100.0% – – – – – – Fleet services (including government motor transport)
1 973 2 214 2 676 1 583 -7.1% 2.1% 1 266 1 003 1 074 -12.1% 1.2%
Consumable supplies 1 305 1 644 292 424 -31.3% 0.9% 194 253 276 -13.3% 0.3%Consumables: Stationery, printing and office supplies
811 622 695 985 6.7% 0.8% 823 695 715 -10.1% 0.8%
Operating leases 268 371 510 542 26.5% 0.4% 543 427 447 -6.2% 0.5%Property payments 106 106 73 148 11.8% 0.1% 124 100 105 -10.8% 0.1%Travel and subsistence 9 068 9 488 8 222 8 736 -1.2% 9.0% 7 161 7 866 8 803 0.3% 8.2%Training and development 1 669 450 269 808 -21.5% 0.8% 274 633 683 -5.4% 0.6%Operating payments 2 079 3 116 2 848 2 751 9.8% 2.7% 1 643 1 340 1 442 -19.4% 1.8%Venues and facilities 2 971 2 435 1 234 1 136 -27.4% 2.0% 455 576 600 -19.2% 0.7%Rental and hiring 53 252 20 61 4.8% 0.1% 162 34 36 -16.1% 0.1%Transfers and subsidies 26 313 285 39 14.5% 0.2% 9 7 7 -43.6% – Departmental agencies and accounts 8 43 9 9 4.0% – 9 7 7 -8.0% – Households 18 270 276 30 18.6% 0.2% – – – -100.0% – Payments for capital assets 2 343 779 269 691 -33.4% 1.0% 183 187 198 -34.1% 0.3%Machinery and equipment 2 343 779 269 691 -33.4% 1.0% 183 187 198 -34.1% 0.3%Payments for financial assets 12 – 68 – -100.0% – – – – – – Total 90 597 105 460 99 406 99 258 3.1% 100.0% 94 721 99 498 105 168 1.9% 100.0%Proportion of total programme expenditure to vote expenditure
28.7% 27.2% 24.3% 26.2% – – 25.9% 26.1% 26.2% – –
Details of transfers and subsidies Households Social benefits Current 18 270 276 30 18.6% 0.2% – – – -100.0% – Employee social benefits 18 260 276 30 18.6% 0.1% – – – -100.0% – Communication – 10 – – – – – – – – – Departmental agencies and accounts Departmental agencies (non-business entities) Current 8 43 9 9 4.0% – 9 7 7 -8.0% – Communication 8 43 9 9 4.0% – 9 7 7 -8.0% –

2015 Estimates of National Expenditure
20
Personnel information
Table 3.25 Intergovernmental Coordination and Stakeholder Management personnel numbers and cost by salary level¹
Number of posts estimated for
31 March 2015 Number and cost2 of personnel posts filled / planned for on funded establishment Number
Number of
funded posts
Number of posts
additional to the
establishment Actual Revised estimate
Medium-term expenditure estimate
Averagegrowth
rate(%)
Salary level/total:
Average(%)
2013/14 2014/15 2015/16 2016/17 2017/18 2014/15 - 2017/18 Intergovernmental Coordination and Stakeholder Management
Number Cost
Unit Cost
Number Cost
Unit Cost
Number Cost
Unit Cost
Number Cost
Unit Cost
Number Cost
Unit Cost
Salary level 166 1 155 65.0 0.4 166 71.1 0.4 165 74.5 0.5 164 78.8 0.5 165 83.3 0.5 -0.2% 100.0%1 – 6 34 – 30 5.3 0.2 34 6.1 0.2 34 6.7 0.2 34 7.0 0.2 34 7.4 0.2 – 20.6%7 – 10 89 1 85 30.0 0.4 89 33.8 0.4 88 33.1 0.4 88 35.2 0.4 88 37.5 0.4 -0.4% 53.5%11 – 12 24 – 23 11.9 0.5 24 14.7 0.6 24 15.1 0.6 24 16.0 0.7 24 16.7 0.7 – 14.5%13 – 16 19 – 17 17.8 1.0 19 16.5 0.9 19 19.6 1.0 18 20.5 1.1 19 21.6 1.1 – 11.4%1. Data has been provided by the department and may not necessarily reconcile with official government personnel data. 2. Rand million.
Programme 4: Communication Service Agency
Programme purpose
Provide media bulk buying services and media production services to national government.
Objectives
• Provide effective and efficient communication services through: – cost effective media bulk-buying services for government by implementing all approved media-buying
campaigns, on an ongoing basis – the production of high quality television commercials, video footage, photographs, radio commercials and
programmes, print advertisements and graphic designs for client departments, as and when required – the provision of effective and efficient marketing and distribution services for government, which
includes conducting 9 public sector manager forums annually over the MTEF period.
• Maintain a positive image of government and that of the state through managing government’s corporate identity by conducting 10 corporate identity workshops annually over the MTEF period.
• Inform the public of developments in government’s programmes by conducting community phone-in radio programmes on government’s programmes, and documenting the public programmes of the Presidency, both domestically and internationally, on video and in photographs, to profile the work of government as and when required.
• Ensure that government’s communication products reach the intended audience in a timely manner by providing distribution services as and when needed.
Subprogrammes
• Marketing, Advertising and Media Buying provides media buying expertise; develops effective marketing, distribution and public relations and event management strategies for the department’s products; manages and drives the distribution strategy of all the products produced for dissemination to the public; oversees the outsourcing of distribution services to service providers; and manages the corporate identity of government.
• Media Production provides for the production of videos, photographs and radio programmes in support of government communication programmes; and provides product development services to government.

Vote 3: Communications
21
Expenditure trends and estimates
Table 3.26 Communication Service Agency expenditure trends and estimates by subprogramme and economic classification Subprogramme
Audited outcome Adjusted
appropriation
Averagegrowth
rate(%)
Expen-diture/Total:
Average(%)
Medium-term expenditure estimate
Averagegrowth
rate(%)
Expen-diture/Total:
Average(%)
R thousand 2011/12 2012/13 2013/14 2014/15 2011/12 - 2014/15 2015/16 2016/17 2017/18 2014/15 - 2017/18 Marketing, Advertising and Media Buying 17 033 32 565 28 095 33 182 24.9% 57.1% 21 815 23 015 24 612 -9.5% 53.5%Media Production 19 064 18 386 24 563 21 189 3.6% 42.9% 22 525 22 075 23 441 3.4% 46.5%Total 36 097 50 951 52 658 54 371 14.6% 100.0% 44 340 45 090 48 053 -4.0% 100.0%
Change to 2014 Budget estimate
4 272 (8 209) (10 551) (10 074)
Economic classification Current payments 34 579 50 214 51 526 52 848 15.2% 97.5% 44 094 44 830 47 780 -3.3% 98.8%Compensation of employees 15 803 19 238 19 270 21 643 11.1% 39.1% 25 047 25 464 27 267 8.0% 51.8%Goods and services 18 776 30 976 32 256 31 205 18.5% 58.3% 19 047 19 366 20 513 -13.1% 47.0%of which: Administrative fees 42 86 144 109 37.4% 0.2% 113 120 125 4.7% 0.2%Advertising 8 690 9 614 5 062 8 263 -1.7% 16.3% 2 305 2 432 2 561 -32.3% 8.1%Assets less than the capitalisation threshold 166 120 103 77 -22.6% 0.2% – – – -100.0% – Bursaries: Employees – – 1 – – – – – – – – Catering: Departmental activities 37 37 41 46 7.5% 0.1% 246 259 274 81.3% 0.4%Communication 3 464 2 638 4 752 3 784 3.0% 7.5% 1 908 2 003 2 120 -17.6% 5.1%Computer services 3 389 580 407 413.8% 0.7% 410 433 455 3.8% 0.9%Consultants and professional services: Business and advisory services
– 4 – – – – – – – – –
Consultants and professional services: Legal costs
– 170 – 15 – 0.1% – – – -100.0% –
Contractors 285 227 601 620 29.6% 0.9% 212 224 224 -28.8% 0.7%Agency and support / outsourced services – 465 – – – 0.2% – – – – – Fleet services (including government motor transport)
68 50 83 66 -1.0% 0.1% 68 72 76 4.8% 0.1%
Consumable supplies 113 173 202 93 -6.3% 0.3% 133 141 148 16.8% 0.3%Consumables: Stationery, printing and office supplies
570 438 1 236 525 -2.7% 1.4% 361 381 401 -8.6% 0.9%
Operating leases 126 78 67 76 -15.5% 0.2% 76 80 84 3.4% 0.2%Property payments – – – – – – 2 – – – – Travel and subsistence 4 438 4 824 5 112 3 389 -8.6% 9.2% 5 869 5 472 5 885 20.2% 10.7%Training and development 208 278 298 314 14.7% 0.6% 155 164 172 -18.2% 0.4%Operating payments 410 11 323 13 922 13 391 219.7% 20.1% 7 139 7 534 7 933 -16.0% 18.8%Venues and facilities 156 27 35 30 -42.3% 0.1% 50 51 55 22.4% 0.1%Rental and hiring – 35 17 – – – – – – – – Transfers and subsidies 35 96 142 – -100.0% 0.1% – – – – – Departmental agencies and accounts – 5 – – – – – – – – – Households 35 91 142 – -100.0% 0.1% – – – – – Payments for capital assets 1 483 626 983 1 523 0.9% 2.4% 246 260 273 -43.6% 1.2%Machinery and equipment 1 483 603 983 1 273 -5.0% 2.2% 46 49 51 -65.8% 0.7%Software and other intangible assets – 23 – 250 – 0.1% 200 211 222 -3.9% 0.5%Payments for financial assets – 15 7 – – – – – – – – Total 36 097 50 951 52 658 54 371 14.6% 100.0% 44 340 45 090 48 053 -4.0% 100.0%
Proportion of total programme expenditure to vote expenditure
11.4% 13.1% 12.9% 14.3% – – 12.1% 11.8% 12.0% – –
Details of transfers and subsidies
Households Social benefits Current 35 91 142 – -100.0% 0.1% – – – – – Employee social benefits 35 91 142 – -100.0% 0.1% – – – – – Departmental agencies and accounts Departmental agencies (non-business entities) Current – 5 – – – – – – – – – Communication – 5 – – – – – – – – –

2015 Estimates of National Expenditure
22
Personnel information
Table 3.27 Communication Service Agency personnel numbers and cost by salary level¹
Number of posts estimated for 31 March 2015 Number and cost2 of personnel posts filled / planned for on funded establishment Number
Number of
funded posts
Number of posts
additional to the
establishment Actual Revised estimate
Medium-term expenditure estimate
Averagegrowth
rate(%)
Salary level/total:
Average(%)
2013/14 2014/15 2015/16 2016/17 2017/18 2014/15 - 2017/18
Communication Service Agency Number Cost Unit Cost Number Cost
Unit Cost Number Cost
Unit Cost Number Cost
Unit Cost Number Cost
Unit Cost
Salary level 56 2 55 19.3 0.4 53 21.6 0.4 51 25.0 0.5 51 25.5 0.5 51 27.3 0.5 -1.3% 100.0%1 – 6 12 1 13 2.4 0.2 11 2.2 0.2 10 2.4 0.2 10 2.5 0.3 10 2.7 0.3 -3.1% 19.9%7 – 10 29 1 24 8.0 0.3 27 9.6 0.4 27 11.1 0.4 27 11.8 0.4 27 12.3 0.5 – 52.4%11 – 12 11 – 13 6.1 0.5 11 6.3 0.6 11 7.7 0.7 11 7.1 0.6 11 8.0 0.7 – 21.4%13 – 16 4 – 5 2.8 0.6 4 3.6 0.9 3 3.8 1.3 3 4.0 1.3 3 4.3 1.4 -9.1% 6.3%1. Data has been provided by the department and may not necessarily reconcile with official government personnel data.2. Rand million.
Public entities and other agencies
South African Broadcasting Corporation
Mandate The South African Broadcasting Corporation is listed as a schedule 2 public entity in terms of the Public Finance Management Act (1999). Its mandate is set out in its charter and in the Broadcasting Act (1999), as amended, and requires it to provide radio and television broadcasting services to South Africa.
Selected performance indicators
Table 3.28 South African Broadcasting Corporation performance indicators by programme/objective/activity and related outcome1 Indicator Programme/Objective/Activity Outcome Past Current Projections
2011/12 2012/13 2013/14 2014/15 2015/16 2016/17 2017/18 Value of operational expenditure: Digital terrestrial television per year
Digital terrestrial migration and technology
Outcome 12: An efficient, effective and development-oriented public service
−2 −3 R70m R130m R250m R1.5bn R2.4bn
Local content as a percentage of total public service television
Local content delivery: Television
75% 75% 75% 75% 75% 75% 75%
Local content as a percentage of total public commercial service television
Local content delivery: Television
35% 35% 35% 35% 35% 35% 35%
Local content as a percentage of total public service radio
Local content delivery: Radio 70% 70% 70% 70% 70% 70% 70%
Local content as a percentage of total public commercial service radio
Local content delivery: Radio 45% 45% 45% 45% 45% 45% 45%
Number of low power television transmitters switched on per year
Universal access transmitter rollout news
300 300 300 367 −4 −4 −4
Number of low power radio transmitters switched on per year4
Universal access transmitter rollout news
105 0 100 100 −4 −4 −4
1. The entity is reviewing its objectives in order to align it to its corporate plan, which means that new and existing programmes and special projects will be absorbed into others. Thus, the current performance indicators will be different in the upcoming reporting period. 2. There was no data in 2011/12 as the project was delayed and the amounts reflected in the previous year were incorrect. 3. The operational expenditure on digital terrestrial television per year was zero in 2012/13, due to delays in implementation. Thus, the target was not achieved. 4. No data is available for 2015/16, 2016/17 and 2017/18. Furthermore, the rollout of low power transmitters has been put on hold.

Vote 3: Communications
23
Expenditure analysis Although the South African Broadcasting Corporation does not directly contribute to the vision of the national development plan, it indirectly contributes to outcome 12 of government’s 2014-2019 medium term strategic framework (an efficient, effective and development oriented public service). It achieves this through its programming content with an emphasis on audiences, editorial integrity, the development of local content, and the telling of authentic South African stories.
The corporation’s focus over the MTEF period will be on realigning its operational model with requirements for digital broadcasting. Expenditure is expected to increase from R8 billion in 2014/15 to R9.9 billion in 2017/18, mainly due to activities involving improving the corporation’s news and sporting content offered on radio and television. This includes the expansion of commercial radio stations to increase the organisation’s audience share, and capital spending to replace or upgrade equipment. The corporation will also continue to digitise its value chain and distribution platforms, with radio broadcasting conducted digitally from production to distribution, and television broadcasting conducted in full high definition.
The corporation generates its revenue mainly from licence fees, commercial revenue (from advertising, programme and sport sponsorships across television, radio and online platforms), and transfers from government. Revenue growth over the medium term is expected to be constrained by the difficult economic environment, although the bulk of revenue growth is expected to be provided by commercial advertising as a result of the revised schedules and content strategy on television channels SABC 2 and SABC 3. Revenue is therefore expected to increase by 3.5 per cent over the medium term to reach R7.9 billion.
The increase in spending between 2011/12 and 2014/15 was due to higher broadcast costs, signal distribution costs, and the remuneration of contractors. Higher revenue collection costs for television licences also contributed to the increased expenditure over the period as the corporation attempted to improve liquidity. At the end of December 2012, the organisation had achieved a positive liquidity ratio of more than R1 billion and was able to settle its bank loan by September 2013, 14 months earlier than the expected loan term. This saved the corporation R17 million in interest costs.
Cabinet approved budget reductions of R204.9 million over the medium term are to be effected on the corporation’s allocation for the digital migration project, which was concluded in 2014/15. This amount has been reprioritised to fund Sentech and the South African Post Office.
The corporation has 3 870 funded posts, of which 3 677 were filled at the end of November 2014. The number of filled posts is expected to increase to 3 720 over the medium term, which accounts for an expected increase in spending on compensation of employees of 6.7 per cent over the medium term. The additional appointments are to meet the requirements for implementing digital terrestrial television, and the organisation’s strategy to expand regional content and thus contribute to job creation. Digitising the corporation’s delivery platforms in line with the country’s digital migration efforts remains a priority, and the organisation will continue to need to raise funding to improve its digital readiness.
Programmes/objectives/activities
Table 3.29 South African Broadcasting Corporation expenditure trends and estimates by programme/objective/activity
Audited outcome Revisedestimate
Averagegrowth
rate(%)
Expen-diture/Total:
Average(%)
Medium-term expenditure estimate
Averagegrowth
rate(%)
Expen-diture/Total:
Average(%)
R thousand 2011/12 2012/13 2013/14 2014/15 2011/12 - 2014/15 2015/16 2016/17 2017/18 2014/15 - 2017/18 Administration 1 233 100 1 655 389 1 253 217 1 789 746 13.2% 21.3% 1 776 464 1 956 566 2 110 768 5.7% 21.1%Local content delivery: Television 2 228 765 2 252 675 2 382 475 2 926 635 9.5% 35.3% 2 929 928 3 071 969 3 094 767 1.9% 33.3%Local content delivery: Radio 850 310 846 021 768 245 1 025 698 6.5% 12.6% 1 076 496 1 149 247 1 224 008 6.1% 12.4%Universal access transmitter rollout news
542 036 573 005 688 798 739 510 10.9% 9.2% 849 498 932 150 1 017 867 11.2% 9.7%
Sports of national Interest and mandate
493 715 711 823 581 674 472 253 -1.5% 8.2% 1 159 739 1 203 272 1 123 415 33.5% 10.7%
Digital terrestrial migration and technology
844 328 843 361 1 019 970 993 700 5.6% 13.4% 1 120 293 1 197 100 1 297 998 9.3% 12.7%
Total 6 192 254 6 882 274 6 694 379 7 947 542 8.7% 100.0% 8 912 418 9 510 304 9 868 823 7.5% 100.0%

2015 Estimates of National Expenditure
24
Statements of historical financial performance and position
Table 3.30 South African Broadcasting Corporation statements of historical financial performance and position Statement of financial performance
Budget Audited outcome Budget
Audited outcome Budget
Audited outcome
Budget estimate
Revisedestimate
Outcome/ Budget
Average(%)
R thousand 2011/12 2012/13 2013/14 2014/15 2011/12 - 2014/15 Revenue Non-tax revenue 6 703 228 6 003 510 6 126 650 6 108 053 6 120 298 6 525 576 7 023 136 7 394 623 100.2%Sale of goods and services other than capital assets
6 614 357 5 931 115 6 125 598 6 007 921 6 087 706 6 460 596 6 969 220 7 372 678 99.9%
of which: Administrative fees 880 471 931 967 1 023 647 919 878 985 776 935 127 1 106 676 1 106 676 97.4%Sales by market establishment 5 733 886 4 999 148 5 101 951 5 088 043 5 101 930 5 525 469 5 862 544 6 266 002 100.4%Other non-tax revenue 88 871 72 395 1 052 100 132 32 592 64 980 53 916 21 945 147.1%Transfers received 197 444 532 237 860 112 635 396 536 603 820 734 744 412 725 907 116.1%Total revenue 6 900 672 6 535 747 6 986 762 6 743 449 6 656 901 7 346 310 7 767 548 8 120 530 101.5%Expenses Current expenses 6 672 672 6 089 501 6 801 772 6 518 313 6 908 850 6 796 644 7 806 520 7 854 925 96.7%Compensation of employees 1 275 680 1 576 044 1 522 334 1 814 763 1 455 365 2 073 843 2 320 550 2 431 122 120.1%Goods and services 4 868 483 4 144 637 4 768 457 4 345 548 5 046 924 4 291 631 5 145 823 5 146 313 90.4%Depreciation 391 000 266 914 391 656 284 071 318 794 398 069 324 997 271 848 85.6%Interest, dividends and rent on land 137 509 101 906 119 325 73 931 87 767 33 101 15 150 5 642 59.6%Transfers and subsidies – 73 342 1 007 73 396 4 400 80 375 57 806 92 617 505.8%Total expenses 6 672 672 6 192 254 6 802 779 6 882 274 6 913 250 6 694 379 7 864 326 7 947 542 98.1%Surplus/(Deficit) 228 000 343 493 183 983 (138 825) (256 349) 651 931 (96 778) 172 988 – Statement of financial position Carrying value of assets 2 292 662 1 495 979 1 971 159 1 337 542 2 081 805 1 485 177 1 242 437 1 587 647 77.8%of which: Acquisition of assets 794 280 104 530 1 379 753 124 509 2 659 847 104 455 350 000 350 000 13.2%Investments 223 448 1 095 558 120 399 1 085 063 1 027 059 1 506 554 896 826 944 510 204.2%Inventory 955 349 866 805 1 032 729 692 172 1 664 819 729 693 677 016 833 964 72.1%Receivables and prepayments 1 060 975 1 034 886 1 232 283 923 064 1 046 353 1 251 580 1 055 816 1 284 894 102.3%Cash and cash equivalents (278 261) 217 732 – 145 447 200 000 59 243 20 000 20 000 -759.4%Defined benefit plan assets – 155 277 – 69 202 9 649 155 657 – 155 657 5 552.8%Derivatives financial instruments – 4 755 – 6 761 4 753 8 243 6 759 8 243 243.2%Total assets 4 254 173 4 870 992 4 356 570 4 259 251 6 034 438 5 196 147 3 898 854 4 834 915 103.3%Accumulated surplus/(deficit) 1 034 358 1 115 780 779 921 1 347 921 2 140 681 2 397 118 1 206 410 1 843 498 129.9%Capital and reserves 2 000 3 138 2 455 5 766 3 147 6 977 5 765 6 976 171.0%Capital reserve fund – 435 710 – 368 552 337 777 348 739 326 650 393 159 232.7%Borrowings 1 221 206 788 390 1 281 338 343 058 410 189 26 778 – – 39.8%Finance lease – 389 031 256 046 57 201 1 137 92 239 224 – 209.2%Deferred income 140 000 122 828 450 404 103 243 82 828 218 829 115 370 168 641 77.8%Trade and other payables 942 430 932 770 964 885 700 849 1 668 948 725 475 899 616 778 164 70.1%Taxation – 62 988 – 69 034 – 134 945 – 200 993 – Provisions 767 121 992 966 621 521 1 236 237 1 287 731 1 222 874 1 317 194 1 421 311 122.0%Derivatives financial instruments 147 058 27 391 – 27 390 102 000 22 173 27 625 22 173 35.8%Total equity and liabilities 4 254 173 4 870 992 4 356 570 4 259 251 6 034 438 5 196 147 3 898 854 4 834 915 103.3%
Statements of estimates of financial performance and position
Table 3.31 South African Broadcasting Corporation statements of estimates of financial performance and position Statement of financial performance
Revised estimate
Averagegrowth
rate(%)
Expen-diture/Total:
Average(%) Medium-term estimate
Averagegrowth
rate(%)
Expen-diture/Total:
Average(%)
R thousand 2014/15 2011/12 - 2014/15 2015/16 2016/17 2017/18 2014/15 - 2017/18 Revenue Non-tax revenue 7 394 623 7.2% 90.6% 7 571 701 7 903 602 8 231 623 3.6% 91.4%Sale of goods and services other than capital assets 7 372 678 7.5% 89.6% 7 532 519 7 882 439 8 221 751 3.7% 91.1%of which: Administrative fees 1 106 676 5.9% 13.6% 1 092 571 1 157 350 1 225 779 3.5% 13.5%Sales by market establishment 6 266 002 7.8% 76.1% 6 439 948 6 725 089 6 995 972 3.7% 77.6%Other non-tax revenue 21 945 -32.8% 0.9% 39 182 21 163 9 872 -23.4% 0.3%Transfers received 725 907 10.9% 9.4% 702 637 735 563 767 302 1.9% 8.6%Total revenue 8 120 530 7.5% 100.0% 8 274 338 8 639 165 8 998 925 3.5% 100.0%Expenses Current expenses 7 854 925 8.9% 98.4% 8 676 554 9 212 730 9 560 124 6.8% 97.5%Compensation of employees 2 431 122 15.5% 28.3% 2 419 876 2 681 222 2 957 387 6.7% 29.0%Goods and services 5 146 313 7.5% 64.7% 5 925 507 6 204 941 6 231 474 6.6% 64.9%Depreciation 271 848 0.6% 4.5% 341 848 337 750 362 372 10.1% 3.6%Interest, dividends and rent on land 5 642 -61.9% 0.8% (10 677) (11 183) 8 891 16.4% -0.0%Transfers and subsidies 92 617 8.1% 1.2% 76 986 85 301 94 086 0.5% 1.0%Total expenses 7 947 542 8.7% 100.0% 8 912 418 9 510 304 9 868 823 7.5% 100.0%Surplus/(Deficit) 172 988 -20.4% (638 080) (871 139) (869 898) -271.3%

Vote 3: Communications
25
Table 3.31 South African Broadcasting Corporation statements of estimates of financial performance and position Statement of financial position
Revised estimate
Averagegrowth
rate(%)
Expen-diture/Total:
Average(%) Medium-term estimate
Averagegrowth
rate(%)
Expen-diture/Total:
Average(%)
R thousand 2014/15 2011/12 - 2014/15 2015/16 2016/17 2017/18 2014/15 - 2017/18 Carrying value of assets 1 587 647 2.0% 30.9% 1 545 801 1 658 050 1 745 676 3.2% 36.4%of which: Acquisition of assets 350 000 49.6% 3.6% 321 365 460 869 460 867 9.6% 8.9%Investments 944 510 -4.8% 24.1% 687 180 261 865 195 024 -40.9% 11.4%Inventory 833 964 -1.3% 16.3% 878 702 922 485 968 458 5.1% 20.1%Receivables and prepayments 1 284 894 7.5% 23.4% 1 345 232 1 408 683 1 466 409 4.5% 30.7%Cash and cash equivalents 20 000 -54.9% 2.4% 20 000 20 000 20 000 – 0.4%Defined benefit plan assets 155 657 0.1% 2.8% – – – -100.0% 0.8%Derivatives financial instruments 8 243 20.1% 0.1% 8 243 8 243 8 243 – 0.2%Total assets 4 834 915 -0.2% 100.0% 4 485 158 4 279 326 4 403 810 -3.1% 100.0%Accumulated surplus/(deficit) 1 843 498 18.2% 34.7% 1 501 672 1 029 776 559 482 -32.8% 27.1%Capital and reserves 6 976 30.5% 0.1% 6 978 6 977 6 978 0.0% 0.2%Capital reserve fund 393 159 -3.4% 8.1% 347 909 335 499 290 862 -9.6% 7.6%Borrowings – -100.0% 6.2% – – 356 928 – 2.0%Deferred income 168 641 11.1% 3.2% 207 966 219 334 231 045 11.1% 4.6%Trade and other payables 778 164 -5.9% 16.4% 584 171 634 541 659 946 -5.3% 14.7%Taxation 200 993 47.2% 2.4% 200 993 200 994 200 994 0.0% 4.5%Provisions 1 421 311 12.7% 25.6% 1 613 296 1 830 032 2 075 402 13.4% 38.8%Derivatives financial instruments 22 173 -6.8% 0.5% 22 173 22 173 22 173 – 0.5%Total equity and liabilities 4 834 915 -0.2% 100.0% 4 485 158 4 279 326 4 403 810 -23.2% 100.0%
Brand South Africa
Mandate Brand South Africa was established as a trust in 2002 and gazetted as a schedule 3A public entity in accordance with the Public Finance Management Act (1999) in 2006. Its purpose is to develop and implement a proactive and coordinated international marketing and communications strategy for South Africa, to contribute to job creation and poverty reduction, and to attract inward investment, trade and tourism.
Selected performance indicators
Table 3.32 Brand South Africa performance indicators by programme/objective/activity and related outcome Indicator
Programme/Objective/Activity Outcome Past Current Projections
2011/12 2012/13 2013/14 2014/15 2015/16 2016/17 2017/18Brand ranking index
Brand strategy development and management
Outcome 11: Create a better South Africa, a better Africa and a better world
36 36 30-34 31-35 28-31 28-31 28-31
World Economic Forum global competitive index (148 countries registered)
Brand strategy development and management
50(139)
52(144)
53 43-53 40-42 40-42 40-42
Percentage of stakeholders trained for brand compliance per year1
Brand strategy development and management
23 departments9 in provinces24 companies
9 state owned enterprises
25 companies
100%(18) 100%(18) 100%(18) 100%(18) 100%(18)
International media reputation index
Reputation management 53 50- 55 50-55 45-50 44-49 44-49 44-49
Domestic media reputation index2
Reputation management 64 55-56 55-56 55-60 54-58 54-58 54-58
Institute of Management Development competitiveness yearbook ranking3
Reputation management 59 50 52 –3 –3 –3 –3
1. This indicator has been measured as a percentage of stakeholders trained for brand compliance since 2013/14. 2. Some of the indices and rankings aim to achieve performance within a range. 3. The indicator has been discontinued from 2013/14, after which the entity will use the global competitiveness index.

2015 Estimates of National Expenditure
26
Expenditure analysis In support of the national development plan’s vision, Brand South Africa is charged with building the brand reputation of the country in order to improve its global competitiveness and better position South Africa in the world, as well as promoting active citizenry and social cohesion across society. This is in line with outcome 14 of government’s 2014-2019 medium term strategic framework (nation building and social cohesion). Such measures will improve South Africa’s global competitiveness index ranking, and boost business confidence in the country and its standing in the region and the world, in line with the framework’s outcome 11 (create a better South Africa, a better Africa and a better world).
The organisation’s focus over the medium term will be on brand strategy development and management, and reputation management. This entails the development of communications strategies, marketing, and a range of other activities that position the country competitively, both domestically and in international markets. Further focus areas will assist various government and private sector entities to align their communications strategies with national messaging, and ensure that the implementation of key projects, events, and news on government policies and programmes receive appropriate coverage.
In line with this, the organisation intends to improve its standing in the brand ranking index to between 28 and 31 over the medium term, and improve its position in the global competitive index from 53 in 2013/14 to between 40 and 42 by 2017/18. The organisation will also host the second South African competitiveness forum in Johannesburg in 2015, and this year’s theme will be: Active citizenship and its role in changing the South African brand reality. The forum is a strategic platform where leaders and influential people from business, civil society and government share insights and assist one another in shaping the South African brand. Expenditure on the forum is expected to be R2 million per year.
Domestically, Brand South Africa will intensify the Play Your Part campaign, develop and roll out the Play Your Part television series, and secure media partners to inspire all South Africans, including those living abroad, and thereby increase national pride and levels of patriotism. Expenditure on this campaign is expected to increase from R28 million in 2014/15 to R32.5 million in 2017/18.
Consequently, expenditure on compensation of employees over the medium term is expected to increase from R33.6 million in 2014/15 to R59.2 million in 2017/18 to accommodate the 12 additional posts that have been created in the organisation. Brand South Africa will deploy permanent staff members to Brazil and India in addition to personnel deployed to China, the United Kingdom and the United States.
Cabinet approved budget reductions of R2.6 million in 2015/16 and R3.9 million in 2016/17 will be effected on transfers to the organisation. However, these reductions are not expected to adversely affect the achievement of the organisation’s outputs.
Programmes/objectives/activities
Table 3.33 Brand South Africa expenditure trends and estimates by programme/objective/activity
Audited outcome Revisedestimate
Averagegrowth
rate(%)
Expen-diture/Total:
Average(%)
Medium-term expenditure estimate
Averagegrowth
rate(%)
Expen-diture/Total:
Average(%)
R thousand 2011/12 2012/13 2013/14 2014/15 2011/12 - 2014/15 2015/16 2016/17 2017/18 2014/15 - 2017/18 Administration 173 063 163 276 205 439 186 101 2.5% 100.0% 173 160 186 586 194 300 1.4% 100.0%Total 173 063 163 276 205 439 186 101 2.5% 100.0% 173 160 186 586 194 300 1.4% 100.0%
Statements of historical financial performance and position
Table 3.34 Brand South Africa statements of historical financial performance and position Statement of financial performance
Budget Audited outcome Budget
Audited outcome Budget
Audited outcome
Budget estimate
Revised estimate
Outcome/ Budget
Average(%)
R thousand 2011/12 2012/13 2013/14 2014/15 2011/12 - 2014/15 Revenue Non-tax revenue 21 005 4 320 11 000 6 269 3 200 34 481 8 759 5 756 115.6%Other non-tax revenue 21 005 4 320 11 000 6 269 3 200 34 481 8 759 5 756 115.6%Transfers received 140 089 140 089 148 779 154 779 160 434 160 434 167 686 167 686 101.0%Total revenue 161 094 144 409 159 779 161 048 163 634 194 915 176 445 173 442 101.9%

Vote 3: Communications
27
Table 3.34 Brand South Africa statements of historical financial performance and position Statement of financial performance
Budget Audited outcome Budget
Audited outcome Budget
Audited outcome
Budget estimate
Revisedestimate
Outcome/ Budget
Average(%)
R thousand 2011/12 2012/13 2013/14 2014/15 2011/12 - 2014/15 Expenses Current expenses 140 087 173 063 159 779 163 276 163 634 205 439 176 202 186 101 113.8%Compensation of employees 22 792 23 341 29 233 26 844 30 928 33 014 33 633 33 633 100.2%Goods and services 115 752 148 316 129 890 135 128 132 706 171 318 141 366 151 185 116.6%Depreciation 1 543 1 395 656 1 100 – 1 059 1 203 1 203 139.8%Interest, dividends and rent on land – 11 – 204 – 49 – 80 – Total expenses 140 087 173 063 159 779 163 276 163 634 205 439 176 202 186 101 113.8%Surplus/(Deficit) 21 007 (28 654) – (2 228) – (10 524) 243 (12 659) – Statement of financial position Carrying value of assets 1 205 2 193 2 164 2 461 300 2 843 3 524 3 541 153.5%of which: Acquisition of assets 1 020 1 317 940 1 456 1 100 1 714 1 607 1 607 130.6%Investments – 397 – 1 209 – 660 – 220 – Receivables and prepayments 2 300 33 793 5 260 5 497 1 100 10 484 1 250 1 370 516.1%Cash and cash equivalents 3 000 81 42 854 30 510 10 585 16 090 14 104 6 000 74.7%Total assets 6 505 36 464 50 278 39 677 11 985 30 077 18 878 11 131 133.9%Accumulated surplus/(deficit) 1 208 8 229 36 883 6 001 – (4 723) 6 645 1 033 23.6%Finance lease – 333 – 213 125 401 511 256 189.1%Trade and other payables 4 497 26 824 12 707 32 370 11 210 33 054 10 547 8 407 258.3%Provisions 800 1 079 688 1 094 650 1 157 1 175 1 175 136.0%Derivatives financial instruments – – – – – 188 – 260 – Total equity and liabilities 6 505 36 465 50 278 39 678 11 985 30 077 18 878 11 131 133.9%
Statements of financial performance and position estimates
Table 3.35 Brand South Africa statements of estimates of financial performance and position Statement of financial performance
Revised estimate
Averagegrowth
rate(%)
Expen-diture/Total:
Average(%) Medium-term estimate
Averagegrowth
rate(%)
Expen-diture/Total:
Average(%)
R thousand 2014/15 2011/12 - 2014/15 2015/16 2016/17 2017/18 2014/15 - 2017/18 Revenue Non-tax revenue 5 756 10.0% 7.0% 345 5 786 279 -63.5% 1.7%Other non-tax revenue 5 756 10.0% 7.0% 345 5 786 279 -63.5% 1.7%Transfers received 167 686 6.2% 93.0% 173 160 181 186 194 300 5.0% 98.3%Total revenue 173 442 6.3% 100.0% 173 505 186 972 194 579 3.9% 100.0%Expenses Current expenses 186 101 2.5% 100.0% 173 160 186 586 194 300 1.4% 100.0%Compensation of employees 33 633 12.9% 16.0% 51 627 55 891 59 243 20.8% 27.1%Goods and services 151 185 0.6% 83.3% 120 173 129 199 133 411 -4.1% 72.1%Depreciation 1 203 -4.8% 0.7% 1 275 1 403 1 543 8.7% 0.7%Interest, dividends and rent on land 80 93.7% 0.0% 85 93 103 8.7% 0.0%Total expenses 186 101 2.5% 100.0% 173 160 186 586 194 300 1.4% 100.0%Surplus/(Deficit) (12 659) -23.8% 345 386 279 -128.0% – Statement of financial position Carrying value of assets 3 541 17.3% 13.4% 3 910 4 250 4 554 8.7% 36.0%of which: Acquisition of assets 1 607 6.9% 6.9% 2 346 2 699 2 861 21.2% 21.0%Investments 220 -17.9% 2.1% 50 – – -100.0% 0.6%Receivables and prepayments 1 370 -65.6% 38.4% 1 465 1 566 1 674 6.9% 13.5%Cash and cash equivalents 6 000 320.0% 46.1% 5 000 5 500 6 050 0.3% 49.9%Total assets 11 131 -32.7% 100.0% 10 425 11 316 12 278 3.3% 100.0%Accumulated surplus/(deficit) 1 033 -49.9% 7.8% 1 378 1 764 2 043 25.5% 13.7%Finance lease 256 -8.4% 1.3% 659 560 420 17.9% 4.2%Trade and other payables 8 407 -32.1% 85.1% 6 895 7 370 8 051 -1.4% 68.1%Provisions 1 175 2.9% 5.0% 1 293 1 422 1 564 10.0% 12.1%Derivatives financial instruments 260 – 0.7% 200 200 200 -8.4% 1.9%Total equity and liabilities 11 131 -32.7% 100.0% 10 425 11 316 12 278 43.7% 100.0%
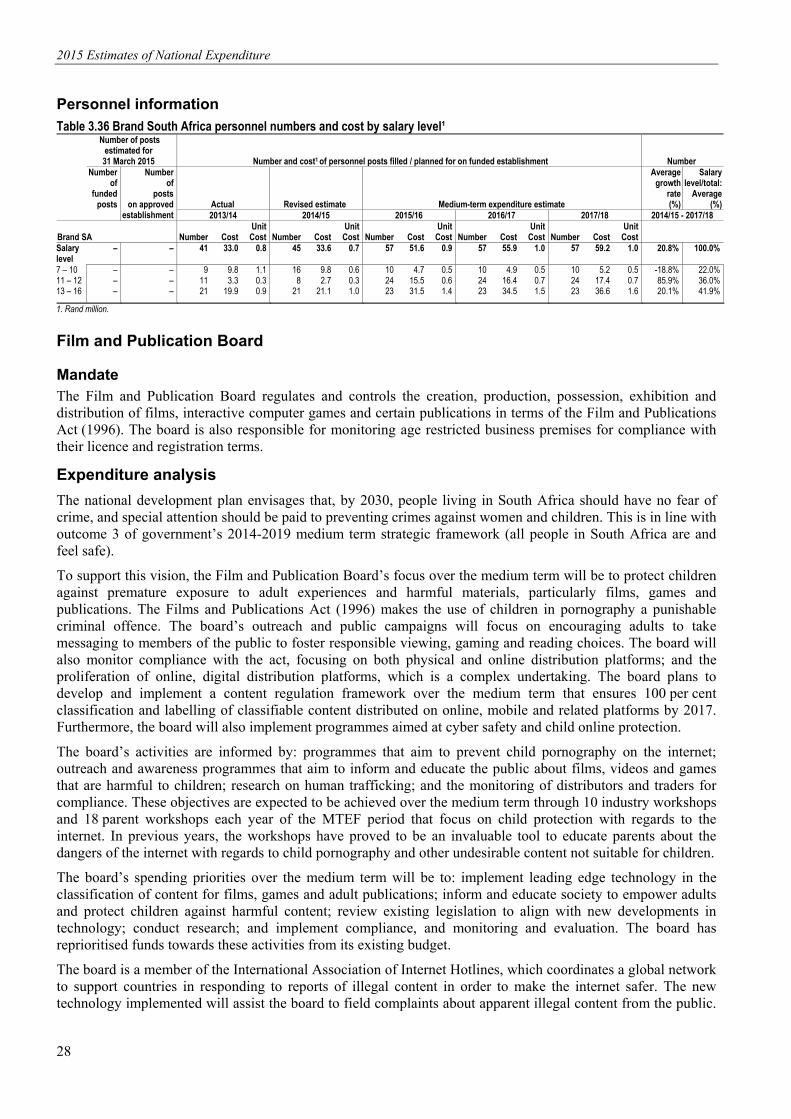
2015 Estimates of National Expenditure
28
Personnel information
Table 3.36 Brand South Africa personnel numbers and cost by salary level¹
Number of posts estimated for
31 March 2015 Number and cost1 of personnel posts filled / planned for on funded establishment Number
Number of
funded posts
Number of
posts on approved
establishment Actual Revised estimate
Medium-term expenditure estimate
Averagegrowth
rate(%)
Salarylevel/total:
Average(%)
2013/14 2014/15 2015/16 2016/17 2017/18 2014/15 - 2017/18
Brand SA
Number Cost Unit Cost
Number Cost
Unit Cost
Number Cost
Unit Cost
Number Cost
Unit Cost
Number Cost
Unit Cost
Salary level
– – 41 33.0 0.8 45 33.6 0.7 57 51.6 0.9 57 55.9 1.0 57 59.2 1.0 20.8% 100.0%
7 – 10 – – 9 9.8 1.1 16 9.8 0.6 10 4.7 0.5 10 4.9 0.5 10 5.2 0.5 -18.8% 22.0%11 – 12 – – 11 3.3 0.3 8 2.7 0.3 24 15.5 0.6 24 16.4 0.7 24 17.4 0.7 85.9% 36.0%13 – 16 – – 21 19.9 0.9 21 21.1 1.0 23 31.5 1.4 23 34.5 1.5 23 36.6 1.6 20.1% 41.9%
1. Rand million.
Film and Publication Board
Mandate The Film and Publication Board regulates and controls the creation, production, possession, exhibition and distribution of films, interactive computer games and certain publications in terms of the Film and Publications Act (1996). The board is also responsible for monitoring age restricted business premises for compliance with their licence and registration terms.
Expenditure analysis
The national development plan envisages that, by 2030, people living in South Africa should have no fear of crime, and special attention should be paid to preventing crimes against women and children. This is in line with outcome 3 of government’s 2014-2019 medium term strategic framework (all people in South Africa are and feel safe).
To support this vision, the Film and Publication Board’s focus over the medium term will be to protect children against premature exposure to adult experiences and harmful materials, particularly films, games and publications. The Films and Publications Act (1996) makes the use of children in pornography a punishable criminal offence. The board’s outreach and public campaigns will focus on encouraging adults to take messaging to members of the public to foster responsible viewing, gaming and reading choices. The board will also monitor compliance with the act, focusing on both physical and online distribution platforms; and the proliferation of online, digital distribution platforms, which is a complex undertaking. The board plans to develop and implement a content regulation framework over the medium term that ensures 100 per cent classification and labelling of classifiable content distributed on online, mobile and related platforms by 2017. Furthermore, the board will also implement programmes aimed at cyber safety and child online protection.
The board’s activities are informed by: programmes that aim to prevent child pornography on the internet; outreach and awareness programmes that aim to inform and educate the public about films, videos and games that are harmful to children; research on human trafficking; and the monitoring of distributors and traders for compliance. These objectives are expected to be achieved over the medium term through 10 industry workshops and 18 parent workshops each year of the MTEF period that focus on child protection with regards to the internet. In previous years, the workshops have proved to be an invaluable tool to educate parents about the dangers of the internet with regards to child pornography and other undesirable content not suitable for children.
The board’s spending priorities over the medium term will be to: implement leading edge technology in the classification of content for films, games and adult publications; inform and educate society to empower adults and protect children against harmful content; review existing legislation to align with new developments in technology; conduct research; and implement compliance, and monitoring and evaluation. The board has reprioritised funds towards these activities from its existing budget.
The board is a member of the International Association of Internet Hotlines, which coordinates a global network to support countries in responding to reports of illegal content in order to make the internet safer. The new technology implemented will assist the board to field complaints about apparent illegal content from the public.

Vote 3: Communications
29
Once complaints are received, teams of analysts then assess the content in accordance with legislation and, if they consider it to be illegal, trace it to a host country. If the content is illegal in the host country, the hotline takes steps to have the material removed in consultation with that country’s law enforcement partners, and also in partnership with mobile network operators and internet service providers. In implementing this, the bulk of expenditure will go towards compensation of employees, travel and subsistence (through conducting campaigns and outreach programmes in various regions), workshops and meetings, consulting and professional fees, IT maintenance and infrastructure, and public relations campaigns.
Cabinet approved budget reductions of R564 000 in 2015/16 and R846 000 in 2016/17 will mainly be effected on non-essential spending items of the board’s operations, such as venues and facilities, and catering and entertainment. The reductions are not expected to have any adverse effects on service delivery.
Programmes/objectives/activities
Table 3.37 Film and Publication Board expenditure trends and estimates by programme/objective/activity
Audited outcome Revisedestimate
Averagegrowth
rate(%)
Expen-diture/Total:
Average(%)
Medium-term expenditure estimate
Averagegrowth
rate(%)
Expen-diture/Total:
Average(%)
R thousand 2011/12 2012/13 2013/14 2014/15 2011/12 - 2014/15 2015/16 2016/17 2017/18 2014/15 - 2017/18 Administration 69 031 53 037 54 274 53 938 -7.9% 72.9% 57 597 60 679 66 429 7.2% 65.6%Public awareness and education (SO 2) – 7 851 9 507 10 541 – 8.3% 10 891 10 590 9 881 -2.1% 11.6%Organisational capacity and capability (SO 3) – 23 135 14 480 4 985 – 12.5% 5 483 6 031 6 635 10.0% 6.3%Online and mobile content regulation (SO 4) – 926 1 838 7 906 – 3.2% 8 168 8 210 6 823 -4.8% 8.6%Administration and compliance (SO 5) – 2 540 1 581 6 149 – 3.1% 6 353 7 941 8 417 11.0% 7.9%Total 69 031 87 489 81 680 83 519 6.6% 100.0% 88 492 93 451 98 185 5.5% 100.0%
Statements of historical financial performance and position
Table 3.38 Film and Publication Board statements of historical financial performance and position Statement of financial performance
Budget Audited outcome Budget
Audited outcome Budget
Audited outcome
Budget estimate
Revisedestimate
Outcome/ Budget
Average(%)
R thousand 2011/12 2012/13 2013/14 2014/15 2011/12 - 2014/15 Revenue Non-tax revenue 10 001 7 527 11 050 5 896 10 952 4 439 11 904 5 059 52.2%Other non-tax revenue Transfers received
10 001 7 527 11 050 5 896 10 952 4 439 11 904 5 059 52.2% 65 458 65 458 69 274 69 835 82 675 82 675 78 901 78 901 100.2%
Total revenue 75 459 72 985 80 324 75 731 93 627 87 114 90 805 83 960 94.0%Expenses Current expenses 75 459 69 031 79 918 87 489 93 627 81 680 90 805 83 519 94.7%Compensation of employees 32 613 27 250 36 356 31 299 39 820 36 116 36 503 36 503 90.3%Goods and services 40 859 38 896 41 600 53 522 52 460 42 381 54 302 43 833 94.4%Depreciation 1 952 2 831 1 962 2 668 1 347 3 183 – 3 183 225.5%Interest, dividends and rent on land 35 54 – – – – – – 154.3%Total expenses 75 459 69 031 79 918 87 489 93 627 81 680 90 805 83 519 94.7%Surplus/(Deficit) – 3 954 406 (11 758) – 5 434 – 441 – Statement of financial position Carrying value of assets 3 850 5 530 4 654 6 608 3 677 5 748 2 822 3 522 142.7%of which: Acquisition of assets 2 445 3 941 1 700 3 746 370 2 338 – 2 571 279.0%Receivables and prepayments 502 598 245 216 521 340 521 521 93.6%Cash and cash equivalents 4 157 7 892 2 262 1 640 4 478 3 523 5 648 4 214 104.4%Total assets 8 509 14 021 7 161 8 464 8 676 9 611 8 991 8 257 121.0%Accumulated surplus/(deficit) 4 822 5 235 1 821 (5 874) 2 196 (441) 2 546 – -9.5%Finance lease – 281 702 2 164 1 220 1 291 1 185 451 134.8%Trade and other payables 1 889 5 953 2 570 10 108 2 882 6 702 2 882 5 428 275.8%Provisions 1 798 2 553 2 068 2 066 2 378 2 059 2 378 2 378 105.0%Total equity and liabilities 8 509 14 021 7 161 8 464 8 676 9 611 8 991 8 257 121.0%

2015 Estimates of National Expenditure
30
Statements of financial performance and position estimates
Table 3.39 Film and Publication Board statements of estimates of financial performance and position Statement of financial performance
Revised estimate
Averagegrowth
rate(%)
Expen-diture/Total:
Average(%) Medium-term estimate
Averagegrowth
rate(%)
Expen-diture/Total:
Average(%)
R thousand 2014/15 2011/12 - 2014/15 2015/16 2016/17 2017/18 2014/15 - 2017/18 Revenue Non-tax revenue 5 059 -12.4% 7.3% 6 133 6 979 6 501 8.7% 6.8%Other non-tax revenue 5 059 -12.4% 7.3% 6 133 6 979 6 501 8.7% 6.8%Transfers received 78 901 6.4% 92.7% 82 359 86 472 91 684 5.1% 93.2%Total revenue 83 960 4.8% 100.0% 88 492 93 451 98 185 5.4% 100.0%Expenses Current expenses 83 519 6.6% 100.0% 88 492 93 451 98 185 5.5% 100.0%Compensation of employees 36 503 10.2% 40.8% 40 153 44 168 48 585 10.0% 46.5%Goods and services 43 833 4.1% 55.5% 45 156 46 100 46 417 1.9% 50.0%Depreciation 3 183 4.0% 3.7% 3 183 3 183 3 183 – 3.5%Total expenses 83 519 6.6% 100.0% 88 492 93 451 98 185 5.5% 100.0%Surplus/(Deficit) 441 -51.9% – – – – -100.0% – Statement of financial position Carrying value of assets 3 522 -14.0% 55.0% 3 800 4 250 4 600 9.3% 51.0%of which: Acquisition of assets 2 571 -13.3% 32.0% 2 828 3 111 3 422 10.0% 37.6%Receivables and prepayments 521 -4.5% 4.2% 550 600 650 7.7% 7.3%Cash and cash equivalents 4 214 -18.9% 40.8% 3 538 2 700 2 850 -12.2% 41.7%Total assets 8 257 -16.2% 100.0% 7 888 7 550 8 100 -0.6% 100.0%Finance lease 451 17.1% 11.6% 388 300 300 -12.7% 4.5%Trade and other payables 5 428 -3.0% 74.3% 5 000 4 500 4 800 -4.0% 62.0%Provisions 2 378 -2.3% 23.2% 2 500 2 750 3 000 8.1% 33.5%Total equity and liabilities 8 257 -16.2% 100.0% 7 888 7 550 8 100 -8.7% 100.0%
Personnel information
Table 3.40 Film and Publication Board personnel numbers and cost by salary level¹
Number of posts estimated for
31 March 2015 Number and cost1 of personnel posts filled / planned for on funded establishment Number
Number of
funded posts
Number of
posts on approved
establishment Actual Revised estimate
Medium-term expenditure estimate
Averagegrowth
rate(%)
Salarylevel/total:
Average(%)
2013/14 2014/15 2015/16 2016/17 2017/18 2014/15 - 2017/18
Film and Publication Board
Number Cost Unit Cost
Number Cost
Unit Cost
Number Cost
Unit Cost
Number Cost
Unit Cost
Number Cost
Unit Cost
Salary level
80 80 80 36.1 0.5 80 36.5 0.5 80 40.2 0.5 80 44.2 0.6 80 48.6 0.6 10.0% 100.0%
7 – 10 64 6 4 64 17.8 0.3 64 16.4 0.3 64 23.2 0.4 64 25.6 0.4 64 28.3 0.4 19.9% 80.0%11 – 12 11 11 11 12.7 1.2 11 13.8 1.3 11 13.0 1.2 11 14.2 1.3 11 15.4 1.4 3.7% 13.8%13 – 16 5 5 5 5.7 1.1 5 6.3 1.3 5 4.0 0.8 5 4.4 0.9 5 4.8 1.0 -8.2% 6.3%1. Rand million.
The Independent Communications Authority of South Africa
Mandate The Independent Communications Authority of South Africa was established by the Independent Communications Authority of South Africa Act (2000), as amended, to regulate the South African communications, broadcasting and postal services sectors. The regulator’s mandate is defined in the Electronic Communications Act (2005) as licensing and regulating electronic communications and broadcasting services, and in the Postal Services Act (1998) as regulating the postal services sector. Enabling legislation also empowers the regulator to monitor licensee compliance with licence terms and conditions, develop regulations for the three sectors, plan and manage the radio frequency spectrum, and protect consumers in relation to these services.

Vote 3: Communications
31
Selected performance indicators
Table 3.41 The Independent Communications Authority of South Africa performance indicators by programme/ objective/activity and related outcome Indicator Programme/Objective/Activity Outcome Past Current Projections
2011/12 2012/13 2013/14 2014/15 2015/16 2016/17 2017/18Number of pre-assigned spectrum licences processed per year
Licensing and compliance
Outcome 6: An efficient, competitive and responsive economic infrastructure network
1 485 1 634 1 600 1 600 1 700 1 850 1 900
Number of licences issued per year (class broadcasting services, class electronic communications services, electronic communications network services and unreserved postal services)
Licensing and compliance 30 35 Class ECNS=82; Class
ECS=72; Class Broadcasting
Services=40 and Unreserved
Postal Services=21
Class ECNS=50;
Class ECS=51;
Class Broadcasting Services=31
and Unreserved
Postal Services=23
Class ECNS=55;
Class ECS=56;
Class Broadcasting Services=36
and Unreserved
Postal Services=28
Class ECNS=60;
Class ECS=60;
Class Broadcasting Services=40
and Unreserved
Postal Services=30
Class ECNS=69; Class
ECS=65; Class
Broadcasting Services=40
and Unreserved Postal
Services=35
Number of tariff lodgements per year
Markets and competition 52 52 72 70 80 90 95
Percentage of consumer complaints resolved per year
Consumer affairs 68% (total of
4 553 received)
64% (total of 4 317
received)
53% (total of 2 444
received)
58% (total of 4 500
projected)
64% (total of 4 500
projected)
67% (total of 4 700
projected)
70% (total of 4 700
projected)
Number of people who participate in public awareness campaigns per year
Consumer affairs 705 740 450 500 550 600 600
Expenditure analysis The national development plan explicitly states the need to strengthen the Independent Communications Authority of South Africa’s mandate for nation building, thereby contributing to outcome 14 of government’s 2014-2019 medium term strategic framework (nation building and social cohesion). This is in addition to the authority’s indirect contribution to outcome 6 (an efficient, competitive and responsive economic infrastructure network).
The authority continued to reduce costs while serving the sector and without compromising the quality of service to consumers in 2011/12 and 2012/13. Ringfenced funds were made available in 2012/13 to promote advocacy, run public awareness programmes, and monitor spectrum interferences during the 2013 Africa Cup of Nations. Projects relating to digital terrestrial television and availing broadband, as well as additional commercial radio services for both primary and secondary markets, were also funded from the budget allocation for that year. Further ringfenced funds were made available in 2012/13 to procure R25 million worth of equipment to monitor the activities of postal and broadcasting licensees, but due to challenges experienced in securing the equipment locally, these funds could not be utilised in the same year. In addition to this, R10 million was availed towards customer relationship management and spectrum management tools to ensure the optimal use of the high demand radio frequency spectrum by licence holders, but this amount was not fully utilised.
Adequate allocation towards projects such as monitoring the 2014 elections was made available in 2013/14 for goods and services to continue with projects that spanned over more than 1 year. Broadcasting monitoring equipment was acquired in 2013/14 at a cost of R13 million. The acquisition of assets is expected to decrease significantly in 2015/16 as most items that were required were procured between 2011/12 and 2013/14, and as a result, a significant portion of the budget will be channelled towards goods and services in order to maintain and operate these capital assets.
It is anticipated that spending patterns will stabilise over the medium term as a result of the completion of the restructuring and migration exercise. A review of capital requirements is planned for 2017/18, with minor additions anticipated in the following year.
The authority has managed to keep the cost of living adjustment for compensation of employees below 10 per cent from the 2009/10 financial period to date in order to bring salaries in line with other entities within the ministry and the ICT sector at large, and has maintained spending on compensation of employees below 60 per cent of total expenditure.

2015 Estimates of National Expenditure
32
Programmes/objectives/activities
Table 3.42 The Independent Communications Authority of South Africa expenditure trends and estimates by programme/ objective/activity
Audited outcome Revisedestimate
Averagegrowth
rate(%)
Expen-diture/Total:
Average(%)
Medium-term expenditure estimate
Averagegrowth
rate(%)
Expen-diture/Total:
Average(%)
R thousand 2011/12 2012/13 2013/14 2014/15 2011/12 - 2014/15 2015/16 2016/17 2017/18 2014/15 - 2017/18 Administration 229 570 232 337 226 694 249 207 2.8% 68.3% 289 486 307 078 334 218 10.3% 69.9%Licensing and compliance 22 463 22 348 29 391 38 629 19.8% 8.1% 28 462 29 885 42 296 3.1% 8.2%Engineering and technology 33 172 37 493 36 043 45 690 11.3% 11.0% 36 185 38 226 58 213 8.4% 10.5%Markets and competition 17 741 21 014 27 393 33 219 23.3% 7.1% 23 405 24 344 32 026 -1.2% 6.7%Consumer affairs 10 859 21 736 19 671 22 476 27.4% 5.4% 14 724 15 459 26 067 5.1% 4.6%Total 313 805 334 928 339 192 389 221 7.4% 100.0% 392 262 414 992 492 820 8.2% 100.0%
Statements of historical financial performance and position
Table 3.43 The Independent Communications Authority of South Africa statements of historical financial performance and position Statement of financial performance
Budget Audited outcome Budget
Audited outcome Budget
Audited outcome
Budget estimate
Revised estimate
Outcome/ Budget
Average(%)
R thousand 2011/12 2012/13 2013/14 2014/15 2011/12 - 2014/15 Revenue Non-tax revenue 8 012 6 971 6 581 6 289 4 707 23 242 5 512 10 101 187.8%Sale of goods and services other than capital assets
– 7 12 – 12 – – – 29.2%
of which: Administrative fees – 7 12 – 12 – – – 29.2%Other non-tax revenue 8 012 6 964 6 569 6 289 4 695 23 242 5 512 10 101 188.0%Transfers received 313 378 313 378 389 797 342 385 390 661 360 764 376 221 376 221 94.7%Total revenue 321 390 320 349 396 378 348 673 395 368 384 006 381 733 386 322 96.3%Expenses Current expenses 272 588 314 153 359 748 336 034 395 368 340 822 384 103 389 221 97.8%Compensation of employees 185 146 186 210 195 329 194 269 206 072 204 158 232 007 235 959 100.2%Goods and services 75 342 118 571 146 619 128 047 173 246 120 651 133 314 138 105 95.6%Depreciation 12 100 9 023 17 800 12 612 16 050 14 383 18 782 15 157 79.1%Interest, dividends and rent on land – 349 – 1 107 – 1 630 – – – Transfers and subsidies 1 200 – – – – – – – – Total expenses 273 789 314 153 359 748 336 034 395 368 340 822 384 103 389 221 97.7%Surplus/(Deficit) 47 601 6 196 36 629 12 639 – 43 184 (2 370) (2 899) Statement of financial position Carrying value of assets 108 545 99 579 134 293 99 264 210 410 108 455 208 000 187 146 74.8%of which: Acquisition of assets 5 512 12 421 46 358 17 105 72 000 26 949 31 412 72 498 83.1%Investments 577 706 – – – – – – – – Inventory – 508 – 530 – 582 530 530 405.7%Receivables and prepayments 10 500 666 190 12 820 720 733 14 400 710 514 8 100 8 100 4 595.2%Cash and cash equivalents 64 000 45 551 23 735 155 117 25 500 321 594 23 000 31 954 406.8%Total assets 760 751 811 828 170 848 975 644 250 310 1 141 145 239 630 227 730 222.0%Accumulated surplus/(deficit) – 119 586 139 864 133 589 215 430 181 928 207 006 207 006 114.2%Capital and reserves 33 731 – – – – – – – – Capital reserve fund – – – 63 412 – 93 309 – – – Borrowings 10 000 – – – – – – – – Finance lease – 1 604 – 988 680 455 324 324 335.8%Trade and other payables 21 000 15 475 30 984 19 753 34 200 29 242 4 000 4 000 75.9%Benefits payable – – – 0 – – – – – Provisions 10 000 9 154 – 10 185 – 20 804 28 300 16 400 147.6%Managed funds (e.g. poverty alleviation fund)
– 665 837 – 747 716 – 815 407 – – –
Derivatives financial instruments 686 020 – – – – – – – – Total equity and liabilities 760 751 811 656 170 848 975 644 250 310 1 141 145 239 630 227 730 222.0%

Vote 3: Communications
33
Statements of financial performance and position estimates Table 3.44 The Independent Communications Authority of South Africa statements of estimates of financial performance and position Statement of financial performance
Revised estimate
Averagegrowth
rate(%)
Expen-diture/Total:
Average(%) Medium-term estimate
Averagegrowth
rate(%)
Expen-diture/Total:
Average(%)
R thousand 2014/15 2011/12 - 2014/15 2015/16 2016/17 2017/18 2014/15 - 2017/18 Revenue Non-tax revenue 10 101 13.2% 3.2% 10 000 10 500 11 000 2.9% 2.5%Other non-tax revenue 10 101 13.2% 3.2% 10 000 10 500 11 000 2.9% 2.5%Transfers received 376 221 6.3% 96.8% 393 619 414 981 435 205 5.0% 97.5%Total revenue 386 322 6.4% 100.0% 403 619 425 481 446 205 4.9% 100.0%Expenses Current expenses 389 221 7.4% 100.0% 392 262 414 992 492 820 8.2% 100.0%Compensation of employees 235 959 8.2% 59.4% 253 685 261 294 274 360 5.2% 61.0%Goods and services 138 105 5.2% 36.7% 120 577 135 198 200 460 13.2% 34.9%Depreciation 15 157 18.9% 3.7% 18 000 18 500 18 000 5.9% 4.1%Total expenses 389 221 7.4% 100.0% 392 262 414 992 492 820 8.2% 100.0%Surplus/(Deficit) (2 899) -177.6% – 11 357 10 489 (46 615) 152.4% – Statement of financial position Carrying value of assets 187 146 23.4% 28.5% 203 000 197 300 209 138 3.8% 85.0%of which: Acquisition of assets 72 498 80.0% 9.4% 9 300 – 13 000 -43.6% 10.3%Inventory 530 1.4% 0.1% 550 560 594 3.8% 0.2%Receivables and prepayments 8 100 -77.0% 55.4% 8 300 8 600 9 116 4.0% 3.6%Cash and cash equivalents 31 954 -11.1% 15.9% 23 500 23 500 24 910 -8.0% 11.1%Total assets 227 730 -34.5% 100.0% 235 350 229 960 243 758 2.3% 100.0%Accumulated surplus/(deficit) 207 006 20.1% 33.8% 198 900 190 560 201 994 -0.8% 85.3%Finance lease 324 -41.3% 0.1% 2 250 1 400 1 484 66.1% 0.6%Trade and other payables 4 000 -36.3% 2.1% 4 500 5 000 5 300 9.8% 2.0%Provisions 16 400 21.5% 2.8% 29 700 33 000 34 980 28.7% 12.1%Total equity and liabilities 227 730 -34.5% 100.0% 235 350 229 960 243 758 103.8% 100.0%
Personnel information
Table 3.45 The Independent Communications Authority of South Africa personnel numbers and cost by salary level¹
Number of posts estimated for 31 March 2015 Number and cost1 of personnel posts filled / planned for on funded establishment Number
Number of
funded posts
Number of
posts on approved
establishment Actual Revised estimate
Medium-term expenditure estimate
Averagegrowth
rate(%)
Salarylevel/total:
Average(%)
2013/14 2014/15 2015/16 2016/17 2017/18 2014/15 - 2017/18 The Independent Communications Authority of South Africa
Number Cost
Unit Cost
Number Cost
Unit Cost
Number Cost
Unit Cost
Number Cost
Unit Cost
Number Cost
Unit Cost
Salary level
408 408 405 204.2 0.5 408 236.0 0.6 410 253.7 0.6 410 261.3 0.6 412 274.4 0.7 5.2% 100.0%
1 – 6 35 35 32 4.0 0.1 35 4.3 0.1 37 4.7 0.1 37 4.9 0.1 37 4.9 0.1 4.6% 8.9%7 – 10 80 80 80 24.0 0.3 80 25.2 0.3 80 26.4 0.3 80 27.8 0.3 80 27.8 0.3 3.3% 19.5%11 – 12 219 219 219 104.1 0.5 219 122.5 0.6 219 134.4 0.6 219 136.1 0.6 221 149.1 0.7 6.8% 53.5%13 – 16 73 73 73 70.2 1.0 73 81.9 1.1 73 86.0 1.2 73 90.3 1.2 73 90.3 1.2 3.3% 17.8%17 – 22 1 1 1 1.9 1.9 1 2.0 2.0 1 2.1 2.1 1 2.2 2.2 1 2.2 2.2 3.3% 0.2%1. Rand million.
Media Development Diversity Agency
Mandate The Media Development and Diversity Agency was set up in terms of the Media Development and Diversity Agency Act (2002) to enable historically disadvantaged communities and individuals to gain access to the media. The mandate of the agency is to: create an enabling environment for media development and diversity which reflects the needs and aspirations of all South Africans; redress the exclusion and marginalisation of disadvantaged communities and people from access to the media and the media industry; and promote media development and diversity by providing support primarily to community and small commercial media projects. The overall objective of the agency is to ensure that all citizens can access information in a language of their choice, and to transform media access, ownership and control patterns in South Africa.

2015 Estimates of National Expenditure
34
Selected performance indicators
Table 3.46 Media Development Diversity Agency performance indicators by programme/objective/activity and related outcome Indicator Programme/Objective/Activity Outcome Past Current Projections
2011/12 2012/13 2013/14 2014/15 2015/16 2016/17 2017/18 Number of research and training projects undertaken/funded per year
Grant funding and non-financial support
Entity mandate
30 98 12 36 35 35 35
Number of seminars/media summits conducted in all provinces per year
Grant funding and non-financial support
12 13 12 15 20 25 25
Number of programming and production projects funded per year
Grant funding and non-financial support
7 4 12 4 4 6 6
Number of community media projects trained in the learning forum per year
Grant funding and non-financial support
25 45 45 60 65 75 75
Number of small commercial media projects trained in learning forum per year
Grant funding and non-financial support
35 50 55 60 65 65 65
Number of grantee orientation workshops conducted per year
Grant funding and non-financial support
1 1 1 1 1 1 1
Number of trainers/mentors trained for community and small commercial media per year
Grant funding and non-financial support
50 50 40 40 50 55 55
Number of media literacy summits supported per year
Grant funding and non-financial support
1 1 1 1 1 1 1
Frequency of conducting a social impact monitoring and evaluation study
Grant funding and non-financial support
–1 1 –1 1 –1 1 –1
Number of projects monitored through site visits per year
Grant funding and non-financial support
40 45 60 65 80 90 110
1. The social impact monitoring and evaluation study is conducted biannually.
Expenditure analysis The delivery imperatives of the Media Development and Diversity Agency Act (2002), the national development plan and national communication strategy framework have resulted in a review of the Media Development and Diversity Agency’s programmes. The agency will over the MTEF period focus on providing technical, non-financial and financial support to diverse media platforms and intensify its efforts to support the increased participation of communities in ownership and control of community and small commercial media. In so doing, the agency will contribute to outcome 14 of government’s 2014-2019 medium term strategic framework (nation building and social cohesion).
Flowing from this, the agency will seek to provide technical, non-financial and financial support to diverse media platforms over the medium term, and increase the participation of communities in the ownership and control of community and small commercial media. The agency’s key focus over the medium term will be on: promoting ownership of, control of and access to information and content production by communities; enhancing ownership, participation and control of print and digital media by independent media entrepreneurs; creating and enhancing a body of knowledge of the media landscape; and building capacity for a diverse media industry.
The agency will also focus over the MTEF period on ensuring the sustainability of existing small commercial projects through building capacity and maintaining the funding level for the community media projects. Community media grants are expected to be the largest expenditure item, constituting of 46.4 per cent of the agency’s total expenditure over the medium term as the organisation continues to carry out its core function of developing the sector.
Between 2011/12 and 2014/15, spending on transfers and subsidies for approved grant applicants averaged 67.1 per cent of expenditure, with an average annual growth of negative 0.9 per cent. This slight decrease is attributed to the decline in the broadcast and print revenues. Although there is growth in the broadcast sector, the agency will find it difficult to fulfil its mandate in terms of the promotion of ownership of small commercial media projects due to decreasing funding.
The act defines the small commercial media as independent publishers, and community media as community owned and controlled broadcast and print projects.The number of funded community media projects increased from 20 in 2013/14 to 25 in 2014/15, while the number of small commercial media projects decreased significantly, from 9 to 3, over the same period. The number of small commercial projects funded is expected to

Vote 3: Communications
35
remain constant at 2 per year over the medium term. Through grant and seed funding, the number of community and small commercial projects participating in capacity building initiatives is projected to increase from 120 in 2014/15 to 140 in 2017/18.
The agency will also focus on increasing the number of projects undergoing monitoring and evaluation over the medium term. Spending on transfers and subsidies to recipients of small commercial and community media grants is expected to increase by an average of 4.6 per cent over the medium term, accounting for an average of 62.3 per cent of planned total expenditure, although the funding agreement between the agency and Print and Digital Media South Africa will not be renewed. The number of projects supported through grant funding in any given year depends on the quality and quantity of the applications received and funds available, although this number averaged 570 between 2011/12 to 2013/14.
The agency is funded mainly by transfers received from the Department of Communications and grants received from broadcast media, and earns non-tax revenue from interest generated on short term investments. The contract between the agency and print funders Print and Digital Media South Africa expired at the end of 2013/14, and its renewal is dependent on the conclusion of an impact assessment study that will be conducted in 2015/16. As a result, the agency does not expect to offer any further financial support to small commercial projects over the MTEF period in addition to what has already been committed. This is due to the anticipated growth of the broadcast industry.
Between 2011/12 and 2014/15, spending on compensation of employees grew at an average annual rate of 40.2 per cent as a result of the expansion of the organisational structure from 19 to 29, which included filling 5 critical executive and management posts. The agency’s number of personnel is expected to remain stable at 29 over the medium term. The filling of these positions will optimise the performance of the agency, as it will be fully capacitated. Consequently, expenditure on compensation of employees is expected to grow at an average annual rate of 7.8 per cent over the medium term, driven mainly by improvements in conditions of service.
The agency aims to retain its skilled workforce by offering and maintaining competitive salaries over the medium term. Consultants provide internal audit services, as the agency does not have the personnel to perform these tasks. Spending on consultants over the medium term is expected to be R1 million.
Programmes/objectives/activities
Table 3.47 Media Development Diversity Agency expenditure trends and estimates by programme/objective/activity
Audited outcome Revisedestimate
Averagegrowth
rate(%)
Expen-diture/Total:
Average(%)
Medium-term expenditure estimate
Averagegrowth
rate(%)
Expen-diture/Total:
Average(%)
R thousand 2011/12 2012/13 2013/14 2014/15 2011/12 - 2014/15 2015/16 2016/17 2017/18 2014/15 - 2017/18 Administration 13 225 13 125 15 670 10 009 -8.9% 24.8% 10 570 11 256 13 752 11.2% 22.1%Grant funding and non-financial support
31 672 47 103 42 089 38 013 6.3% 75.2% 38 613 39 512 44 254 5.2% 77.9%
Total 44 897 60 228 57 759 48 022 2.3% 100.0% 49 183 50 768 58 006 6.5% 100.0%
Statements of historical financial performance and position
Table 3.48 Media Development Diversity Agency statements of historical financial performance and position Statement of financial performance
Budget Audited outcome Budget
Audited outcome Budget
Audited outcome
Budget estimate
Revisedestimate
Outcome/ Budget
Average(%)
R thousand 2011/12 2012/13 2013/14 2014/15 2011/12 - 2014/15 Revenue Non-tax revenue 6 703 3 962 7 374 4 026 7 465 4 103 7 378 7 378 67.3%Other non-tax revenue 6 703 3 962 7 374 4 026 7 465 4 103 7 378 7 378 67.3%Transfers received 37 221 49 255 44 834 52 644 46 629 56 594 50 318 46 318 114.4%Total revenue 43 924 53 217 52 208 56 670 54 094 60 697 57 696 53 696 107.9%Expenses Current expenses 13 180 13 225 14 858 18 205 15 247 20 850 15 683 17 241 117.9%Compensation of employees 5 724 5 490 6 993 10 569 7 149 12 029 7 896 15 128 155.7%Goods and services 7 047 7 522 7 587 7 451 7 902 8 610 7 601 1 927 84.6%Depreciation 409 213 278 185 196 211 186 186 74.4%Transfers and subsidies 30 744 31 672 37 350 42 023 38 514 36 909 42 013 30 781 95.1%Total expenses 43 924 44 897 52 208 60 228 53 761 57 759 57 696 48 022 101.6%Surplus/(Deficit) – 8 320 – (3 558) 333 2 938 – 5 674 –

2015 Estimates of National Expenditure
36
Table 3.48 Media Development Diversity Agency statements of historical financial performance and position Statement of financial position
Budget Audited outcome Budget
Audited outcome Budget
Audited outcome
Budget estimate
Revised estimate
Outcome/ Budget
Average(%)
R thousand 2011/12 2012/13 2013/14 2014/15 2011/12 - 2014/15 Carrying value of assets 460 340 245 414 254 437 281 281 118.7%of which: Acquisition of assets 113 201 133 259 93 234 86 86 183.5%Inventory – 19 – 23 – 19 – 15 – Accrued investment interest – – – – – – – 190 – Receivables and prepayments 180 8 555 451 8 772 234 9 194 8 005 8 005 389.2%Cash and cash equivalents 45 568 79 041 42 591 75 675 27 938 76 498 13 268 13 268 189.0%Total assets 46 208 87 955 43 287 84 884 28 426 86 148 21 554 21 759 201.3%Accumulated surplus/(deficit) 19 927 77 188 37 422 73 630 5 471 76 568 2 810 2 810 350.7%Capital reserve fund – 9 509 – 9 003 – 6 882 16 478 16 478 254.1%Finance lease – 54 4 367 285 – 393 – – 16.8%Trade and other payables 26 106 1 204 1 299 1 966 1 180 1 721 2 038 2 001 22.5%Provisions 175 – 199 – 199 584 228 470 131.6%Managed funds (e.g. poverty alleviation fund)
– – – – 21 576 – – – –
Total equity and liabilities 46 208 87 955 43 287 84 884 28 426 86 148 21 554 21 759 201.3%
Statements of estimates of financial performance and position
Table 3.49 Media Development Diversity Agency statements of estimates of financial performance and position Statement of financial performance
Revised estimate
Averagegrowth
rate(%)
Expen-diture/Total:
Average(%) Medium-term estimate
Averagegrowth
rate(%)
Expen-diture/Total:
Average(%)
R thousand 2014/15 2011/12 - 2014/15 2015/16 2016/17 2017/18 2014/15 - 2017/18 Revenue Non-tax revenue 7 378 23.0% 8.8% 7 708 8 400 9 853 10.1% 14.5%Other non-tax revenue 7 378 23.0% 8.8% 7 708 8 400 9 853 10.1% 14.5%Transfers received 46 318 -2.0% 91.2% 47 117 48 317 53 783 5.1% 85.5%Total revenue 53 696 0.3% 100.0% 54 825 56 717 63 636 5.8% 100.0%Expenses Current expenses 17 241 9.2% 32.9% 18 301 19 476 22 794 9.8% 37.7%Compensation of employees 15 128 40.2% 20.5% 16 095 17 144 18 954 7.8% 32.7%Goods and services 1 927 -36.5% 12.0% 2 011 2 124 3 560 22.7% 4.6%Depreciation 186 -4.4% 0.4% 195 208 280 14.6% 0.4%Transfers and subsidies 30 781 -0.9% 67.1% 30 882 31 292 35 212 4.6% 62.3%Total expenses 48 022 2.3% 100.0% 49 183 50 768 58 006 6.5% 100.0%Surplus/(Deficit) 5 674 -12.0% – 5 642 5 949 5 630 -0.3% – Statement of financial position Carrying value of assets 281 -6.2% 0.7% 301 493 760 39.3% 2.3%of which: Acquisition of assets 86 -24.6% 0.3% – – 1 730 172.0% 2.3%Inventory 15 -7.6% 0.0% 10 10 10 -12.6% 0.1%Accrued investment interest 190 – 0.2% – – – -100.0% 0.2%Receivables and prepayments 8 005 -2.2% 16.9% 8 005 8 010 8 010 0.0% 38.9%Cash and cash equivalents 13 268 -44.8% 82.2% 14 500 10 500 10 500 -7.5% 58.6%Total assets 21 759 -37.2% 100.0% 22 816 19 013 19 280 -4.0% 100.0%Accumulated surplus/(deficit) 2 810 -66.9% 69.1% 20 951 17 363 17 709 84.7% 72.0%Capital reserve fund 16 478 20.1% 26.3% – – – -100.0% 18.9%Trade and other payables 2 001 18.5% 3.7% 1 500 1 200 1 200 -15.7% 7.1%Provisions 470 – 0.7% 365 450 371 -7.6% 2.0%Total equity and liabilities 21 759 -37.2% 100.0% 22 816 19 013 19 280 -38.5% 100.0%
Personnel information
Table 3.50 Media Development Diversity Agency personnel numbers and cost by salary level¹
Number of posts estimated for
31 March 2015 Number and cost1 of personnel posts filled / planned for on funded establishment Number
Number of
funded posts
Number of
posts on approved
establishment Actual Revised estimate
Medium-term expenditure estimate
Averagegrowth
rate(%)
Salarylevel/total:
Average(%)
2013/14 2014/15 2015/16 2016/17 2017/18 2014/15 - 2017/18 Media Development Diversity Agency
Number Cost
Unit Cost
Number Cost
Unit Cost
Number Cost
Unit Cost
Number Cost
Unit Cost
Number Cost
Unit Cost
Salary level
29 25 24 12.0 0.5 29 15.1 0.5 29 16.1 0.6 29 17.1 0.6 29 19.0 0.7 7.8% 100.0%
7 – 10 2 2 2 3.7 1.9 2 0.5 0.3 2 0.5 0.2 2 0.5 0.2 2 0.6 0.3 2.7% 6.9%11 – 12 16 12 12 3.9 0.3 16 4.1 0.3 16 4.6 0.3 16 4.7 0.3 16 5.2 0.3 8.4% 55.2%13 – 16 10 10 9 2.5 0.3 10 6.3 0.6 10 7.5 0.7 10 8.2 0.8 10 9.0 0.9 12.8% 34.5%17 – 22 1 1 1 1.9 1.9 1 4.2 4.2 1 3.6 3.6 1 3.8 3.8 1 4.1 4.1 -0.7% 3.4%1. Rand million.


Private Bag X115 Pretoria 0001 | 40 Church square Pretoria 0002 | Tel +27 12 395 6697 | Fax +27 12 406 9055
Photos provided by GCIS.


