69
Queensland Budget 2015-16 Post Budget Seminar Kelly Fawke Principal Communications Officer, Strategic Communications

Queensland Budget 2015-16
Post Budget Seminar
Kelly Fawke Principal Communications Officer, Strategic Communications

Queensland Budget 2015-16
Welcome
Jim Murphy Under Treasurer

Queensland Budget 2015-16
The Queensland Economy Greg Uptin Director, Economic Information, Monitoring and Forecasting Team
Economics Division

Queensland Budget 2015-16
Summary of economic forecasts
Actual Estimate Forecasts Projection
2013-14 2014-15 2015-16 2016-17 2017-18 2018-19
Gross state product 2.3 2 4½ 4½ 3¾ 3¼
Employment2 1.4 0.5 1¼ 1¾ 2 2¼
Unemployment rate2 6.0 6.5 6½ 6½ 6¼ 6
Inflation 2.8 2 2¼ 2½ 2½ 2½
Wage Price Index 2.6 2½ 2½ 2¾ 3 3¼
Population 1.7 1½ 1¾ 1¾ 1¾ 1¾
1 . Annual % change, except for unemployment rate.
2. Actual outcome for 2014-15.
Sources: ABS 3101.0, 5220.0, 6202.0, 6345.0, 6401.0 and Queensland Treasury.
2015-16 Queensland State Budget: Economic Forecasts1

Queensland Budget 2015-16
Structure

Queensland Budget 2015-16
Household spending accounts for over half of all economic activity.
-60 0 60 120 180
Balancing Item
Overseas Imports
Overseas Exports
Public Investment
Public Consumption
Business Investment
Dwelling Investment
Household Consumption
$Billion
Queensland gross state product, by component, 2013-14
Source: ABS 5220.0.

Queensland Budget 2015-16
The trade sector plays a key role in the Queensland economy.
0
10
20
30
40
50
NSW Victoria Queensland WA
Goods Services
1. Percent.
Source: ABS 5220.0.
Overseas exports as a share of real gross state product1, 2013-14
Queensland Budget 2015-16
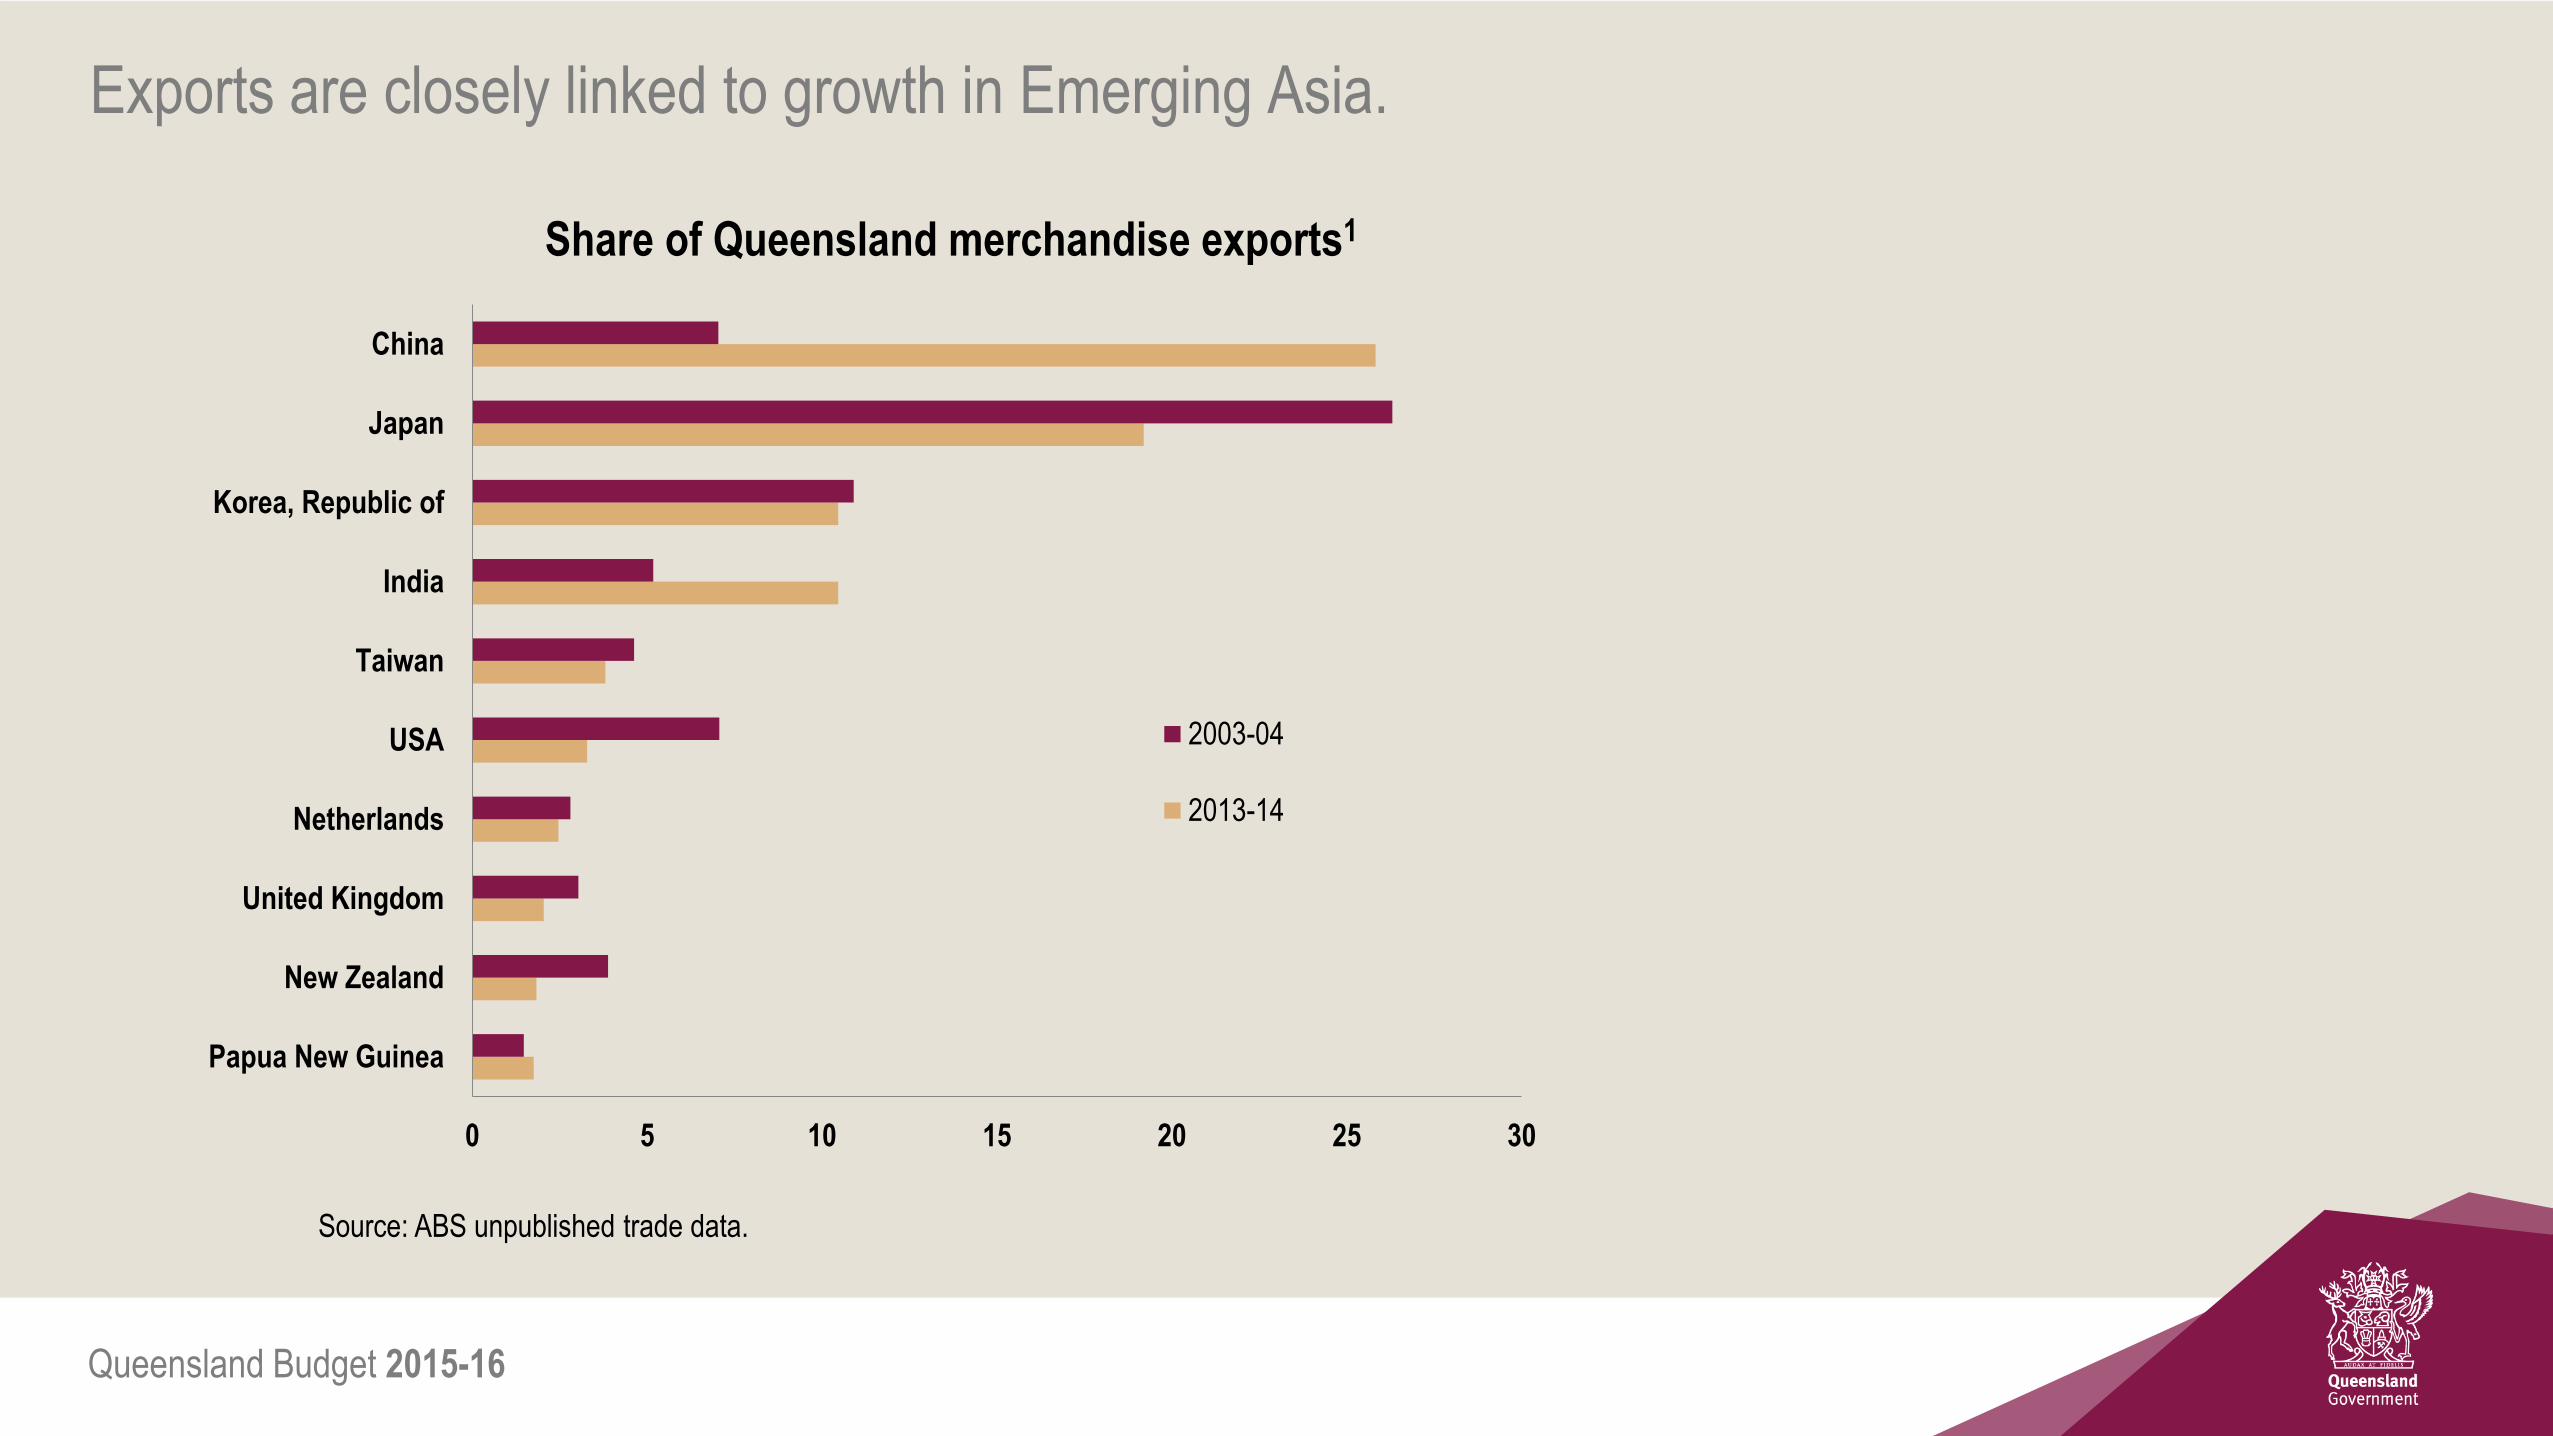
Exports are closely linked to growth in Emerging Asia.
0 5 10 15 20 25 30
Papua New Guinea
New Zealand
United Kingdom
Netherlands
USA
Taiwan
India
Korea, Republic of
Japan
China
2003-04
2013-14
Share of Queensland merchandise exports1
Source: ABS unpublished trade data.

Queensland Budget 2015-16
External conditions

Queensland Budget 2015-16
While MTP growth is expected to improve in 2015 and 2016…
Queensland major trading partner economic growth1
0
1
2
3
4
5
6
7
2000 2002 2004 2006 2008 2010 2012 2014 2016 2018
1. Annual % change. 2015 to 2018 are forecasts
Sources: Consensus Economics and Queensland Treasury.

Queensland Budget 2015-16
…medium-term growth for most major Queensland export markets
has been revised down over the past year.
Cumulative industrial production growth1 2013 to 2019
0
10
20
30
40
50
60
70
US Euro Zone Japan Korea China India
April 2014 forecasts April 2015 forecasts
1. India’s industrial production growth profile is on its fiscal year basis (April to March).
Source: Consensus Economics.

Queensland Budget 2015-16
Industrial commodity prices have fallen.
1. US$ per barrel.
Source: DataStream.
40
60
80
100
120
Apr–14 Jul–14 Oct–14 Jan–15 Apr–15 Jul–15 80
90
100
110
120
Apr–14 Jul–14 Oct–14 Jan–15 Apr–15 Jul–15
2. US$ per tonne, Peak Downs region.
Source: Platts.
Brent crude oil1 Premium hard coking coal2

Queensland Budget 2015-16
National conditions and outlook

Queensland Budget 2015-16
The RBA continue to downgrade Australia’s economic growth prospects.
RBA’s GDP Growth Forecasts1
1.Year-average, annual % change.
Source: RBA.
0
1
2
3
4
2013-14 2014-15 2015-16 2016-17
May-14 Aug-14 Nov-14 Feb-15 May-15
Queensland Budget 2015-16
0.45
0.55
0.65
0.75
0.85
0.95
1.05
1.15
Jul–01 Jul–03 Jul–05 Jul–07 Jul–09 Jul–11 Jul–13 Jul–15
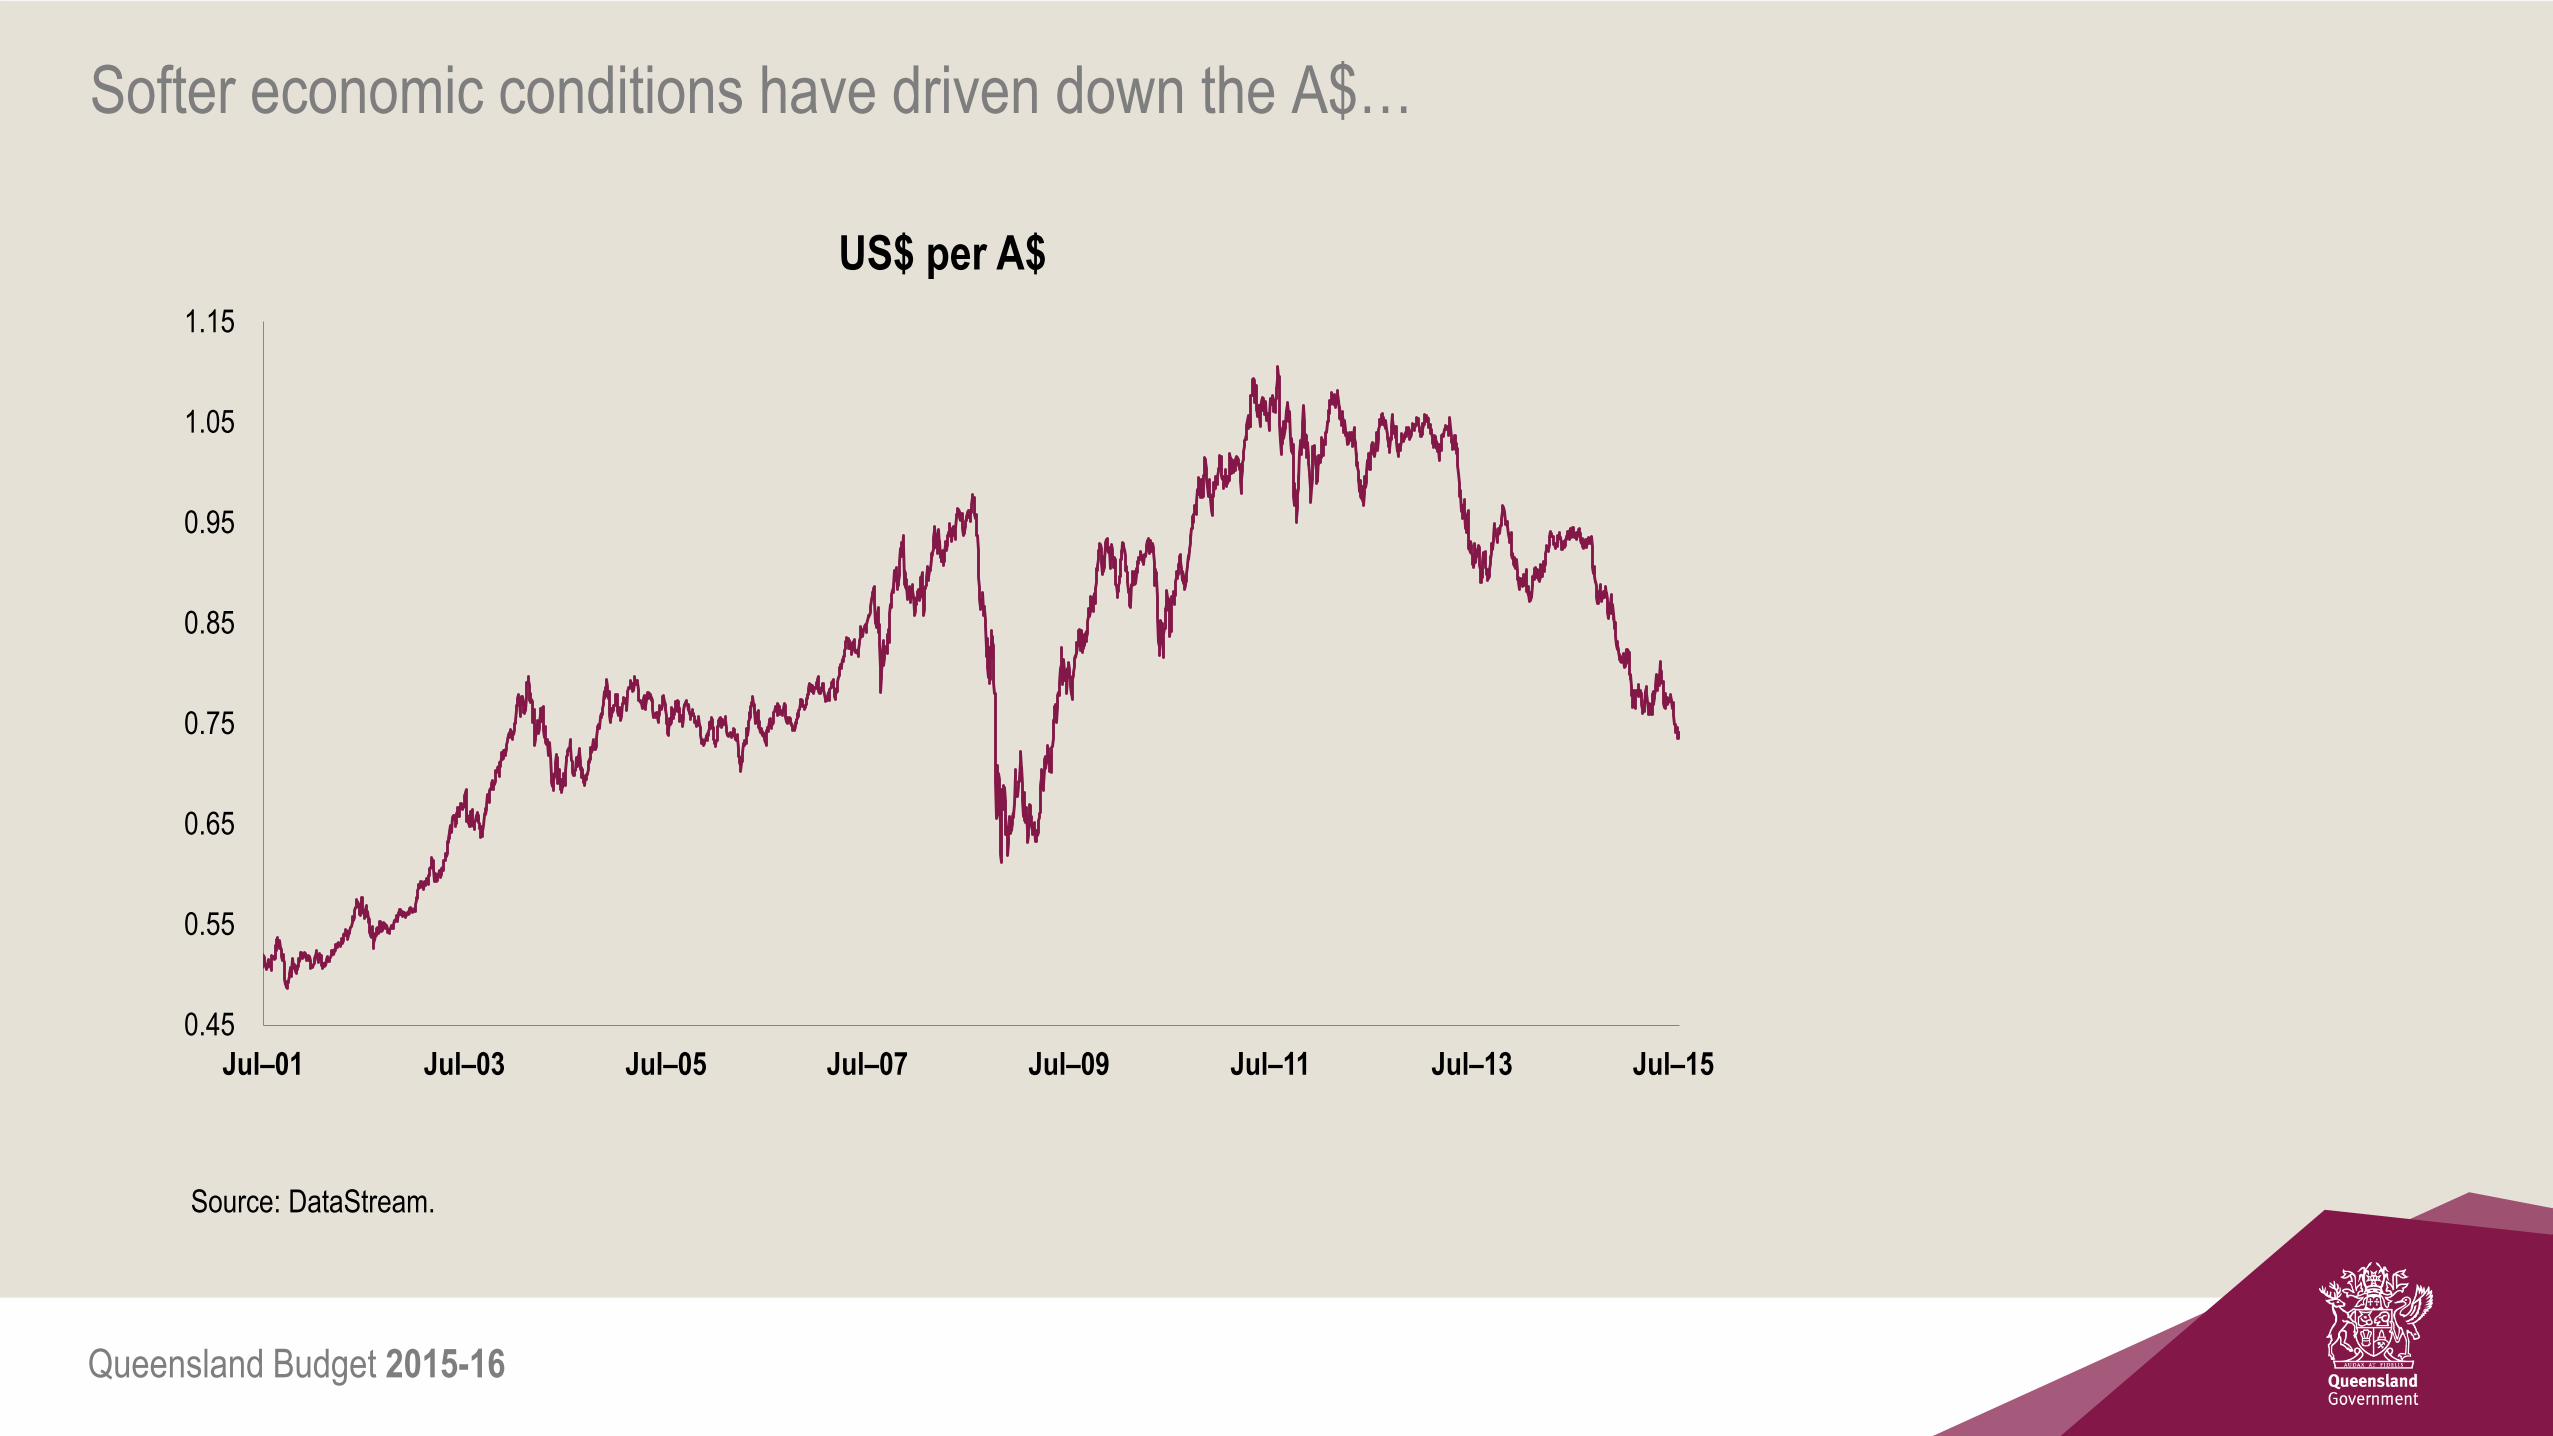
Softer economic conditions have driven down the A$…
US$ per A$
Source: DataStream.

Queensland Budget 2015-16
…as well as the cash rate.
0
1
2
3
4
5
6
7
8
Dec–06 Dec–08 Dec–10 Dec–12 Dec–14 Dec–16
Cash rate Market expectations
Targeted cash rate1 (%)
1. Expectations based on ASX Rate Tracker, as at market close on 22 July 2015.
Sources: Reserve Bank of Australia and ASX.

Queensland Budget 2015-16
Queensland conditions and outlook

Queensland Budget 2015-16
Growth profile driven by the transition of LNG projects from construction to production...
-1
0
1
2
3
4
5
6
7
8
1990-91 1993-94 1996-97 1999-00 2002-03 2005-06 2008-09 2011-12 2014-15 2017-18
Queensland Australia
GFC and
Floods
LNG investment phase LNG export phase
Mining boom
Housing boom
Australia’s 1990’s recession
Introduction of GST
Economic growth1
1. Annual % change, CVM, 2012-13 reference year.
Sources: ABS 5220.0 and Queensland Treasury.
Queensland Budget 2015-16
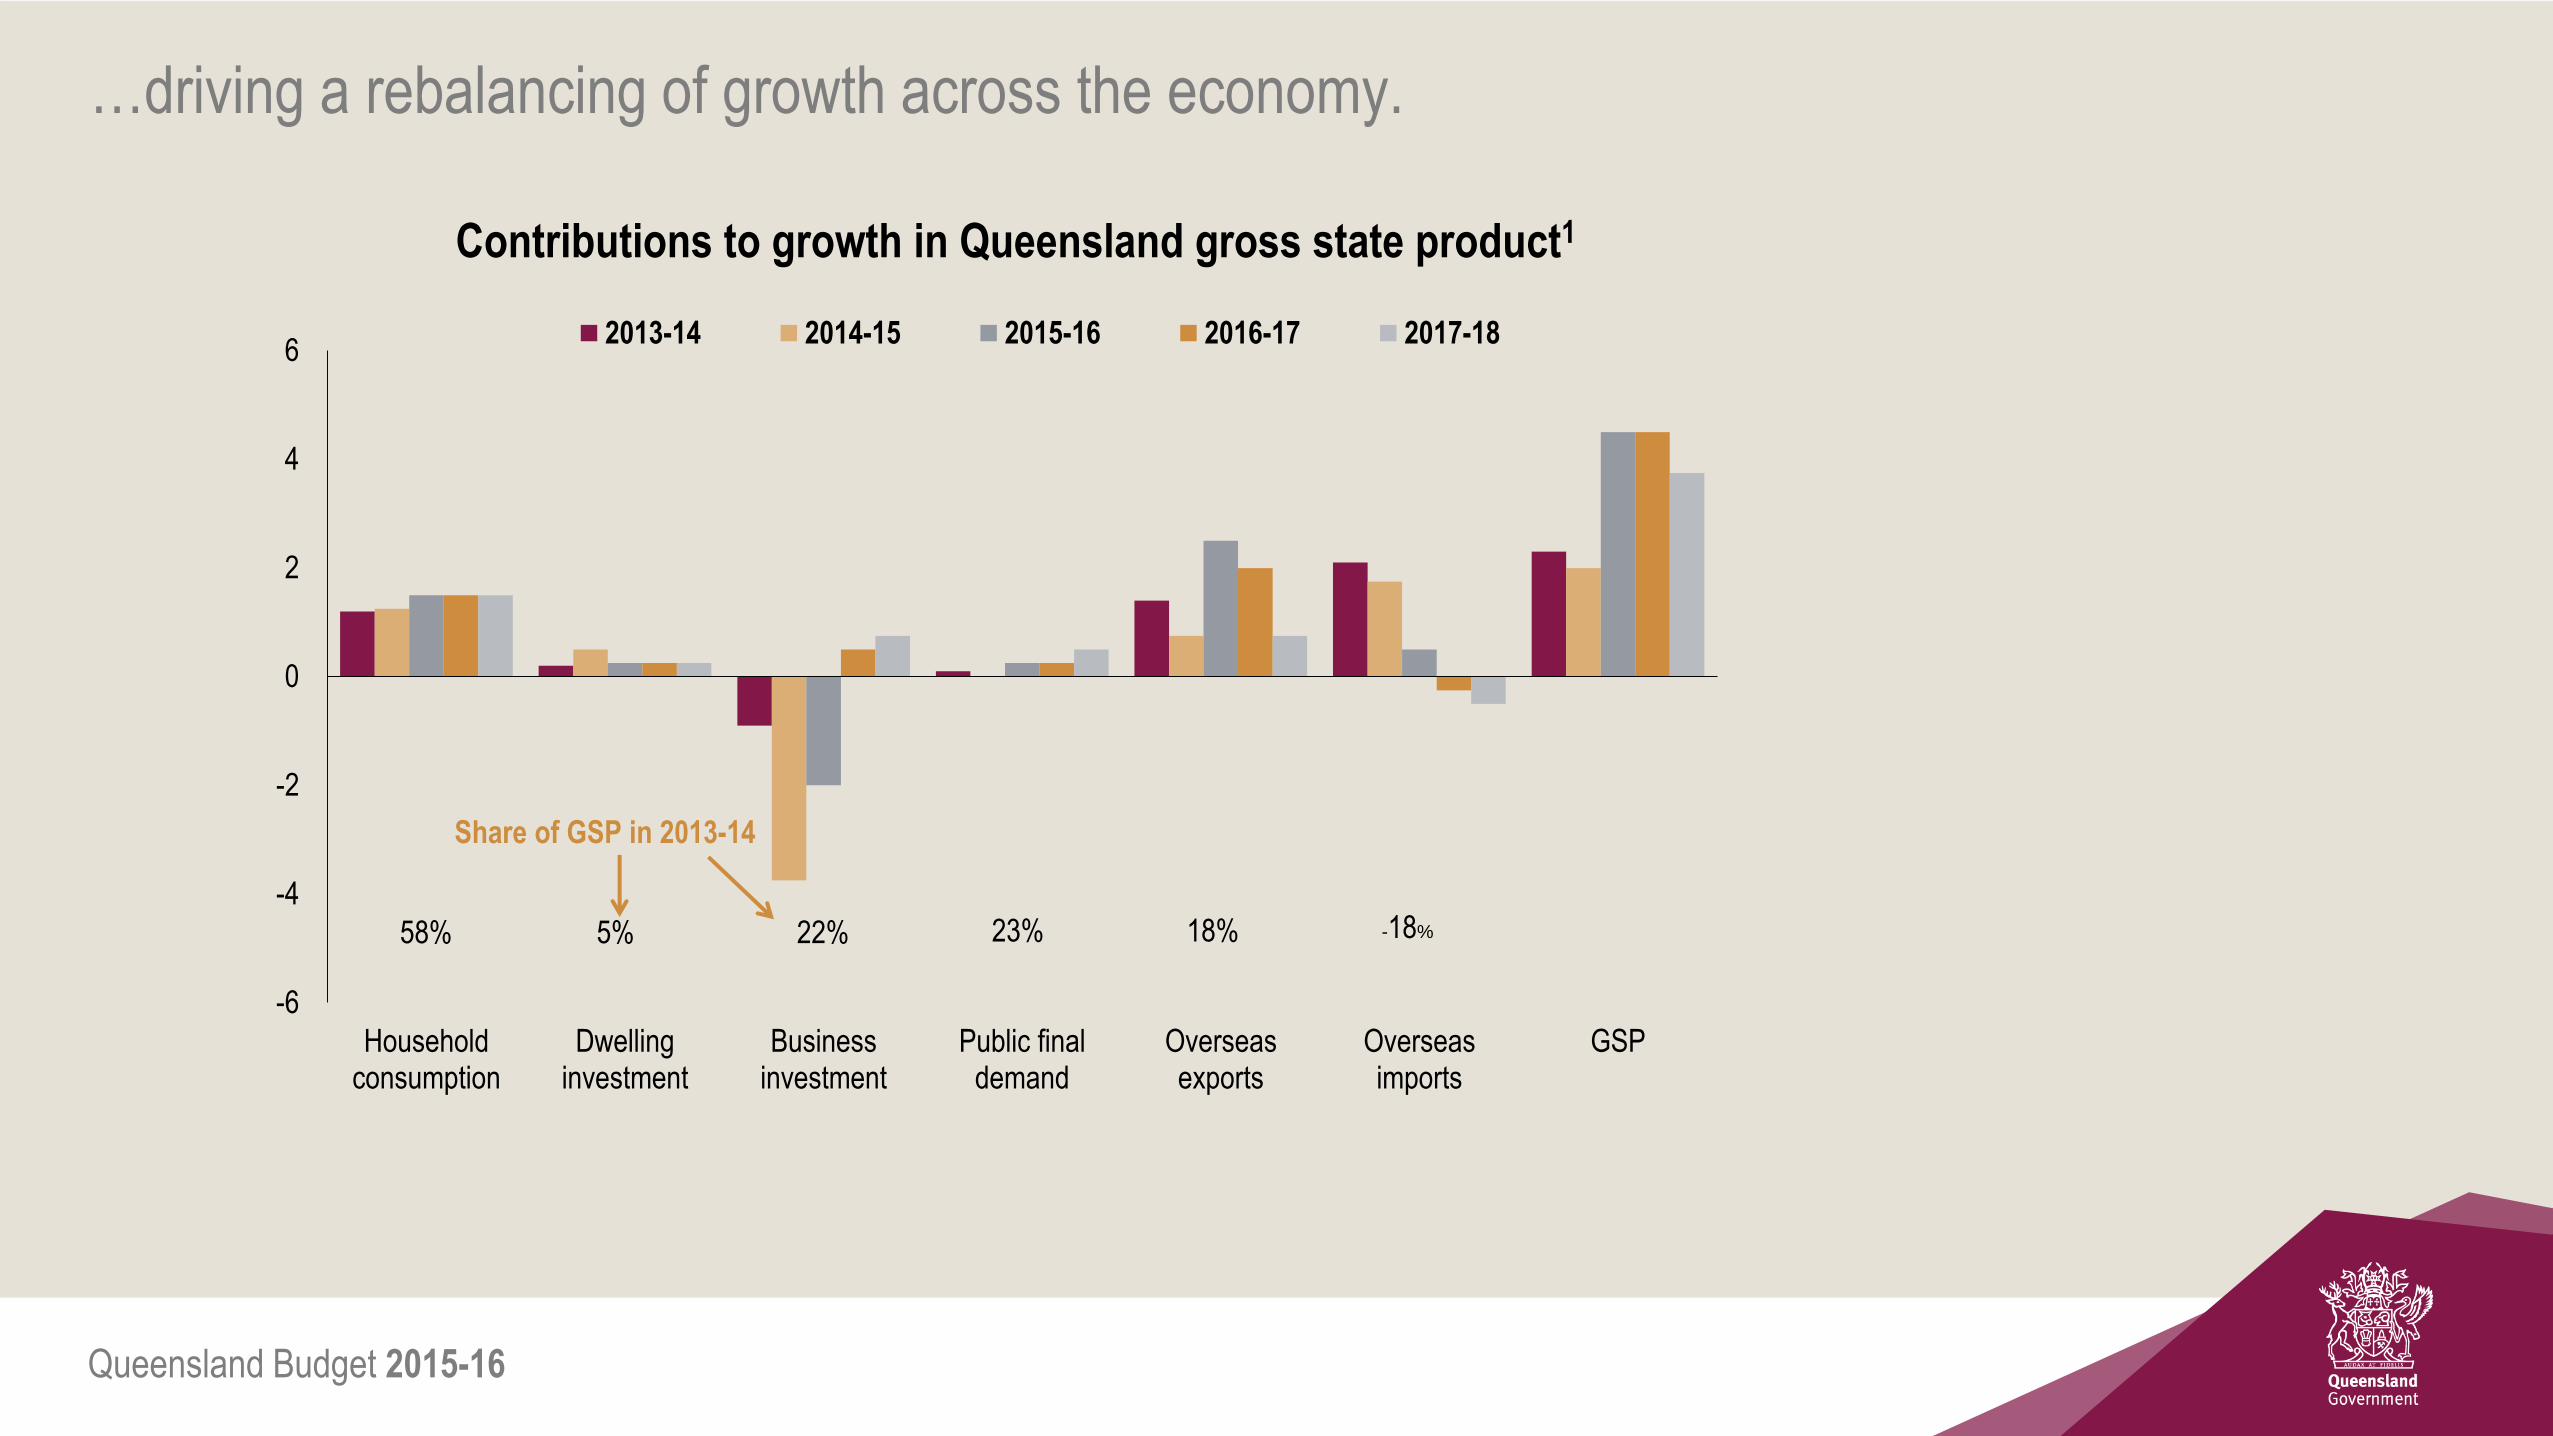
…driving a rebalancing of growth across the economy.
Contributions to growth in Queensland gross state product1
-6
-4
-2
0
2
4
6
Householdconsumption
Dwellinginvestment
Businessinvestment
Public finaldemand
Overseasexports
Overseasimports
GSP
2013-14 2014-15 2015-16 2016-17 2017-18
58% -18% 18% 23% 22% 5%
Share of GSP in 2013-14

Queensland Budget 2015-16
LNG construction peaked in 2013.
0
2
4
6
8
10
12
0
10
20
30
40
50
60
Mar-05 Mar-07 Mar-09 Mar-11 Mar-13 Mar-15
$Bill
ion
$Bill
ion
Engineering (lhs) Non-Residential (lhs) Non-dwelling construction (rhs)
QLD Curtis LNG commenced
Gladstone LNG commenced
Aust. Pacific LNG commenced
1.Nominal. Private sector work yet to be done in stacked bar, original. Non-dwelling construction in line, trend.
Sources: ABS 8752.0, 8762.0 and 5206.0.
Non-dwelling construction and work yet to be done, by sector1

Queensland Budget 2015-16
Household consumption to recover, but remain below average,
constrained by subdued income growth.
Nominal household consumption and employee income, Queensland1
0
2
4
6
8
10
12
14
16
1989-90 1994-95 1999-2000 2004-05 2009-10 2014-15
Household consumption Compensation of employees
1.Growth for 2014-15 reflects first three quarters.
Sources: ABS 5206.0 and Queensland Treasury.
Queensland Budget 2015-16
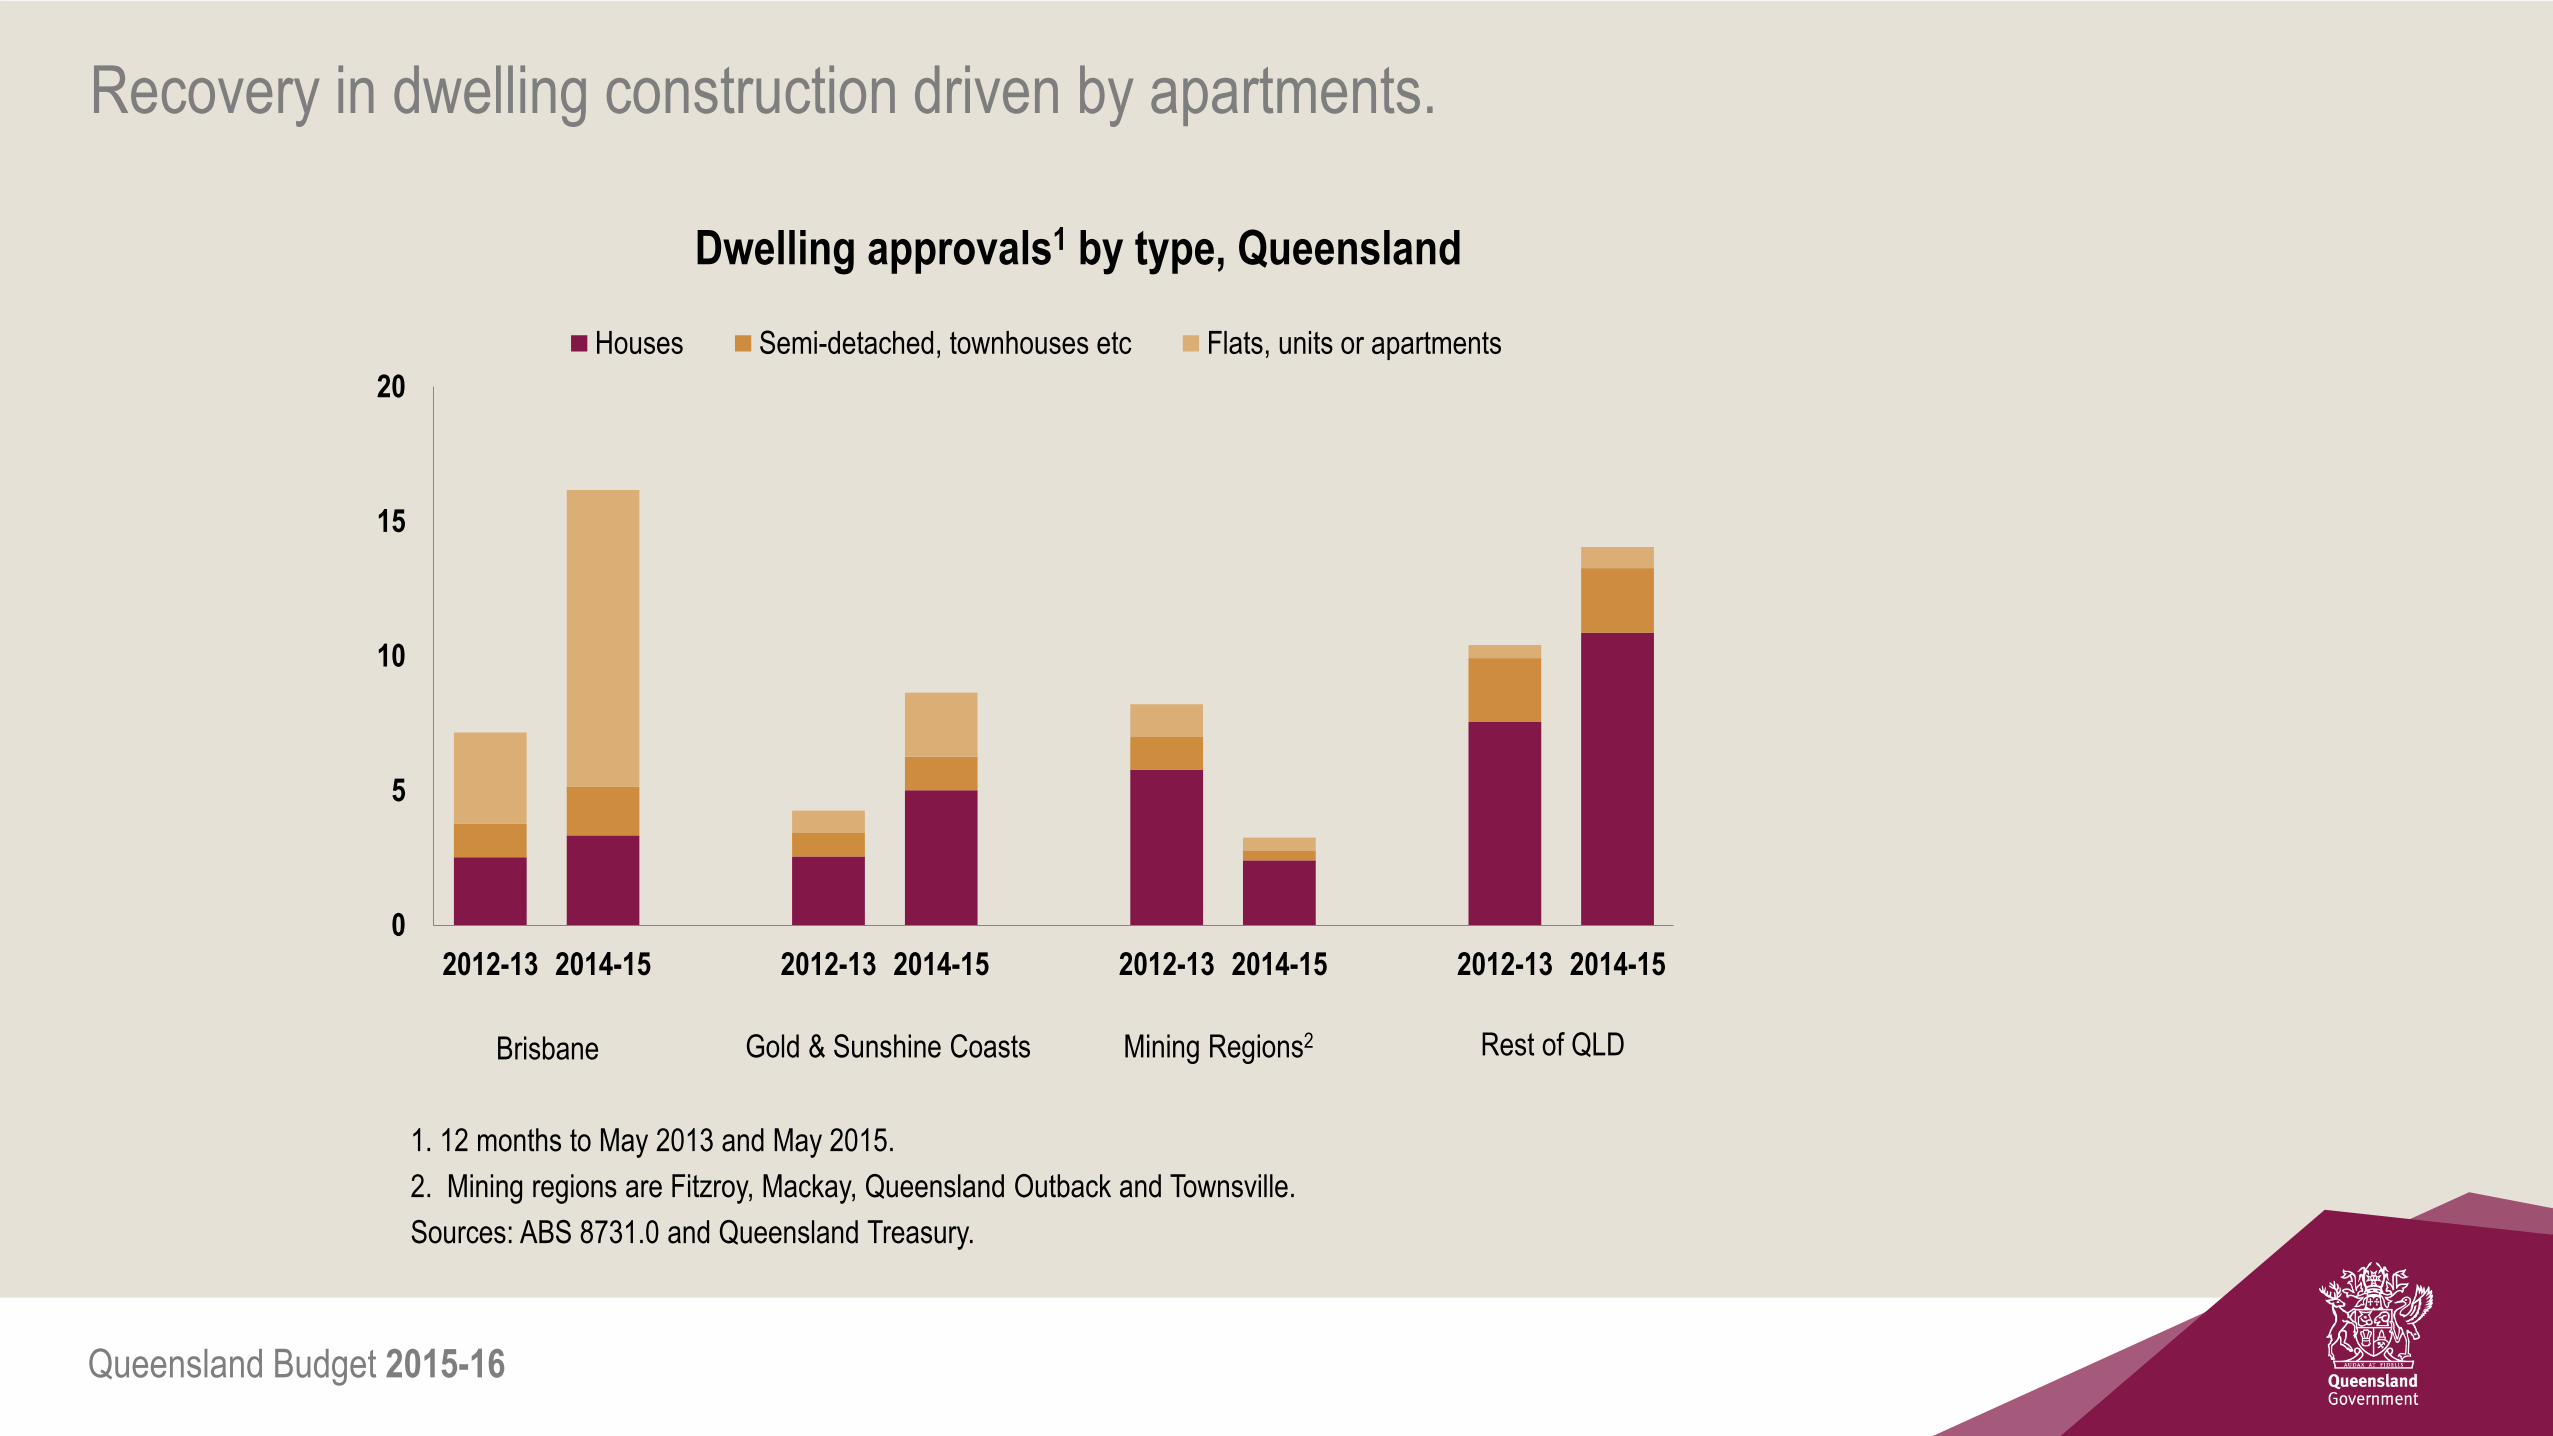
Recovery in dwelling construction driven by apartments.
Dwelling approvals1 by type, Queensland
0
5
10
15
20
2012-13 2014-15 2012-13 2014-15 2012-13 2014-15 2012-13 2014-15
Houses Semi-detached, townhouses etc Flats, units or apartments
Brisbane Gold & Sunshine Coasts Mining Regions2 Rest of QLD
1. 12 months to May 2013 and May 2015.
2. Mining regions are Fitzroy, Mackay, Queensland Outback and Townsville.
Sources: ABS 8731.0 and Queensland Treasury.

Queensland Budget 2015-16
LNG to drive a surge in overseas exports.
Overseas resources exports, Queensland1
0
5
10
15
20
25
30
35
2013-14 2014-15 2015-16 2016-17 2017-18 2018-19
Coal Base metals LNG
1.$billion, CVM, 2012-13 reference year. 2014-15 are estimates, 2015-16 onwards are forecasts.
Source: Queensland Treasury.

Queensland Budget 2015-16
Agricultural exports are hindered by prolonged drought.
Overseas agricultural exports Queensland1
1.$billion, CVM, 2012-13 reference year. 2014-15 are estimates, 2015-16 onwards are forecasts.
Source: Queensland Treasury.
0
1
2
3
4
2011-12 2012-13 2013-14 2014-15 2015-16 2016-17 2017-18 2018-19
Meat Sugar Cotton Wheat, Maize, Sorghum, Chickpeas

Queensland Budget 2015-16
Improvement in household sectors supporting some recovery in the labour market.
Labour Market, Queensland1
3
4
5
6
7
8
9
10
11
0
1
2
3
4
5
6
7
8
1988-89 1993-94 1998-99 2003-04 2008-09 2013-14 2018-19
Employment growth (% change, LHS) Unemployment rate (percent, RHS)
1. Year average. 2014-15 are actual outcomes, 2015-16 to 2017-18 are forecasts and 2018-19 are projections.
Sources: ABS 6202.0 and Queensland Treasury.

Queensland Budget 2015-16
Summary: Global and domestic conditions
The global and national economic outlook has softened over the past year.
A more subdued global outlook, combined with stronger global supply, has contributed to sharp declines in
commodity prices, including coal and oil.
Despite a lower A$, weaker prices have seen coal producers cut costs, reduced prospects for new investment and
led to softer household income growth.
Growth in household spending to recover, but remain below average, tempered by slower income growth, subdued
labour market conditions and ongoing consumer caution.
The wind-down in LNG construction and soft investment outside the resources sector to see business investment fall
further in 2015-16, before returning to a more sustainable growth path from 2016-17 onwards.
Lower interest rates, solid house price growth and rising investor interest are driving a sustained recovery in dwelling
investment, particularly in medium-to-high density housing in Brisbane City.

Queensland Budget 2015-16
Summary: Trade sector and labour market.
The growth boost from LNG exports now expected to be spread more evenly across 2015-16 and 2016-17,
driving economic growth of 4½% in both years.
As growth in China slows, coal exports volumes to grow moderately from 2015-16. Weaker global demand
and increased supply to keep coal prices subdued.
Sustained drought to constrain agricultural exports.
Tourism exports to grow at a healthy pace in coming years, reflecting increased outbound tourism from China,
the rising popularity of working holidays in the wider Asian tourism market and lower A$ exchange rates.
Employment growth to improve from a low base, reflecting the forecast acceleration in domestic activity,
including the household and dwelling sectors and a lower A$ improving the competitiveness of tourism and
education sectors.
Modest recovery in employment to see the unemployment rate stabilise around 6½% over the next two years,
before easing to 6% by 2018-19 as domestic activity strengthens.

Queensland Budget 2015-16
Queensland Budget John O’Connell Deputy Under Treasurer
Queensland Treasury

Queensland Budget 2015-16
Revenue growth exceeding growth in expenses
Enhanced Fiscal Principles
$1.2 billion operating surplus in 2015-16
Strong operating surpluses despite declining
royalty forecasts
First General Government debt reduction forecast
across the forward estimates in 16 years
Fiscal Outlook
Queensland Budget 2015-16
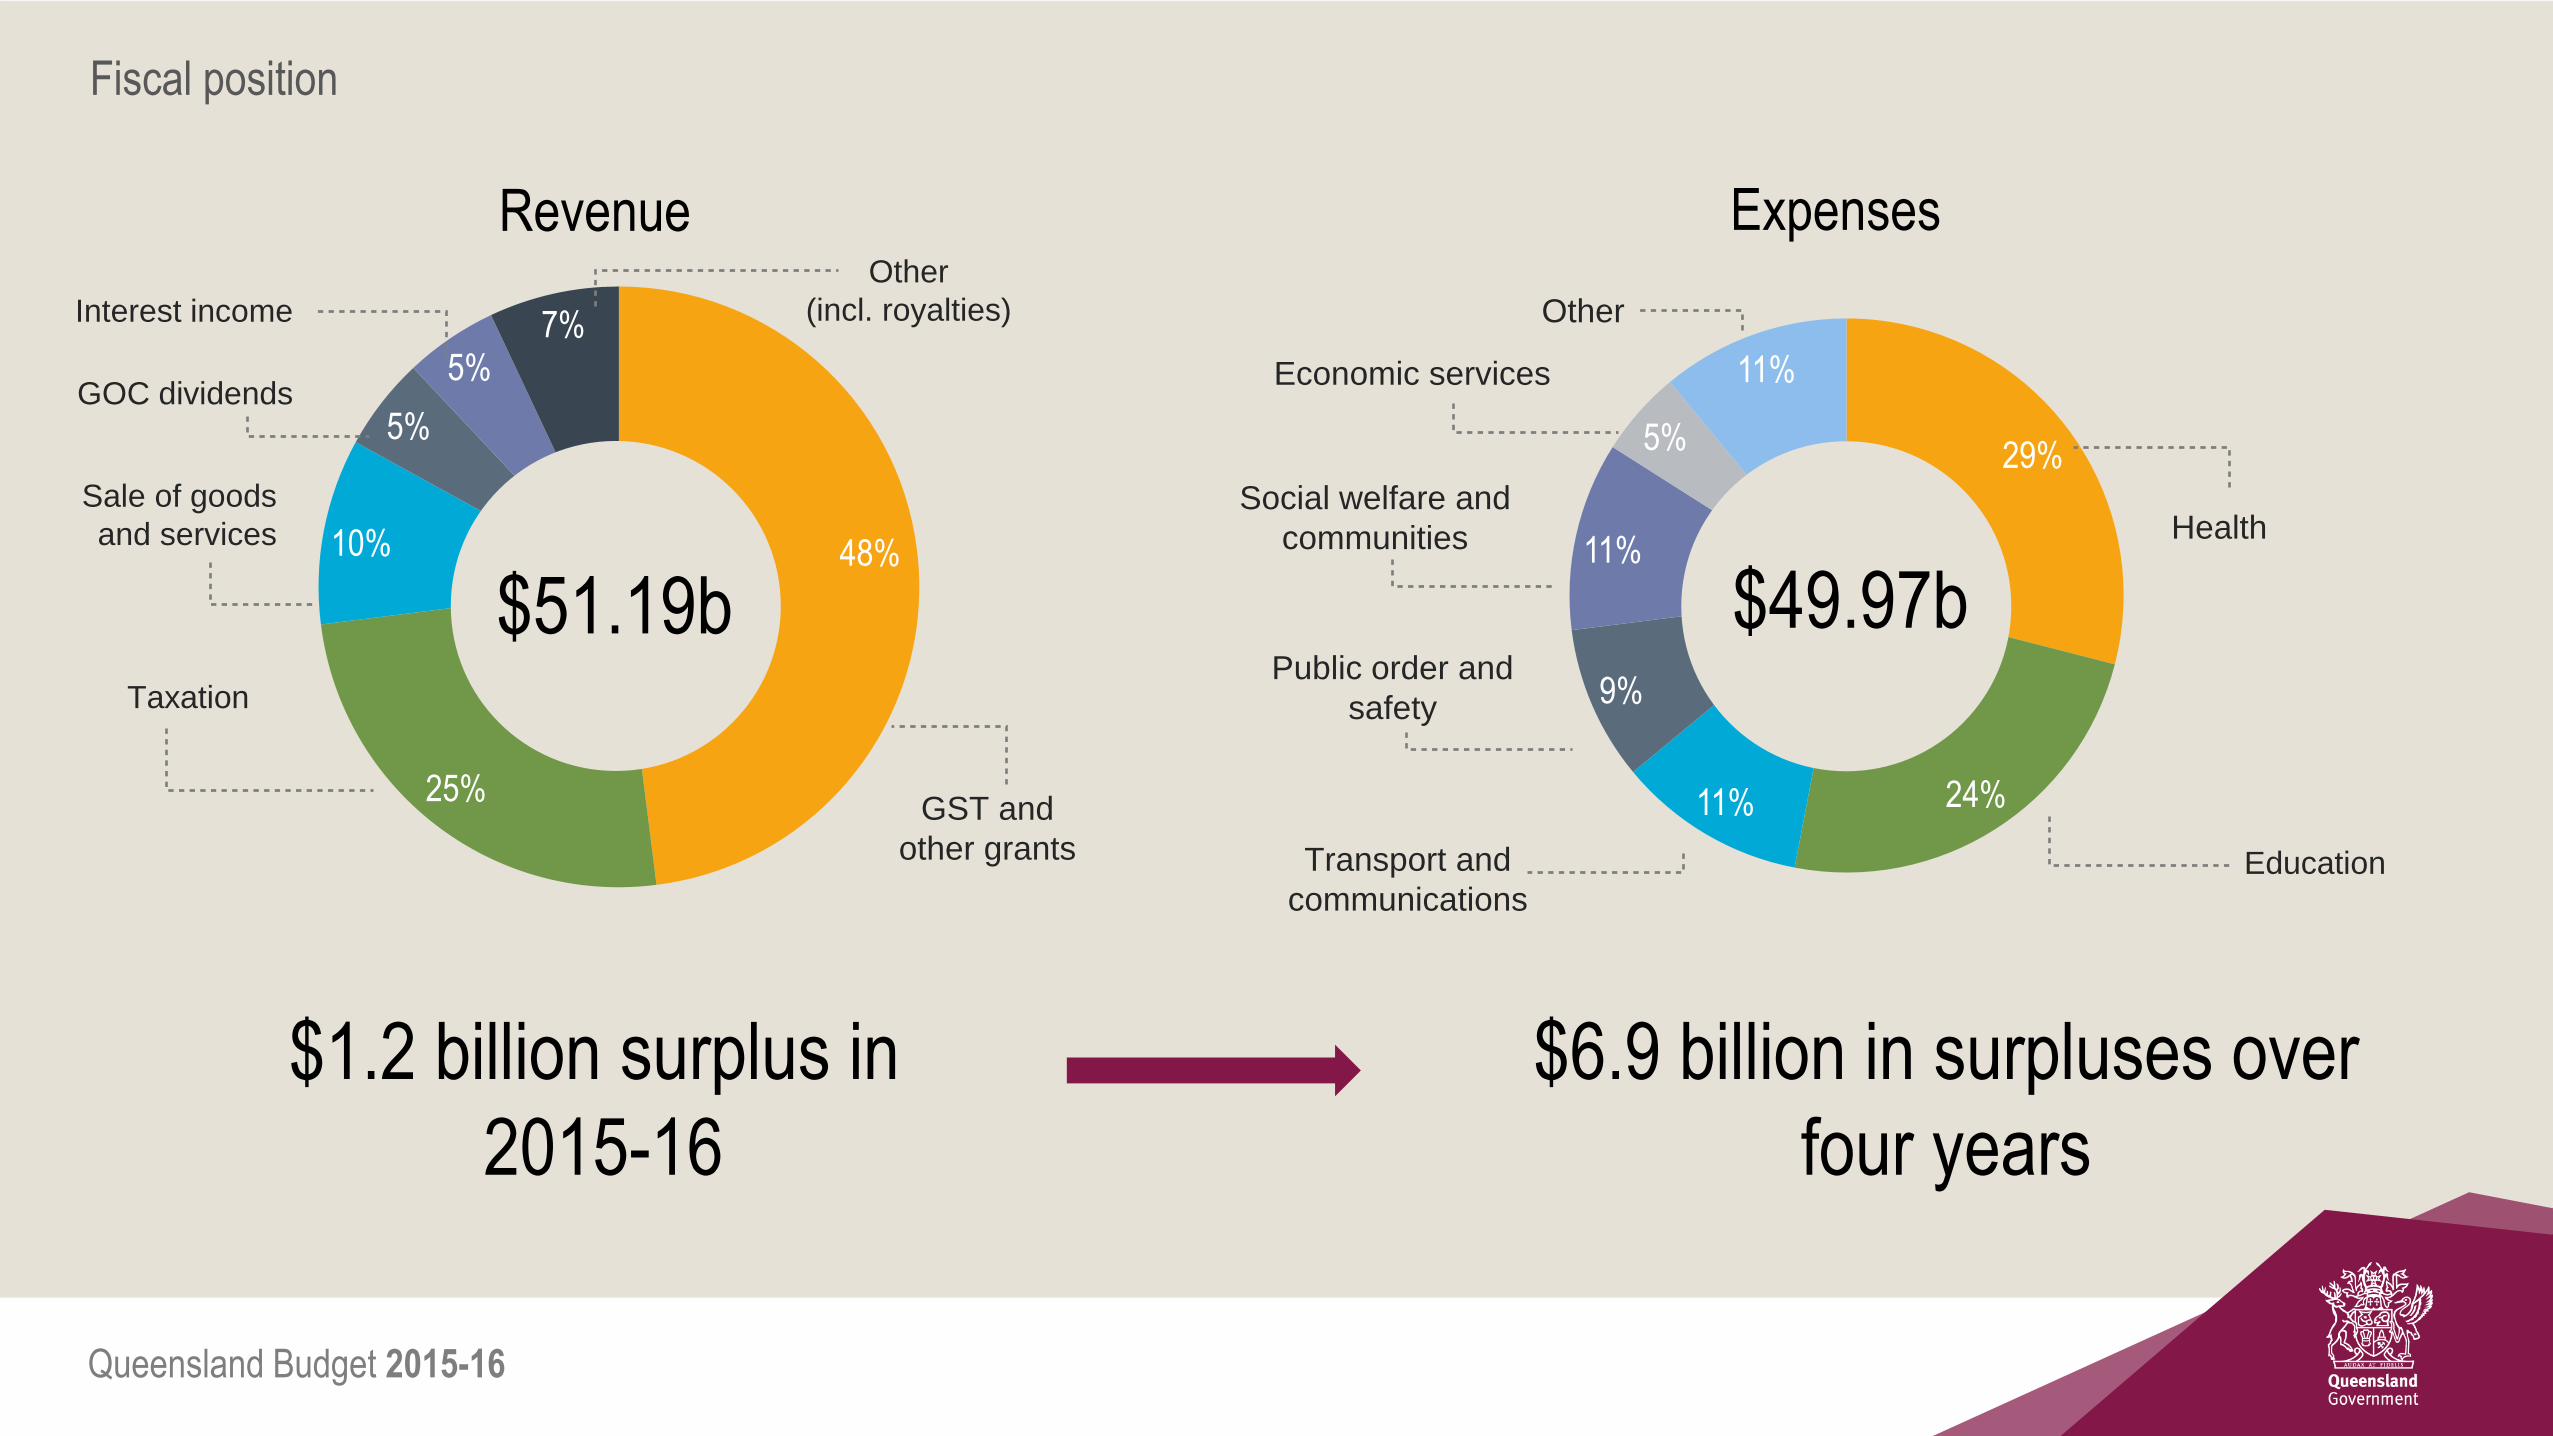
48%
25%
10%
5%
5% 7%
Revenue
29%
24% 11%
9%
11%
5%
11%
Expenses
Fiscal position
Interest income
GOC dividends
Sale of goods
and services
Taxation
GST and
other grants
Social welfare and
communities
Transport and
communications Education
Health
Economic services
Public order and
safety
Other
$51.19b $49.97b
$1.2 billion surplus in
2015-16
$6.9 billion in surpluses over
four years
Other
(incl. royalties)

Queensland Budget 2015-16
2013-14 2014-15 2015-16 2016-17 2017-18 2018-19
$ billions State Revenue and Expenses
Revenue Expenses
60
50
40
Fiscal position
Operating expenses to grow by 4.1%
across the forward estimates*
Offset by revenue growth of 4.3%
Solid surplus projections –
expenses under control
*Excluding NDRRA payments
Queensland Budget 2015-16
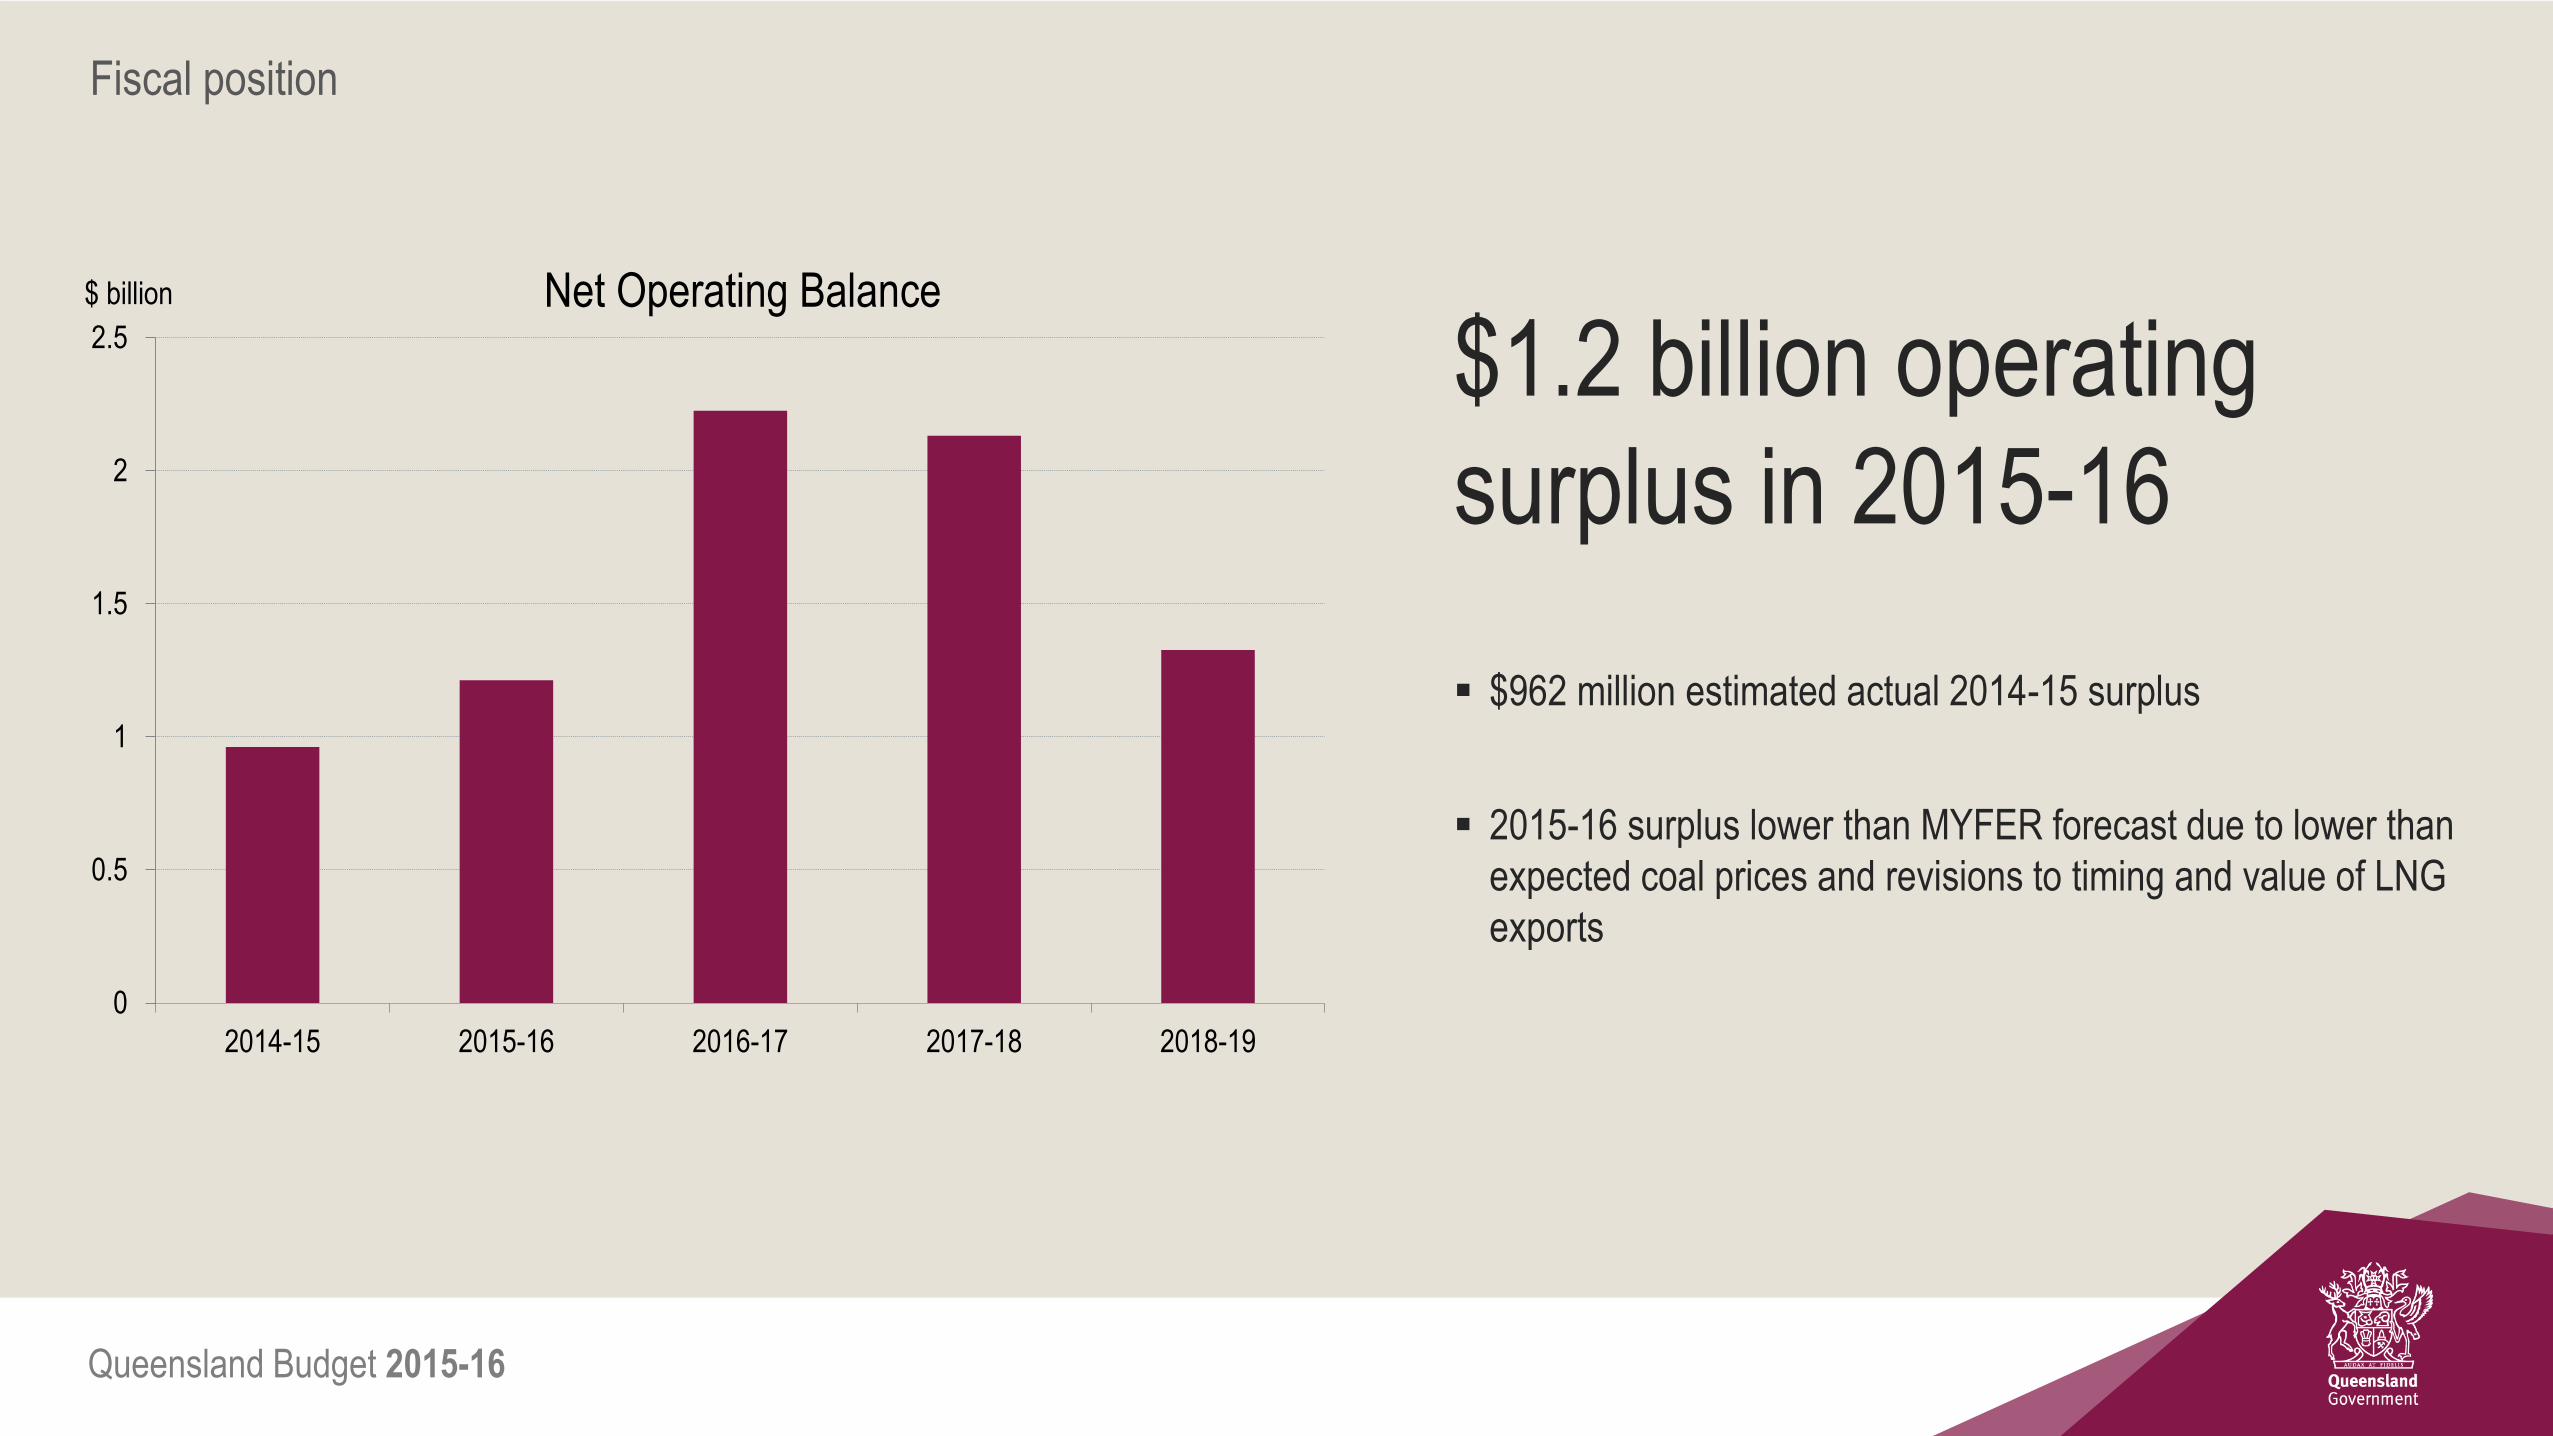
0
0.5
1
1.5
2
2.5
2014-15 2015-16 2016-17 2017-18 2018-19
$ billion Net Operating Balance
Fiscal position
$1.2 billion operating
surplus in 2015-16
$962 million estimated actual 2014-15 surplus
2015-16 surplus lower than MYFER forecast due to lower than
expected coal prices and revisions to timing and value of LNG
exports

Queensland Budget 2015-16
Fiscal position
Strong forecast
surpluses
Aggregate surpluses of $6.9 billion across
the forward estimates
Next best performing state is Victoria with
$5.8 billion aggregate
$6.90
$3.18
$5.81
-$0.77
$2.39
-1
0
1
2
3
4
5
6
7
Qld NSW Vic. WA SA
$ billion
Net operating balance – aggregated 2015-16 to 2018-19
* excludes the impacts of the Transport Asset Holding Entity
*

Queensland Budget 2015-16
Fiscal position
36
38
40
42
44
46
48
50
2014-15 2015-16 2016-17 2017-18
$ billion General Government borrowings
2014-15 Budget 2014-15 MYFER 2015-16 Budget
General Government debt
General Government debt estimated to be $7.9 billion less in
2015-16 than the 2014-15 MYFER estimate.
By 2017-18, General Government debt expected to be
$7.5 billion less than at 2014-15 MYFER and $8.9 billion less
than the 2014-15 Budget estimate.

Queensland Budget 2015-16
Fiscal position
70
72
74
76
78
80
82
84
2014-15 2015-16 2016-17 2017-18
$ billion Non-Financial Public Sector gross borrowings
2014-15 Budget 2014-15 MYFER 2015-16 Budget
By 2017-18, gross borrowings are expected to be $2.7 billion
less than at MYFER and $5 billion less than the 2014-15
Budget estimate.
Non-Financial Public
Sector debt

Queensland Budget 2015-16
Debt Action Plan
Fiscal Principles Budget Strategy

Queensland Budget 2015-16
Debt Action Plan
$4.1 billion from energy network companies by restructuring balance
sheets to operate more efficiently
Government-owned corporation regearing
Action 1

Queensland Budget 2015-16
Debt Action Plan
Review of State Finances identified returning to the same way of
funding long service leave liabilities as our peers. No change for
employee entitlements.
$3.4 billion debt reduction by funding
long-service leave as required, rather
than via central pool Action 2
Queensland Budget 2015-16
Debt Action Plan
Scheme is already fully funded and will remain so. Currently
has an estimated $10 billion surplus. No change to entitlements
$2 billion over five years via time-limited
suspension of employer contributions to
defined benefit scheme Action 3
Queensland Budget 2015-16
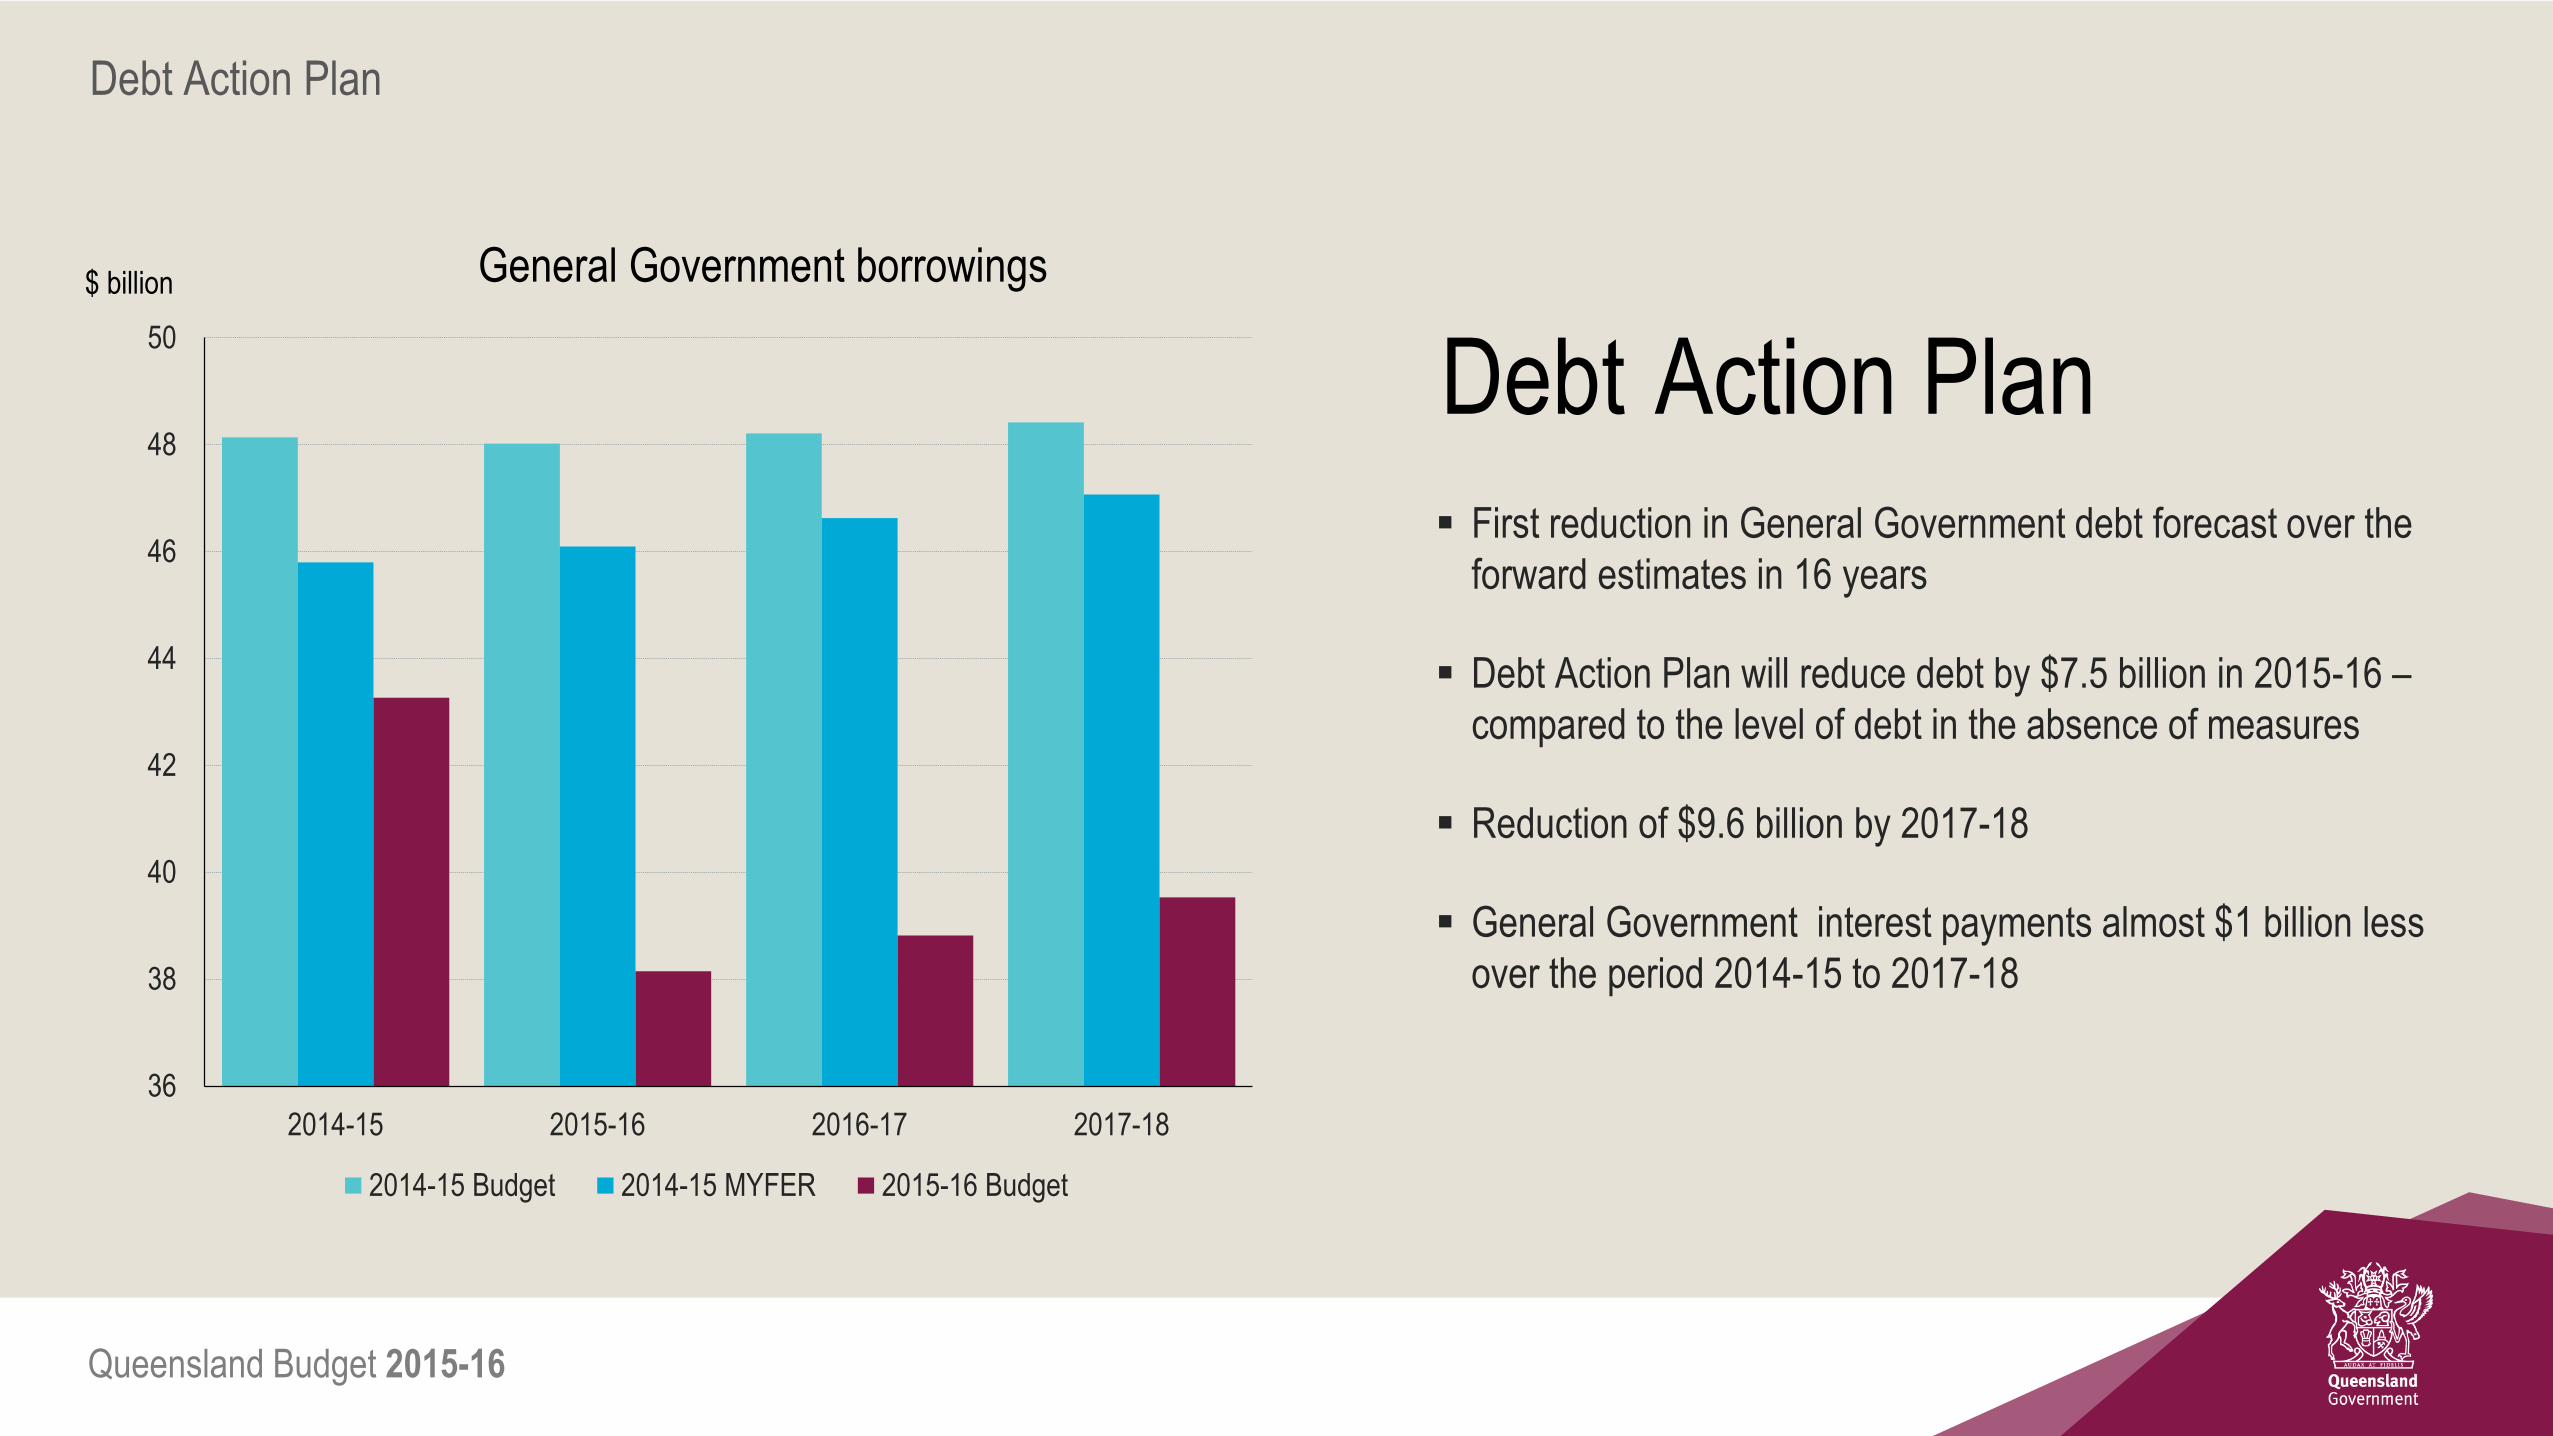
Debt Action Plan
36
38
40
42
44
46
48
50
2014-15 2015-16 2016-17 2017-18
$ billion General Government borrowings
2014-15 Budget 2014-15 MYFER 2015-16 Budget
First reduction in General Government debt forecast over the
forward estimates in 16 years
Debt Action Plan will reduce debt by $7.5 billion in 2015-16 –
compared to the level of debt in the absence of measures
Reduction of $9.6 billion by 2017-18
General Government interest payments almost $1 billion less
over the period 2014-15 to 2017-18
Debt Action Plan

Queensland Budget 2015-16
Fiscal Principles
Ongoing reductions in relative debt burden, as measured by
General Government debt-to-revenue ratio
Debt to revenue ratio is estimated to have peaked at 91% in
2012-13, and is significantly lower than forecast at MYFER
Enhanced fiscal principles 93%
87% 86%
84% 87%
75%
72% 71% 73%
60
65
70
75
80
85
90
95
100
2014-15 2015-16 2016-17 2017-18 2018-19
Percent Debt-to-revenue ratio
MYFER 2014-15 2015-16 Budget

Queensland Budget 2015-16
Fiscal Principles
Net operating surpluses that ensure new capital investment
in the General Government sector is funded primarily
through recurrent revenue rather than borrowing
An average 88 per cent of capital purchases will be funded
from cashflow across the forward estimates
Enhanced fiscal principles
-40
-20
0
20
40
60
80
100
120
2012-13 2013-14 2014-15 2015-16 2016-17 2017-18 2018-19
Percent
General Government net operating cashflow as a proportion of capital expenditure
Average 88%
Queensland Budget 2015-16
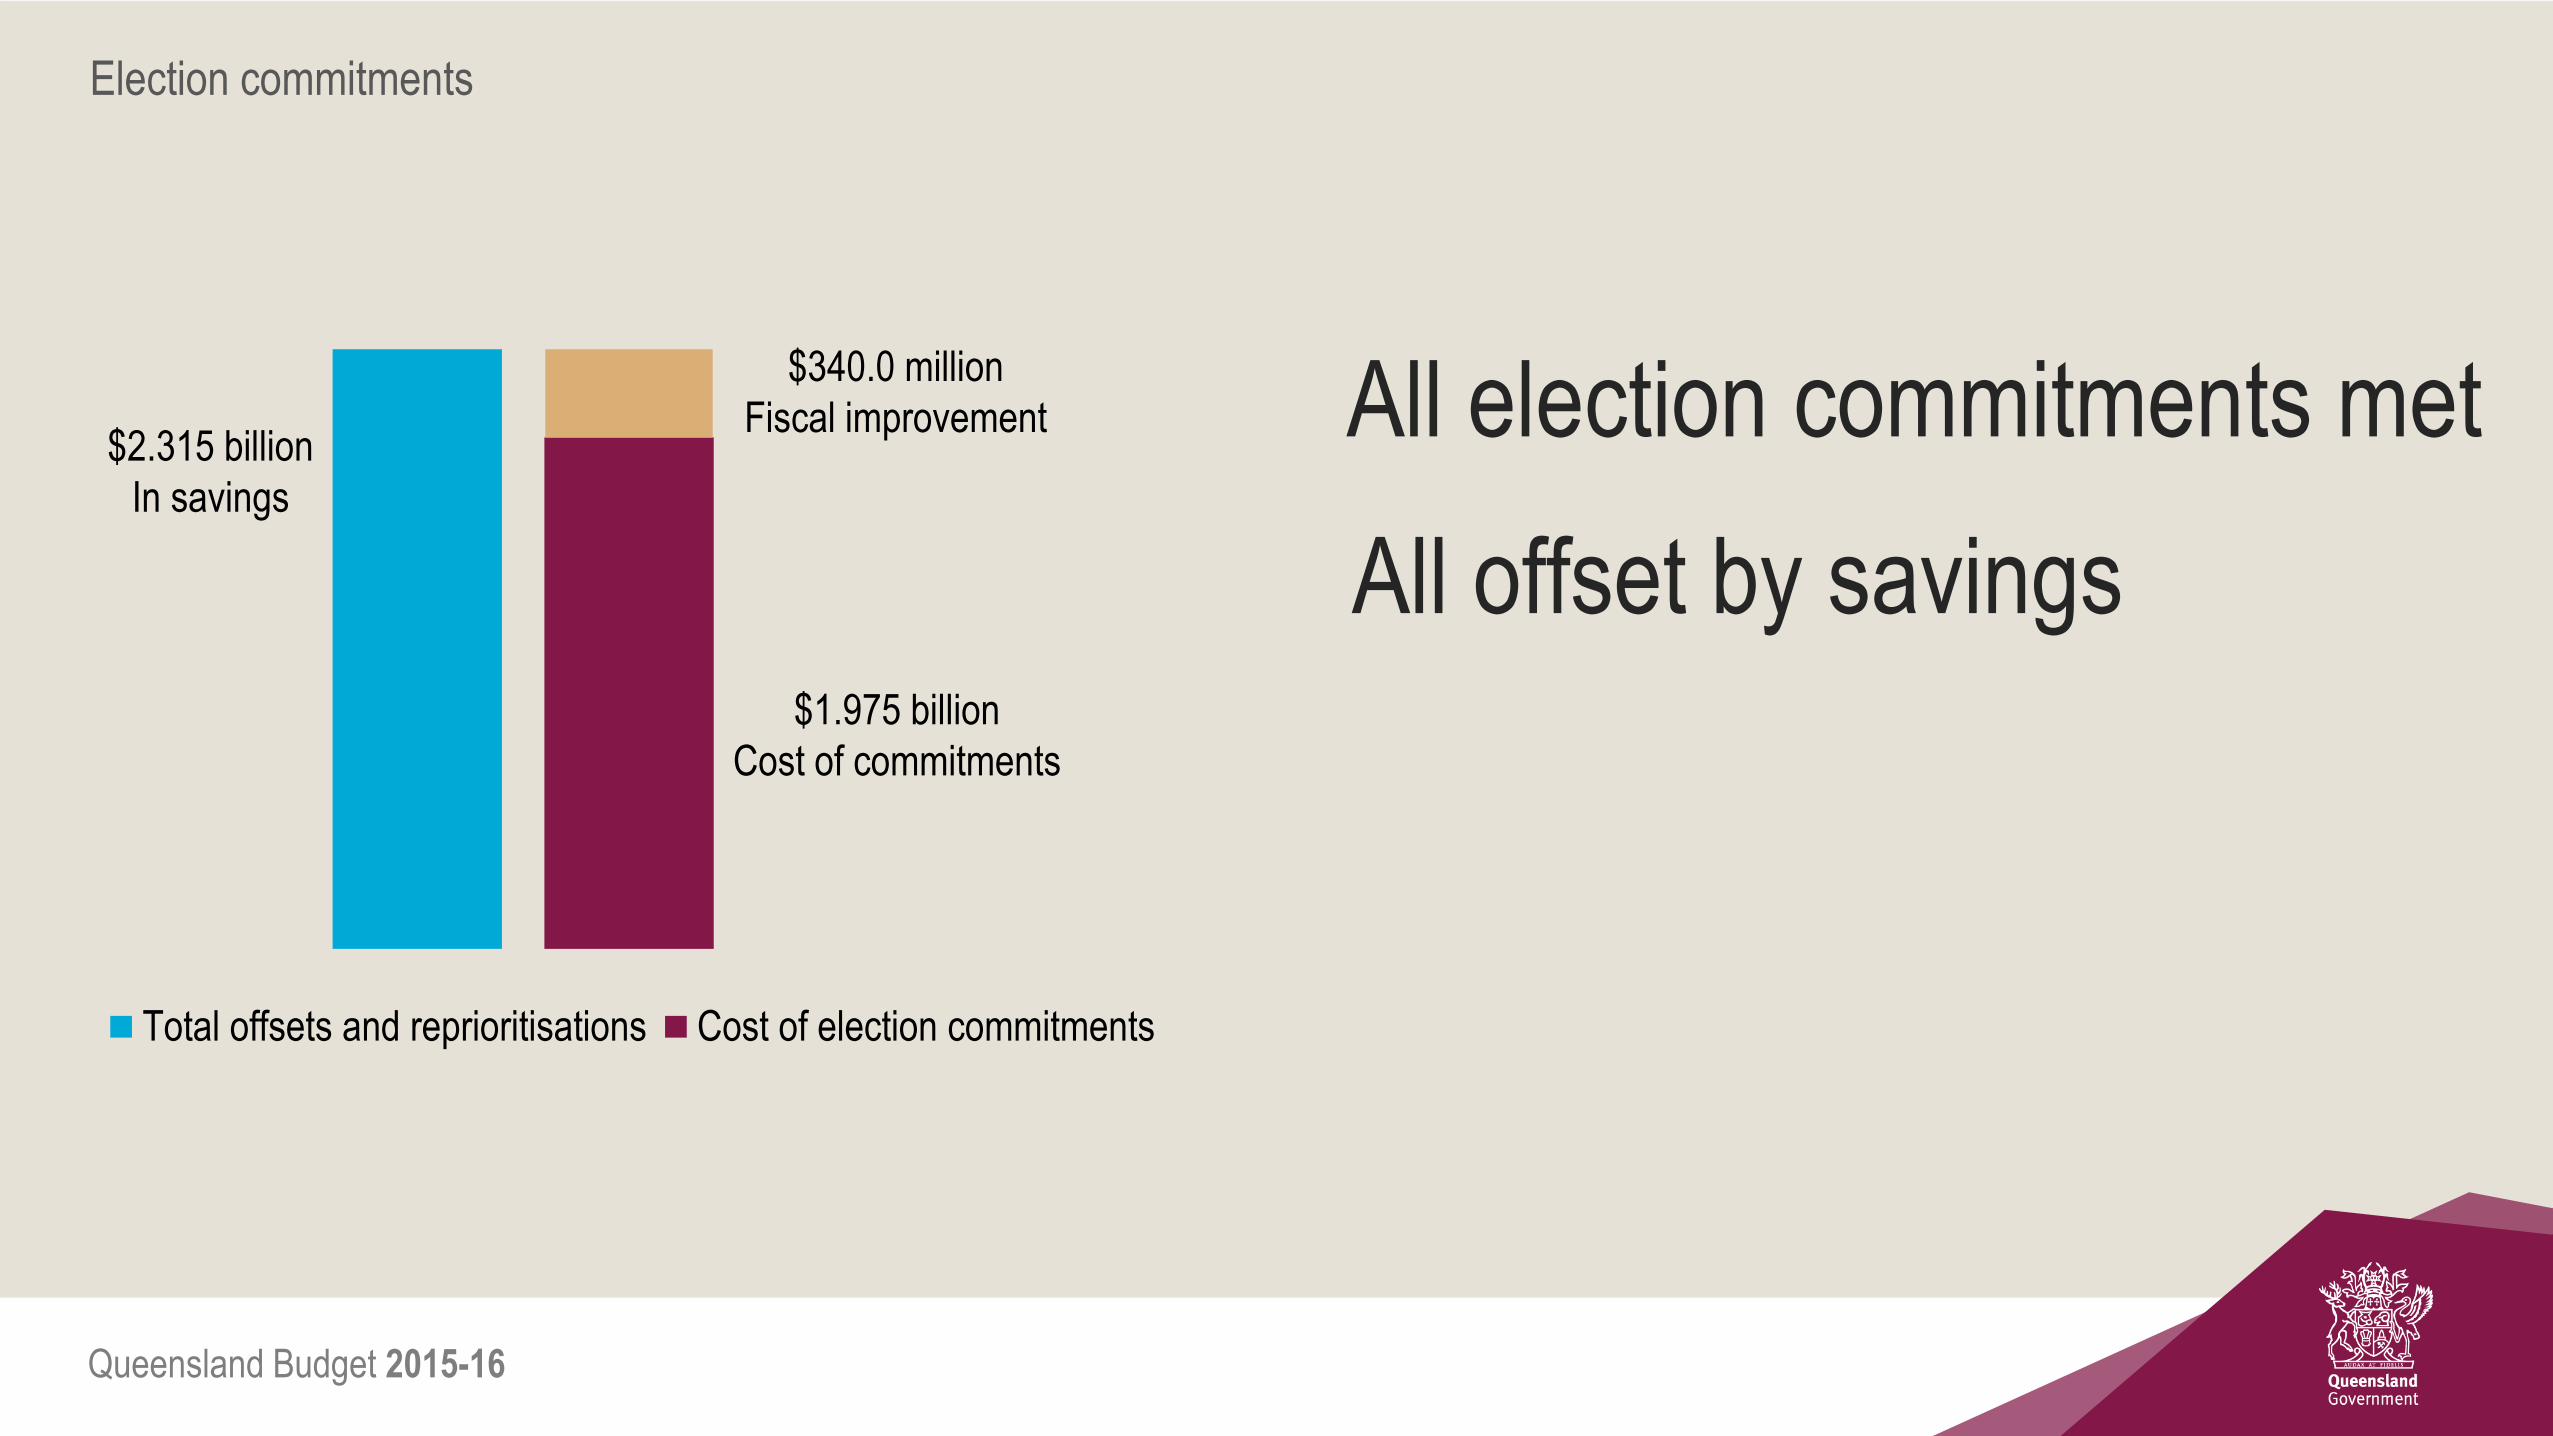
Total offsets and reprioritisations Cost of election commitments
Election commitments
$2.315 billion
In savings
$1.975 billion
Cost of commitments
$340.0 million
Fiscal improvement All election commitments met
All offset by savings

Queensland Budget 2015-16
Working Queensland
Increased funding
to frontline services
$10.1 billion capital program
Budget Initiatives

Queensland Budget 2015-16
A record health budget
Skilling Queenslanders for Work
Advance Queensland
Rescuing TAFE
Supporting business
Working
Queensland
$1.6 billion jobs package

Queensland Budget 2015-16
A record health budget
Up to 1000 new nursing graduates per
year and up to 400 new nurse navigators
$361 million Outpatient Long Wait Strategy
$180 million Regional Hospitals Package
155 new and replacement ambulance
vehicles, 75 new paramedics
$14.2 billion for health
Up by more than 4%

Queensland Budget 2015-16
A record education budget
$249 million for 875 extra teachers
$439 million Building Our Schools package
$6 million Letting Teachers Teach
$300 million over four years to fix our schools
$12.4 billion for education
Up 7.2%

Queensland Budget 2015-16
An infrastructure budget
$10.1 billion Capital program
27,500 jobs supported
$35.4 billion across four years
$4 billion for roads
$607 million for Education and Training
infrastructure
$2.4 billion for Energy and Water
infrastructure
Market-led proposals

Queensland Budget 2015-16
Budget Highlights
Enhanced Fiscal Principles
$1.2 billion operating surplus in 2015-16
First General Government debt reduction forecast
across the forward estimates in 16 years
Increased funding to frontline services
$10.1 billion capital program

Queensland Budget 2015-16
Thank you
John O’Connell www.treasury.qld.gov.au

Queensland Budget 2015-16
Commonwealth-State Financial Relations Robbie Meddick Inter-Governmental Relations
Economic Group, Queensland Treasury

Queensland Budget 2015-16
Key messages to take away
1. Queensland continues to have a heavy reliance on Commonwealth funding (often
with conditions) – this is increasing VFI
2. Some additional payment measures in the Commonwealth 2015-16 Budget are
welcomed
3. But no respite from the fiscal tightening and uncertainty for states from previous
Commonwealth funding cuts (2014-15 health and education)
4. CGC 2015 GST Review – good outcome for Qld; duly recognises natural disaster
recovery expenses; but expected to fall back toward EPC
5. Big opportunity for reform – federalism (roles and responsibilities) + tax reform (to
address VFI)
Queensland Budget 2015-16
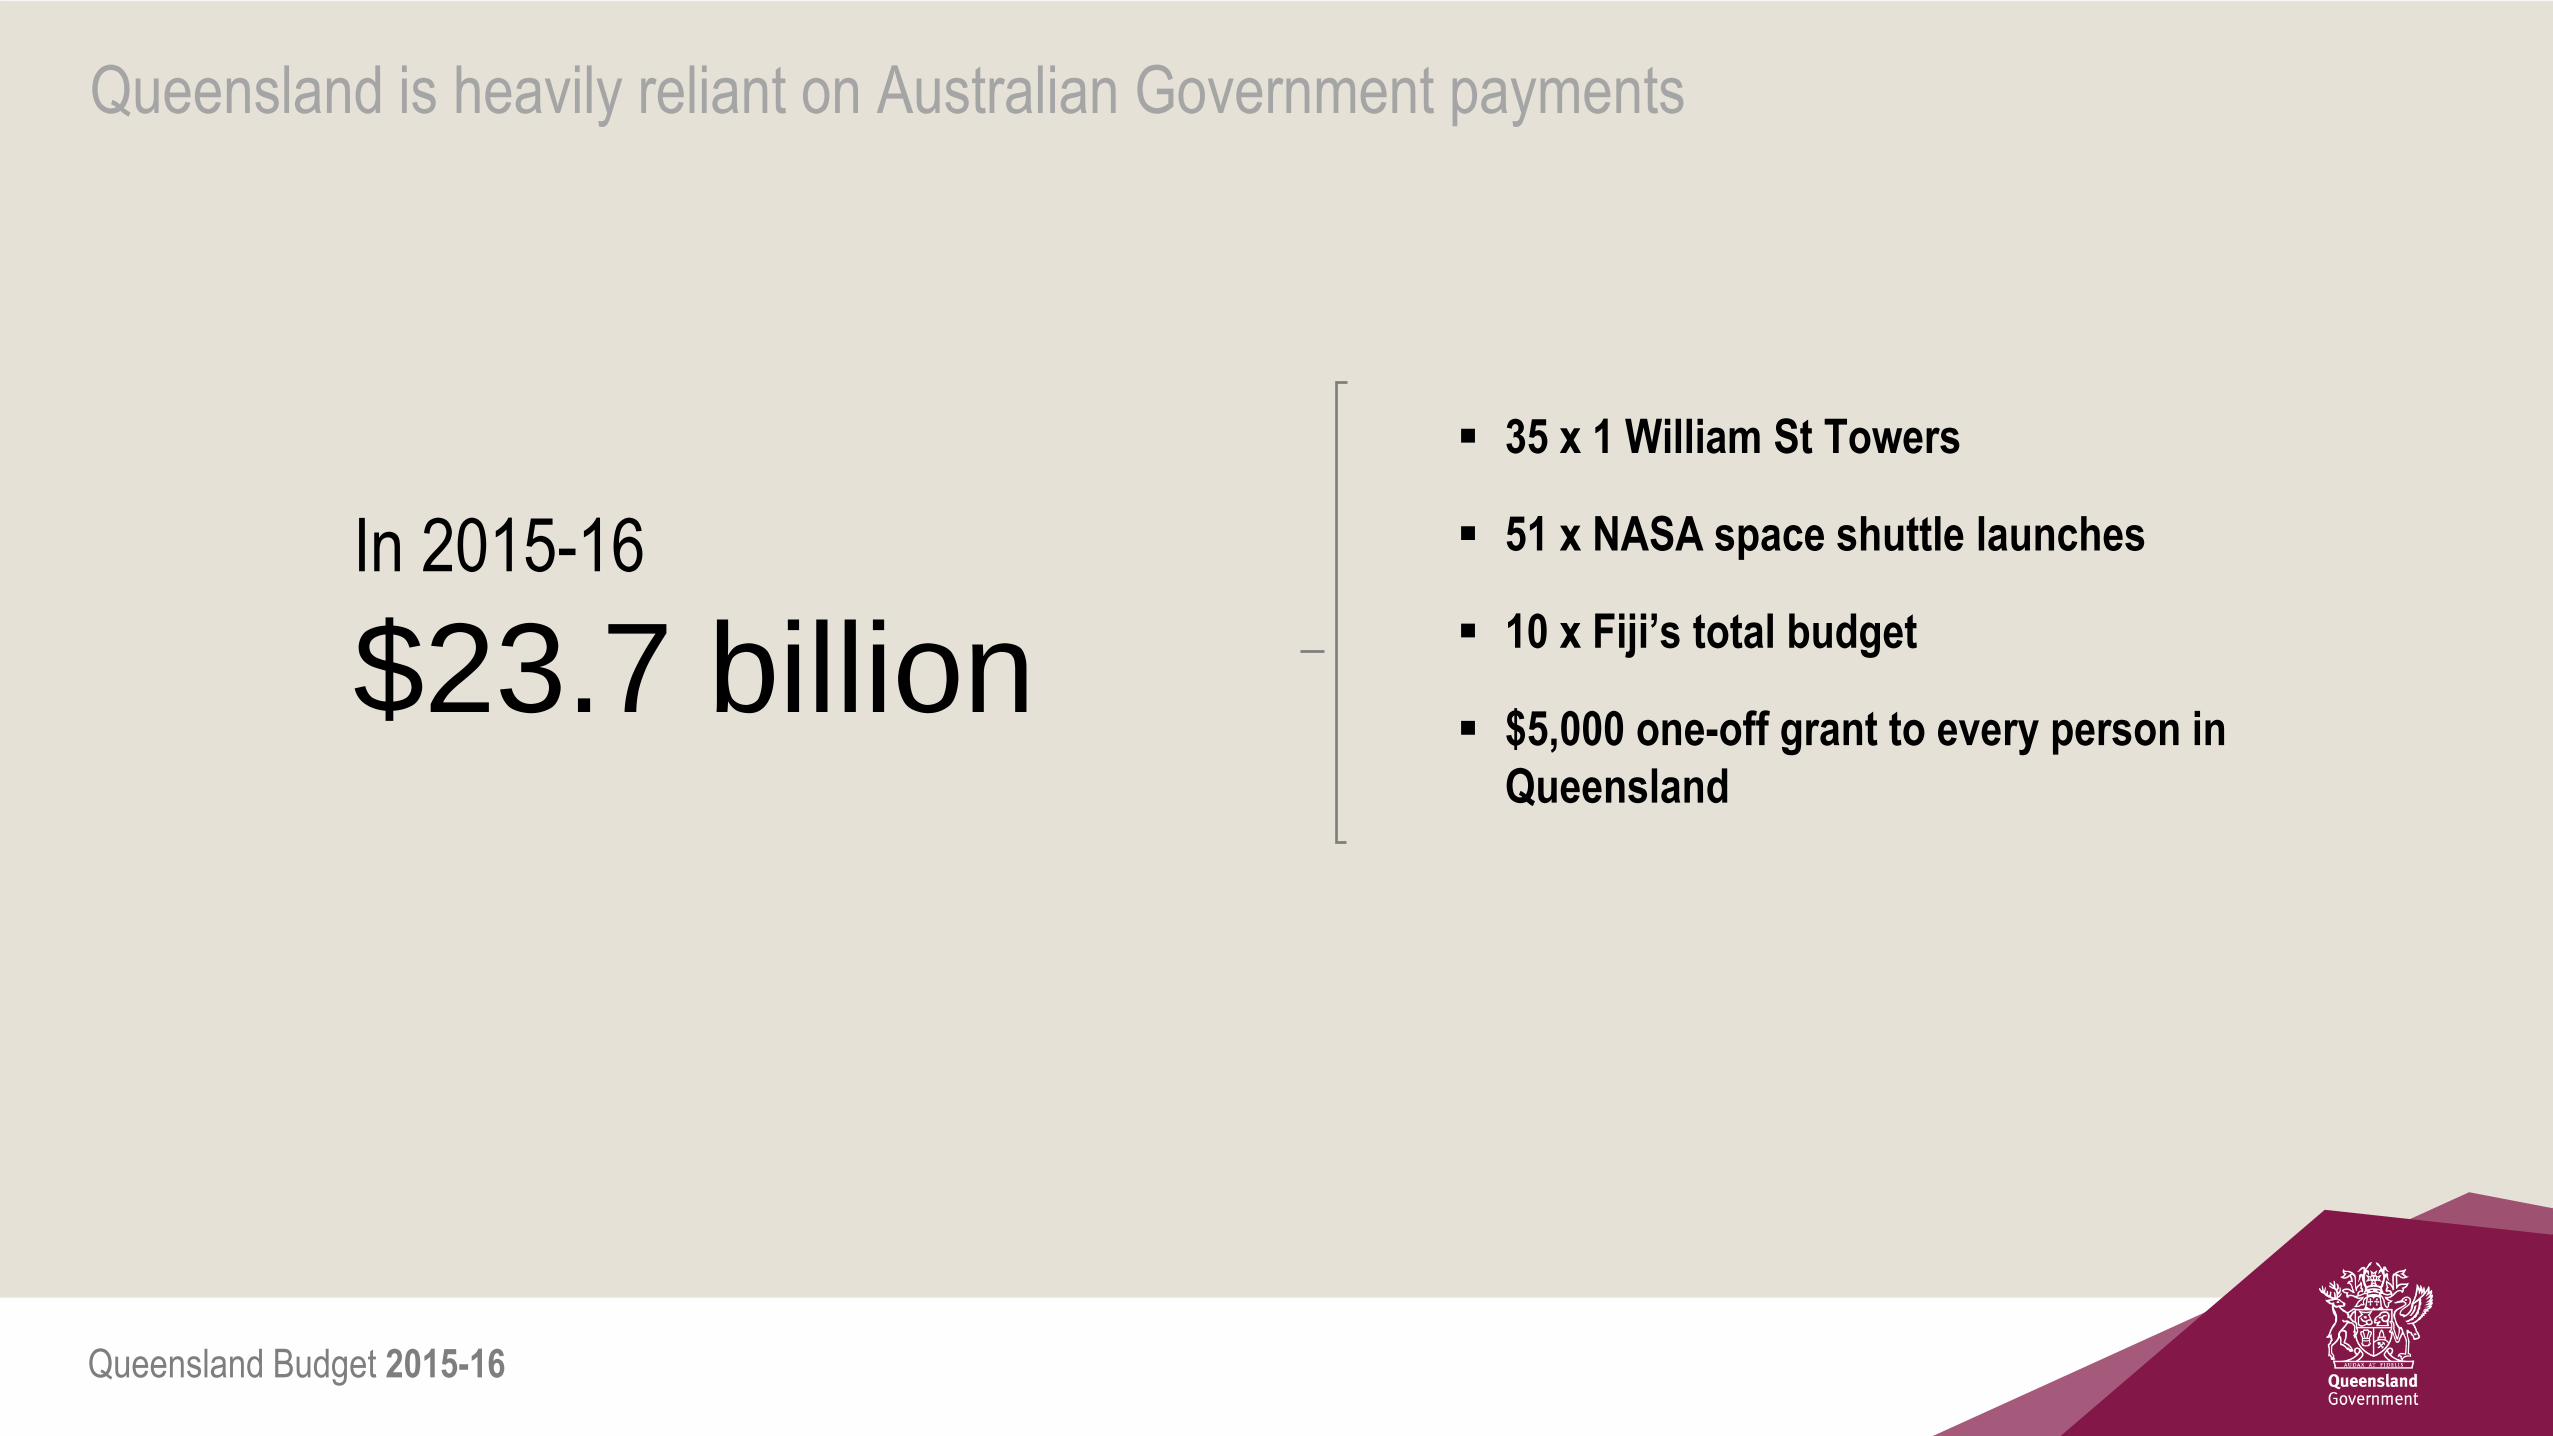
Queensland is heavily reliant on Australian Government payments
In 2015-16
$23.7 billion
35 x 1 William St Towers
51 x NASA space shuttle launches
10 x Fiji’s total budget
$5,000 one-off grant to every person in
Queensland
Queensland Budget 2015-16
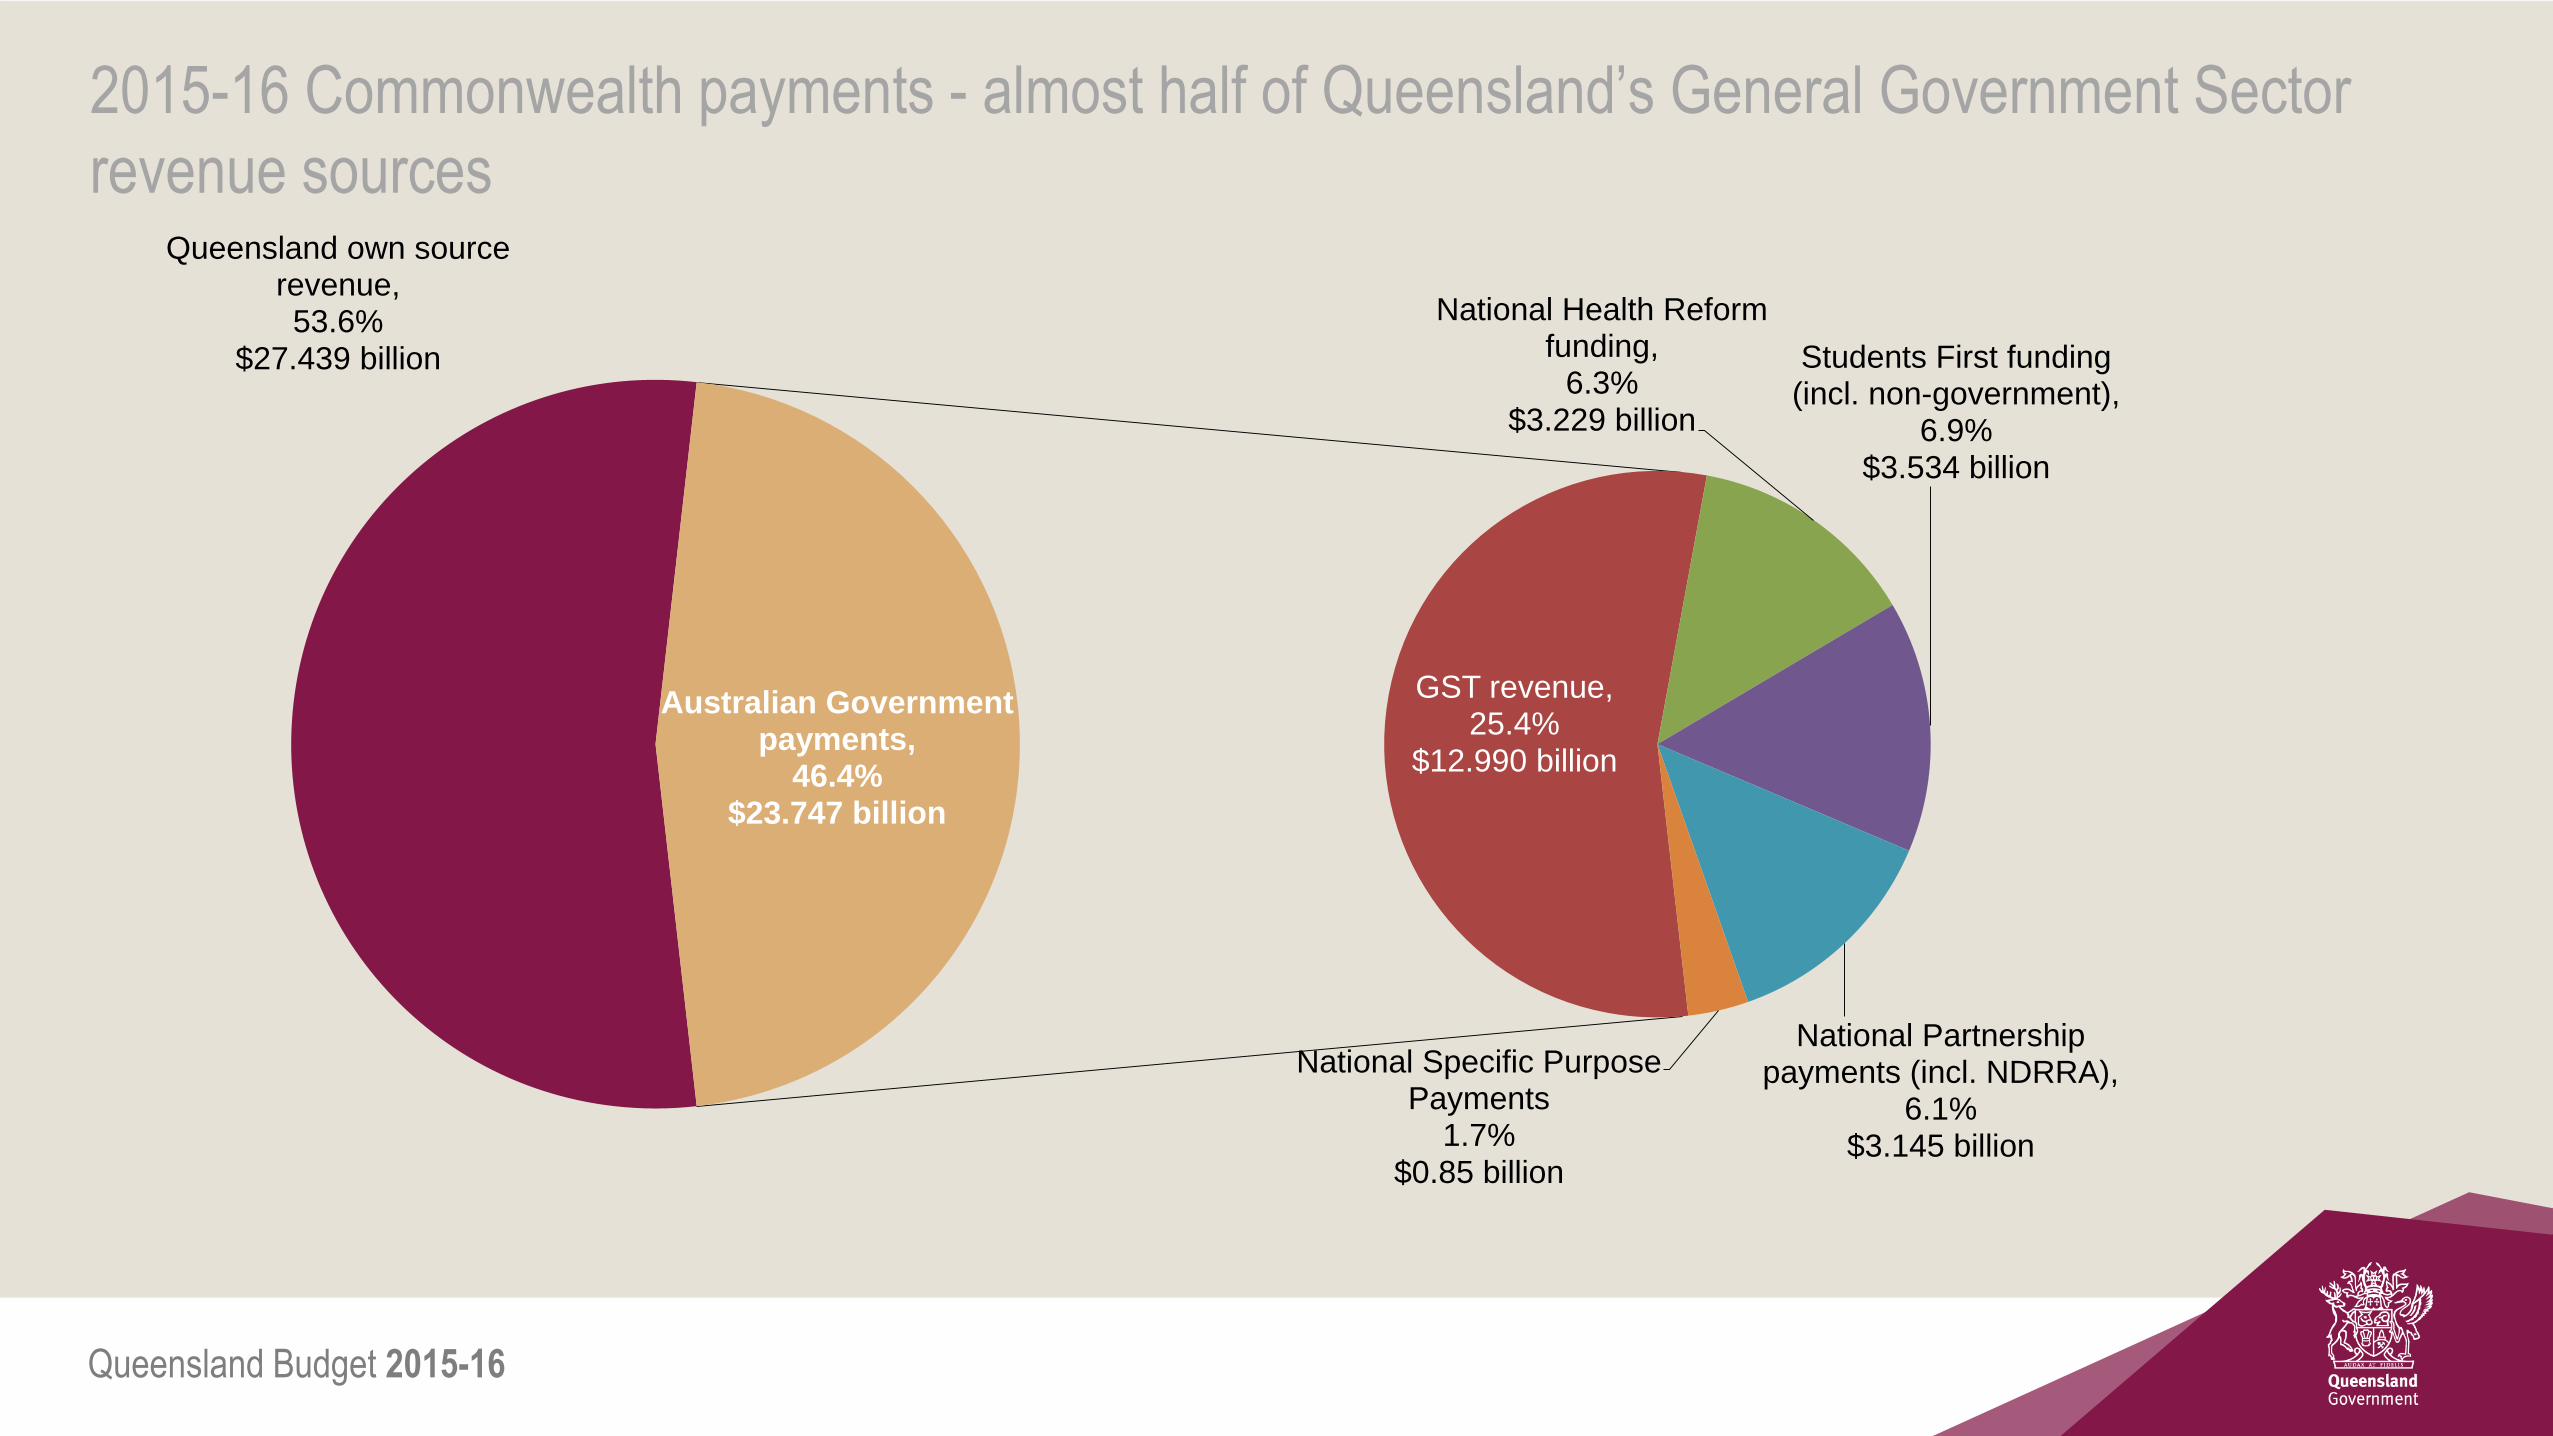
2015-16 Commonwealth payments - almost half of Queensland’s General Government Sector
revenue sources Queensland own source
revenue, 53.6%
$27.439 billion
GST revenue, 25.4%
$12.990 billion
National Health Reform funding,
6.3% $3.229 billion
Students First funding (incl. non-government),
6.9% $3.534 billion
National Partnership payments (incl. NDRRA),
6.1% $3.145 billion
National Specific Purpose Payments
1.7% $0.85 billion
Australian Government payments,
46.4% $23.747 billion

Queensland Budget 2015-16
Estimated Australian Government payments to Queensland
2013-14
Actual
$ million
2014-15
Est. Act.
$ million
2015-16
Budget
$ million
Change
Nominal
Terms
%
Change
Real
Terms
%
Change
Real Per
Capita
%
GST revenue 10,823 11,746 12,990 10.6 8.2 6.2
GST balancing item3 73 69 ..
Total payments for general purposes 10,896 11,816 12,990
Payments for specific purposes
National Partnership payments 1,889 1,917 2,039
Natural Disaster Relief & Recovery 1,515 1,163 1,106
National Specific Purpose Payments 807 831 850
National Health Reform Funding 2,815 3,057 3,229
Students First – Education Reform 2,926 3,231 3,534
Total payments for specific purposes 9,951 10,198 10,757 5.5 3.2 1.3
Total payments 20,847 22,014 23,747 7.9 5.5 3.6 Notes:
1. Numbers may not add due to rounding.
2. Does not include Australian Government funding direct to Local Governments.
3. The balancing adjustment accounts for differences between the GST paid to states and the final GST pool size and population outcomes in the prior year (2012-13 and 2013-14).
4. NDRRA is funding for the Natural Disaster Relief and Recovery Arrangements.
Sources: Commonwealth Budget 2015-16 Paper No. 3 and Queensland Treasury estimates.

Queensland Budget 2015-16
Nationally - Australian Government grants to all states, 2015-16
GST 53.0% $57.1B
NHR 15.3% $16.4B
Students First
14.6% $15.7B
NPs 12.6% $13.6B
0 20 40 60 80 100 120
$ billions
National Specific Purpose
payments, (3.9%), $4.2B
Other general revenue,
(0.65%), $0.7B
General revenue assistance
(untied grants)
Payments for specific purposes
(Tied grants)
Share of
payments
%
Share of
population
%
New South Wales 30.5 31.9
Victoria 23.0 24.9
Queensland 21.7 20.1
Western Australia 7.0 11.2
South Australia 8.5 7.1
Tasmania 3.2 2.1
Australian Capital
Territory 1.8 1.6
Northern Territory 4.3 1.0

Queensland Budget 2015-16
Vertical Fiscal Imbalance (VFI)
Australia’s federal financial relations are marked by a high degree of VFI - Commonwealth collects much more revenue than it
spends for its own purposes. In contrast, states do more public spending than their own-source revenues can cover, and depend on
Commonwealth grants for the difference.
VFI is increasing
State reliance on Commonwealth payments is increasing
Proportion of State own-source revenue is declining
Excessive VFI can:
- Weaken or blur government accountability
- Produce inadequate or inappropriate funding of services
- High grant administration costs
- Leave states with little policy control over a large
proportion of their revenues.
- Commonwealth can extend its policy influence into state
functional areas
39.8 32.4
25.2
22.3
35.0 45.3
0
10
20
30
40
50
60
70
80
90
100
1999-2000 2015-16
%
AustralianGovernment funding
Other staterevenue
State taxrevenue

Queensland Budget 2015-16
Commonwealth Grants Commission (CGC) – 2015 GST Methodology Review (April 2015)
Affects Queensland’s GST share between 2015-16 - 2019-20.
Distributes $57B GST pool to achieve horizontal fiscal equalisation (HFE) - so each state has the capacity to provide
services and infrastructure at national average levels.
Queensland’s improved position due to changes in state circumstances beyond our control (mainly natural disaster
relief expenses and mining revenues)
2015 GST Review
Qld relativity = 1.12753
(up from 1.07876)
Qld GST share up to 22.8%
(up from 21.8%)

Queensland Budget 2015-16
Impact of a HFE-based distribution process on Queensland’s GST share
7
8
9
10
11
12
13
2005-06 2006-07 2007-08 2008-09 2009-10 2010-11 2011-12 2012-13 2013-14 2014-15 2015-16
GST share received by Queensland under current HFE arrangements
Queensland's GST share with no HFE redistribution
-$785M
+$1.5B
GS
T $
bill
ion

Queensland Budget 2015-16
GST relativities over time

Queensland Budget 2015-16
CGC – volatility of Queensland’s GST relativity (stamp duty; mining revenues; NDRRA)
0.80
0.85
0.90
0.95
1.00
1.05
1.10
1.15
1.20
1.25
1.30
1998-99 2000-01 2002-03 2004-05 2006-07 2008-09 2010-11 2012-13 2014-15 2016-17 2018-19
Three year average relativity Single year relatvity
Relativity
Single year relativity peak
(2013-14) 1.27053
Lowest single year relativity (2008-09)
0.84647
Long term average 1.02376

Queensland Budget 2015-16
2015-16 Commonwealth Budget
Payments for specific purposes to Queensland - $10.757 billion
Only short-term increases/extensions to major funding agreements - Early childhood ($175.8M out to 2017-18) - Homelessness ($57.4M out to 2016-17) - Legal assistance ($202M out to 2018-19) - Adult public dental ($30M) But no ongoing funding certainty for NPs (e.g. mental health) No respite from the Cwth funding decisions in 2014-15 relating to health and education indexation ($11.8B and $6B less funding out to 2024-25). Infrastructure - $5B loan scheme for N.Australia; $800M allocated to Developing Northern Australia White Paper; no funding for Qld priority projects (second river rail crossing, GG light rail extension; Sunshine Coast rail duplication)

Queensland Budget 2015-16
Consecutive Commonwealth Budgets – emerging implications for States
Commonwealth funding to the states is undergoing structural change
increases in funding are only short term
cuts to hospital and school funding are on-going and compounding
durability of agreements with the Commonwealth is weakening
expiring agreements have little State input, and no rollover into SPPs
ceasing of agreements before expiry
reversal of major reform agreements (health, education).

Queensland Budget 2015-16
Opportunity for reform
White Papers - Federalism and Tax Reform
Reform of the Federation (lead by first Ministers with Treasury advice) clarify roles and responsibilities to ensure States are sovereign in their own sphere (reform areas - Health; Education; Housing & Homelessness) reduce waste and duplication between State and Federal levels of government. addressing VFI and ensuring States have access to a sustainable, stable revenue base – essential link to Tax White Paper Leaders Retreat 22 July – work on more developed options for Green Paper (Qld focus – School education; Revenue; Housing)
White Paper recommendations to be taken to 2016 Federal Election
Queensland Budget 2015-16
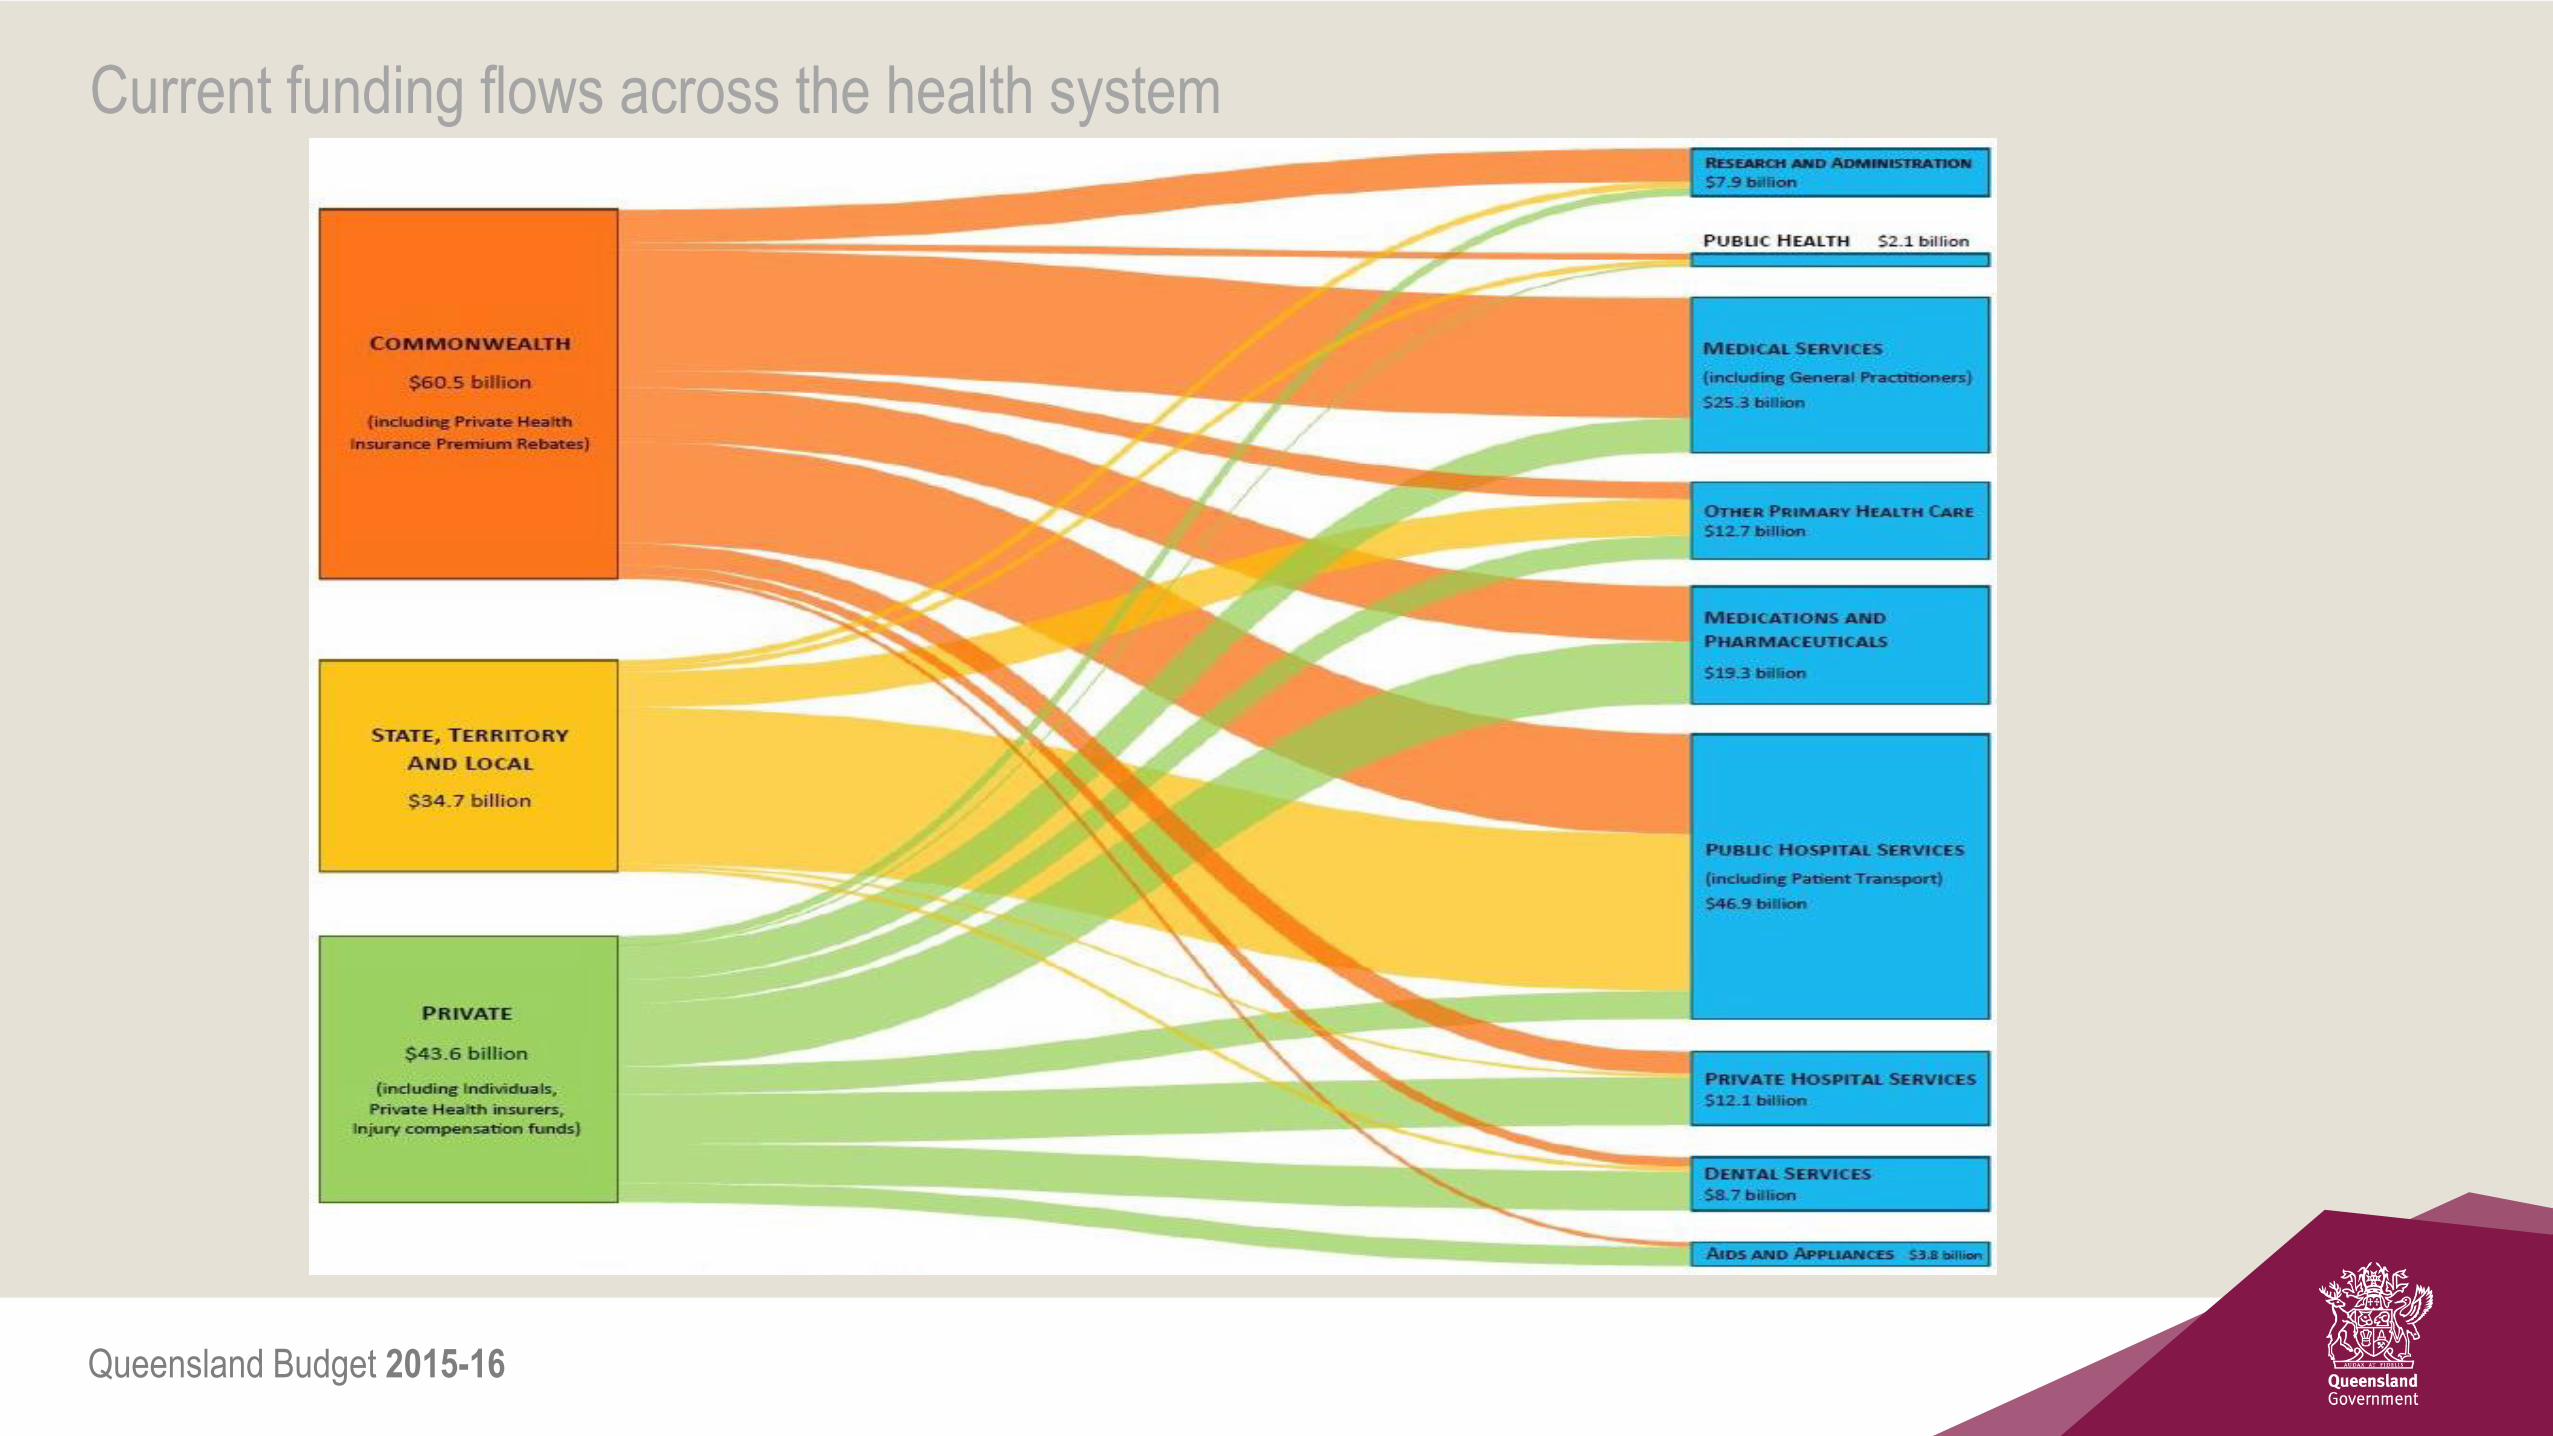
Current funding flows across the health system

Queensland Budget 2015-16
Opportunity for reform
White Paper on Tax Reform
Why?
Long term fiscal issues/imbalance; current tax system has high economic costs; room to improve efficiency
What?
Simpler, fairer tax system (with lower taxes?) – supports economic growth / living standards / international competitiveness /
adjusts to a changing economy
Cwth’s ‘Re:Think’ paper - begins the formal conversation: notes high reliance on income taxes, and taxes that impose high
economic costs (e.g. duties). Also notes broad based consumption taxes (e.g. GST) are relatively efficient.
Treasurers’ August Tax Summit – detailed reform options for Green Paper (…all reasonable and sensible options on the table
for discussion)
Priorities for Queensland
Queensland supports a simpler, fairer tax system – but not at the expense of State revenue.
Access to sustainable revenue streams to match service delivery responsibilities - a key goal
Ideally, better alignment of taxing powers with spending responsibilities
Any reduction in inefficient state taxes would need an offsetting revenue source
Increasing the control States have over the level of revenue they raise and how they allocate that funding.

Queensland Budget 2015-16
Questions


