Page 1
http://www.iaeme.com/IJARET/index.asp 259 [email protected]
International Journal of Advanced Research in Engineering and Technology (IJARET) Volume 9, Issue 4, July - August 2018, pp. 259–271, Article ID: IJARET_09_04_027
Available online at http://www.iaeme.com/IJARET/issues.asp?JType=IJARET&VType=9&IType=4
ISSN Print: 0976-6480 and ISSN Online: 0976-6499
© IAEME Publication
COMPARATIVE STUDY ON HIGH-RISE
BUILDING DUE TO EFFECT OF LATERAL
FORCES USING ETABS
Amanullah Qureshi
Department of Civil Engineering,
Final Year Student, Ghousia college of Engineering, Ramanagaram,
VTU, Belgaum, Karnataka, India
Ummer Farooq Pasha
Department of Civil Engineering,
Assistant Professor, Ghousia college of Engineering, Ramanagaram,
VTU, Belgaum, Karnataka, India
N S Kumar
Department of Civil Engineering,
Professor and Director (R&D-Civil Engineering),
Ghousia college of Engineering, Ramanagaram
VTU, Belgaum, Karnataka, India
ABSTRACT
Conventional slab and Post Tensioned slab structures of G+15 floors for an
assumed architectural plan has been analyzed and compared by applying lateral
forces i.e., seismic zone II and V and wind zone I and V respectively. The analysis has
done using ETABS software for both the structures and compared the responses by
obtaining results of base shear, maximum storey displacement, storey drift and storey
shear. The limiting values for drift and displacement has been validated with Indian
code provision for earthquake consideration and British code for wind consideration.
The static and response spectrum analysis has done for seismic analysis to compare
both method’s results.
Key words: AutoCAD, ETABS, High-Rise building, Post Tensioned slab, Prestressed
Concrete, Seismic zones, Wind zones.
Cite this Article: Amanullah Qureshi, Ummer Farooq Pasha and N S Kumar,
Comparative Study on High-Rise Building Due to Effect of Lateral Forces Using
ETABS. International Journal of Advanced Research in Engineering and Technology,
9(4), 2018, pp 259–271.
http://www.iaeme.com/IJARET/issues.asp?JType=IJARET&VType=9&IType=4
Page 2
Comparative Study on High-Rise Building Due to Effect of Lateral Forces Using ETABS
http://www.iaeme.com/IJARET/index.asp 260 [email protected]
1. INTRODUCTION
High-Rise buildings as defined by Council on Tall Buildings and Urban Habitat Buildings
height more than 50m is titled as Tall Building. Buildings height more than 100m is called as
skyscraper. Buildings height of 300m or higher is called as Super tall. Buildings height of
600m or higher is named as Mega-tall. Evaluation of Height of tall buildings, Height to
Architectural Top Height to tip Highest Occupied floor. Many high-rise buildings are
constructed worldwide, remarkably in Asian countries, such as China, Korea, Japan, and
Malaysia. Based on data published in the 1980s, about 49% of the world‟s high-rise buildings
were located in North America. The distribution of high rise buildings has changed
thoroughly with Asia now having the largest contribution with 32%, and North America is at
24%. Pre-stressing is generally a way to overcome concrete weakness in tension. Generally,
the concrete undergoes compression on top flange and tension at bottom flange. In pre-
stressing the tendons are stretched along the axis and cement is poured, later when the tendons
are released the compression is generated at the bottom which tries to counter-balance the
compression due to loading at the top part of the member. The upward force along the length
of the concrete member counteracts the service loads applied to the member. There are two
methods of prestressing are widely used they are: Pre-tensioning and Post-tensioning.
1.1. Objectives: The various objectives of my project work are discussed below
To study the behaviour of tall structures with conventional slab and post tensioned slab
due to effect of lateral forces.
To model and analyses a structure with conventional slab and post tensioned slab using
ETABS software.
To model and analyses the buildings with conventional and post tensioned slab by
considering two different seismic zones of India i.e., Zone II, and V as per IS 1893(Part
1):2002
To model and analyses the structures in two wind zones of India i.e., Zone I, and V as per
IS 875(Part-3)-1987.
To compare the results and to check the safety of the structure against allowable limits
prescribed for base shear, maximum displacements, storey drifts and shear in codes of
practice and other references in literature on effects of earthquake and wind loads on
buildings.
However, in this study the business building like shopping mall is considered with g+15
floors having plinth area of 980.085 m2 and storey height of 5m at ground floor and 3m from
1st floor to 15
th floor has been considered. the shopping mall consist of various division and it
is shown in AutoCAD plan under section 2.1.7 and Fig.2.3. the seismic zones considered in
this study along with their respective locations are shown in Table-1.1 and for the wind
analysis the different wind zones and their wind speed in m/s considered according to their
specific are in Table-1.2
Table 1.1
Location State Seismic Zones Seismic Activity
Bangalore Karnataka II Low
Srinagar Jammu and Kashmir V Very Severe
Page 3
Amanullah Qureshi, Ummer Farooq Pasha and N S Kumar
http://www.iaeme.com/IJARET/index.asp 261 [email protected]
Table 1.2
2. METHODOLOGY
Figure 2.1 Methodology
2.1. Design Considerations: Limit state method (LSM) is considered for design
purpose
2.1.1. Loads
Dead loads (DL), Live loads (LL), Wind loads (WL), Seismic loads
2.1.2. Wind pressure on walls (Calculations as per IS 875-1987 part-3)
The basic wind speed (Vb) for any site shall be obtained IS 875-1987(3) and shall be
modified to get the design wind velocity at any height (Vz) for a chosen structure. Vz = Vb
k1k2 k3 Where, k1 = probability factor (risk coefficient) shall be obtained from code book of
clause 5.3.1, which indicates that the value of k1 varies with respect to basic wind speed and
the service structure as per Table-1 of page no.11 of IS 875-1987
Table 2.1 k1 factor for different wind speed
Location Basic Wind Speed (m/s) k1 factor
Bengaluru 33 1.05
Vijayawada 50 1.07
k3 = topography factor, The effect of topography factor will be significant at site when
upwind slope Ø>300, Below Ø<30
0 , the value of k3 =1, k3 value is confined in between 1.0-
1.36 for Ø>300, Assuming the upwind slope Ø<30
0, Therefore, k3 =1, From the clause 5.3.2.1,
For our project category of structure is assumed as Category-2, which states “Open terrain
with well scattered obstruction having heights generally between 1.5 to 10 m”, Also, from the
clause 5.3.2.2, class of structure is considered as CLASS-C, which indicates that “Structures
Planning
Drafting (AutoCad)
Modelling (Etabs)
Limit State Method consideration
Analysis
Output Data Reading
Comparison
Conclusion
Location State Wind speed (m/s) Wind Zones
Bangalore Karnataka 33 I
Vijayawada Andhra Pradesh 50 V
Page 4
Comparative Study on High-Rise Building Due to Effect of Lateral Forces Using ETABS
http://www.iaeme.com/IJARET/index.asp 262 [email protected]
or their components such as cladding, glazing, roofing etc, having maximum dimension
greater than 50m”. Cp=1.25. Finally, the wind pressure per unit area “p‟ on the wall is taken
as 1.25p pressure on windward surface and 0.5p suction on leeward surface. When the walls
form an enclosure, the windward wall will be subjected to a pressure of 1.25p and leeward
wall to a suction of 0.5p. The total pressure on the wall swill depends on the internal air
pressure also.
2.1.3. Earthquake load
The time periods in X- and Y direction are calculated using the approximate formula given in
Clause 7.6.2, Ta=0.09*h/√d where, h is height of the building, in m and d is base dimension
of the building at plinth level, in m, along the considered lateral force. For the present
building, time period in X- and Y-direction is found to be 0.86s and 0.92s respectively. The
data used for the seismic analysis are; importance factor, I=1.5, response reduction factor,
R=5 this also shown in below table (Table-5). The different parameters obtained are
considered in later sections with comparison.
Table 2.2 Seismic zone Parameters.
Location Zone Factor
(Z)
Importance
Factor (I)
Response
Reduction Factor
(R)
Time Period (T) In
Seconds
X(s) Y(s)
Bengaluru 0.1 1.5 5 0.86 0.92
Srinagar 0.36 1.5 5 0.86 0.92
2.1.4. General Data and Material Properties
Grade of concrete – M25, M30, M35
Modulus of elasticity E - 5000√fck
Poisson‟s ratio U - 0.2
Unit weight of concrete – 25 KN/m3
Unit weight of brick – 20 KN/m3
Grade of Steel - Fe500
Steel Modulus of elasticity E -200000 Mpa
Steel Poisson‟s ratio U - 0.3
Load combinations as per IS 456-2000: The various load combination considered are
mentioned in the below table.
Table 2.3 Load Combinations
SL.No. Seismic SL.No. Wind
1 1.2 DL+LL+EQx 14 1.2 DL+LL+WLx
2 1.2 DL+LL-EQx 15 1.2 DL+LL-WLx
3 1.2 DL+LL+EQy 16 1.2 DL+LL+WLy
4 1.2 DL+LL-EQy 17 1.2 DL+LL-WLy
5 1.5 DL+EQx 18 1.5 DL+WLx
6 1.5 DL-EQx 19 1.5 DL-WLx
7 1.5 DL+EQy 20 1.5 DL+WLy
8 1.5 DL-EQy 21 1.5 DL-WLy
9 0.9 DL+1.5EQx 22 0.9 DL+1.5WLx
10 0.9 DL-1.5EQx 23 0.9 DL-1.5WLx
11 0.9 DL+1.5EQy 24 0.9 DL+1.52WLy
12 0.9 DL-1.5EQy 25 0.9 DL-1.5WLy
13 1.5 DL+LL
Page 5
Amanullah Qureshi, Ummer Farooq Pasha and N S Kumar
http://www.iaeme.com/IJARET/index.asp 263 [email protected]
2.1.5. Load Calculations
The wall load of the structure is calculated as follows, For the wall 350mm, Dead load =
0.35*5*20= 35 KN/m2 for the 5m floor height at ground floor. Dead load = 0.35*3*20= 21
KN/m2 for the 1
st to 15
th floor of floor height 3m. For the wall 230mm. Dead load
=0.23*3*20= 13.8 KN/m2. For the parapet wall load of height 1m, Dead load=0.23*1*20=4.6
KN/m2
Table 2.4 Loads value.
Type of loads Load value (KN/m2)
Wall load (350mm,230mm & parapet wall) 35,21,13.8 and 4.6
Floor finish 1.5
Live load 5
Lift load 25
Escalator load 100
Unit Weight of Some Materials Are Given Below (From IS: 875 – Part-I)
• Concrete – Plain = 24.00 KN/m3
• Concrete – Reinforced = 25.00 KN/m3
• Cement mortar = 20.40 KN/m3
• Burnt Brick masonry (BBM) = 19.20 KN/m3
• Plaster = 20.00 kN/m3
• Steel = 78.50 KN/m3
• Water = 10.00 KN/m3
2.1.6. Geometry of the building
Built-up area - 980.085 m2
Utility of building – Shopping mall
No of Stories – G+15
Floor height (GF) – 5m
Floor height (1st to 15
th) – 3m
Depth of foundation – 2m
Thickness of wall – 350mm & 230mm
2.1.7. Auto Cad Plan of the Building
Figure 2.2 AutoCAD plan
Page 6
Comparative Study on High-Rise Building Due to Effect of Lateral Forces Using ETABS
http://www.iaeme.com/IJARET/index.asp 264 [email protected]
3. ANALYSIS AND DESIGN
3.1. Modelling
The analysis and design of buildings are done by using ETABS Software. This topic describes
a general process for creating a model using ETABS.
Initialization options: Display units: METRIC SI, Steel selection data base: INDIAN, Steel
design code: IS 800-2007, Concrete design code: IS 456:2000
Figure 3.1 3D Render View Figure 3.2 Tendon profile
3.2. Analysis
3.2.1. Analysis of Building for Earthquake Loads as per IS 1893(Part-1):2002
Determination of design earthquake forces is computed by the following methods: 1)
Equivalent static analysis and 2) Dynamic Analysis (RSM).
Table 3.1 Seismic Parameters
Variables Parameters
Zone factor of the building (Z) 0.10(II), 0.36(V)
Importance of the building (I) 1.5
Response reduction factor (R) 5
Time Period Ta (S) X-Direction Y-Direction
0.86 0.92
Average response acceleration
coefficient (Sa/g)
X-Direction Y-Direction
1.58 1.47
Soil type Medium soil
Width of building in X-direction 33.45m
Width of building in Y-direction 29.30m
Height of the building 55m
Seismic weight of the building 285904.98 KN (ETABS)
Equivalent static analysis
Table 3.2 ESA Base shear values
Zone Factor (Z) BASE SHEAR (KN)
Conventional Slab Building PT Slab Building
Zone II (0.10) 279570.65 279542.22
Zone V (0.36) 281833.90 281802.22
Page 7
Amanullah Qureshi, Ummer Farooq Pasha and N S Kumar
http://www.iaeme.com/IJARET/index.asp 265 [email protected]
Table 3.3 ESA Base Reaction Values in X and Y directions
Zone Factor (Z)
BASE SHEAR (KN)
Conventional Slab Building PT Slab Building
X-Direction Y-Direction X-Direction Y-Direction
Zone II (0.10) 5525.00 5164.68 4521.68 4226.78
Zone V (0.36) 19781.07 18491.00 18931.50 17691.49
Response Spectrum Analysis (RSA): For the present study, the CQC method is considered
and has been analyses using ETABS to compare the Static analysis and Response Spectrum
analysis. The below table shows the base shear obtained from ETABS for all the structures.
Table 3.4 Base shear values in X and Y directions
Zone Factor (Z)
(RSM) BASE SHEAR (KN)
Conventional Slab Building PT Slab Building
X-Direction Y-Direction X-Direction Y-Direction
Zone II (0.10) 4630.46 4623.78 3854.44 3762.22
Zone V (0.36) 16558.79 16617.51 16101.56 16092.62
3.2.1. Analysis of Building for Wind Loads as per IS 1875(Part-3)
3.2.2. Base Shear Due to Wind Load
The base reactions due to wind is as follows.
Table-3.5 Base shear due to wind in x and y direction
Zone Factor (Z) and Basic wind
speed (m/s)
BASE SHEAR (KN)
Normal RC Building PT Slab Building
X-Direction Y-Direction X-Direction Y-Direction
Zone I -33 1563.7676 2014.6611 1463.7687 1947.6611
Zone IV- 50 3294.041 4529.223 3094.0405 4237.223
3.2.2. Analysis of Post Tensioned Slab
The design of post tensioned slab is carried out in accordance to specification of IS 1343-
1980, Prestressing steel, γmp= 1.15, The design load combinations are obtained by
multiplying the characteristic loads by the appropriate partial factor of safety, γf (IS 20.4.2),
which are automated done by ETABS, Ultimate Tensile Stress = 1884 N/mm2 , Nominal area
of strands = 98.7 mm2,
Jacking force = 75% of the Ultimate Tensile Force, Post Tensioned
system: Unbounded, Concrete grade: M40.
4. RESULTS AND DISCUSSION
4.1. Analytical Results
The analytical results obtained from the ETABS software are discussed below:
4.2. Deformed Shapes
Figure 4.1 Deformed Shapes due to Dead Load
Page 8
Comparative Study on High-Rise Building Due to Effect of Lateral Forces Using ETABS
http://www.iaeme.com/IJARET/index.asp 266 [email protected]
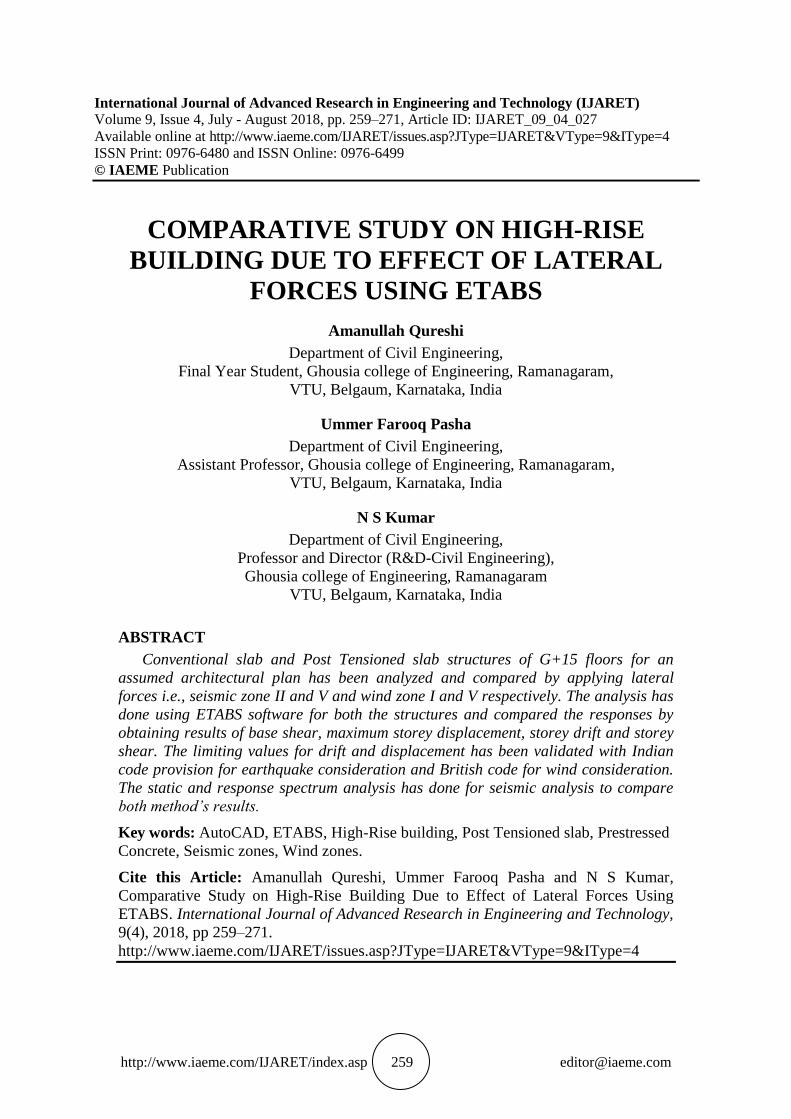
Figure 4.2 Deformed Shapes due to Pre-stress
As per the above deformed shapes we can see that the dead load and pre-stress deformed
shapes are opposite in nature, this property of pre-stress contract with the dead load and
reduce efficient tensile stress in service condition.
4.3. Seismic and Wind Analysis Results
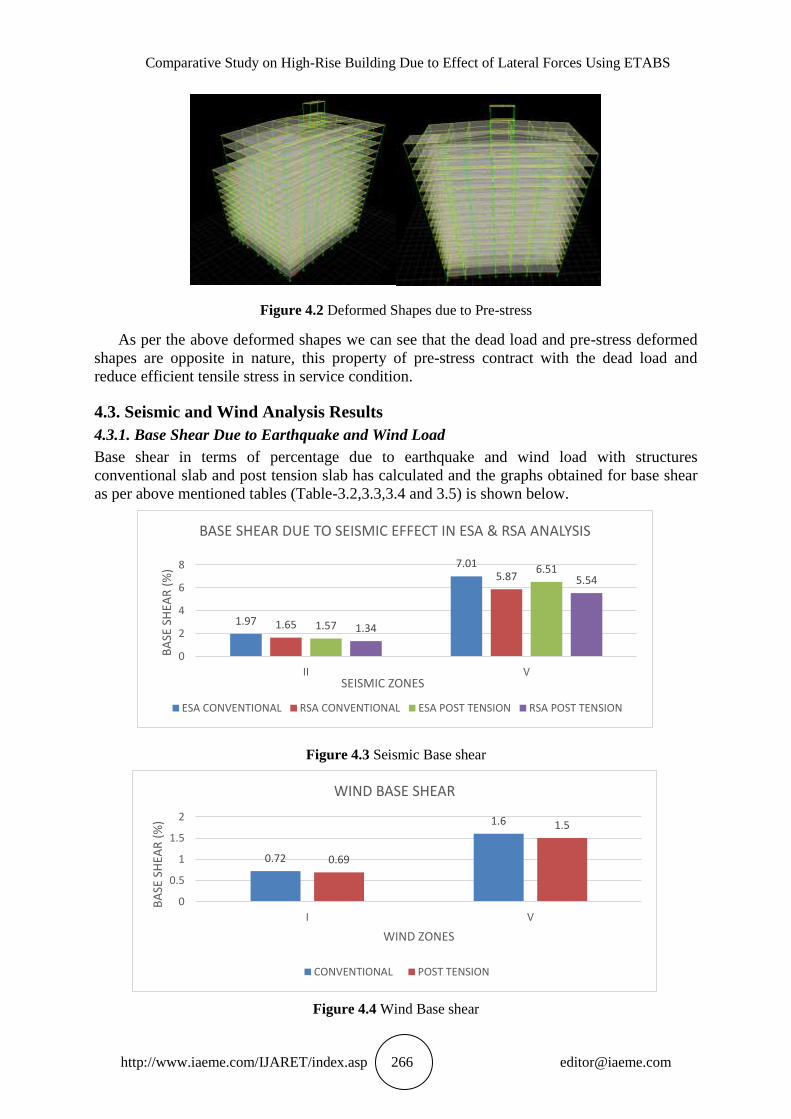
4.3.1. Base Shear Due to Earthquake and Wind Load
Base shear in terms of percentage due to earthquake and wind load with structures
conventional slab and post tension slab has calculated and the graphs obtained for base shear
as per above mentioned tables (Table-3.2,3.3,3.4 and 3.5) is shown below.
Figure 4.3 Seismic Base shear
Figure 4.4 Wind Base shear
1.97
7.01
1.65
5.87
1.57
6.51
1.34
5.54
0
2
4
6
8
II V
BA
SE S
HEA
R (
%)
SEISMIC ZONES
BASE SHEAR DUE TO SEISMIC EFFECT IN ESA & RSA ANALYSIS
ESA CONVENTIONAL RSA CONVENTIONAL ESA POST TENSION RSA POST TENSION
0.72
1.6
0.69
1.5
0
0.5
1
1.5
2
I V
BA
SE S
HEA
R (
%)
WIND ZONES
WIND BASE SHEAR
CONVENTIONAL POST TENSION
Page 9
Amanullah Qureshi, Ummer Farooq Pasha and N S Kumar
http://www.iaeme.com/IJARET/index.asp 267 [email protected]
4.2.2. Maximum Story displacement Due to Earthquake load:
Table 4.1 Displacement due to 1.5(DL+EQY) and 1.5(DL+LL+WLY
Figure 4.5 Displacement Due to Seismic
Figure 4.5 Displacement Due to Wind
0
100
200
300
LR SR S15 S14 S13 S12 S11 S10 S9 S8 S7 S6 S5 S4 S3 S2 S1 GF Base
DIS
PLA
CEM
ENT
(MM
)
STOREY LEVEL
Storey Displacement Due to Seismic in Conventional and Post Tension Slab
Z-II CONVENTIONAL Z-II POST TENSION Z-V CONVENTIONAL Z-V POST TENSION
0
20
40
60
LR SR S15 S14 S13 S12 S11 S10 S9 S8 S7 S6 S5 S4 S3 S2 S1 GF Base
DIS
PLA
CEM
ENT
(MM
)
STOREY LEVEL
Storey Displacement Due to Wind In Conventional and Post Tension Slab
Z-1 CONVWNTIONAL Z-1 POST TENSION Z-V CONVENTIONAL Z-V POST TENSION
Page 10
Comparative Study on High-Rise Building Due to Effect of Lateral Forces Using ETABS
http://www.iaeme.com/IJARET/index.asp 268 [email protected]
4.2.3. Maximum Storey Drift Due to Seismic and Wind load
Table 4.1 Displacement due to 1.5(DL+EQY) and 1.5(DL+LL+WLY
Figure 4.5 Drift Due to Seismic
Figure 4.5 Drift Due to Wind
0
0.002
0.004
0.006
LR SR S15 S14 S13 S12 S11 S10 S9 S8 S7 S6 S5 S4 S3 S2 S1 GF Base
DR
IFT
STOREY LEVEL
Storey Drift Due to Seismic in Conventional and Post Tension slab
Z-II CONVENTIONAL Z-II POST TENSION Z-V CONVENTIONAL Z-V POST TENSION
0
0.002
0.004
LR SR S15 S14 S13 S12 S11 S10 S9 S8 S7 S6 S5 S4 S3 S2 S1 GF Base
DR
IFT
STOREY LEVEL
Storey Drift Due to Wind in Conventional and Post Tension Slab
Z-I CONVENTIONAL Z-I POST TENSION Z-V CONVENTIONAL Z-V POST TENSION
Page 11
Amanullah Qureshi, Ummer Farooq Pasha and N S Kumar
http://www.iaeme.com/IJARET/index.asp 269 [email protected]
4.2.4. Storey Shear Due to Earthquake and Wind load
Table 4.1 Storey Shear due to 1.5(DL+EQY) and 1.5(DL+LL+WLY
Figure 4.5 Shear Due to Seismic
Figure 4.5 Shear Due to Wind
0
10000
20000
30000
40000
LR SR S15 S14 S13 S12 S11 S10 S9 S8 S7 S6 S5 S4 S3 S2 S1 GF Base
SHEA
R K
N
STOREY LEVEL
Storeyn Shear Due to Seismic in Conventional and Post Tension Slab
Z-II CONVENTIONAL Z-II POST TENSION Z-V CONVENTIONAL Z-V POST TENSION
0
2000
4000
6000
8000
LT SR S15 S14 S13 S12 S11 S10 S9 S8 S7 S6 S5 S4 S3 S2 S1 GF Base
DR
IFT
STOREY LEVEL
Storey Shear Due to Wind in Conventional and Post Tension slab
Z-I CONVENTIONAL Z-I POST TENSION Z-V CONVENTIONAL Z-V POST TENSION
Page 12
Comparative Study on High-Rise Building Due to Effect of Lateral Forces Using ETABS
http://www.iaeme.com/IJARET/index.asp 270 [email protected]
5. CONCLUSIONS
i. Base shear due to seismic
Base shear due to dead load, live load and imposed obtained for both structures with
conventional and post tension slab having almost same values with slight variation of
0.1% in zone I and V.
In Conventional slab structures, The RSA method shows 16.19% less base reactions
compare to ESA method in zone-II. Similarly, for zone-V RSA is lagging by 16.29%
with ESA. In post tension slab structures, RSA shows 14.79% less base reactions than
ESA method in zone-II. Likewise, in zone-V RSA is lagging by 14.94% with ESA.
ii. Base shear due to wind
The post tension slab structure having 3.3% less base reaction than conventional slab
structures in wind zone-I.
The post tension slab structure having 6.45% less base reaction than conventional slab
structures in wind zone-V.
iii. Displacement due to seismic load, the post tension slab structures having 32% less
displacement than conventional slab structures in seismic zone-II. Similarly, in zone-V
the post tension structure having 15% less displacement compares to conventional slab
structures.
iv. Displacement due to wind load, the post tension slab structures having 29.17% less
displacement than conventional slab structures in wind zone-II. Similarly, in zone-V
the post tension structure having 12% less displacement compares to conventional slab
structures.
v. The maximum storey drift due to seismic, the post tension slab structures having 22%
less drift value than conventional slab structures in seismic zone-II. Similarly, in zone-
V the post tension structure having 40% less drift compares to conventional slab
structures.
vi. The maximum storey drift due to wind, the post tension slab structures having 23.22%
less drift value than conventional slab structures in wind zone-I. Similarly, in zone-V
the post tension structure having 4.87% less drift compares to conventional slab
structures.
vii. The maximum storey shear due to seismic, the post tension slab structures having
15.41% less shear value than conventional slab structures in seismic zone-II.
Similarly, in zone-V the post tension structure having 2.47% less shear compares to
conventional slab structures.
viii. The maximum storey shear due to wind, the post tension slab structures having
11.04% less shear value than conventional slab structures in seismic zone-II.
Similarly, in zone-V the post tension structure having 3.09% less shear compares to
conventional slab structures.
REFERENCES
[1] Narla Mohan, A.M`Ounika Vardhan, (2017), “Analysis Of G+20 Rc Building In Different
Zones Using Etabs”, Ijpes, Volume 8, Issue 3.
[2] M.Mallikarjun1, Dr P V Surya Prakash, (2016), “Analysis And Design Of A Multi-Storied
Residential Building Of (Ung-2+G+10) By Using Most Economical Column Method”, Ijseat,
Volume 4, Issue 2.
[3] K. Rama Raju, M.I. Shereef, Nagesh R Iyer, S. Gopalakrishnan, (2013), “Analysis And
Design Of Rc Tall Building Subjected To” Wind And Earthquake Loads”, Volume-8
Page 13
Amanullah Qureshi, Ummer Farooq Pasha and N S Kumar
http://www.iaeme.com/IJARET/index.asp 271 [email protected]
[4] Nlokesh Neddy, N Bijaya Kumar, (2014), “Design And Analysis Of A Commercial Complex
By Using Post Tension Method (Stilt+12floors)” Ijmetmr Issue-11, Volume-1
[5] Kevan.D. Chodvadiya, Ramya. R.S, (2017), „Comparison Of R.C.C And Post-Tension
Building For Seismic‟ Ijaerd, Issue-5, Volume-4.
[6] Jnanesh Reddy R K, Pradeep A R, (2017), “Comparative Study Of Post Tensioned And Rcc
Flat Slab In Multi-Storey Commercial Building”, Irjet, Volume-4, Issue-6.
[7] Tausif J. Shaikh, Swapnil B. Cholekar, Hemant L. Sonawadekar, (2017), “Analysis Of G+20
Rc Building In Different Zones Using Etabs” Volume-8, Issue-3.
[8] Amol S. Rajas, Dr.N.L.Shelke, (2016), “Wind Analysis Of High Rise Building With Different
Bracing Systems”, Ijarset, Vol. 3, Issue 4.
[9] V. G. Mutalik Desai, Mohammad J. Shaikh, (2016), “Comparative Analysis Of Flat Slab And
Post-Tensioned Flat Slab Using Safe”, Iarjset, Volume-3, Issue-8.
[10] Is456:2000, Code For Plain And Reinforced Concrete.
[11] Is1893(Part 1):2002, Criteria For Earthquake Resistant Design Of Structures.
[12] Is875 (Part 1)-1987, Dead Loads
[13] Is875 (Part 2)-1987, Imposed Loads.
[14] Is875 (Part 2)-1987, Wind Loads.
[15] Is1343-1980, Code Of Practice For Prestressed Concrete.
AUTHOR PROFILE
Graduated in the year 2015 from VTU, Belgaum. Presently perusing Master
of Technology in Structural Engineering at Ghousia College of
Engineering, Ramanagaram Also working on this topic for the dissertation
under the guidance of Ummer Farooq Pasha and Dr. N S Kumar.
Ummer Farooq Pasha, Assistant Professor Dept. of Civil Engineering GCE,
Ramanagaram 562159.
Dr. N.S. Kumar, Prof and Director (R & D) is involved in the Research
field related to composite steel columns. He received BE, in Civil
Engineering from Mysore University (1985), ME & Ph.D degrees from
Bangalore University during 1988 & 2006 respectively. He has guided 1
ph.D, 1 M.sc Engineering (By Research) under VTU, Belgaum. Presently
he is guiding 6 Ph.D, scholars and has guided more than 30 M.tech
projects. He has more than 30 years of teaching experience & has published over 130 papers
in National & International journals including conferences.