17
Comparing structural & non-structural measures Kees Bons Flood Risk Management and Urban Resilience Workshop II May 28-29, 2013 Venue COEX, Seoul, Republic of Korea

12 februari 2010
Comparing structural
& non-structural measures
Kees Bons
Flood Risk Management and Urban Resilience Workshop II
May 28-29, 2013
Venue COEX, Seoul, Republic of Korea
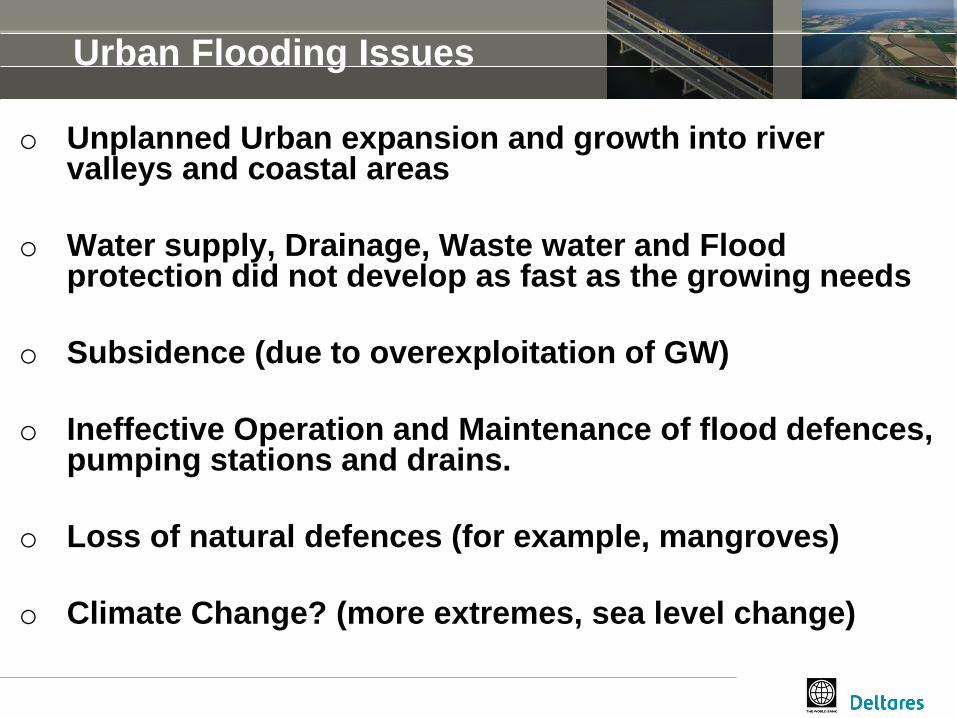
Urban Flooding Issues
o Unplanned Urban expansion and growth into river valleys and coastal areas
o Water supply, Drainage, Waste water and Flood protection did not develop as fast as the growing needs
o Subsidence (due to overexploitation of GW)
o Ineffective Operation and Maintenance of flood defences, pumping stations and drains.
o Loss of natural defences (for example, mangroves)
o Climate Change? (more extremes, sea level change)

No solutions, just responses
• Structural adaptation measures
(SAMs):
Constructed permanent facilities to
reduce the damage risk
• Non-structural adaptation measures
(NSAMs):
Responses to urban water problems
that may not involve fixed or permanent
facilities. Their positive contribution to
risk reduction is most likely through a
process of influencing behavior, usually
through building capacity in all
stakeholders through active learning
and appropriate and effective
engagement between stakeholders
(Taylor and Wong, 2002).

12 guiding policy principles
1. Every flood risk scenario is different: there is no flood management blueprint.
2. Designs for flood management must be able to cope with a changing and uncertain
future.
3. Rapid urbanization requires the integration of flood risk management into regular
urban planning and governance.
4. An integrated strategy requires the use of both structural and non-structural measures
and good metrics for “getting the balance right”.
5. Heavily engineered structural measures can transfer risk upstream and
downstream.
6. It is impossible to entirely eliminate the risk from flooding.
7. Many flood management measures have multiple co-benefits over and above their
flood management role.
8. It is important to consider the wider social and ecological consequences of flood
management spending.
9. Clarity of responsibility for constructing and running flood risk programs is
critical.
10.Implementing flood risk management measures requires multi-stakeholder cooperation.
11.Continuous communication to raise awareness and reinforce preparedness is
necessary.
12.Plan to recover quickly after flooding and use the recovery to build capacity.
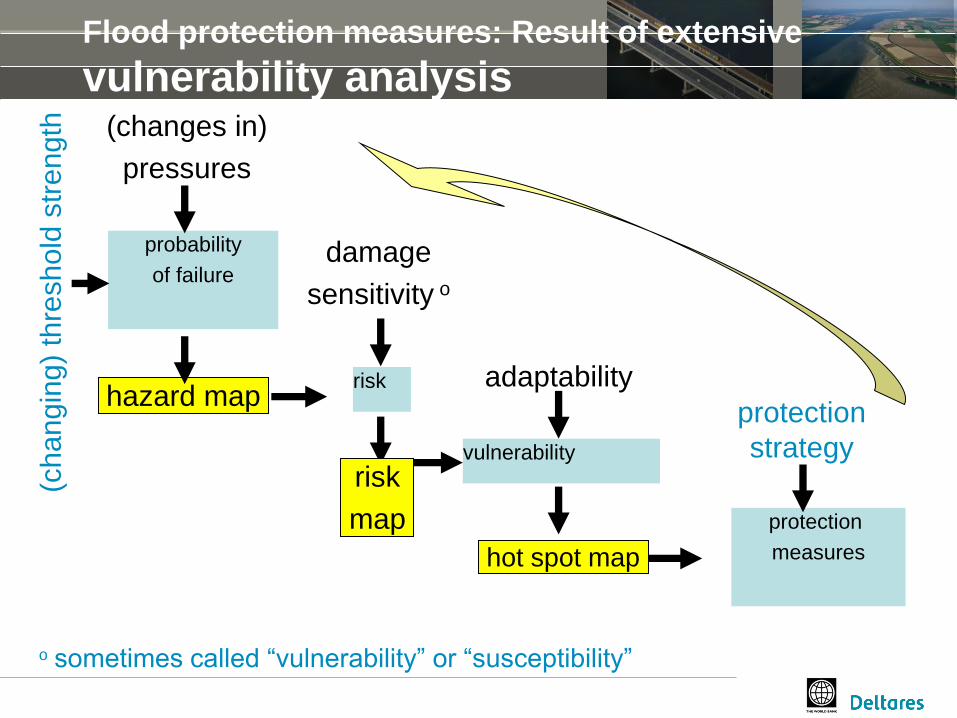
probability
of failure
risk
vulnerability
protection
measures
hazard map
damage
sensitivity o
risk
map
(changes in)
pressures
adaptability
hot spot map
o sometimes called “vulnerability” or “susceptibility”
(chan
gin
g)
thre
sh
old
str
en
gth
protection
strategy
Flood protection measures: Result of extensive
vulnerability analysis

Measures we could take to reduce flood risk
> 200 adaptation measures identified…..
SAMs: Structural (hard) measures (# >100)
Collective: e.g. dikes, drainage systems
Individual: e.g. wet or dry proofing
NSAMs: Non-structural (soft) measures (# > 100)
Collective: e.g. contingency plans, legislation
Individual: e.g. risk consciousness, insurance
… and counting
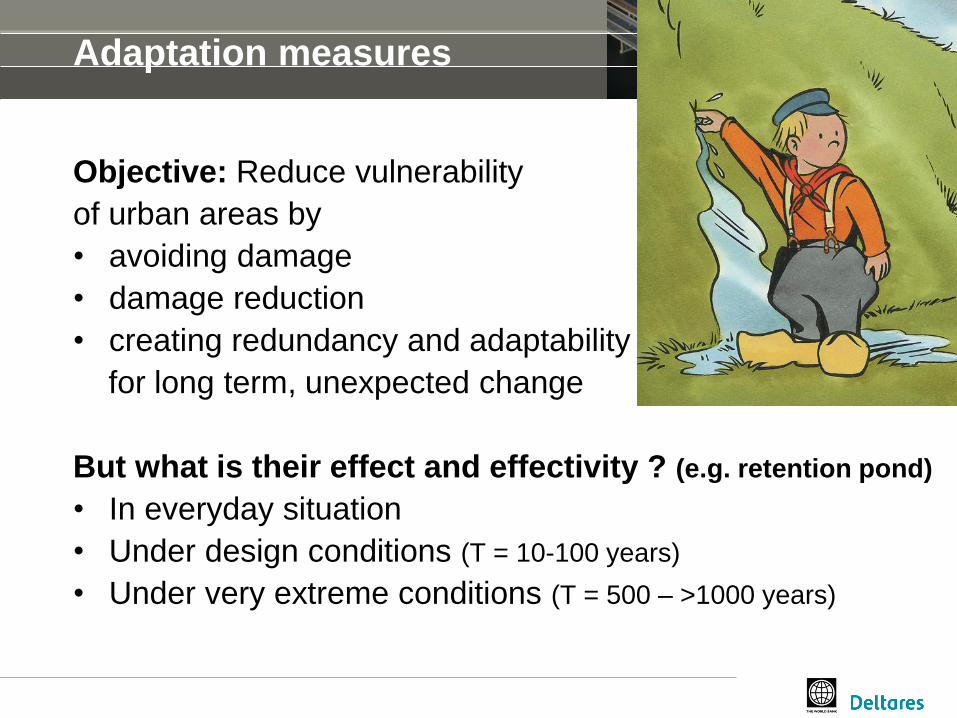
Adaptation measures
Objective: Reduce vulnerability
of urban areas by
• avoiding damage
• damage reduction
• creating redundancy and adaptability
for long term, unexpected change
But what is their effect and effectivity ? (e.g. retention pond)
• In everyday situation
• Under design conditions (T = 10-100 years)
• Under very extreme conditions (T = 500 – >1000 years)

What if we rely only on structural measures
- When they fail they often fail dramatically (a chain is as strong as
its weakest link)
- Structural measures cannot evolve with development
- Structural measures generally require high investments
- Structural measures often have major side-effects
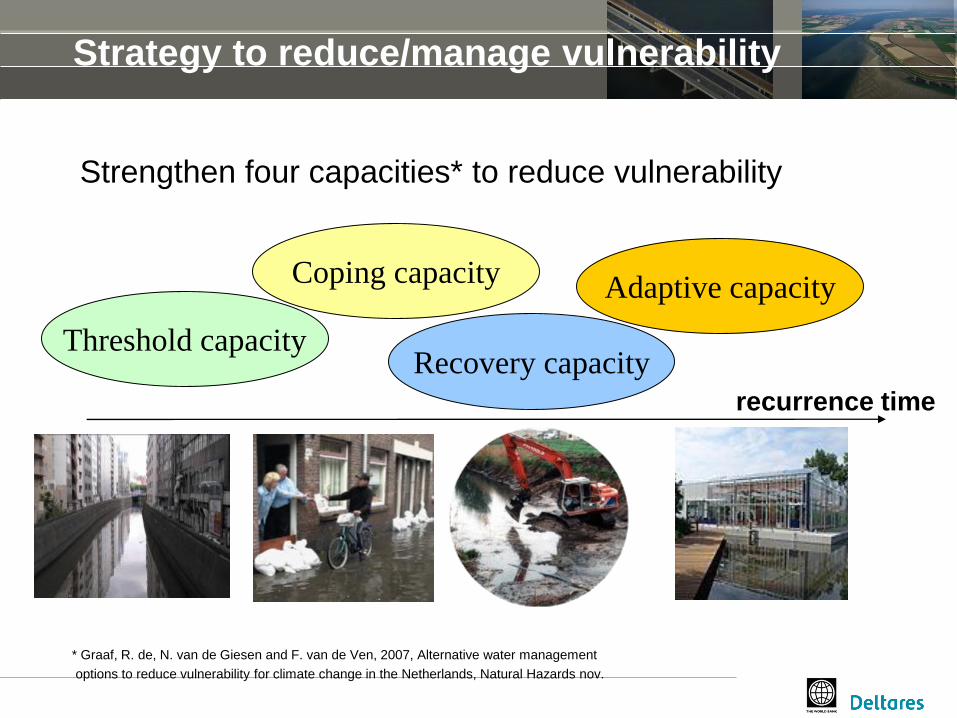
Threshold capacity
Coping capacity
Recovery capacity
Adaptive capacity
recurrence time
Strategy to reduce/manage vulnerability
* Graaf, R. de, N. van de Giesen and F. van de Ven, 2007, Alternative water management
options to reduce vulnerability for climate change in the Netherlands, Natural Hazards nov.
Strengthen four capacities* to reduce vulnerability
Traditional Vulnerability reduction approach
First priority:
SAMs to strengthen threshold capacity for fluvial and coastal flooding
e.g. World Bank (2010) Climate risk and Adaptation in Asian Coastal Megacities
Consequences:
• Other capacities and NSAMs get neglected
• Increased vulnerability for other risks e.g. pluvial flooding, drought, land subsidence, heat …
• Lock-in
• Effectivity in very extreme conditions (T>100 yr) is poor
• Adaptability is limited
Vulnerability reduction approach
Conclusion:
• Strengthen all four capacities
• SAMs show limited adaptability
• Most SAMs strengthen threshold &
coping capacity
• SAMs require high federal or
regional investments
• NSAMs require less, local or
individual investments
• NSAMs require study (learning) and
regular training
• SAMs can’t do without NSAMs

SAMs can’t do without NSAMs
What would have happened …
• in Holland without effective flood early warning system
• in Indonesia with an effective tsunami warning system
• in New Orleans without an effective evacuation plan
• in Brisbane if their zoning plan had been water resilient
SAMS are only effective if people are aware, prepared, trained
and space use and construction are regulated
(and preparedness, rules and
regulations are maintained)
Considering all the uncertainties
the buzz word now is:
ADAPTIVE Management
NSAMS prove to be much more
adaptive than SAMS
Transfer station to new policy
Adaptation Tipping Point of a policy (Terminal)
Pathways
Raise level +1.1 m in spring
Scenario’sSteam
Rest
2050
Change to drougth/salt tolerant crops
2100
Lower navigation sluices. Increasing pumping capacity. Strenthen dikes. Lower inlet structures.
Raise IJsselLake level within current infra +0.1
Decrease level within current infra (-0.6?)Accept navigation abstruction during extreme drougths
Decrease level and adapt infrastructure (-0.8?)
More water through IJssel in summer. Afh. NWW
Adapt regional water system infrastructure. Raise dikes. More water to Ijssel in spring
Raise level +0.6 m Raise dikes. More water to Ijssel. Adapt regional watersystem infrastructure
Change land use
Current policy
More efficient water use
-0.20 - -0.4 m NAP
e.g. increase regional storage, flushing optimalisation, flex level control. After 2050 pumping capacity needs to be increased.
After 2050 pumping capacity needs to be increased
Optimising current policy Flexible water levels
2100
Wat
erv
raag
be
leid
sop
tie
sW
ate
rbe
sch
ikb
aarh
eid
be
leid
sop
tie
s
Voorkeurspad volgens toekomstperspectief ‘Een veilig en verzorgde delta’
Voorkeurspad volgens toekomstperspectief ‘Robuuste onafhankelijke watersystemen
Voorkeurspad volgens toekomstperspectief ‘Water en de wereld verbonden’
Voorkeurspad volgens toekomstperspectief ‘Water als bron van groei’

How to select an appropriate set of AMs?
Three-step approach
1: Complete vulnerability-analysis
2: Select a strategy to reduce vulnerability
3: Select appropriate set of measures
many stakeholders / many stakes
many SAMs and NSAMs
design and negotiation approach

Every situation is unique and dynamic
•Type of flood (fluvial, pluvial,
coastal, ground water)
•Development and (spatial)
planning stage
•Economic and social values
•Culture and government style
•Individual vs Community
•Environment
•
•
0,0000
0,0002
0,0004
0,0006
0,0008
0,0010
0,0012
2000 2020 2040 2060 2080 2100 2120 2140 2160
year
pro
babili
ty (
1/y
ear)

Resulting portfolio of AMs
1. Threshold capacity
Waterrobust infrastructure
Enlarged seasonal storage
High floor level vs street level
Floating housing
2. Coping capacity
Major drainage system; adapted street
profile
Wet proofing vulnerable buildings
Warm grass instead cold grasses
4. Adaptive capacity
Temporary houses & buildings
Adaptive management
Water-based spatial planning
Updates water & space policies
3. Recovery capacity
Redundant pumping capacity
Cleaning & drying capacity
Water supply capacity in extremely dry
periods
Measures to strengthen …
With the varying time and adaptation horizons…

Resulting design New Orleans
Dutch Dialogues III, April 2010, www.dutchdialogues.com


