Comparison and Terrain Influence on Predictions with Linear and CFD Models CANWEA Annual Conference, Vancouver, BC October 04, 2011 GILLES BOESCH, M.Eng, Wind Project Analyst Hatch (Montreal), Canada
Transcript
Comparison and Terrain Influence on
Predictions with Linear and CFD
Models
CANWEA Annual Conference, Vancouver, BC
October 04, 2011
GILLES BOESCH, M.Eng, Wind Project Analyst
Hatch (Montreal), Canada
Overview
• Introduction
• Presentation of a test case
• Model comparison, terrain influence
• Conclusions and investigations
2
Introduction
• CFD is now well established in the wind
industry
• Need to quantify the uncertainty associated
to these models
• Compare the errors with linear models
• Influence of the errors with topography
complexity – And how to deal with it
3
Test case
• Comparison between linear (WAsP) and CFD
model (Meteodyn) on a potential project
• RANS equation with one-equation closure
scheme (k-L turbulence model)
• Project covers an area of 11km x 8km
• Equipped with 12 meteorological masts
(recording from 6 months to 6 years of data)
• Relatively complex (deep valleys, ridges,
rolling mountains)
• Mix of coastal and inland areas
4
Test case
• Forest diversity:
– Logged area
– 15m high trees
– Regrowth
• RIX (Ruggedness Index)
– % of slopes >30% in a 3500m radius
– RIX Variations:
• 2 to 25 over the entire project
• 2.7 to 22.4 at the meteorological masts
Variety of conditions to evaluate the
behavior of the models
5
Masts Altitude
(m)
RIX
(%)
M1 540 10.1
M2 560 11.0
M3 421 22.4
M4 420 17.9
M5 448 15.1
M6 521 16.6
M7 560 8.0
M8 433 22.1
M9 440 11.8
M10 665 14.3
M11 567 2.7
M12 540 12.1
Test Case
• Meteodyn settings :
– Structured Mesh (30m cell size within the
project area)
– Use of a forest model (windflow over canopy)
– Neutral stability class assumed (can induce
errors for sea shore sites) – Resulting shear
verified for some masts
• Data :
– Measured and Quality controlled
– At 50m or 60m high (to avoid extrapolation
errors)
– Adjusted to long term with standard MCP
method (to have the same reference)
6
Results – Methodology
• Cross-Prediction Matrix
– Predictors : Mast that predicts the others
– Predicted : Wind Speed at the « Predicted Mast »
7
Predicted
M1 M2 M3 … M12 P
red
icto
r
M1 M1 measured M1 predicts
M2
M2 M2 predicts
M1 M2 measured
M3 M3 measured
… …
M12 M12 measured
Results - Methodology
• Cross-Prediction Matrix
– 12 x 12 matrix 132 cross predictions
– For both WAsP and Meteodyn
– No correction is applied to both models output
– Correction often applied with WAsP because of
wind speed inconsistencies in complex terrain
• Converted into a Relative Error Matrix :
• Resulting in 132 relative error values for
each cross-prediction
measured
measuredpredicted
V
VVE%
8
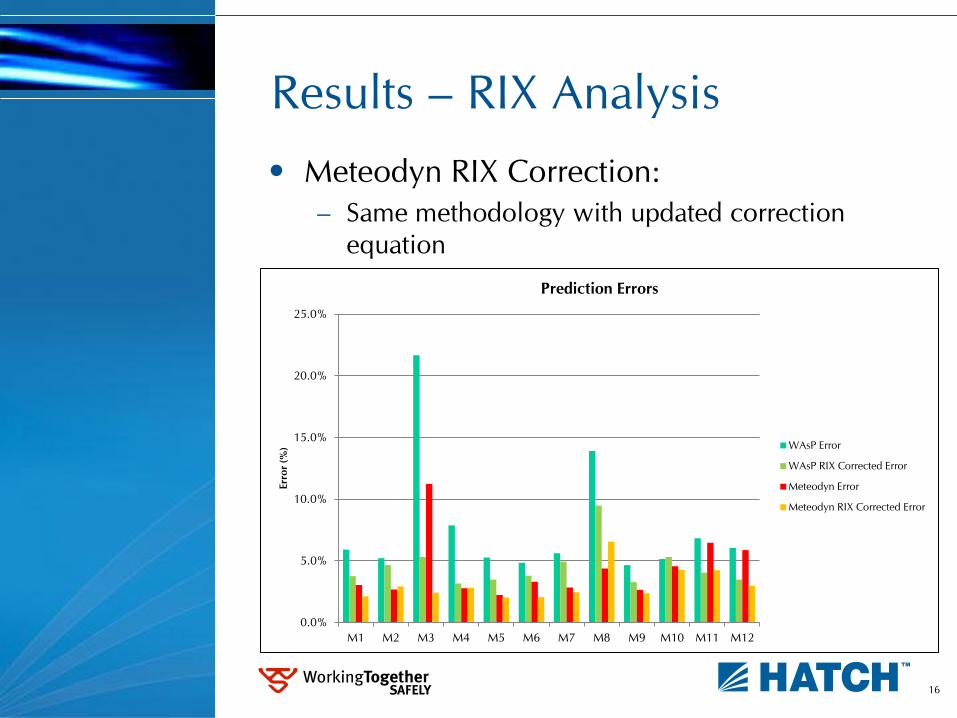
Results - Comparison
• Mean absolute errors
Masts Altitude
(m) RIX (%)
M1 540 10.1
M2 560 11.0
M3 421 22.4
M4 420 17.9
M5 448 15.1
M6 521 16.6
M7 560 8.0
M8 433 22.1
M9 440 11.8
M10 665 14.3
M11 567 2.7
M12 540 12.1
9
0.0%
5.0%
10.0%
15.0%
20.0%
25.0%
M1 M2 M3 M4 M5 M6 M7 M8 M9 M10 M11 M12
Err
or
(%)
Prediction Errors
WAsP Error
Meteodyn Error
< 2km from
water
Results - Comparison
• Absolute errors (direct output from models)
• On average, reduction of the error by 40%.
• Some exceptions : 33 cases out of 132
show better results with WAsP
WAsP Meteodyn
Min Error 0.0% 0.0%
Max Error 34.0% 14.1%
Average 7.7% 4.6%
10
Results - Comparison • Generally, errors from both models have