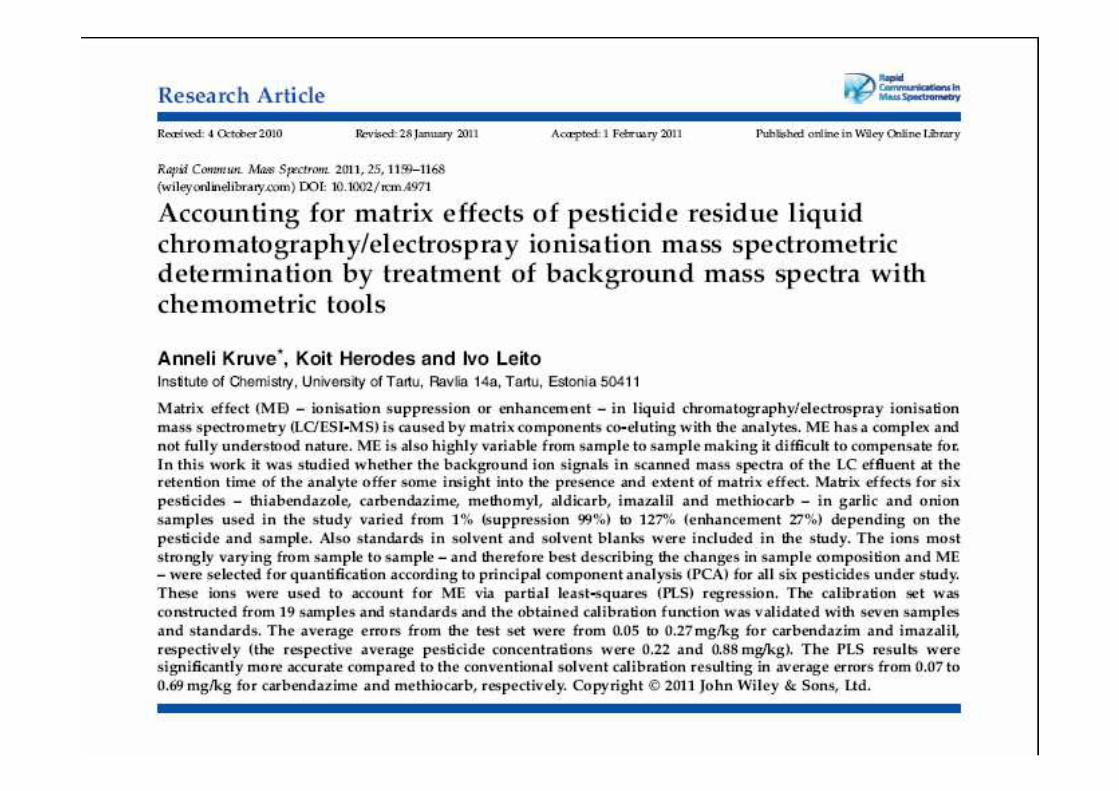
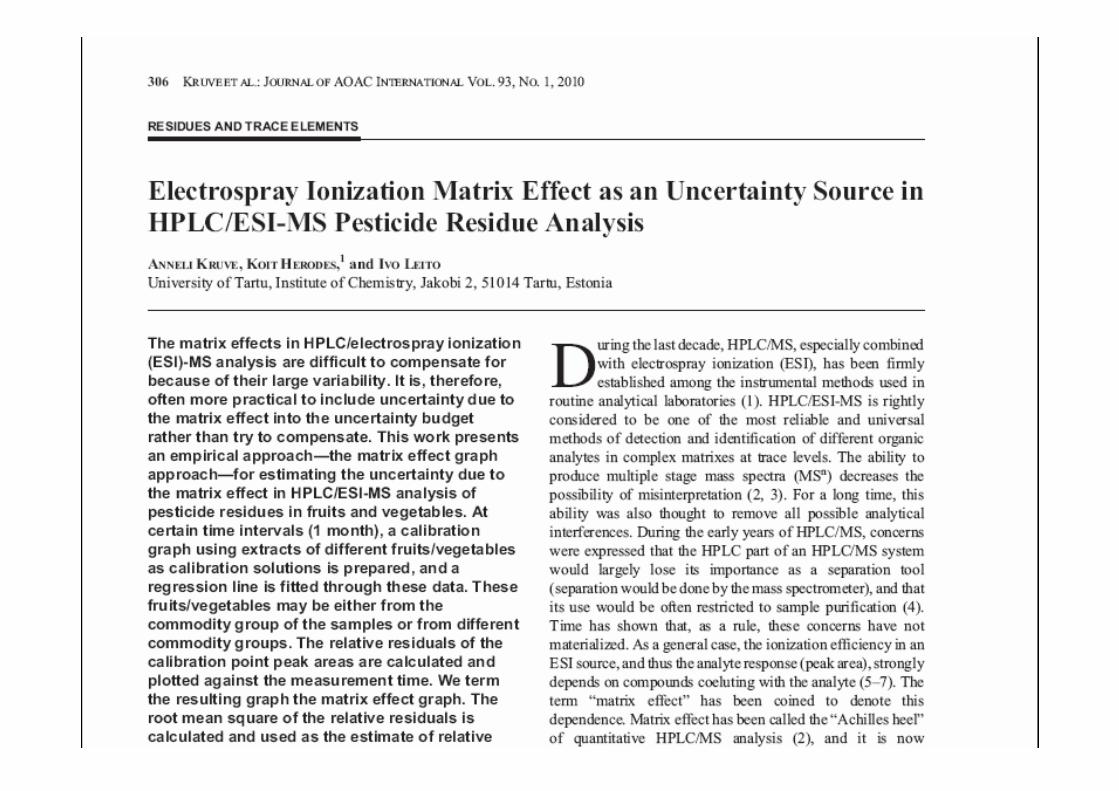
Anneli Kruve Comparison of different methods aiming to account for/overcome matrix effects in LC/ESI/MS on the example of pesticide analyses Anneli Kruve, Ivo Leito Analytical Methods 2013, 5, 3035-3044 http://dx.doi.org/10.1039/C3AY26551J
Transcript
������������ ����������������������������������
���������������
Anneli Kruve
Comparison of different methods aiming to account for/overcome matrixeffects in LC/ESI/MS on the example of pesticide analyses
Anneli Kruve, Ivo Leito Analytical Methods 2013, 5, 3035-3044
http://dx.doi.org/10.1039/C3AY26551J
22
Electrospray ionization
• ESI is used to connect LC and MS
• LC effluent is sprayed into small droplets
• Droplets devide into smaller droplets
• From the surface of small droplets ions can reach gas phase
HPLC effluent
Nebulizer
Waste
Drying gas N2
+
++
+
++ + + ++ + + +++
MS
Voltage ~3500 V
Nebulizer gas N2
3
Contents
• Matrix effects in LC-ESI-MS, their presence and evaluation
• Approaches for combating matrix effects– Extrapolative dilution
– Sample preparation
– Accounting for matrix effects
– ESI optimization to reduce matrix effects
• Conclusions3
44
Matrix effect
• Ionization efficiency in ESI depends on:– Solvent composition
– ESI parameters
– Compounds
co-eluting with
analyte
Are kept constant during analyses
Are not present in standards but are present in samples
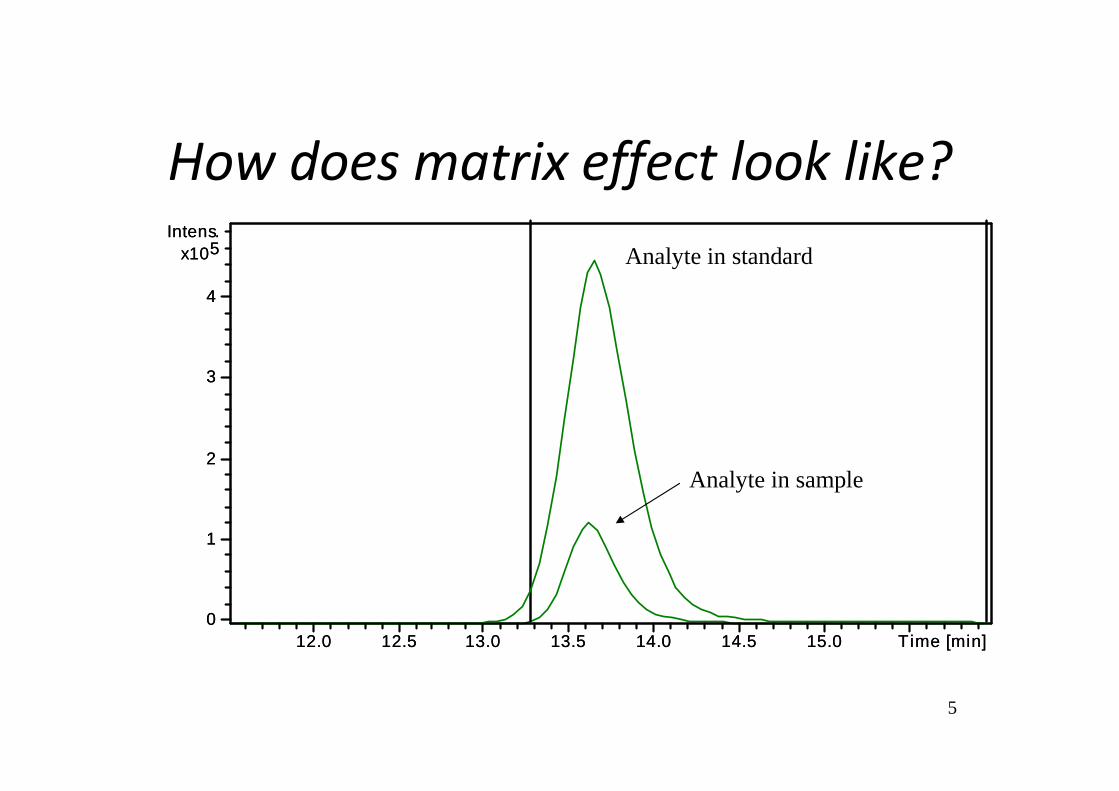
Same amount of analyte gives different signal in sample and in standard
Matrix effect
12.0 12.5 13.0 13.5 14.0 14.5 15.0 Time [min]0
1
2
3
4
5x10Intens.
12.0 12.5 13.0 13.5 14.0 14.5 15.0 Time [min]0
1
2
3
4
5x10Intens.
5
Analyte in standard
Analyte in sample
How does matrix effect look like?
66
Combating matrix effect
• Reducing matrix effects– Sample preparation
– Dilution of the sample
– Instrumental parameters
• Taking matrix effect into account– Correcting results
– Uncertainty
77
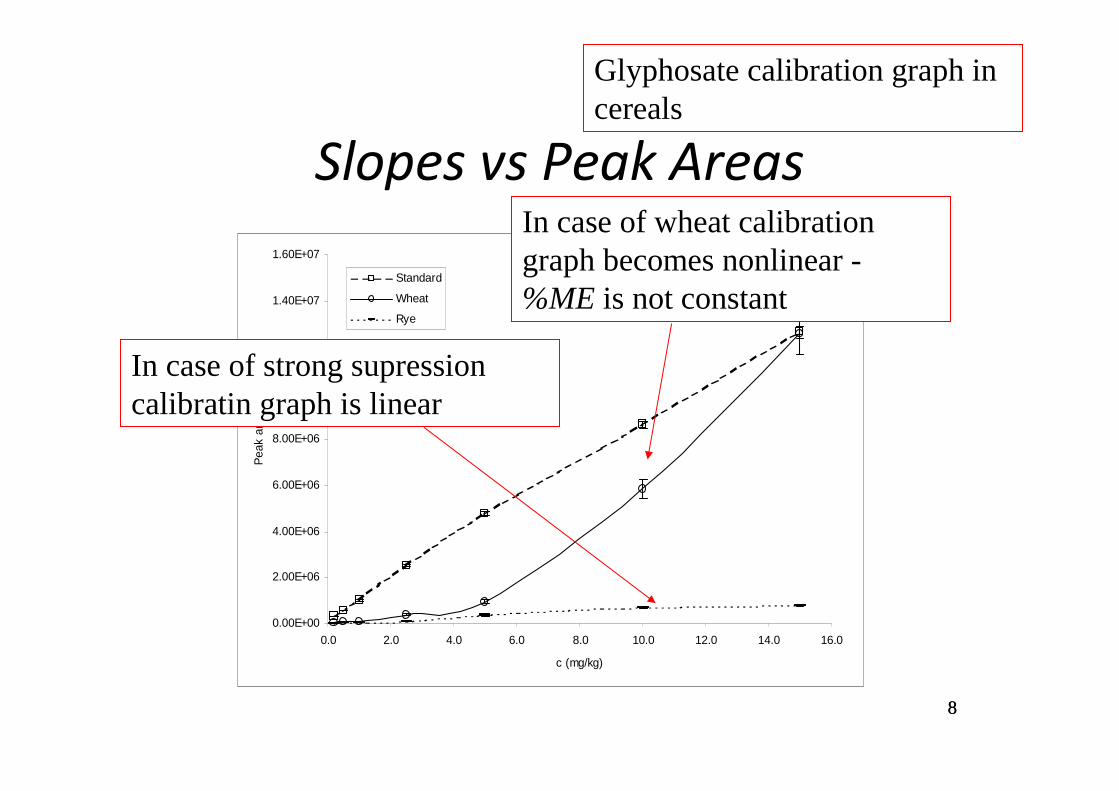
Evaluation of matrix effect
• Is expressed as a ratio of analyte signal in sample and in standard: %ME
In case of wheat calibration graph becomes nonlinear -%ME is not constant
In case of strong supression calibratin graph is linear
99
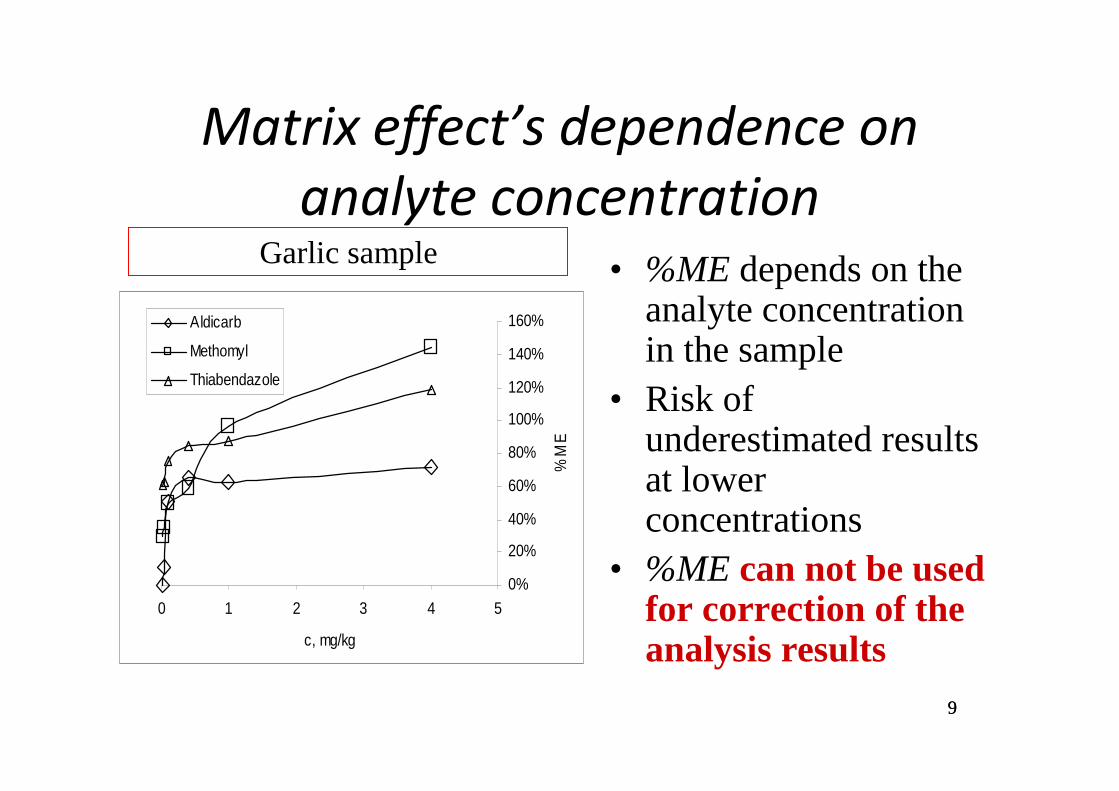
Matrix effect’s dependence on
analyte concentration
• %ME depends on the analyte concentration in the sample
• Risk of underestimated results at lower concentrations
• %ME can not be used for correction of the analysis results
0%
20%
40%
60%
80%
100%
120%
140%
160%
0 1 2 3 4 5
c, mg/kg
%M
E
Aldicarb
Methomyl
Thiabendazole
Garlic sample
1010
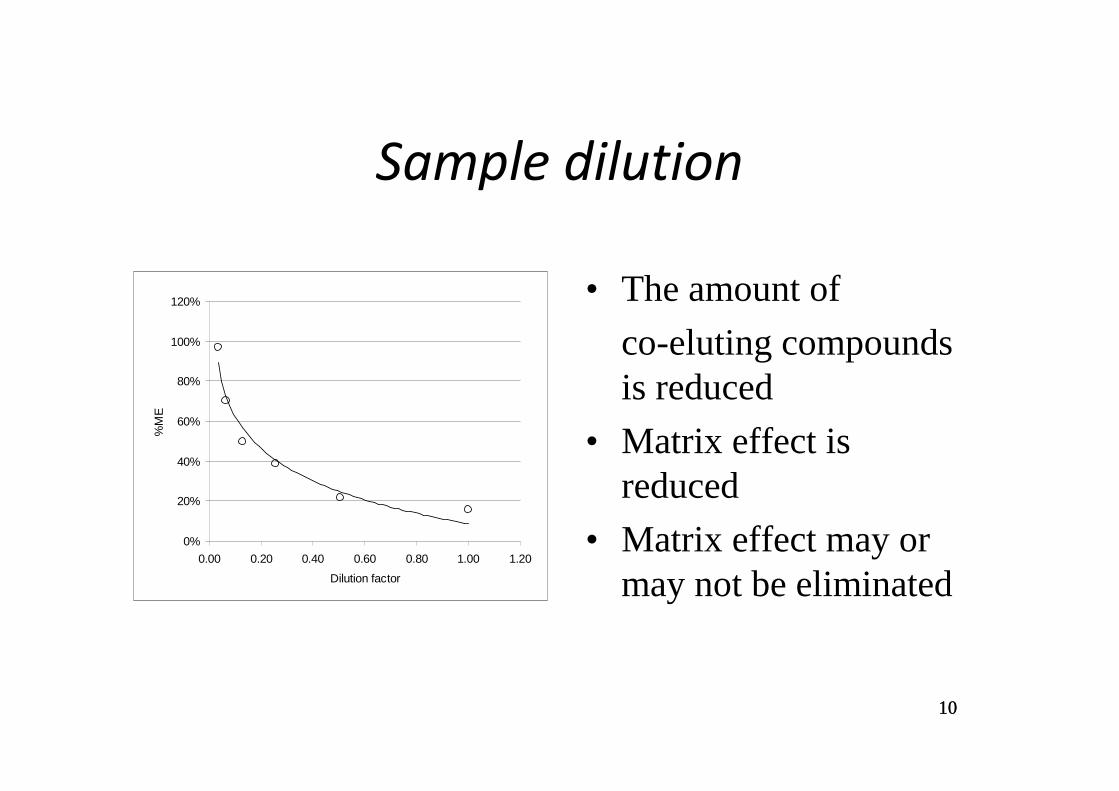
Sample dilution
• The amount of
co-eluting compounds is reduced
• Matrix effect is reduced
• Matrix effect may or may not be eliminated
0%
20%
40%
60%
80%
100%
120%
0.00 0.20 0.40 0.60 0.80 1.00 1.20
Dilution factor
%M
E
1111
No matrix effect
0.00
0.10
0.20
0.30
0.40
0.50
0.60
0 0.2 0.4 0.6 0.8 1 1.2
Dilution factor
Cal
cula
ted
conc
entr
atio
n (m
g/kg
)
0.00
1.00
2.00
3.00
4.00
5.00
6.00
0 0.05 0.1 0.15 0.2 0.25 0.3
Dilution factor
Cal
cula
ted
conc
entr
atio
n (m
g/kg
)
0.00
0.05
0.10
0.15
0.20
0.25
0.30
0.35
0.40
0.45
0.50
0 0.2 0.4 0.6 0.8 1 1.2
Dilution factor
Cal
cula
ted
conc
entr
atio
n (m
g/kg
)
Dilution eliminates matrix effect
Dilution does not eliminate matrix effect
Analyte concentration is calculated as the average of all the measurements
Analyte concentration is the average of 3 most
diluted samples
Analyte concentration is estimated as the
intercept of the plot
A B C
1212
Validation
• 5 fruits and vegetables, spiked with 5 pesticides at 2 concentration levels– 11 observations of situation A– 6 observations of situation B– 33 observations of situation C
• According to En scores all of the calculated concentrations agreed with the spiked concentrations
1313
1414
Sample preparation
0%20%40%60%80%
100%120%140%160%180%
aldica
rb su
lpho
xide
aldica
rb su
lpho
ne
dem
eton-
S-met
hyl s
ulpho
xide
carb
endaz
imm
ethom
ylthi
aben
dazo
le
met
hiocar
b sulp
hoxid
e
methioc
arb su
lphon
eal
dicar
b
imaz
alil
phor
ate s
ulpho
xide
phor
ate
sulp
hone
methioc
arb
Luke QuEChERS MSPD
Luke and MSPD result in less matrix effect
1515
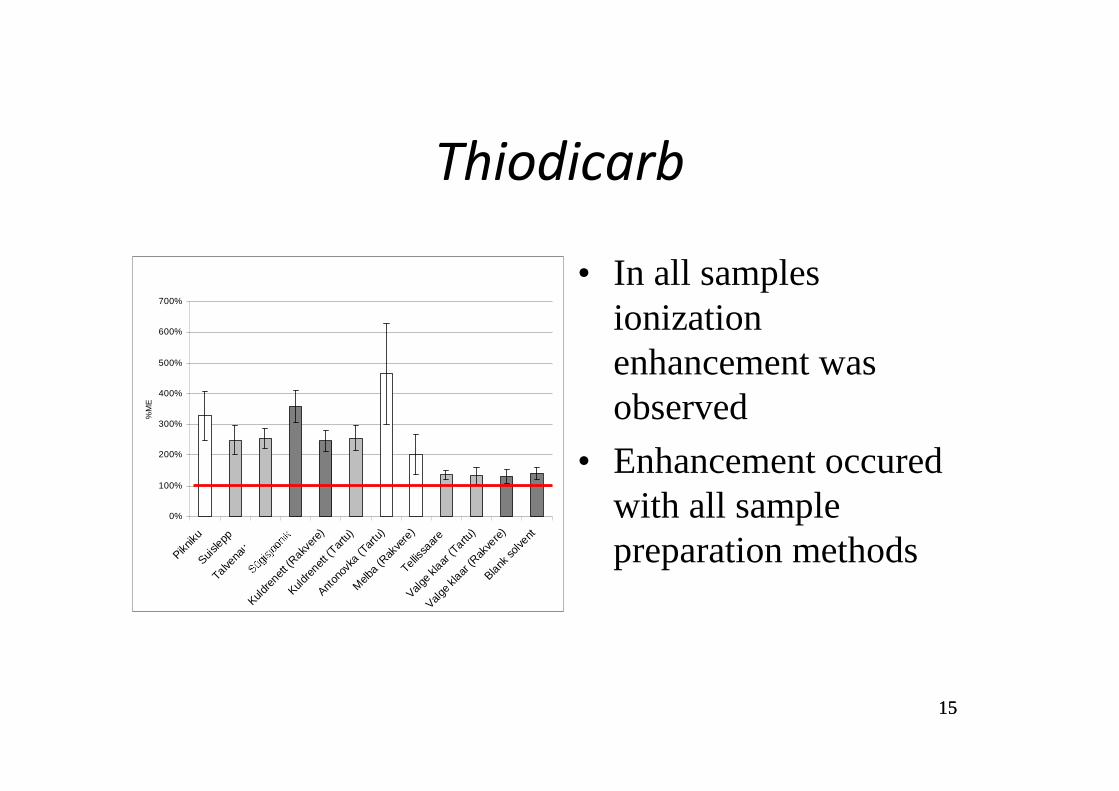
Thiodicarb
• In all samples ionization enhancement was observed
• Enhancement occured with all sample preparation methods
0%
100%
200%
300%
400%
500%
600%
700%
Pikniku
Suislepp
Talve
naudin
gKuld
rene
tt (Rakv
ere)
Kuldre
nett (T
artu)
Anton
ovka
(Tar
tu)
Melb
a (R
akve
re)
Telliss
aare
Valge k
laar (T
artu)
Valge k
laar (R
akve
re)
Blank s
olvent
%M
E
1616
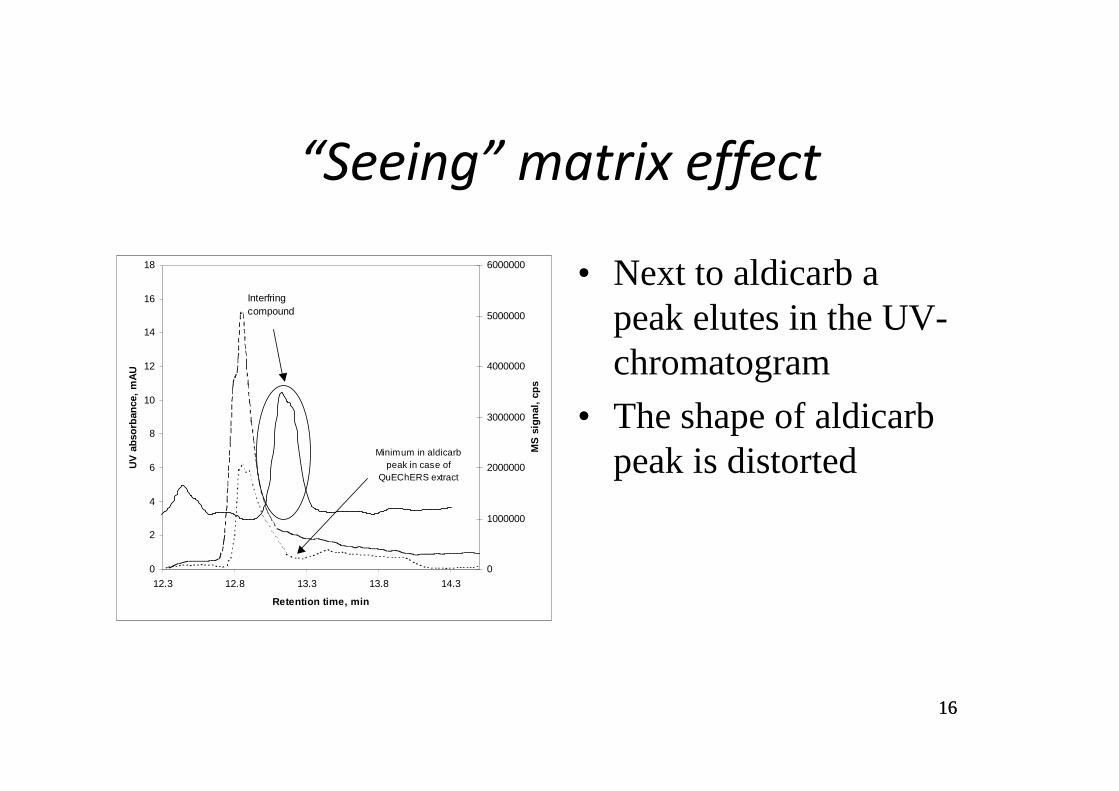
“Seeing” matrix effect
• Next to aldicarb a peak elutes in the UV-chromatogram
• The shape of aldicarb peak is distorted
0
2
4
6
8
10
12
14
16
18
12.3 12.8 13.3 13.8 14.3
Retention time, min
UV
ab
sorb
ance
, m
AU
0
1000000
2000000
3000000
4000000
5000000
6000000
MS
sig
nal
, cp
s
Minimum in aldicarb peak in case of
QuEChERS extract
Interfring compound
1717
0
50000
100000
150000
200000
250000
300000
350000
400000
450000
0% 10% 20% 30% 40% 50% 60% 70% 80% 90% 100%
%ME
UV
pea
k ar
eaCorrelation between the UV peak
and matrix effect
• Measurements are carried out at different analyte concentrations!
1818
1919
Hypothesis
• If for aldicarb a compound causing matrix effect can be seen in UV, then for other analytes such compounds may exist also– Scanned mass spectra
• Background ions
2020
Background ions
• Are always there– Solvent impurities
– Plasticizers
• Originate from the sample– Co-extracted compounds
Intensity changes due to matrix effect
May cause matrix effect
2121
Scanned Spectra
• PCA was used to select background ions varying most from standards to samplesOnion samples
Garlic samples Standards
2222
Correction of analysis results
• Background ions intensities together with analyte peak area were used in PLS regression to calculate the analyte concentration
• If low uncertainty is not needed in the analysis then matrix effect can be included as an uncertainty source
• Matrix effect graph approach
• Matrix-matched calibration
2626
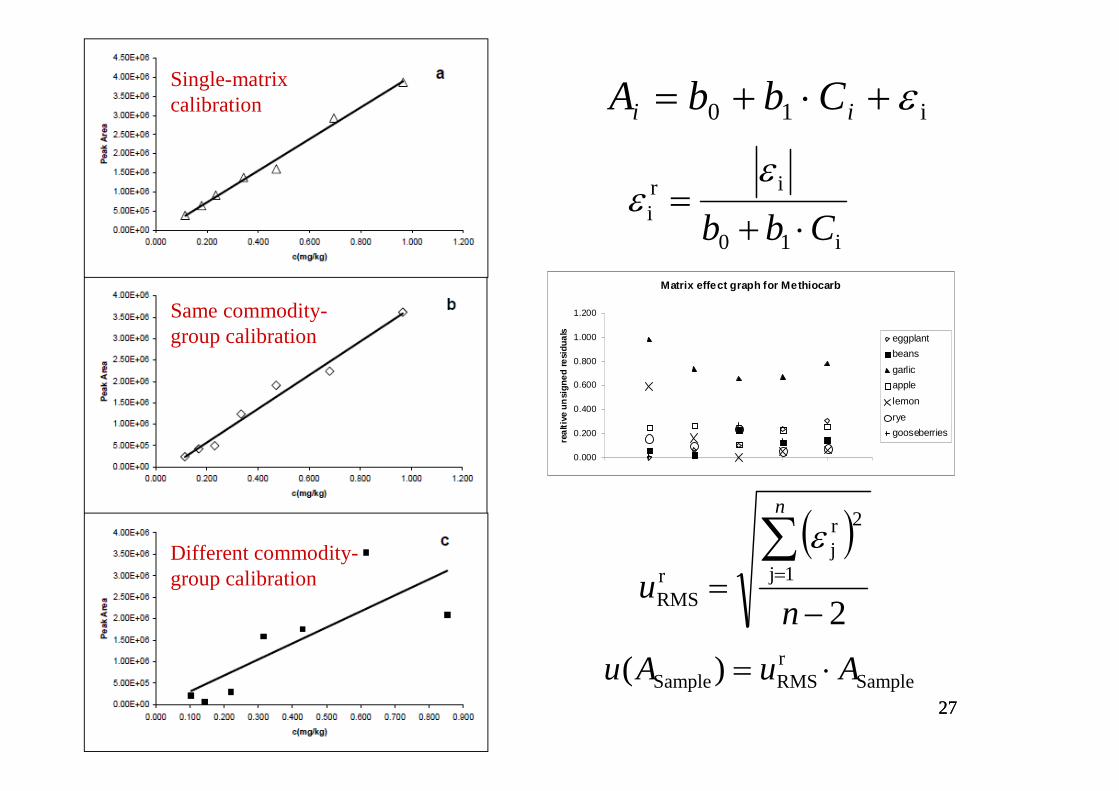
Matrix effect graph
• Each calibration solution is prepared in a different matrix– Same commodity group
– Different commodity groups
2727
Single-matrix calibration
Same commodity-group calibration
Different commodity-group calibration
i10 ε+⋅+= ii CbbA
i10
iri Cbb ⋅+=
εε
Matrix effect graph for Methiocarb
0.000
0.200
0.400
0.600
0.800
1.000
1.200
rea
ltiv
e u
nsi
gn
ed r
esi
dua
ls
eggplant
beans
garlic
apple
lemon
rye
gooseberries
( )
21j
2rj
rRMS
−=
∑=
nu
n
ε
SamplerRMSSample)( AuAu ⋅=
2828
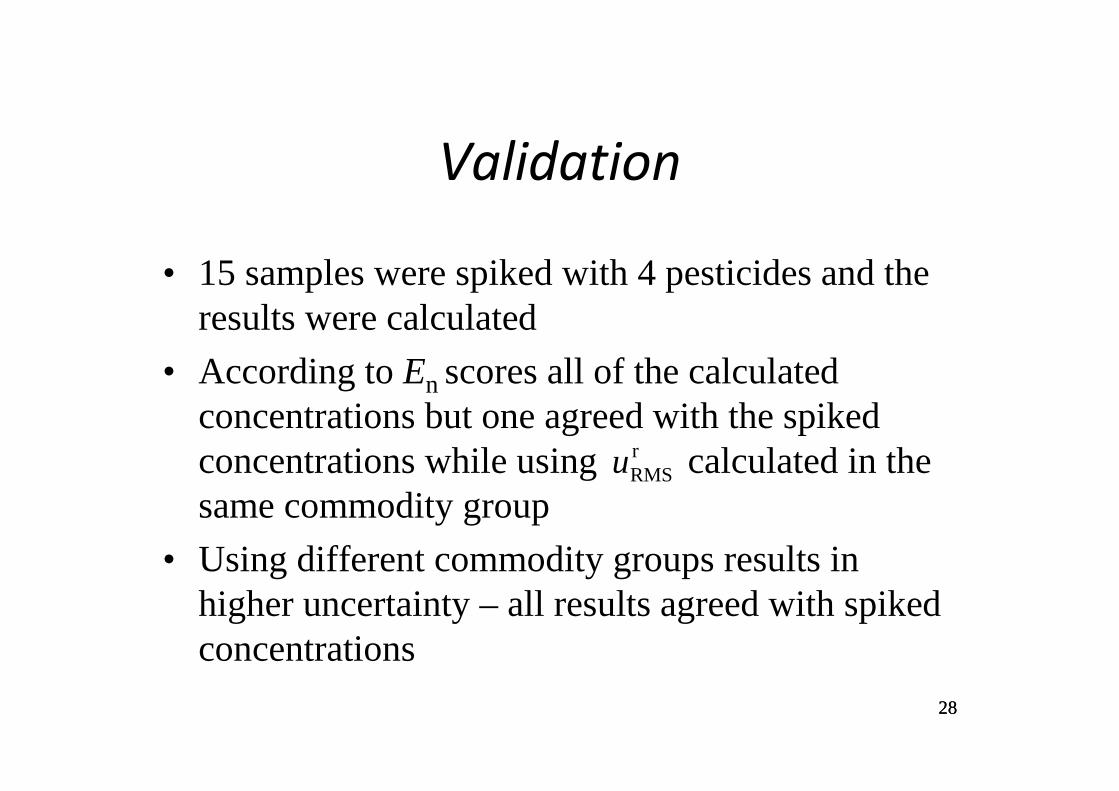
Validation
• 15 samples were spiked with 4 pesticides and the results were calculated
• According to En scores all of the calculated concentrations but one agreed with the spiked concentrations while using calculated in the same commodity group
• Using different commodity groups results in higher uncertainty – all results agreed with spiked concentrations
rRMSu
2929
3030
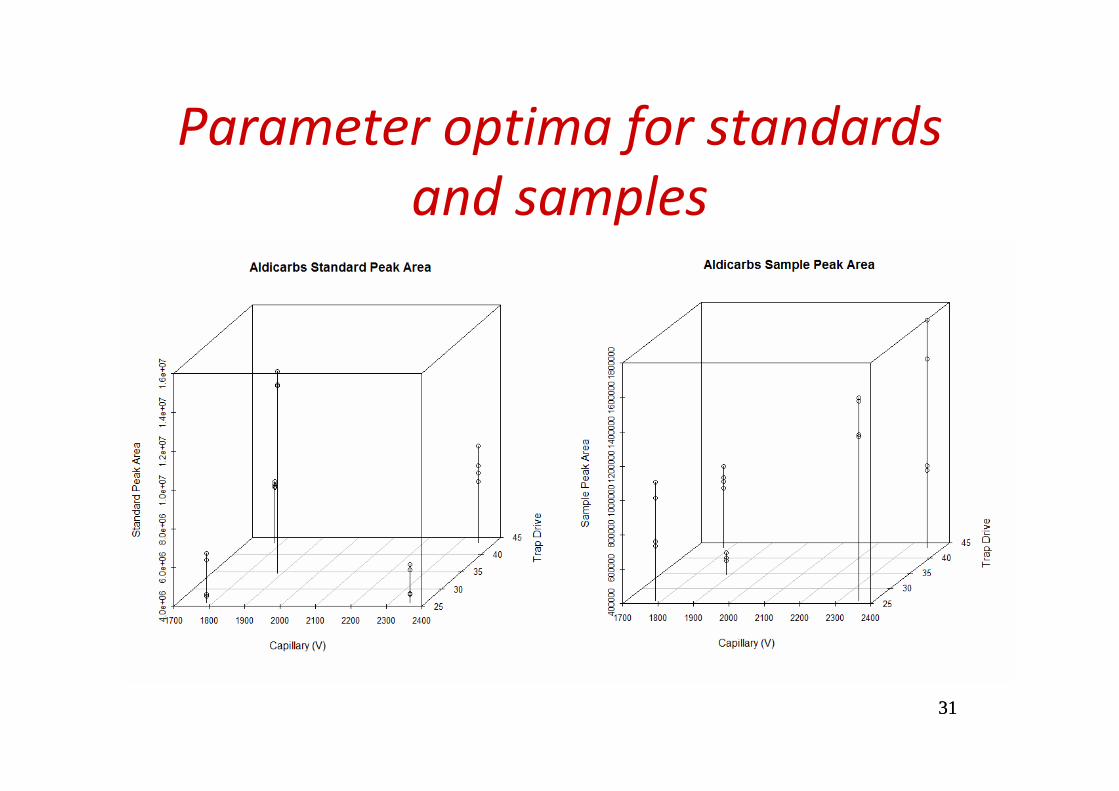
Is matrix effect dependent on
something else ... ?
• According to common understanding ... NO
• ESI parameters influence on matrix effect was studied– 3 different optimization stratagies were used
– Intensity optima and matrix effect optima do not coincide
• Matrix effect can be reduced with appropriate ESI/MS parameters
– ESI/MS parameters DO influncethe %ME
3131
Parameter optima for standards
and samples
3232
33
Summary
• Matrix effect depends on ...– ... analytes, matrices and concentrations
– ... sample preparation
• Extrapolative dilution
• Result correction via background ions
• Uncertainty calculation
• ESI/MS parameter optimization
Thank you!Ivo Koit Minu pere Riin Karin Karl Merit Triin Maris Anna Anna-Helena Olga Kaisa
Lauri GevenArtur Rain Elin Jaan Allan Lauri Signe Ivari Eva-Ingrid Erik Ester Marju
Siret Kaarel Asko HannoGert Ragne Vahur Kristo Kerli Tapio Risto