Comparison of Four Under 5 lb. Portable Oxygen Concentrators Prepared by Strategic Dynamics Inc. March 7, 2013 White Paper Disclaimer Neither Mr. Chatburn nor Mr. Williams has a retained or on-going business or clinical consulting relationship, stock ownership or other financial remuneration with any of the manufacturers mentioned in this presentation that would represent a conflict of interest. All of our work is fee-for-service and we follow a rigorous scientific protocol.
Transcript
Comparison of Four Under 5 lb.
Portable Oxygen Concentrators
Prepared by Strategic Dynamics Inc. March 7, 2013
White Paper
Disclaimer Neither Mr. Chatburn nor Mr. Williams has a retained or on-going business or clinical consulting relationship, stock ownership or other financial remuneration with any of the manufacturers mentioned in this presentation that would represent a conflict of interest. All of our work is fee-for-service and we follow a rigorous scientific protocol.
Executive Summary New, light weight (< 5 pounds), portable oxygen concentrators (POC) have been introduced for use in the home care market. POCs are complex medical devices and each manufacturer must make design trade-offs that affect performance in different ways. The purpose of this bench study was to evaluate key performance characteristics of four (4) commercially available, lightweight POCs; the Inogen One® G3 the LifeChoice ActiVoxTM (Inova Labs), the FreeStyle (CAIRE-AirSep), and the Focus (CAIRE-AirSep). All of these POCs are designed to produce oxygen at a constant minute volume as breathing frequency changes, although actual measured values did vary somewhat. A lung simulator was used to model a patient with COPD breathing at various frequencies (19 to 35 breaths/min, representing a range of normal activities of daily living from rest to exercise). This allowed evaluation of inspired oxygen concentrations under different activity levels. In addition, oxygen minute volume delivery, oxygen pulse characteristics, and oxygen purity were also measured. The study results indicate that there are important differences among these POCs. Specifically, the study highlights two important findings: First, the Inogen One® G3 delivers more oxygen than the other POCs at all
breathing frequencies due to its higher capacity of oxygen production (4 settings versus 3 or 1 for the other devices).
Second, and perhaps the most important finding, from the standpoint of clinical
application, is that oxygen delivery for all POCs in this study decreased as breathing frequency increased. For example, at a setting of 2, the inspired oxygen concentration fell from a high of 23.5% at 19 breaths/min (Inogen One® G3) to a low of 21.9% at 35 breaths/min (CAIRE-Focus).
Only the Inogen One® G3 would be able to compensate for the effects of increasing frequency. For example by increasing the setting from 2 (at 19 breaths/min) to 4 (at 35 breaths/min) it can maintain an inspired oxygen concentration of about 24%. In translating these data to potential clinical applications, the Inogen One® G3 produces more oxygen, can maintain oxygen delivery for a higher range of patient breathing rates and is therefore significantly more versatile in managing the variability of patient oxygen demand throughout different activities. Because of the wide range of performance in POCs, prior research and clinical practice guidelines suggest that all patients should be evaluated for, and titrated to the specific POC selected for their use.
Introduction A portable oxygen concentrator (POC) is comprised of a group of components that when assembled together make a portable oxygen delivery system. These components are as follows: Compressor: This is the pump, motor and cooling system. A motor operates the pump which compresses the air and provides it to the air separation sub-system. When the motor and pump are operational the heat generated must be dissipated. This is done through the cooling system. The compressor typically consumes greater than 80% of the power of the system and generates the majority of the noise and all of the vibration in the system. Sieve beds: This is the molecular separation device that removes the nitrogen from air and leaves the oxygen. The process through which this is performed is pressure swing adsorption (PSA). In PSA, ambient air is pressurized and directed through sieve beds which filter out the nitrogen and yields purified oxygen. Valves control the flow of the air to the sieve beds. Concentrators produce between 87% and 96% oxygen. Electronics: These are the printed circuit boards, sensors and the user interface. The components provide the power and logic to operate and monitor the concentrator. The POC has a variety of sensors available to monitor critical functions such as battery charge levels and battery safety, internal temperatures, internal pressures, etc. The user interface is typically the buttons or screens that the user navigates and the LEDs, alarms,
messages or icons used to provide information about routine use. Oxygen Conserving Device (OCD): An oxygen conserving device allows oxygen to be provided to the patient through a nasal cannula on demand rather than by continuous flow. As the patient begins to inhale, oxygen is delivered as a short pulse of flow begins. The delivered oxygen is conserved because the device does not deliver oxygen during exhalation. The original purpose of OCDs was to conserve liquid or compressed gas sources of oxygen. OCDs lengthen the time the patient can use a portable oxygen delivery device. POCs differ in the way in which the OCD functions with each device. Typical differences are in bolus volume delivered (pulse size), trigger sensitivity, trigger delay time and pulse delivery time. Enclosure: Most POCs use some type of hard plastic, impact resistant case. How the case is designed plays a huge role in the durability and aesthetics of the device. Accessories: These are the devices that allow the POC to be used by the oxygen dependent patient in a variety of clinical situations. Typical accessories include the following:
• AC power supply • DC power supply • Rechargeable battery • Battery charger
Common POC Characteristics All of the commercially POCs are comparable using their common characteristics:
• Size & shape: boxy, flat etc. • Weight: all under 5 pounds • Battery duration • Power supply: AC, DC and/or
battery • Oxygen production: number of
mL per breath • OCD method of operation • Flow settings available in pulse
mode • Method of movement by the
patient: carry-able with a handle or via a shoulder strap
Design tradeoffs In the development of a POC, design tradeoffs have to be made. When comparing different models of POC, consider the following major characteristics:
• Size, shape and weight • Noise • Oxygen production • OCD method of operation • Energy consumption and battery
duration • Power supply • Durability • Aesthetics
Some Considerations for Performance Testing
Oxygen Purity Portable oxygen concentrators do not produce pure oxygen. Unlike traditional liquid or compressed gas systems that deliver ≥ 99.6% oxygen, POCs are
usually designed to produce oxygen at a purity level of 90% ± 3%, although some produce higher concentrations.
Oxygen Delivery The amount of oxygen delivered to the lungs depends not only on the POC design (including the OCD) but also on the breathing pattern of the patient. One aspect of oxygen delivery is the amount of oxygen produced by the POC at any particular breathing frequency. Some POCs deliver a constant pulse volume of oxygen independent of frequency (fixed pulse volume), such that the average fraction of inspired oxygen per breath (FiO2) remains relatively constant as breath rate increases, unless the output purity drops. Other POCs deliver a constant volume of oxygen per minute (fixed minute volume), such that the pulse volume per breath decreases as frequency increases. Therefore, the FiO2 per breath delivered by these devices decreases as frequency increases (assuming that tidal volume remains constant), although purity generally remains constant. When comparing the performance of different systems, a simulator is used to model breathing at different frequencies. Using a simulator allows a fair comparison among devices because the normal variability of a human breathing subject is eliminated and test conditions can be faithfully reproduced.
Pulse Dose Performance The oxygen delivery of a POC is largely dependent on the characteristics of the pulse the OCD delivers. Key performance variables are the size and timing of the pulse as well as the sensitivity of the trigger mechanism and the ability to trigger at higher breathing
frequencies. All these factors affect the actual breath to breath fraction of inspired oxygen.
Study Purpose The purpose of this study was to measure and compare the performance of four (4) commercially available POCs in terms of their oxygen production, purity and delivery to a simulated patient as a function of breathing frequency.
Methods The following methods were used to conduct this study. They are essentially the same as those previously reported in similar work published in peer review by Chatburn and Williams.3 All of the units tested were brand new units in their original shipping boxes.
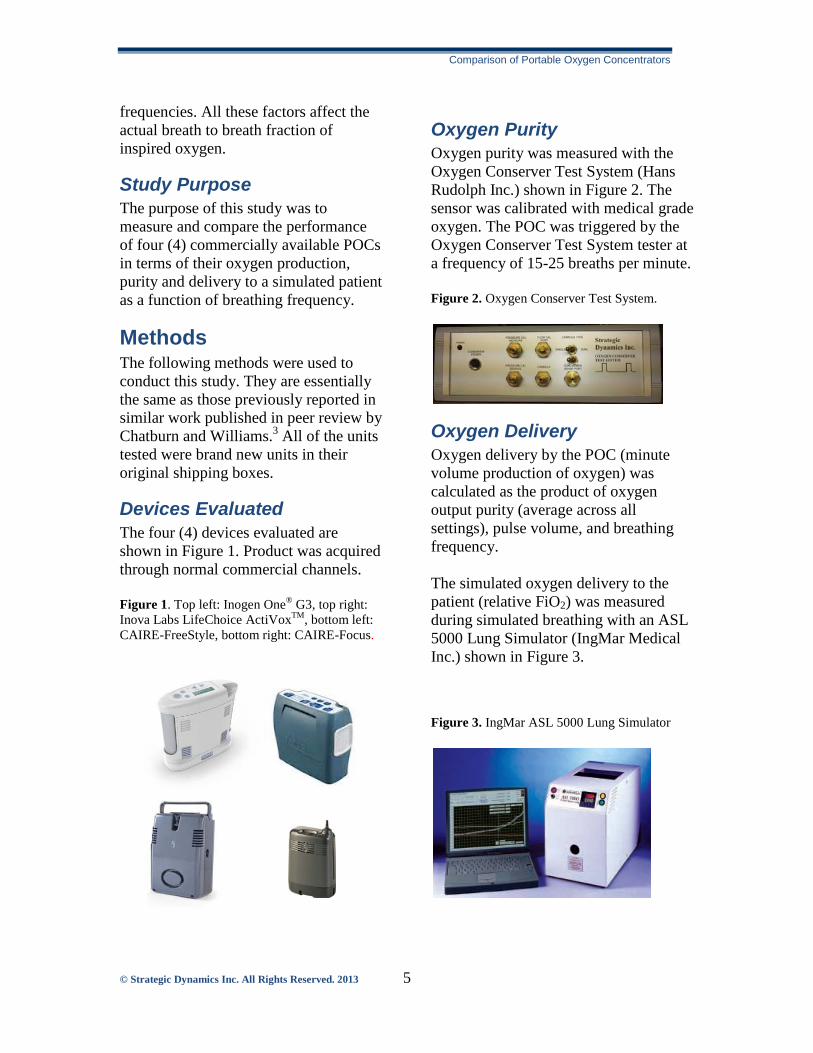
Devices Evaluated The four (4) devices evaluated are shown in Figure 1. Product was acquired through normal commercial channels. Figure 1. Top left: Inogen One® G3, top right: Inova Labs LifeChoice ActiVoxTM, bottom left: CAIRE-FreeStyle, bottom right: CAIRE-Focus.
Oxygen Purity Oxygen purity was measured with the Oxygen Conserver Test System (Hans Rudolph Inc.) shown in Figure 2. The sensor was calibrated with medical grade oxygen. The POC was triggered by the Oxygen Conserver Test System tester at a frequency of 15-25 breaths per minute. Figure 2. Oxygen Conserver Test System.
Oxygen Delivery Oxygen delivery by the POC (minute volume production of oxygen) was calculated as the product of oxygen output purity (average across all settings), pulse volume, and breathing frequency. The simulated oxygen delivery to the patient (relative FiO2) was measured during simulated breathing with an ASL 5000 Lung Simulator (IngMar Medical Inc.) shown in Figure 3. Figure 3. IngMar ASL 5000 Lung Simulator
Relative FiO2 was measured as the concentration of oxygen inside the lung simulator (in percent). Breathing frequency was varied from 19-35 breaths per min. The POC was connected to an artificial nose with a standard adult nasal cannula. The nose was machined from a block of aluminum (Figure 4). Figure 4. Artificial nose with nasal cannula.
The term relative oxygen concentration indicates a quantitative value used to compare the relative amount of oxygen delivered to the simulator. There are no published data to determine how relative oxygen concentration during simulation compares to actual values in a human. However, the steady state oxygen reading inside the simulator should be very close to the inspired oxygen fraction during human breathing; the dilution of the oxygen pulse with room air in a single inspiration by a human should be the same as that with the simulator. The only difference would be that in a human, the first portion of inspiration, from the anatomical dead space, would contain alveolar gas and thus have a slightly lower oxygen concentration than simulated alveolar gas (which is not subject to oxygen loss from respiration within the lung). Thus, relative oxygen concentration in the simulator may be very slightly higher than actual values during oxygen therapy in a human. Nevertheless, studies in the
literature have assumed equivalence of simulated and actual oxygen concentrations.4,5 Values for relative concentration were calculated using the Post Run Analysis utility of the lung simulator. Mean values were calculated for 5 breaths after a stabilization period of 25-50 breaths.
Lung Simulator Settings All test conditions, measurements and parameter calculations were performed with the IngMar ASL 5000 lung simulator, software version 3.3. The lung simulator was configured to simulate a patient with chronic obstructive pulmonary disease based on data from the literature.6-11 Breathing frequencies used ranged from 19 per minute (resting) to 35 (exercise). Tidal volume varied slightly from 690 mL (resting) to 720 mL (exercise).
Pulse Characteristics Pulse characteristics were measured with the Automated Test System for Oxygen Conserving Devices (Integrated Control Systems, Inc.) This device is comprised of a pressure sensor, a flow sensor, data acquisition hardware and signal processing software. The hardware also includes a small audio speaker that can be controlled by the software to generate a pressure signal used to trigger the oxygen pulse from the POCs (simulated breathing frequencies from 19-35 per minute). The software can save digitized oxygen flow waveforms as well as calculate the following performance variables: Trigger pressure (cm H2O) – pressure to the OCD is ramped below atmospheric pressure until it triggers a pulse. The pressure drop just before flow begins is
recorded as trigger pressure and interpreted as POC sensitivity. Pulse volume (mL) – the OCD is triggered with a sharp square wave vacuum signal to ensure triggering. The trigger signal is turned off when flow or pressure begins to rise in response to the triggered oxygen pulse. The flow signal is integrated over the pulse time to give the pulse volume. Pulse time (ms) – the time in milliseconds from the beginning of the pulse flow to the time that flow begins to fall after the peak. Pulse delay (ms) – the time in milliseconds from the beginning of the negative pressure signal until pulse flow begins.
Data Analysis The ASL 5000 post run analysis software was used to the mean value of ten (10) consecutive breaths at each setting. Data presented in graphs are mean values.
Results
Oxygen Purity Table 1 shows the oxygen purity specifications provided by the manufacturers. Table 2 shows the measured values from frequency 15 to 25 breaths/min at each device’s maximum setting. Table 1. Output oxygen concentration. Specified
Oxygen Delivery A major factor in the differences in oxygen delivery among the devices is that they produce varying amounts of oxygen and have different ranges of settings (e.g., the CAIRE-Focus has only 1 setting and the Inogen One® G3 has 4 settings. The CAIRE Free Style and the LifeChoice ActiVoxTM has 3 settings.)
Minute Volume Oxygen delivery (a function of both oxygen purity and the minute volume of gas from the POC) is shown in Figure 5. Oxygen delivery was highest for the Inogen One® G3.
Relative FiO2 Figure 6 shows the simulated FiO2 results expressed as inspired oxygen concentration in percent. There were significant differences among the devices.
There were no clinically important differences in inspired oxygen concentration among the POCs at settings of 1 or 2 averaged across all frequencies. At a setting of 1, the values ranged from 21.6% to 21.9%. At a setting of 2, the values ranged from 22.3% to 22.9%. At a setting of 3, the Inogen One® G3 produced 0.6% more oxygen than the FreeStyle and 0.9% more than the LifeChoice ActiVoxTM. At a setting of 4, the Inogen One® G3 delivered a maximum of 26.5% at a frequency of 19 breaths/min. None of the other devices had a setting of 4. Figure 7 compares POC performance for all frequencies at a setting of 2, the one most commonly observed in home use. Figure 7. Comparison of POCs at setting 2.
Pulse Waveforms The differences in oxygen delivery can be explained by the pulse characteristics. This is the way the gas is delivered to the patient. In general, the larger the pulse volume and the shorter the pulse time (i.e., the higher the pulse flow) the better the oxygen delivery. Pulse flow
waveforms (Figures 8-11) were collected at a breath rate of 15/min.
Inogen One® G3 The Inogen One® G3 is designed to produce a maximum of 840 mL per minute and has four (4) settings. Peak flow increased as setting increased, ranging from about 7-20 L/min (Figure 8). It appears that increasing the setting increases both the average peak flow and the pulse time. However, the waveforms (and hence pulse volumes) were inconsistent at each setting.
LifeChoice ActiVoxTM The LifeChoice ActiVoxTM is designed to produce a maximum of 450 mL per minute and has three (3) settings. Peak flow increases marginally with setting increase, ranging from 4-5 L/min (Figure 9).
CAIRE-FreeStyle The CAIRE-Free Style is designed to produce a maximum of 480 mL per minute and has three (3) settings. Both flow and pulse time increased as the setting increased, ranging from about 4-6 L/min (Figure 10). Pulse time also increased slightly as the setting increased.
CAIRE-Focus The CAIRE-Focus is designed to produce a maximum of 380 mL per minute and has only one setting, intended to be equivalent to a continuous flow of 2 L/min of pure oxygen (Figure 11). The peak flow was approximately 5 L/min and appeared virtually identical to the setting of 2 on the CAIRE FreeStyle POC.
Pulse Volume Pulse volumes as a function of breath frequency and setting are shown in Figure 12. The figures show that all the POCs reduce the pulse volume as the breathing frequency increases, indicating that they are classified as “constant minute volume devices”. Note, however, that actual minute volume production of oxygen does vary somewhat. In particular, it drops noticeably for the ActiVoxTM at rates above 25 breaths/min (see Figure 5).
Timing and Sensitivity Pulse times are shown in Figure 13. Pulse delay and trigger sensitivity are shown in Table 3. Note that the Inogen One® G3 would not trigger with a sharp pressure pulse (required to calculate pulse delay). Table 3. Pulse delay and sensitivity.
Trigger
Pressure Delay
Device (cm H2O) (ms) Inogen One ® G3 0.14 NA LifeChoice 0.26 28.50 FreeStyle 0.06 59.33 Focus 0.10 61.75
Oxygen Purity All POCs deliver pulses of oxygen at lower concentrations than compressed gas or liquid systems. Therefore, the higher the oxygen purity delivered by a POC, the more comparable the treatment will be with these systems.
Oxygen Delivery All of the POCs are designed to produce a relatively constant minute volume of oxygen as breathing frequency changes. FiO2 decreased as simulated breathing frequency and tidal volume increased (from rest to exercise). As the simulated patient minute ventilation increased with frequency, the ratio of oxygen (from the POC) to entrained air decreased, thus decreasing oxygen delivery to the lung simulator. This is expected to happen with constant flow devices (e.g., nasal cannulas connected to flow meters) and POCs that deliver a constant minute volume of oxygen. It may also happen with POCs that deliver constant pulse volumes if the increase in minute ventilation of the patient is proportionally greater than the increase in minute volume of oxygen.
Pulse Waveforms Pulse timing and peak flow differed greatly among the devices with the Inogen One® G3 having the highest pulse flows and shortest pulse times. All of the POC’s had total delivery times (pulse time plus delay) less than 70% of inspiratory time (i.e., the critical window for delivering the pulse of oxygen into the lung versus the anatomical dead space). Inspiratory times for the lung
model ranged from 700 ms (35 breaths per minute) to 1,100 ms (19 breaths per minute). Therefore, none of the total delivery times were long enough to adversely affect the relative oxygen concentration under simulated breathing conditions.
Trigger Pressure and Pulse Delay In order for the oxygen conserving device (OCD) built into a POC to function properly, it must sense when the patient inspires. When a patient wears a nasal cannula attached to the OCD, inspiration causes a slight pressure drop. This pressure drop is sensed as “trigger pressure” by the OCD. If the drop is large enough, the OCD responds by delivering a pulse of oxygen. The sensitivity of the OCD is determined by the trigger pressure; the less negative the trigger pressure (i.e., the smaller the pressure drop), the more sensitive the OCD. Generally, the more sensitive the OCD, the less likely it is that the device will fail to trigger when the patient inspires. On the other hand, if the sensitivity is too high, the device will auto-trigger (i.e., trigger without a patient inspiration). Sensitivity is important because it can affect the oxygen delivered to the patient. If the sensitivity is too low, the OCD will miss patient efforts and the oxygen delivery will decrease. If the sensitivity is too high, the OCD will auto-trigger and oxygen delivery may be too high. In either case, the OCD is said to be “asynchronous” or “out of sync” with patient effort and oxygen delivery will be unpredictable. Another concern about sensitivity is that when patients sleep, they usually have
slower and shallower breathing. This means that the pressure they generate in the nasal cannula on inspiration may be below the OCD trigger pressure threshold and they may not get enough oxygen. The sensitivity for all devices ranged from 0.1 to 0.26 cm H2O. All the devices triggered reliably at all frequencies.
Conclusions This study highlights two important findings: First, the Inogen One® G3 produces and delivers more oxygen than the other POCs at all breathing frequencies, and has a higher range of settings (4 versus 3 or 1 for the other devices). Second, and perhaps the most important finding from the standpoint of clinical application, is that oxygen delivery for all POCs in this study decreased as breathing frequency increased. For example, at a setting of 2, the inspired oxygen concentration fell from a high of 23.5% at 19 breath per minute (Inogen One® G3) to a low of 21.9% at 35 breaths/min (CAIRE-Focus). Only the Inogen One® G3 would be able to compensate for this by increasing the setting from 2 (at 19 breaths/min) to 4 (at 35 breaths/min) to maintain an inspired oxygen concentration of about 24%.
References 1. Hagarty EM, Skorodin MS, Langbein WE, Hultman CI, Jessen JA and Maki KC.
Comparison of Three Oxygen Delivery Systems During Exercise in Hypoxemic Patients with Chronic Obstructive Pulmonary Disease. Am J. Resp Crit Care Med Vol 155: 893-898, 1997.
2. AARC Clinical Practice Guideline. Respir Care 2007 Vol 52(1):1063-1068
3. Chatburn RL, Williams TJ. Performance comparison of 4 portable oxygen concentrators. Respir Care. 2010; 55(4):433-442.
4. Bliss PL, McCoy RW, Adams AB. A bench study comparison of demand oxygen delivery systems and continuous flow oxygen. Respir Care 1999; 44(8):925–931.
5. Bliss PL, McCoy RW, Adams AB. Characteristics of demand oxygen delivery systems: Maximum output and setting recommendations. Respir Care 2004; 49(2):160-165.
6. O'Donnell DE, Sanii R, Giesbrecht G, Younes M. Effect of continuous positive airway pressure on respiratory sensation in patients with chronic obstructive pulmonary disease during submaximal exercise. Am Rev Respir Dis. 1988 Nov;138(5):1185-91.
7. O'Donnell DE, Sanii R, Anthonisen NR, Younes M. Expiratory resistive loading in patients with severe chronic air-flow limitation. An evaluation of ventilatory mechanics and compensatory responses. Am Rev Respir Dis. 1987 Jul;136(1):102-7.
8. O’Donnell DE, Sani R, Younes M. Improvement in exercise endurance in patients with chronic airflow limitation using continuous positive airway pressure. Am Rev Respir Dis 1989;138:1510-1514.
9. Porta R, Appendini L, Vitacca M, Bianchi L, Donner C, Poggi R, Ambrosino N. Mask proportional assist versus pressure support in clinically stable condition with chronic ventilatory failure. Chest 2002;122:479-488.
10. Kondili E, Alexopoulou C, Prinianakis G, Xirouchaki N, Georgopoulos D. Pattern of lung emptying and expiratory resistance in mechanically ventilated patients with chronic obstructive pulmonary disease. Intensive Care Med. 2004;30(7):1311-8
11. Tassaux D, Gainnier M, Battisti A, Jolliet P. Impact of expiratory trigger setting on delayed cycling and inspiratory muscle workload. Am J Respir Crit Care Med. 2005 Nov 15;172(10):1283-9.
About Strategic Dynamics Inc. Strategic Dynamics Inc. is a sales and marketing performance improvement company. The firm’s specialty is health care. They work with clients to align strategy, people, process, technology and tools around customers in order to accelerate revenue generation. Strategic Dynamics provides a range of services that includes: strategic planning, market research and analysis, market strategy, sales management support and sales training to clients. The firm has represented the nationally renowned “Sales Performance Company: Miller Heiman” for 12 years. The company is getting ready to launch a workshop series entitled “Selling within Hospitals: Business AcumenTM. The program will be available with and without a sales simulation. The firm also owns and operates a clinical test lab where they routinely perform bench studies of medical equipment. Strategic Dynamics Inc. has provided bench testing services to many of the major equipment manufacturers in the world. The majority of their business is from repeat clients that have learned from experience to trust their work for accuracy, completeness and repeatability. They have published numerous papers in peer review journals, presented abstracts or posters at major professional meetings and developed white papers for use by clients’ sales organizations.