Comparison of imaging geometries for diffuse optical tomography of tissue Brian W. Pogue, Troy O. McBride, Ulf L. Osterberg and Keith D. Paulsen Thayer School of Engineering, Dartmouth College, Hanover NH [email protected]Abstract: Images produced in six different geometries with diffuse optical tomography simulations of tissue have been compared using a finite element-based algorithm with iterative refinement provided by the Newton- Raphson approach. The source-detector arrangements studied include (i) fan-beam tomography, (ii) full reflectance and transmittance tomography, as well as (iii) sub-surface imaging, where each of these three were examined in a circular and a flat slab geometry. The algorithm can provide quantitatively accurate results for all of the tomographic geometries investigated under certain circumstances. For example, quantitatively accurate results occur with sub-surface imaging only when the object to be imaged is fully contained within the diffuse projections. In general the diffuse projections must sample all regions around the target to be characterized in order for the algorithm to recover quantitatively accurate results. Not only is it important to sample the whole space, but maximal angular sampling is required for optimal image reconstruction. Geometries which do not maximize the possible sampling angles cause more noise artifact in the reconstructed images. Preliminary simulations using a mesh of the human brain confirm that optimal images are produced from circularly symmetric source-detector distributions, but that quantitatively accurate images can be reconstructed even with a sub-surface imaging, although spatial resolution is modest. 1999 Optical Society of America OCIS code: (110.6960) Tomography, (170.3660) Light propagation in tissues, (170.3010) Image reconstruction techniques, (100.3190) Inverse Problems References and links 1. M. Cope, and D. T. Delpy, "System for long-term measurement of cerebral blood and tissue oxygenation on newborn infants by near-infrared transillumination," Med. Biol. Eng. Comp. 26, 289-294 (1988). 2. B. Chance, Q. Luo, S. Nioka, D. C. Alsop and J. A. Detre, "Optical investigations of physiology: a study of intrinsic and extrinsic biomedical contrast," Phil. Trans. R. Soc. Lond. B 352, 707-716 (1997). 3. M. A. Franceschini, K. T. Moesta, S. Fantini, G. Gaida, E. Gratton, H. Jess, H., W. W. Mantulin, M. Seeber, P. Schlag and M. Kaschke, "Frequency-domain techniques enhance optical mammography: initial clinical results," Proc. Nat. Acad. Sci USA 94, 6468-73 (1997). 4. S. R. Arridge and M. Schweiger, "Sensitivity to prior knowledge in optical tomographic resconstruction," Proc. SPIE 2389, 378-388 (1995). 5. V. Ntziachristos, M. O‚Leary, B. Chance and A. G. Yodh, "Coregistration of images from diffusive wave with other imaging modalities to enhance specificity," in OSA TOPS on Advances in Optical Imaging and Photon Migration II. (OSA publications, Orlando, FL, 1996). 6. J. Chang, H. Graber, P. Koo, R. Aronson, S. S. Barbour, R. L. Barbour, "Optical imaging of anatomical maps derived from magnetic resonance images using time independent optical sources," IEEE Trans. Med. Imag. 16, 68-77 (1997). 7. B. W. Pogue and K.D. Paulsen, "High resolution near infrared tomographic imaging simulations of rat cranium using apriori MRI structural information," Opt. Lett. 23, 1716-8 (1998). 8. C. L. Hutchinson, J.R. Lakowicz, and E.M. Sevick-Muraca, "Fluorescence lifetime-based sensing in tissues: a computational study," Biophys. J. 68, 1574-1582 (1995). 9. J. Chang, H.L. Graber, and R.L. Barbour, "Luminescence optical tomography of dense scattering media," J. Opt. Soc. Am. A 14, 288-99 (1998). 10. S. R. Arridge, "Forward and inverse problems in time-resolved infrared imaging," in Medical Optical Tomography: Functional Imaging and Monitoring, Ed. G. Muller, (SPIE Optical Eng. Press, Bellingham, WA, 1993) pp. 35-64. (C) 1999 OSA 12 April 1999 / Vol. 4, No. 8 / OPTICS EXPRESS 270 #9194 - $15.00 US Received March 02, 1999; Revised April 09, 1999
Transcript
Comparison of imaging geometries for
diffuse optical tomography of tissueBrian W. Pogue, Troy O. McBride, Ulf L. Osterberg and Keith D. Paulsen
Thayer School of Engineering, Dartmouth College, Hanover [email protected]
Abstract: Images produced in six different geometries with diffuse opticaltomography simulations of tissue have been compared using a finiteelement-based algorithm with iterative refinement provided by the Newton-Raphson approach. The source-detector arrangements studied include (i)fan-beam tomography, (ii) full reflectance and transmittance tomography, aswell as (iii) sub-surface imaging, where each of these three were examinedin a circular and a flat slab geometry. The algorithm can providequantitatively accurate results for all of the tomographic geometriesinvestigated under certain circumstances. For example, quantitativelyaccurate results occur with sub-surface imaging only when the object to beimaged is fully contained within the diffuse projections. In general thediffuse projections must sample all regions around the target to becharacterized in order for the algorithm to recover quantitatively accurateresults. Not only is it important to sample the whole space, but maximalangular sampling is required for optimal image reconstruction. Geometrieswhich do not maximize the possible sampling angles cause more noiseartifact in the reconstructed images. Preliminary simulations using a meshof the human brain confirm that optimal images are produced fromcircularly symmetric source-detector distributions, but that quantitativelyaccurate images can be reconstructed even with a sub-surface imaging,although spatial resolution is modest.1999 Optical Society of AmericaOCIS code: (110.6960) Tomography, (170.3660) Light propagation in tissues,(170.3010) Image reconstruction techniques, (100.3190) Inverse Problems
References and links1. M. Cope, and D. T. Delpy, "System for long-term measurement of cerebral blood and tissue oxygenation on newborn
infants by near-infrared transillumination," Med. Biol. Eng. Comp. 26, 289-294 (1988).2. B. Chance, Q. Luo, S. Nioka, D. C. Alsop and J. A. Detre, "Optical investigations of physiology: a study of intrinsic
and extrinsic biomedical contrast," Phil. Trans. R. Soc. Lond. B 352, 707-716 (1997).3. M. A. Franceschini, K. T. Moesta, S. Fantini, G. Gaida, E. Gratton, H. Jess, H., W. W. Mantulin, M. Seeber, P.
Schlag and M. Kaschke, "Frequency-domain techniques enhance optical mammography: initial clinical results," Proc.Nat. Acad. Sci USA 94, 6468-73 (1997).
4. S. R. Arridge and M. Schweiger, "Sensitivity to prior knowledge in optical tomographic resconstruction," Proc. SPIE2389, 378-388 (1995).
5. V. Ntziachristos, M. O‚Leary, B. Chance and A. G. Yodh, "Coregistration of images from diffusive wave with otherimaging modalities to enhance specificity," in OSA TOPS on Advances in Optical Imaging and Photon Migration II.(OSA publications, Orlando, FL, 1996).
6. J. Chang, H. Graber, P. Koo, R. Aronson, S. S. Barbour, R. L. Barbour, "Optical imaging of anatomical mapsderived from magnetic resonance images using time independent optical sources," IEEE Trans. Med. Imag. 16, 68-77(1997).
7. B. W. Pogue and K.D. Paulsen, "High resolution near infrared tomographic imaging simulations of rat craniumusing apriori MRI structural information," Opt. Lett. 23, 1716-8 (1998).
8. C. L. Hutchinson, J.R. Lakowicz, and E.M. Sevick-Muraca, "Fluorescence lifetime-based sensing in tissues: acomputational study," Biophys. J. 68, 1574-1582 (1995).
9. J. Chang, H.L. Graber, and R.L. Barbour, "Luminescence optical tomography of dense scattering media," J. Opt. Soc.Am. A 14, 288-99 (1998).
10. S. R. Arridge, "Forward and inverse problems in time-resolved infrared imaging," in Medical Optical Tomography:Functional Imaging and Monitoring, Ed. G. Muller, (SPIE Optical Eng. Press, Bellingham, WA, 1993) pp. 35-64.
(C) 1999 OSA 12 April 1999 / Vol. 4, No. 8 / OPTICS EXPRESS 270#9194 - $15.00 US Received March 02, 1999; Revised April 09, 1999
11. D. Boas, "A fundamental limitation of linearized algorithms for diffuse optical tomography," Opt. Express 1, 404-413 (1997). (http://epubs.osa.org/oearchive/source/2831.htm)
12. H. Jiang, K. D. Paulsen, U. L. Osterberg and M. S. Patterson, "Frequency-domain optical image reconstruction inturbid media: an experimental study of single-target detectability," Appl. Opt. 36, 52-63 (1997).
13. H. Jiang, K. D. Paulsen, U. L. Osterberg, and M. S. Patterson, "Frequency-domain optical image reconstruction forbreast imaging: initial evaluation in multi-target tissue-like phantoms," Med. Phys. 25, 183-193 (1997).
14. B. W. Pogue, M. Testorf, U. L. Osterberg and K. D. Paulsen, "Instrumentation and design of a frequency-domaindiffuse optical tomography imager for breast cancer detection," Opt. Express 1, 391-403 (1997).(http://epubs.osa.org/oearchive/source/2827.htm)
15. B. W. Pogue, T. O. McBride, J. Prewitt, U. L. Osterberg, and K. D. Paulsen, "Spatially variant regularizationimproves diffuse optical tomography," Appl. Opt. 38, (in press) 1999.
16. T. O. McBride, B. W. Pogue, E. Gerety, S. Poplack, U. L. Osterberg, and K. D. Paulsen, "Spectroscopic diffuseoptical tomography for quantitatively assessing hemoglobin concentration and oxygenation in tissue," (submitted,1999), .
17. M. S. Patterson, B. Chance and B. C. Wilson, "Time resolved reflectance and transmittances for the non-invasivemeasurement of tissue optical properties," Appl. Opt. 28, 2331-2336 (1989).
18. S. R. Arridge, M. Cope and D. T. Delpy, "The theoretical basis for the determination of optical pathlengths in tissue:temporal and frequency analysis," Phys. Med. Biol. 37, 1531-1560 (1992).
19. A. H. Gandjbakhche, V. Chernomordik, R.F. Bonner, J. C. Hebden, R. Nossal, "Use of time-dependent contrastfunctions to discriminate between the scattering and absorption properties of abnormal regions hidden within a tissue-like phantom," Proc. SPIE 2979, 211-225 (1997).
20. J. A. Moon, R. Mahon, M. D. Duncan and J. Reintjes, "Resolution limits for imaging through turbid media withdiffuse light," Opt. Lett. 18, 1591-1593 (1993).
21. A. H. Gandjbakhche, R. Nossal and R. F. Bonner, "Resolution limits for optical transillumination of abnormalitiesdeeply embedded in tissues," Med. Phys. 21, 185-91 (1994).
22. D. A. Boas, M. A. O'Leary, B. Chance and A. G. Yodh, "Detection and characterization of optical inhomogeneitieswith diffuse photon density waves: a signal-to-noise analysis," Appl. Opt. 36, 75-92 (1997).
23. H. Jess, H. Erdl, T. Moesta, S. Fantini, M. A. Francecshini, E. Gratton and M. Kaschke, "Intensity modulated breastimaging: Technology and clinical pilot study results," Adv. in Optical Imaging and Photon Migration. (OSApublications, Orlando, FL, 1996).
24. S. Fantini, O. Schutz, J. Edler, M. A. Franceschini, S. Heywang-Krbrunner, L. Gotz and H. Siebold, "Performance ofN-Images and spectral features in frequency-domain optical mammography," SPIE Technical Abstract Digest. (SPIEPress, San Jose, CA, 1999).
25. Y. Painchaud, A. Mailloux, E. Harvey, S. Verrault, J. Frechette, C. Gilbert, M. L. Vernon and P. Beaudry, "Multi-port time-domain laser mammography: results on solid phantoms and volunteers," SPIE BiOS Technical AbstractDigest. (SPIE Press, San Jose, CA, 1999).
26. J. P. Van Houten, D. A. Benaron, S. Spilman and D. K. Stevenson, "Imaging brain injury using time-resolved nearinfrared light scanning," Pediat. Res. 39, 470-6 (1996).
27. M. R. Stankovic, A. Fujii, D. Maulik and D. Boas, "Optical monitoring of cerebral hemodynamics and oxygenationin the neonatal piglet," J. Matern-Fetal Inves. 8, 71-8 (1998).
28. A. Siegel, J. Marota, J. Mandeville, B. Rosen, and D. Boas, "Diffuse optical tomography of rat brain function," inSPIE Technical Abstract Digest. (SPIE Press, San Jose, CA, 1999).
29. S. Fantini, S. Walker, M. A. Franceschini, M. Kaschke, P. M. Schlag and K. T. Moesta, "Assessment of the size,position, and optical properties of breast tumors in vivo by noninvasive optical methods," Appl. Opt. 37, 1982-89(1998).
30. V. Quaresima, S. J. Matcher and M. Ferrari, "Identification and quantification of intrinsic optical contrast for near-infrared mammography," Photochem. Photobiol. 67, 4-14 (1998).
31. X. Li, J. Culver, J., T. Durduran, B. Chance, A. G. Yodh and D. N. Pattanayak, "Diffraction tomography withdiffuse-photon density waves: clinical studies and background subtraction," in Advances in Optical Imaging andPhoton Migration. (OSA publications, Orlando, FL, 1993).
32. S. B. Colak, D. G. Papaioannou, G. W. t'Hooft, M. B. van der Mark, H. Schomberg, J. C. J. Paasschens, J. B. M.Melissen and N. A. A. J. van Asten, "Tomographic image reconstruction from optical projections in light-diffusingmedia," Appl. Opt. 36, 180-213 (1997).
33. S. R. Arridge and M. Schwieger, "Gradient-based optimisation scheme for optical tomography," Opt. Exp. 2, 212-226 (1998). (http://epubs.osa.org/oearchive/source/4014.htm)
34. B. J. Tromberg, O. Coquoz, J. B. Fishkin, T. Pham, E. R. Anderson, J. Butler, M. Cahn, J. D. Gross, V. Venugopalanand D. Pham, "Non-invasive measurements of breast tissue optical properties using frequency-domain photonmigration," Phil. Trans. R. Soc. Lond. B. 352, 661-668 (1997).
35. S. R. Arridge and M. Schweiger, "Inverse methods for optical tomography," in Information Processing in MedicalImaging (Springer-Verlag, Flagstaff, AZ, 1993).
36. K. D. Paulsen and H. Jiang "Spatially varying optical property reconstruction using a finite element diffusionequation approximation," Med. Phys. 22, 691-701 (1995).
37. S. R. Arridge and M. Schweiger, "Image reconstruction in optical tomography," Phil. Trans. R. Soc. Lond. B. 352,717-726 (1997).
38. A. Neumaier, "Solving ill-conditioned and singular linear systems: a tutorial on regularization," SIAM Rev. 40, 636-666 (1998).
(C) 1999 OSA 12 April 1999 / Vol. 4, No. 8 / OPTICS EXPRESS 271#9194 - $15.00 US Received March 02, 1999; Revised April 09, 1999
39. T. J. Yorkey, J. G. Webster and W. J. Tompkins, "Comparing reconstruction algorithms for electrical impedancetomography," IEEE Trans. Biomed. Eng. 34, 843-852 (1987).
40. B. W. Pogue, T. O. McBride, C. Nwaigwe, U. L. Osterberg, J. F. Dunn, K. D. Paulsen, “Near-infrared diffusetomography with apriori MRI structural information: testing a hybrid image reconstruction methodology withfunctional imaging of the rat cranium,” Proc. SPIE 3597 (in press), (1999).
1. IntroductionDiffuse Optical Tomography (DOT) imaging of tissue is emerging as a viable method fornon-invasively determining hemoglobin concentration, hemoglobin oxygen saturation,cytochromes, lipids and water in vivo on a centimeter spatial scale. In the past decade,promising applications have emerged in areas such as neonatal and adult cerebralmonitoring [1, 2] and breast cancer diagnosis [3]. In addition, DOT may be even morepromising when combined with traditional imaging methods [4-7] or when coupled toexogenous contrast agents to monitor tissue function, either through fluorescence orabsorption based imaging [2, 8, 9]. One of the limitations in this field of research has beenthat the rapid advances in technological instrumentation have eclipsed the development ofaccurate image reconstruction algorithms for diffuse tomography. In this study we focus onone particularly useful image reconstruction algorithm, and apply it in several differentimaging configurations in order to evaluate how the source-detector-tissue geometry affectsthe resulting image.
The use of an appropriate reconstruction algorithm is important because the inverseproblem for DOT is inherently ill-posed, and in many cases is ill-conditioned [10], so thatstandard linear approaches provide limited resolution and contrast inaccuracy [11]. Severaliterative reconstruction methods have been tested, and in particular, the Newton-Raphsonapproach has been shown to provide quantitatively accurate images of the absorptioncoefficient in a circular tomographic geometry [12-16]. This approach has been developed tocharacterize breast tumor optical properties in order to diagnose changes in hemoglobinconcentration and oxygen saturation of normal and malignant tissues, and is currently beingused in our clinical prototype imager.
Fig. 1. Schematic of three typical source-detector geometries used in diffuse
optical tomography applications. The projection-shadow geometry (a) is used inseveral optical mammography scanners [3, 23-25], while the circular-tomography
geometry (b) is used for both breast and brain imaging [16, 26], as is the sub-surface imaging geometry (c) [2, 27, 28].
There has been considerable study of the type of measurements needed to provideoptimal sensitivity in separating the scattering and absorption coefficients in tissue [17-19].There has also been considerable study of the resolution limits of diffuse tomography [20-22]; however, in general the optimal data types and the resoluton limits are functions of thereconstruction algorithm used to retrieve the images and the source-detector arrangement.Resolution limits calculated from forward solutions may not apply to inversion algorithmswhich preserve the non-linearity between the internal optical properties of interest and themeasured projections at the boundaries. Similarly there has been little investigation of the
(C) 1999 OSA 12 April 1999 / Vol. 4, No. 8 / OPTICS EXPRESS 272#9194 - $15.00 US Received March 02, 1999; Revised April 09, 1999
geometry and how its boundaries affect the imaging process. As a practical matter, it is quiteimportant to assess the effects that boundaries and source-detector configurations have on theimage reconstruction in order to design prototype medical systems. These designconsiderations are ideally assessed through computer simulations to avoid costly and wastefulconstruction of clinical prototype systems which may have inherent design flaws. With thisgoal in mind, we assess geometries which to date represent the most common configurationsused for near-infrared imaging and spectroscopy.
Fig. 2. Geometries used in this study are shown, where the outward arrows indicatedetector locations and the inward arrows denote source locations. The geometries
include (a) circular reflectance and transmittance imaging which uses circularsymmetry for sampling angles (b) circular fan-beam imaging (where the source-
detector array is rotated around the tissue), (c) sub-surface tomography which onlyuses a sub-set of projections from the surface of the tissue, (d) flat slab reflectance
and transmittance imaging using maximal sampling from both surfaces, (e) flatslab fan-beam which does not use any reflectance data, and (e) sub-surface imagingwith a flat upper surface. Together these six geometries, in various forms, define
the possible configurations for imaging tissue with DOT.The geometries chosen for many laboratory and clinical near-infrared imaging studies
fall into three general catagories, which are delineated here as (a) projection-shadow, (b)circular-tomography and (c) subsurface imaging, as shown in Fig. 1. Each of thesegeometries is being used in clinical investigations for imaging either breast or brain tissueswith near-infrared light; yet, there has been little comparison of how the source-detectorarray geometry will affects the quality of the optical measurements and resulting image. Itshould be noted that the projection-shadow geometry is generally used for traditional x-rayfilm style images, where there is no inversion of the data to compute tomographic images[3], and that this geometry does not lend itself to tomographic reconstruction. However, evenwith this restriction, Fantini et al. have been able to retrieve quantitative optical propertiesfrom breast tumors using the assumption that the tumor is roughly spherically shaped [29],and this procedure can be even more accurate when multiple projections and multiplewavelengths are incorporated into the analysis [24]. Similarly, Quaresima et al. have usedthis geometry to measure the spectral signature of breast tissue [30]. A variant of thisgeometry, which exploits a single source location and the angular projections to multipledetectors, has been employed by Li et al. [31] to produce backprojection images of breasttissue. Circular tomography has been used successfully in our own studies of hemoglobinbased imaging [15, 16] which is being developed for breast cancer diagnosis [32], as well asin work of other investigators for cerebral imaging [26, 33].
(C) 1999 OSA 12 April 1999 / Vol. 4, No. 8 / OPTICS EXPRESS 273#9194 - $15.00 US Received March 02, 1999; Revised April 09, 1999
In this study, the same DOT image reconstruction algorithm is used to examine: (a)circular full reflectance and transmittance tomography (b) circular fan-beam tomography, (c)sub-surface imaging under a curved boundary, (d) flat slab reflectance and transmittancetomography, (e) flat slab fan-beam tomography, and (f) sub-surface imaging below a flatsurface, as shown in Fig. 2. The goal of these tests is to examine the influences of (i) thetissue geometry and (ii) the source-detector configuration upon the recovered image accuracyand quality, and to determine the optimal data collection strategy for characterizing tissueoptical properties with this algorithm. The flat slab geometry (Fig. 2 (d) to (f)) is well suitedfor breast imaging since it provides a configuration similar to x-ray mammography, but it isnot clear how the image quality will compare to the more symmetric sampling provided bythe circular geometries (Fig. 2 (a) to (c)). We also compare a fan-beam orientation of thedetectors where measurements are only recorded on the opposite side to the source (Fig. 2 (b)& (e)), with the full set of projections from all points equally spaced around the tissue (Fig. 2(a) & (d)). The former orientation is technologically easier to implement because allmeasurement intensities are within the same range of detector sensitivity, so that parallelimplementation is more easily facilitated. However, it is not obvious how this decrease indata affects the resulting optical property distribution, as compared to the full reflectance andtransmittance sampling. Finally, subsurface tomography is examined since this is a geometrywhich is being widely used for near-infrared tomography of brain and breast tissues [2, 28,34].
2. Theory & Computational Methods
The theoretical details of diffuse optical tomography have been described by several authors,and some good overviews are included in references [35-37]. Forward calculations of diffuselight in tissue can be used to simulate experimental measurements of heterogeneous tissue,and by matching calculated measurements to these simulated experimental measurements animage of the optical properties can be recovered. Since frequency-domain lightmeasurements are used in this work, the frequency-domain diffusion equation is solved witha finite element method. The general form of this equation is:
),(),()]/()([),()( 0 ωωωµω rSrcirrrD a =Φ+−Φ∇⋅∇(1)
which describes optical fluence rate Φ(r,ω) at position r, and frequency ω, given thedistribution of absorption coefficient, µa(r) and diffusion coefficient D(r), where c is thespeed of light in the medium, and S0(r,ω) is the optical source. The diffusion coefficient isusually defined as D = [3(µs
/+µa)]-1, where µs
/ is the transport scattering coefficient of themedium. This equation is solved with Type III (Robin) boundary condition on a finiteelement mesh, where all exterior elements are subject to:
0ˆ),()( =⋅Φ∇+Φ nk ωξξ (2)where ξ is the position on the boundary, n̂ is the unit vector normal to the boundary, and k isa calibration constant which has been determined empirically by matching the forwardcalculations to well controlled experiments [36]. From this solution, we calculate a set ofoptical measurements, φi
O, which in this case are phase shift at frequency, ω, and thelogarithm of the signal amplitude. While the solution to equation (1) is straightforwardgiven the distribution of µa and µs
/, recovering the image distribution of µa and µs/ requires
an iterative solution, since equation (1) cannot be directly solved for these values, in partbecause Φ(r,ω) is not known inside the tissue, but only at the discrete points (detectorlocations) on the boundary.
The Newon-Raphson iterative method for finding the solution of µa and µs/ starts by
solving for the minimum of the functional
(C) 1999 OSA 12 April 1999 / Vol. 4, No. 8 / OPTICS EXPRESS 274#9194 - $15.00 US Received March 02, 1999; Revised April 09, 1999
)()()()( µλφφφφµχ FOCOC +−−= Τ (3)
where we use µ to represent both µa and µs/ as the set of coefficients, and F(µ) is an arbitrary
functional which smooths the solution to reduce the ill-posed nature of the eventual matrixinversion [38]. Minimizing (3) by taking the derivative and setting it equal to zero, followedby expansion of the solution in a Taylor’s series [39], leads to,
...)()(0 ++∆+−= ΤΤ IJJJ λµφφ OC
(4)
where the elements of J are given by ∂φi ⁄ ∂µk, for observation i, at each pixel position k. Inthis derivation, the higher order derivatives of φ are assumed to be negligible, and F(µ) ischosen to result in the classical Tikhonov regularized formulation [38]. Finally the iterativesolution becomes,
1][)( −ΤΤ +−=∆ IJJJ λφφµ OC (5)
where ∆µ is the update for the current estimate of µ. The values of φC and J are calculatedusing the current estimate of µ. In practice we have found that the regularization parametercan be varied between iterations for improved reconstruction, and can be varied spatially tocompensate for some geometrical artifacts induced during the reconstruction process [15].
In the following simulations, the forward and inverse calculations have been carried outwith a finite element solution which has been tested extensively in previous papers [ Thesimulated measurements were calculated on the same meshes that were used for thereconstructions and 1% random gaussian-distributed noise was added to both the real andimaginary components of the measurements in order to simulate true source-detector noise.All reconstructions were carried out with the same regularization parameter, and 5 iterationshave been used in each case. Each iteration requires approximately 1.5 minutes on a 200MHz desktop computer running Windows NT. In all the reconstructed images shown in thispaper, the dimensions of the field are shown in millimeters on the x and y axes of the figure.
3. Results
3.1 Imaging Fields with a Single Localized TargetA series of forward and inverse simulations have been completed for each geometry shown inFigure 2. The overall goal has been to maintain a uniform test between geometries anddetermine those geometries which introduce significant artifacts into the reconstruction bythe nature of the boundaries and source-detector configuration. There are an infinite numberof possible tests which could be used in each of these geometries, but we have chosen tobegin with a physiologically relevant contrast in a tumor sized target. In all cases thebackground optical properties were fixed at µa= 0.01 mm-1 and µs
/ = 1.0 mm-1, and asimulated target within the field has been included with a radius of 10 mm and opticalproperties of µa = 0.02 mm-1 and µs
/ = 1.0 mm-1. In each geometry the target is movedaround to positions within the imaging field which have different levels of symmetry,potentially affecting the resulting image qualtity.
3.1.1 Circular Reflectance and Transmittance ImagingA circular mesh was used with 221 nodes in the coarse calculation of the Jacobian andmatrix inversion as shown in equation (5), and 425 nodes in the fine mesh were used forsolution of equation (1). A circularly symmetric configuration of 16 sources and 16 detectorswas used in the solution, providing a data set of 256 projections, as shown in Fig. 2 (a). Thefield was 86 mm in diameter, with the sources and detectors spaced symmetrically aroundthe periphery, with one every 11.25 degrees alternating between source and detector. The testtarget was moved to different radial positions between the center and the edge of the field to
(C) 1999 OSA 12 April 1999 / Vol. 4, No. 8 / OPTICS EXPRESS 275#9194 - $15.00 US Received March 02, 1999; Revised April 09, 1999
examine the quality of the reconstructions which are presented in Fig. 3. Because thissimulation has circular symmetry, no other target locations are needed to characterize theimage field.
Fig. 3. Reconstructed set of images (video sequence) of the test target at differentvertical positions within the circular mesh, using source-detector geometry in Fig. 2
(a) with a circularly symmetric distribution of 16 source and 16 detectors forreflectance and transmittance imaging. The color bar on the right is in absorption
coefficient units of mm-1.
3.1.2 Circular Fan-Beam ImagingThis orientation of source and detectors is shown in Fig 2(b), where for each source location,8 detectors were used on the opposite side of the phantom. Then the source and locations ofthe 8 detectors are rotated around the phantom to 16 different sets of projections through thephantom, resulting in 128 measurements of phase shift and signal amplitude. The spacing offield and source-detectors was otherwise identical to Fig. 3. This geometry has theexperimental advantage that the signal intensity at all 8 detectors is within an order ofmagnitude in variation, so that large changes in the dynamic range of the detectors is notencountered. This data set can be considered as a sub-set of the data available in theprevious case of full reflectance and transmittance with the near-source detectors removed.The location of the test target was varied in the object field between the center and the topedge. Again, since the sources and detectors are located in circularly symmetric orientations,this set of target locations is sufficient to characterize the entire image field for this size andshape of object, as shown in Fig. 4.
Fig. 4. Reconstructed set of images (video sequence) showing the test target atdifferent vertical positions within the circular mesh, using the fan beam geometry
with 16 sources transmitting to 8 detectors. The color bar on the right is inabsorption coefficient units of mm-1.
3.1.3 Sub-surface Imaging – Curved BoundaryNear-infrared imaging is confounded by the high attenuation of the light in tissue, such thatin practice, it is often not possible to detect light reliably through tissue samples thicker than10 cm. Also, the instrumentation for imaging through tissue less than 5-6 cm can be muchsimpler, more robust and less expensive than for thicker tissues [28]. For this reason, manyinvestigators have focused on sub-surface imaging applications where the sources anddetectors are located on the same tissue surface and are arranged to probe the interior of thetissue. This sub-surface tomography can be performed on a curved tissue such as a neonateor adult head and female breast. These tissues are well simulated with a finite element
(C) 1999 OSA 12 April 1999 / Vol. 4, No. 8 / OPTICS EXPRESS 276#9194 - $15.00 US Received March 02, 1999; Revised April 09, 1999
solution assuming that the boundary curvature is known and can be input into a finiteelement mesh. If the light does not sample deeply into the tissue, the tissue boundary can beapproximated by a simple circular mesh which has a matching radius of curvature. In thenext series of simulations, this sub-surface imaging method has been investigated using thesame circular mesh as above, but with only the source and detector locations on the upperregion of the mesh activated. Both situations illustrated in Fig. 2 (c) were examinedincluding: 8 sources-8 detectors (8x8) and 4 sources-4 detectors (4x4). The imaging field issymmetric about the center of the source-detector array, so that the image quality isadequately assessed by translating the test object vertically down from the upper surface, asshown in Fig. 5.
Fig. 5. Reconstructed set of images of the test target within a circular mesh usingthe sub-surface orientation with (a) 8 sources and 8 detectors in an arc, and (b) 4
sources and 4 detectors in a smaller arc on the surface (as shown in Fig. 2(c)).Color bar at right is in absorption coefficient units of mm-1.
3.1.4 Slab Reflectance and Transmittance ImagingThe slab geometry mimics x-ray mammography and minimizing the thickness of tissue thatmust be imaged, potentially allowing the use of less sensitive, but more stable, solid statedetectors. Light signals from the tissue can be recorded from both the upper surface near thesource, as well as transmitted through the slab. This geometry is referred to here as slabreflectance and transmittance imaging, and is examined in the same set of simulations as thecircular geometry described in the previous sections. One major difference from the circulargeometry is the lack of symmetry, so that the response of the imaging field will likely varywith both vertical and horizontal position. Thus, in order to fully characterize the imageplane, the test object has been translated along three lines: vertically through the center,horizontally through the center, as well as horizontally along the upper surface, as shown inFig. 6. In the slab mesh, 260 nodes were used in the coarse calculation of the Jacobian inequation (5) and 380 nodes were used in the fine mesh solution of equation (1). The sourcedetector arrangement was as shown in Fig. 2(d), with 5 mm between each source anddetector.
Fig. 6. Reconstructed set of images of the test target at different (a) verticalpositions (b) lateral positions along the central line, and (c) lateral positions along
(C) 1999 OSA 12 April 1999 / Vol. 4, No. 8 / OPTICS EXPRESS 277#9194 - $15.00 US Received March 02, 1999; Revised April 09, 1999
the surface, using the slab reflectance and transmittance geometry of sources anddetectors as shown in Fig. 2 (d).
3.1.5 Slab Fan-Beam ImagingThe fan-beam geometry for slab breast imaging is an obvious choice since it can involve theuse of parallel detection through a CCD or other parallel detectors, which are highly stableand provide robust detection. The simplicity of translating the source across the uppersurface of the tissue is beneficial, but it is not clear how the loss of reflectance informationwill affect the reconstructed images of the tissue interior. The geometry used in this sectionwas as shown in Fig 2.(e), with 5 mm between neighbouring fibers. In these simulations, theasymmetry is similar to the previous section, so that the same set of simulations were carriedout to examine the imaging field sensitivity, shown in Fig. 7.
Fig. 7. Reconstructed set of images of the test target at different (a) verticalpositions (b) lateral positions along the central line, and (c) lateral positions alongthe surface similar to those in Fig. 6, using fan-beam slab imaging. Color bar at
right is in absorption coefficient units of mm-1.
3.1.6 Sub-surface Imaging – Flat boundary
The flat boundary is perhaps one of the most often used geometries for near-infrared sub-surface imaging because it is simple, readily available clinically in many body locations, andlends itself to analytic reconstruction methods. This geometry was tested here with 16sources and 16 detectors all located on the upper surface of the tissue volume producing 256projections through the medium, spaced alternating at in Fig. 2 (f), with 2.5 mm betweeneach. The high number of sources and detectors was employed to provide the bestperformance that we could obtain in this geometry. The test object was translated verticallydown from the surface, as with the sub-surface imaging on the circular mesh (Section 3.1.3),with the results shown in Fig. 8.
Fig. 8. Reconstructed set of images where the test target was translated verticallyfrom the middle of the tissue volume (25 mm down) up to the surface, using 16
sources and 16 detectors alternated and equally spaced along the upper surface ofthe region, as illustrated in Fig. 2 (f).
3.2 Comparison of Geometries – Contrast and Noise
(C) 1999 OSA 12 April 1999 / Vol. 4, No. 8 / OPTICS EXPRESS 278#9194 - $15.00 US Received March 02, 1999; Revised April 09, 1999
The above simulations do not completely define the characteristics of the imaging geometryand slight improvements can be achieved for individual cases by adjusting the regularizationparameter both during an iteration and spatially-distributed across the imaging plane [15].Nonetheless comparing the reconstructed peak values in the target zone and the typical noisein the homogeneous background of the image are useful measures of the ability to reconstructobjects accurately. In Fig. 9 (left-top graph) the reconstructed peak values for each target areplotted for changes in vertical position through the image plane. Fig. 9 (right-top graph) is aplot of the standard deviation of the noise within what should be the homogeneous regions ofthe resulting images. In the peak absorption coefficient, if the value is within 20% of theoriginal target it is considered acceptable. This criterion is simply based upon the typicalvariations in reconstructed properties observed in previous studies [16].
Fig. 9. Calculated (left-top graph) peak absorption coefficient values for the object
at different positions within the simulated phantoms, and (right-top graph)reconstructed noise in the background region of the image measured by sampling ofrandom regions of interest outside the target zone. The true value in the first graphis shown with a solid horizontal line, and the 20% region of acceptability is definedby the dotted lines. Calculated (left-bottom graph) target location as a depth fromthe upper surface, and (right-bottom graph) the calculated target full width at halfmaximum (FWHM) height as a function of depth in the medium, here taken as an
average of the lateral and vertical directions.
A comparison of the three subsurface imaging geometries is shown in Fig. 10, using thesame criteria of acceptable peak reconstruction value, as shown in Fig. 9. The reconstructedpeak absorption coefficient values for the single targets are shown in Fig. 10 (left-top) as a
(C) 1999 OSA 12 April 1999 / Vol. 4, No. 8 / OPTICS EXPRESS 279#9194 - $15.00 US Received March 02, 1999; Revised April 09, 1999
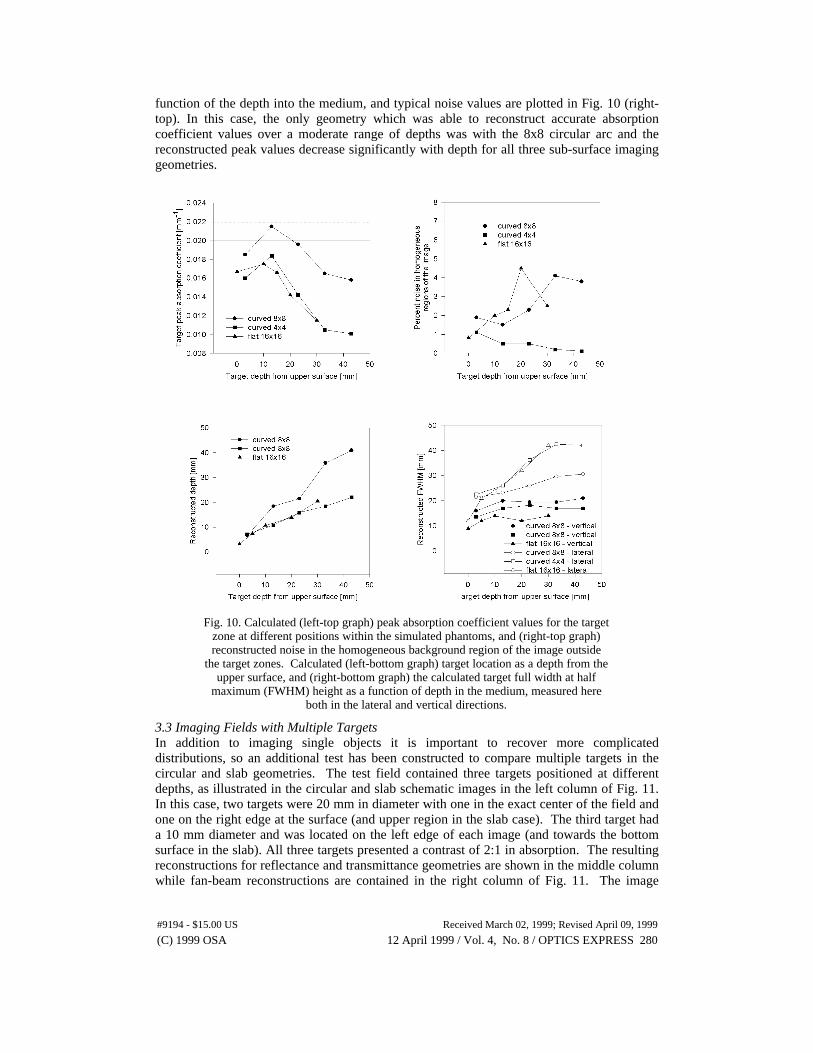
function of the depth into the medium, and typical noise values are plotted in Fig. 10 (right-top). In this case, the only geometry which was able to reconstruct accurate absorptioncoefficient values over a moderate range of depths was with the 8x8 circular arc and thereconstructed peak values decrease significantly with depth for all three sub-surface imaginggeometries.
Fig. 10. Calculated (left-top graph) peak absorption coefficient values for the target
zone at different positions within the simulated phantoms, and (right-top graph)reconstructed noise in the homogeneous background region of the image outside
the target zones. Calculated (left-bottom graph) target location as a depth from theupper surface, and (right-bottom graph) the calculated target full width at half
maximum (FWHM) height as a function of depth in the medium, measured hereboth in the lateral and vertical directions.
3.3 Imaging Fields with Multiple TargetsIn addition to imaging single objects it is important to recover more complicateddistributions, so an additional test has been constructed to compare multiple targets in thecircular and slab geometries. The test field contained three targets positioned at differentdepths, as illustrated in the circular and slab schematic images in the left column of Fig. 11.In this case, two targets were 20 mm in diameter with one in the exact center of the field andone on the right edge at the surface (and upper region in the slab case). The third target hada 10 mm diameter and was located on the left edge of each image (and towards the bottomsurface in the slab). All three targets presented a contrast of 2:1 in absorption. The resultingreconstructions for reflectance and transmittance geometries are shown in the middle columnwhile fan-beam reconstructions are contained in the right column of Fig. 11. The image
(C) 1999 OSA 12 April 1999 / Vol. 4, No. 8 / OPTICS EXPRESS 280#9194 - $15.00 US Received March 02, 1999; Revised April 09, 1999
quality of the two sub-surface geometries is clearly limited in depth resolution, so that thesame tests have not been applied to these cases. Therefore, a separate multi-target testconsisting of two sub-surface objects, both 10 mm diameter and 2:1 in contrast but with oneon the surface and the other 5 mm below, was used to compare these sub-surfaceconfigurations, as shown on the left of Fig. 12. The reconstructed images using the 4x4 and8x8 circular arcs and the 16x16 flat slab are presented in the right columns of the figure.
Fig.11. Reconstructed images of three localized targets within a homogeneous
background field, (schematics shown in the left column) using geometries of (uppermiddle) circular reflectance & transmittance (upper right) circular fan-beam,
(lower middle) slab reflectance & transmittance, and (lower right) slab fan-beam.The test targets (left) were all 2:1 absroption contrast from the background, and the
two on the right were 20 mm diameter, while the one on the left is 10 mm indiameter.
Fig. 12. Reconstructed images of the test fields (shown in the left colum) are
displayed at right. The test fields contained two 10 mm diameter objects with oneon the surface and the other 5 mm below the surface. In the top row, the middle
image shows the result of the 4 source-4 detector array while the right image showsthe result from the 8 source-8 detector array. In the bottom row, the result from the
slab geometry is shown using the 16 source-16 detector array.
3.5 Imaging Fields with Layered StructureA third test was performed to examine the influence of geometry on the ability to recover alayered structure within the medium. In this situation, the field consisted of three concentriclayers of differing absorption coefficient with a single circular inhomogeneity located withinthe layers. The schematic of the test object is shown in Fig. 13 in the left column, with thecircular test field in the upper row, and the corresponding slab test field in the lower row.The reconstructed images using the full reflectance & transmittance and fan-beamapproaches are shown in the center and right columns of the figure, respectively.Interestingly, in all cases the circular target could be localized and reconstructed to within
(C) 1999 OSA 12 April 1999 / Vol. 4, No. 8 / OPTICS EXPRESS 281#9194 - $15.00 US Received March 02, 1999; Revised April 09, 1999
20% of the true value, but the layered structure near the surface was best recovered in thecircular geometry. In particular, the full reflectance and transmittance array provided abetter reconstruction of the layered structure than did the fan-beam approach, while both slabapproaches were dominated by artifacts in the background.
In Fig. 14, the same layered test fields as in Fig. 13 were used to evaluate the sub-surfaceimaging geometries. These methods were not expected to reconstruct the lower regions ofthe phantom, but the upper layers and the presence of the object can be partiallyreconstructed in all cases. The 4x4 detector strategy and the slab 16x16 scheme cannot fullydiscriminate the object from the layers, while the 8x8 arc geometry can partially reconstructboth the layers and the presence of the object.
Fig. 13 Tomographic reconstructions of a layered tested field with a single targetincluded for both circular (top row) and slab (bottom row) geometries, with two 5mm thick layers of µa = 0.01 and µa = 0.02, with the interior at µa = 0.015 mm-1,and a 20 mm diameter object at µa = 0.02 mm-1. The images in the left column
represent the test field, while the middle row of images show the full reflectanceand transmittance images, and the right column of images show the fan-beam
images.
Fig. 14. Reconstructions of the test fields shown on in the left column using the
sub-surface imaging geometires, including the curved boundary with (upper middleimage) 4 sources and 4 detectors, (upper right image) 8 sources and 8 detectors inan arc, and the slab boundary (lower right image) 16 sources and 16 detectors in a
flat plane along the surface.
3.5 Application to Irregular Tissue Geometries – Cerebral Hemoglobin ImagingIn an effort to consider these source-detector arrangements in a more realistic geometry, amagnetic resonance image of a human brain was segmented into a finite element mesh(shown in Fig. 15) and used to simulate imaging with the three source-detector geometries (i)fan beam (ii) reflectance and transmittance and (iii) sub-surface imaging. The head size wasscaled to that of a neonate, and typical optical properties were applied to the skin, bone, grey
(C) 1999 OSA 12 April 1999 / Vol. 4, No. 8 / OPTICS EXPRESS 282#9194 - $15.00 US Received March 02, 1999; Revised April 09, 1999
matter and white matter [7,33]. A 15 mm diameter inclusion was added in the upper left ofthe brain with µa = 0.03 mm-1, representing a 50% increase from the grey matter, and a200% increase from the white matter. The initial guess for the image was a homogeneoushead shape with µa = 0.01 mm-1. The inclusion was observed in all reconstructed imageswith a peak value within 10 % of the true value, indicating that it can be successfullycharacterized with all three source-detector geometries using this algorithm. Interestingly,none of the imaging geometries could discriminate the white matter structure from the greymatter, but the full reflectance and transmittance method was able to recover the skull opticalproperties accurately, as was the sub-surface imaging geometry. Also the fan-beam approachproduced significant artifact into the image, as a ringing structure. Surprizingly the fan-beam approach recovers the presence of the object clearly, albeit not at a accurate contrastlevel.
Fig. 15. Reconstructed simulations of a human cranium with the test field (upperleft), showing absorption coefficients of skin, µa = 0.01, skull, µa = 0.025, grey
matter, µa = 0.02, and white matter, µa = 0.01 mm-1, with a fixed scatteringcoefficient of µs
/ = 1.0 mm-1. An artificial inclusion having µa = 0.03 was includedin the upper left of the test field. The reconstructed images are shown using full
reflectance and transmittance imaging (upper right), fan beam imaging (lower left),and 8x8 sub-surface imaging with the detectors in an arc around the upper half of
the head (lower right). Note that the sub-surface geometry is not expected torecover properties in the lower half of the image.
4. Discussion
4.1 Geometry Effects in the Reconstructed ImageDetermining the optimal source-detector and tissue geometry is not as simple of a task as itmight first appear because of the interplay between theoretical performance and practicalconstraints, so that some theoretically optimal designs must be considered in light ofexperimental limitations. As a result, all of these issues cannot be fully characterized by thesimple simulations contained in this paper. Also, the reconstruction algorithm could be bettertailored to any of the specific geometries than in its present generalized form, by altering theregularization scheme to improve the reconstruction to provide a more homogeneous solutionacross the imaging field [15]. In the cases shown here, the regularization parameter was
(C) 1999 OSA 12 April 1999 / Vol. 4, No. 8 / OPTICS EXPRESS 283#9194 - $15.00 US Received March 02, 1999; Revised April 09, 1999
chosen to provide optimal reconstructions, through a series of trials, so that the imagesshown here are our best versions. However, even with these uncertainties aboutregularization, there are some reconstruction results which are indicative of the measurementdata quality which can be used to evaluate and compare the individual geometries. Our goalhas been to determine if the geometry significantly inhibits the ability to accuratelyreconstruct optical properties, or if the geometry adds artifacts to the resulting image whichare not easily avoided.
When comparing reconstruction geometries, it would be ideal to have the same numberof measurements in the data set, so that changes in geometry are not confounded by changesin the conditioning of the matrix; however, in practice the physical size of the source anddetector fibers can limit the number of possiblilities which are available for a givengeometry. For example, in the circular geometry, the minimum tissue diameter and thediameter of the fibers dictates the number of sources and detectors that are possible. Forthese reasons, we have chosen to compare geometries and source-detector arrangementswhich are physically realistic, while trying to maintain the maximum number ofmeasurements in each data set. The fan-beam and sub-surface imaging schemes can bethought of as sub-sets of the data measured in the full reflectance and transmittance mode, sothat it is not surprising that there is some loss of image resolution with each of these twomethods. We have also constrained the problem to be 2-dimensional in these cases, howeverbased upon previous experience we anticipate that similar results are obtained in 3-dimensions. Also fully 3-dimensional reconstruction is inherently difficult to interpret, andoften requires separation into 2-d slices in order to fully evaluate the image quality. Forthese reasons, the 2-dimensional images shown here are thought to be representative of theavailable image quality for each respective geometry.
4.2 Single TargetsIn the video sequences of Figs. 3 to 8, the object is localized accurately in all cases, and isclose to the original true value at most locations (as shown in Fig. 9). Small deviations fromthe true value can be compensated with changes in the regularization parameters [15], butlarge deviations from the true value which are accompanied by significant noise in the imagecannot generally be eliminated. An example of this phenomenon is observed in Fig. 7,where the fan-beam slab reconstructions show a marked increase in noise within the image,while there is no decrease in the recovered peak height of the target. This noise is likely dueto the decreased angles of projection which are used to sample the field, producing regionswithin the image which cannot be well charaterized by the solution to the inverse problem.Maximizing the number of different angular projections through the field is likely the bestway to improve the accuracy of the inverse solution.
Recovering images in the sub-surface imaging geometry is more challenging than withfull tomographic methods, and this is expected since the tissue cannot be sampled aseffectively ina purely reflectance mode. The most important observation from the data inFig. 9 is that the true value of the object is not easily recovered without being able to samplemeasurements in an arc around the tissue sample, as is the case with the 8 source-8 detectorarray in the circular geometry. By adjusting the regularization parameters, it would bepossible to reconstruct the peak values for all three geometries used here, as long as the depthof the target is not lower than 20-30 mm. At depths below 30 mm, the photon paths cannotsample the target effectively. In general as the target is lowered into the medium, thereconstructed peak value will decrease.
4.3 Multiple TargetsWhen multiple targets are present as in Figs. 11 & 12, the circular geometries tend to over-reconstruct targets on the periphery. This problem can be compensated with a radialvariation in the regularization parameter [15]. The slab geometries do not recover thesmaller test target as well as their corresponding circular geometries. There are no clear
(C) 1999 OSA 12 April 1999 / Vol. 4, No. 8 / OPTICS EXPRESS 284#9194 - $15.00 US Received March 02, 1999; Revised April 09, 1999
differences between the fan-beam style versus the full sampling of reflectance andtransmittance, other than the expected increase in background noise in the fan-beam case.The subsurface imaging method suffers from a field sensitivity which decreases with depthinto the tissue, such that lower lying objects are not as strongly reconstructed as objectsimmediately at the surface.
4.4 Layered FieldsWhen layered test fields are used, there is serious degradation of the image quality in thecase of the slab geometry (Fig. 13), whereas both circular geometries were able to providereasonable images of the subsurface ring and the upper inclusion. Again, the full reflectanceand transmittance circular mode provided a slightly more accurate reconstruction of the testfield than the fan-beam circular mode. Note that the layer in the circular fan beamreconstruction is closer to the center than in the original test field (Fig. 13). All three sub-surface imaging method are able to reconstruct parts of the layered structure, but only the8x8 detection method is sufficient to recover the inclusion quantitatively below the layer. It islikely important to ensure that the diffuse projections sample below the suspected inclusionin order to produce an accurate reconstruction of the target. This layered test field isimportant, since almost all in vivo tissues have a complex layered structure near the surfacethat may not be clearly resolved unless a circular reflectance and transmittance geometry isused.
4.5 Cranial ImagingFor the cranial images in Fig. 15, the complex structure between white and grey matter is notwell resolved, which agrees with the observations of other investigators [33]. The location ofthe skull is well resolved with the full reflectance and transmittance method, but the interioris not. The sub-surface imaging geometry provides a method sufficient to quantify theoptical properties of the inclusion. The fan-beam imaging appears to image asymmetricregions, such as the inclusion quite well but cannot recover the skull or brain details at all. Ingeneral, the white/grey matter variations which appear on a sub centimeter scale cannot beresolved; however, larger changes in the optical properties, such as the artificial target in theupper left, can be resolved given. It is also likely that absolute changes in the opticalproperties can be better resolved than the absolute magnitude of the property itself, whereasonly the latter case has been tested here. Further study is needed to determine the increase inimage quality which is possible with incorporation of MRI-derived initial guesses of theoptical property distribution, and other enhancments of the reconstruction process throughadaptive spatial regularization or constraints [7, 40].
5. ConclusionIn general, increasing the number of measurements improves the quality of the reconstructedimages and the image accuracy. Care must be taken to ensure that the projections usedprovide a homogenous sampling of the entire tissue region of interest, and that theprojections maximize the number of angles over which measurments are recorded. Theability to resolve objects improves as the distribution of angular projections increases throughthe sample; so, the maximum angular coverage of a tissue results from the circular geometrywith full sampling of the reflectance and transmittance light, which is demonstrated to havethe best image quality in these simulations. The technological simplification of using a fanbeam approach is attractive and comes at only a modest decrease in image quality, so thismay provide the most practical method for optical imaging. The fan beam approachproduces measurmements which are all near the same order of magnitude in intensity so thatvariable attenuation is not required in the data acqusition system.
A comparison of slab-geometry imaging to circular-geometry imaging with singleobjects does not demonstrate a major difference in the image quality, but the ability to imagelayered objects with the slab-geometry was seriously compromised. From these simulations,
(C) 1999 OSA 12 April 1999 / Vol. 4, No. 8 / OPTICS EXPRESS 285#9194 - $15.00 US Received March 02, 1999; Revised April 09, 1999
we anticipate that the slab geometry is not well suited to imaging layered structures, and thismay be due to the relatively few projections at varying angles through the layers which exist.Sub-surface imaging produces the lowest quality images, but is able to quantify absorbingperturbations near the surface. Objects lower than 2 cm are not likely to be imagedaccurately by subsurface methods unless the overlying surface is curved. Curved surfacesallow the light projections to probe deeper into the tissue and can provide accurate images ofsections of a tissue. The image quality for all geometries presented in this paper iscompromised by the generality of the inversion algorithm, so that some improvements canpotentially be incorporated for each particular geometry through spatially distributedregularization methods or adaptive regularization [15].
AcknowledgementsThe authors would like to thank Dr. Mike Miga for his assistance in creation of the cranialfinite element mesh, and Dr. Judith Prewitt for insightful discussions. This work has beenfunded by NIH grant RO1-CA69544.
(C) 1999 OSA 12 April 1999 / Vol. 4, No. 8 / OPTICS EXPRESS 286#9194 - $15.00 US Received March 02, 1999; Revised April 09, 1999