8/13/2019 Comparison of Methane Emission Models to Methane Emission Measurements
http://slidepdf.com/reader/full/comparison-of-methane-emission-models-to-methane-emission-measurements 1/22
Phone no.: +31 888 010 621
Fax no.: +31 888 010 808
Email: [email protected]
COMPARISON OF METHANE EMISSION MODELS
AND METHANE EMISSION MEASUREMENTS
Authors: Joeri Jacobs and Heijo Scharff*
Organisation: NV Afvalzorg
Address: PO Box 6343
2001 HH Haarlem
The Netherlands
8/13/2019 Comparison of Methane Emission Models to Methane Emission Measurements
http://slidepdf.com/reader/full/comparison-of-methane-emission-models-to-methane-emission-measurements 2/22
Page 2 of 22
ABSTRACT
Quantification of methane emission from landfills is important to evaluate reduction measures. Both
the United Nations and the European Union have adopted protocols to enforce among others
quantification of methane emission from individual landfills. The most widely applied methods for
quantification are based on models. The suitability and accuracy of six models is explored. The
modelling results are compared with whole site methane emission measurements. The comparison
with waste data of one single landfill shows that current models do not supply a reliable tool to
estimate methane emissions from individual landfills. Further development of measurement
techniques may provide a more reliable quantification tool.
8/13/2019 Comparison of Methane Emission Models to Methane Emission Measurements
http://slidepdf.com/reader/full/comparison-of-methane-emission-models-to-methane-emission-measurements 3/22
8/13/2019 Comparison of Methane Emission Models to Methane Emission Measurements
http://slidepdf.com/reader/full/comparison-of-methane-emission-models-to-methane-emission-measurements 4/22
Page 4 of 22
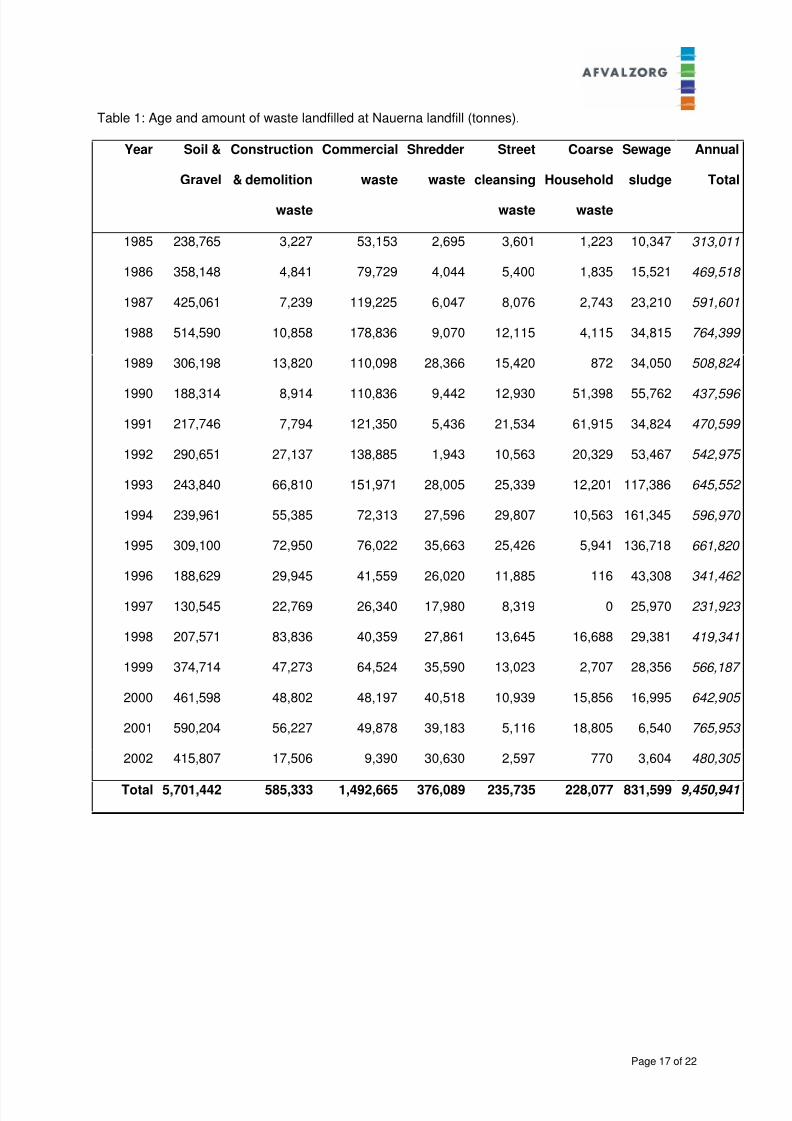
amount of 9.5 Mtonnes of waste is landfilled at Nauerna. The waste is characterised by a low content
in organic matter. Table 1 shows the composition of the waste landfilled at Nauerna. At this landfill
whole site measurements with the best available techniques were carried out annually starting in
1997. In 2001 a very extensive measurement program comparing different measurement techniques
was carried out.
A lot of different models to predict methane emissions originating from landfills are used nowadays.
The most common type of models use single or multi phase first order kinetics that describe the decay
of biodegradable waste and the production of landfill gas (LFG). LFG production in combination with
the oxidation capacity of the top cover and LFG extraction data enables calculation of the methane
emission. Most landfill gas (LFG) models are based on municipal solid waste (MSW). They are
therefore not automatically suitable for situations with reduced amounts of organic waste. In most
cases emission model validation has been carried out using LFG extraction data and assumptions for
extraction efficiency and methane oxidation. Thus major uncertainties are introduced. The authors
have the opinion that a proper validation of LFG emission models requires comparison with whole site
emission measurement data. Only two studies (Oonk & Boom, 1995; Huitric & Soni, 1997) have
applied validation based on whole site methane emission measurements.
In 1994 a study (Oonk et al., 1994) was performed at several landfills in the Netherlands. Both first
order and multi phase models showed low mean relative errors in contrast to zero order models. This
study resulted in the development by the TNO research institute of the first order model used by the
Dutch government to calculate and report national methane emissions as if the waste were deposited
at one landfill. The UK Environment Agency prefers GasSim as the model for individual landfill
operators to calculate and report their methane emission. Recently new models were developed in
order to calculate landfill gas emission in Germany and France. In this present case study six different
models are used to calculate the methane emission of Nauerna landfill:
1. First order model (TNO) (Oonk and Boom, 1995);
2. Multi phase model (Afvalzorg);
3. GasSim (Environment Agency UK and Golder Associates) (Gregory et al., 2003) ;
4. EPER model France (ADEME) (Budka, 2003);
5. EPER model Germany (Umwelt Bundesamt and State Institute for Environmental protection
Baden Würtemberg) (Wielenga, 2003) and
8/13/2019 Comparison of Methane Emission Models to Methane Emission Measurements
http://slidepdf.com/reader/full/comparison-of-methane-emission-models-to-methane-emission-measurements 5/22
Page 5 of 22
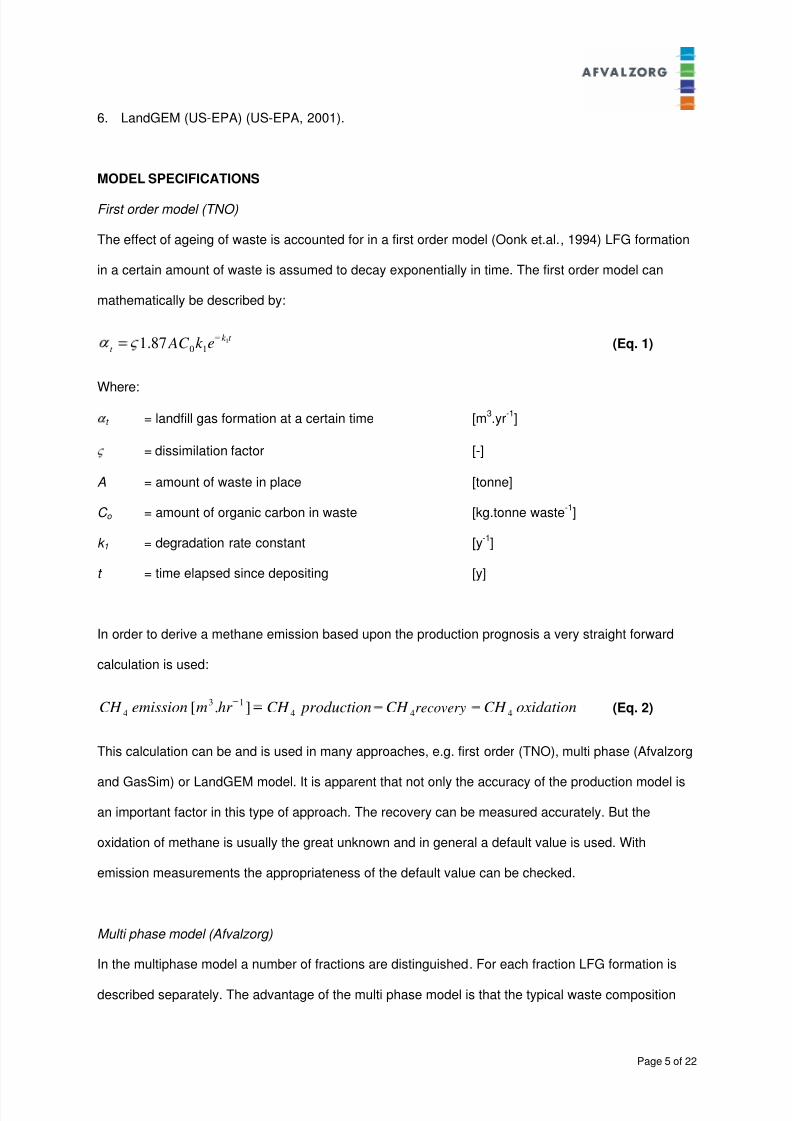
6. LandGEM (US-EPA) (US-EPA, 2001).
MODEL SPECIFICATIONS
First order model (TNO)
The effect of ageing of waste is accounted for in a first order model (Oonk et.al., 1994) LFG formation
in a certain amount of waste is assumed to decay exponentially in time. The first order model can
mathematically be described by:
t k
t ek AC 1
1087.1 (Eq. 1)
Where:
t = landfill gas formation at a certain time [m3.yr
-1]
= dissimilation factor [-]
A = amount of waste in place [tonne]
C o = amount of organic carbon in waste [kg.tonne waste-1
]
k 1 = degradation rate constant [y-1]
t = time elapsed since depositing [y]
In order to derive a methane emission based upon the production prognosis a very straight forward
calculation is used:
44
13
4 ].[ CH productionCH hr memissionCH recovery oxidationCH
4(Eq. 2)
This calculation can be and is used in many approaches, e.g. first order (TNO), multi phase (Afvalzorg
and GasSim) or LandGEM model. It is apparent that not only the accuracy of the production model is
an important factor in this type of approach. The recovery can be measured accurately. But the
oxidation of methane is usually the great unknown and in general a default value is used. With
emission measurements the appropriateness of the default value can be checked.
Multi phase model (Afvalzorg)
In the multiphase model a number of fractions are distinguished. For each fraction LFG formation is
described separately. The advantage of the multi phase model is that the typical waste composition
8/13/2019 Comparison of Methane Emission Models to Methane Emission Measurements
http://slidepdf.com/reader/full/comparison-of-methane-emission-models-to-methane-emission-measurements 6/22
Page 6 of 22
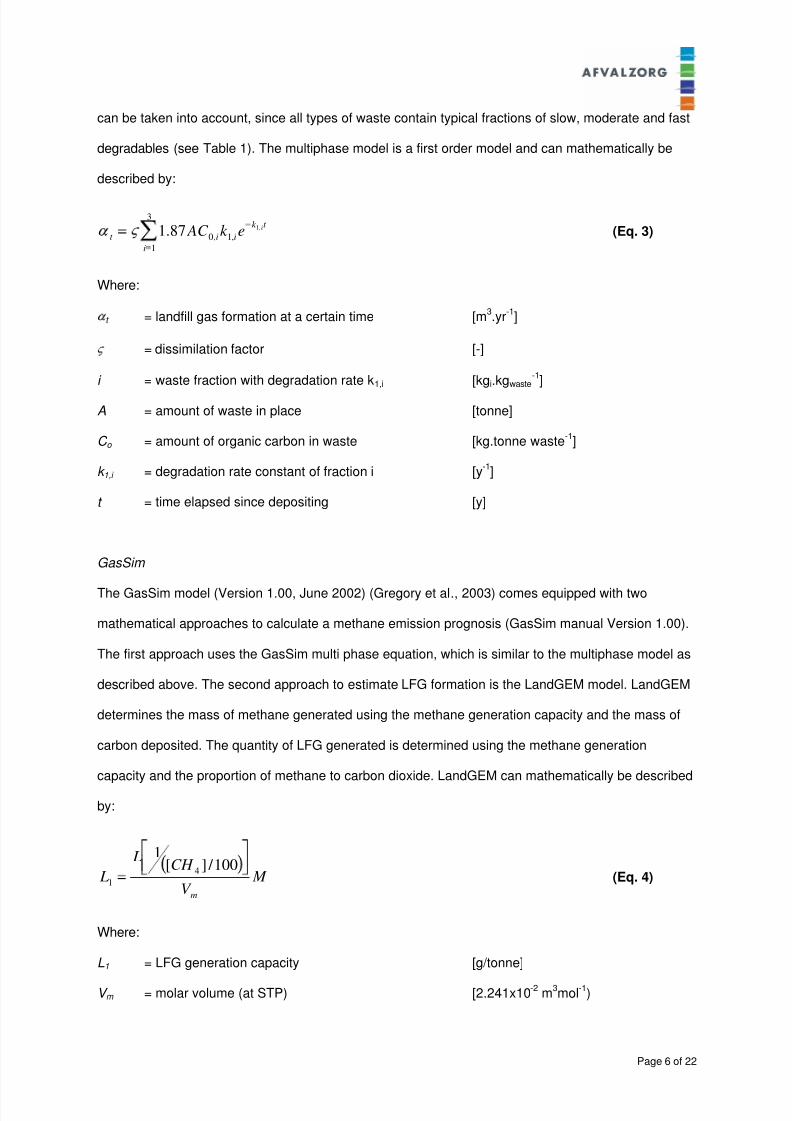
can be taken into account, since all types of waste contain typical fractions of slow, moderate and fast
degradables (see Table 1). The multiphase model is a first order model and can mathematically be
described by:
3
1
,1,0
,187.1
i
t k
iit iek AC (Eq. 3)
Where:
t = landfill gas formation at a certain time [m3.yr
-1]
= dissimilation factor [-]
i = waste fraction with degradation rate k1,i [kgi.kgwaste-1]
A = amount of waste in place [tonne]
C o = amount of organic carbon in waste [kg.tonne waste-1
]
k 1,i = degradation rate constant of fraction i [y-1
]
t = time elapsed since depositing [y]
GasSim
The GasSim model (Version 1.00, June 2002) (Gregory et al., 2003) comes equipped with two
mathematical approaches to calculate a methane emission prognosis (GasSim manual Version 1.00).
The first approach uses the GasSim multi phase equation, which is similar to the multiphase model as
described above. The second approach to estimate LFG formation is the LandGEM model. LandGEM
determines the mass of methane generated using the methane generation capacity and the mass of
carbon deposited. The quantity of LFG generated is determined using the methane generation
capacity and the proportion of methane to carbon dioxide. LandGEM can mathematically be described
by:
M V
CH L
Lm
100 / ][1
4
1 (Eq. 4)
Where:
L1 = LFG generation capacity [g/tonne]
V m = molar volume (at STP) [2.241x10⁻²
m3mol
-1)
8/13/2019 Comparison of Methane Emission Models to Methane Emission Measurements
http://slidepdf.com/reader/full/comparison-of-methane-emission-models-to-methane-emission-measurements 7/22
Page 7 of 22
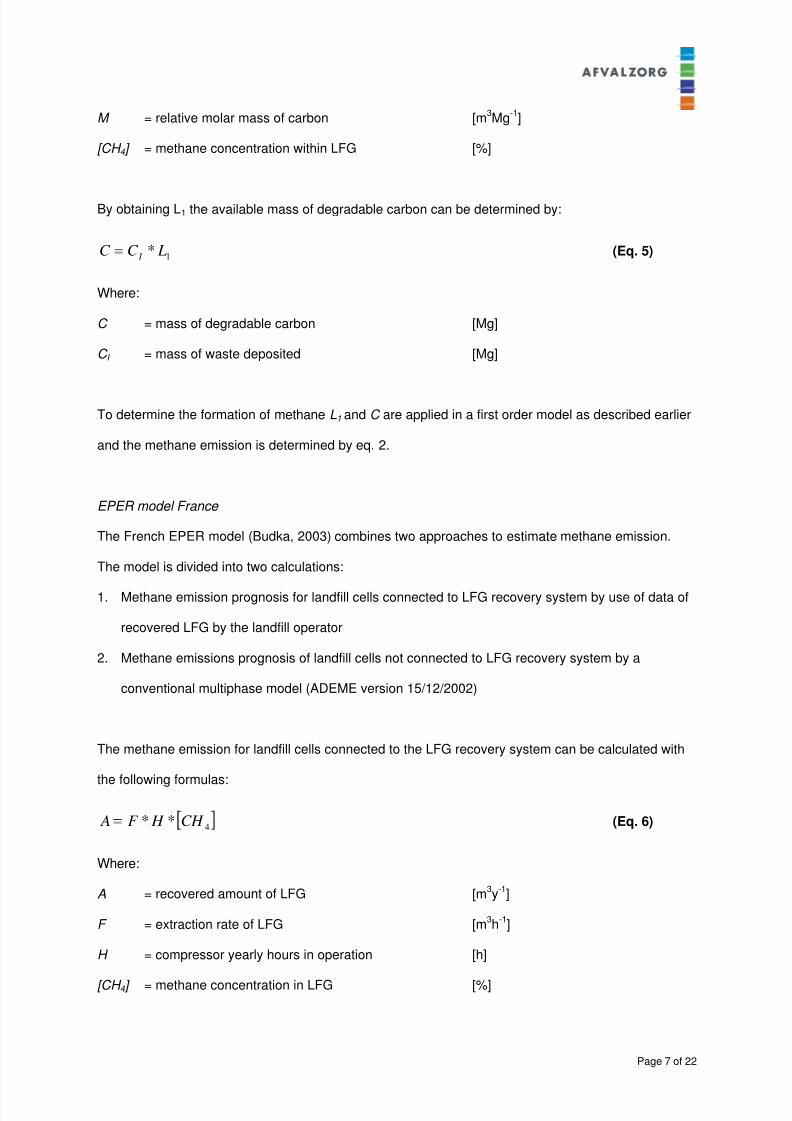
M = relative molar mass of carbon [m3Mg
-1]
[CH 4 ] = methane concentration within LFG [%]
By obtaining L1 the available mass of degradable carbon can be determined by:
1* LC C I (Eq. 5)
Where:
C = mass of degradable carbon [Mg]
C I = mass of waste deposited [Mg]
To determine the formation of methane L1 and C are applied in a first order model as described earlier
and the methane emission is determined by eq. 2.
EPER model France
The French EPER model (Budka, 2003) combines two approaches to estimate methane emission.
The model is divided into two calculations:
1. Methane emission prognosis for landfill cells connected to LFG recovery system by use of data of
recovered LFG by the landfill operator
2. Methane emissions prognosis of landfill cells not connected to LFG recovery system by a
conventional multiphase model (ADEME version 15/12/2002)
The methane emission for landfill cells connected to the LFG recovery system can be calculated with
the following formulas:
4** CH H F A (Eq. 6)
Where:
A = recovered amount of LFG [m3y-1]
F = extraction rate of LFG [m3h
-1]
H = compressor yearly hours in operation [h]
[CH 4 ] = methane concentration in LFG [%]
8/13/2019 Comparison of Methane Emission Models to Methane Emission Measurements
http://slidepdf.com/reader/full/comparison-of-methane-emission-models-to-methane-emission-measurements 8/22
Page 8 of 22
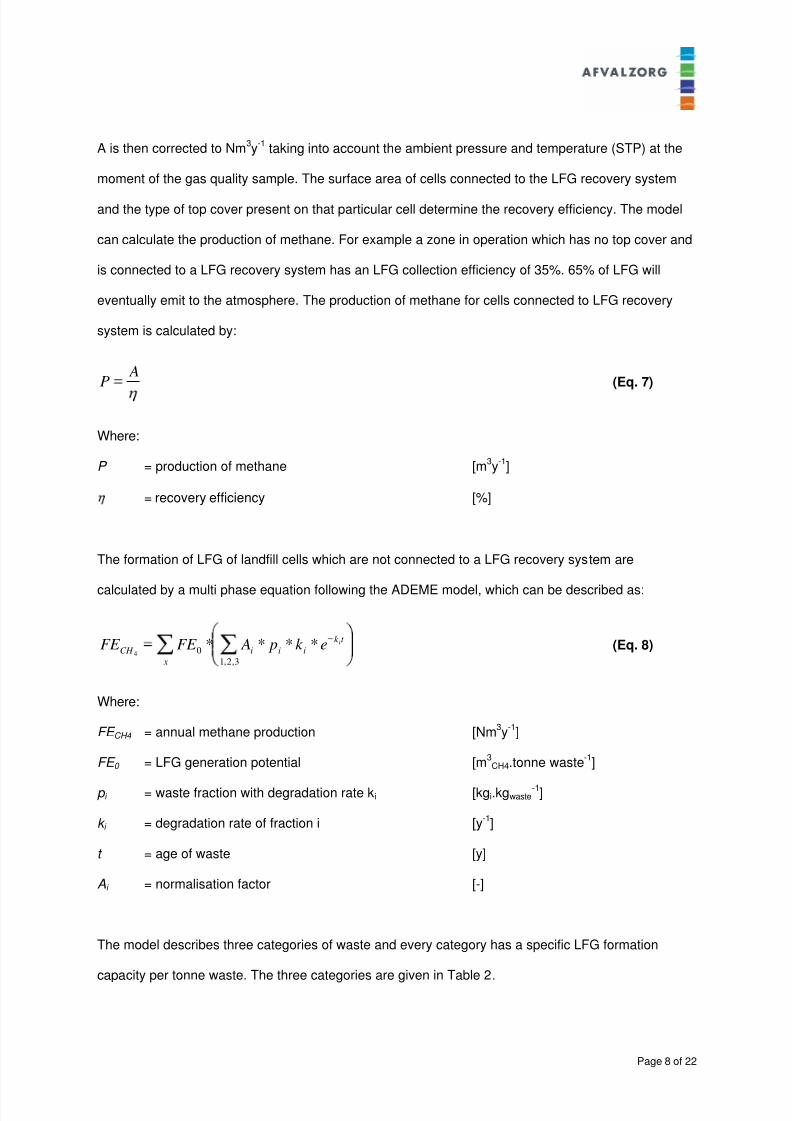
A is then corrected to Nm3y
-1 taking into account the ambient pressure and temperature (STP) at the
moment of the gas quality sample. The surface area of cells connected to the LFG recovery system
and the type of top cover present on that particular cell determine the recovery efficiency. The model
can calculate the production of methane. For example a zone in operation which has no top cover and
is connected to a LFG recovery system has an LFG collection efficiency of 35%. 65% of LFG will
eventually emit to the atmosphere. The production of methane for cells connected to LFG recovery
system is calculated by:
AP (Eq. 7)
Where:
P = production of methane [m3y
-1]
= recovery efficiency [%]
The formation of LFG of landfill cells which are not connected to a LFG recovery system are
calculated by a multi phase equation following the ADEME model, which can be described as:
3,2,1
0 ****
4
t k
iii
x
CH iek p AFE FE (Eq. 8)
Where:
FE CH4 = annual methane production [Nm3y
-1]
FE 0 = LFG generation potential [m3CH4.tonne waste
-1]
p i = waste fraction with degradation rate ki [kgi.kgwaste-1]
k i = degradation rate of fraction i [y-1]
t = age of waste [y]
Ai = normalisation factor [-]
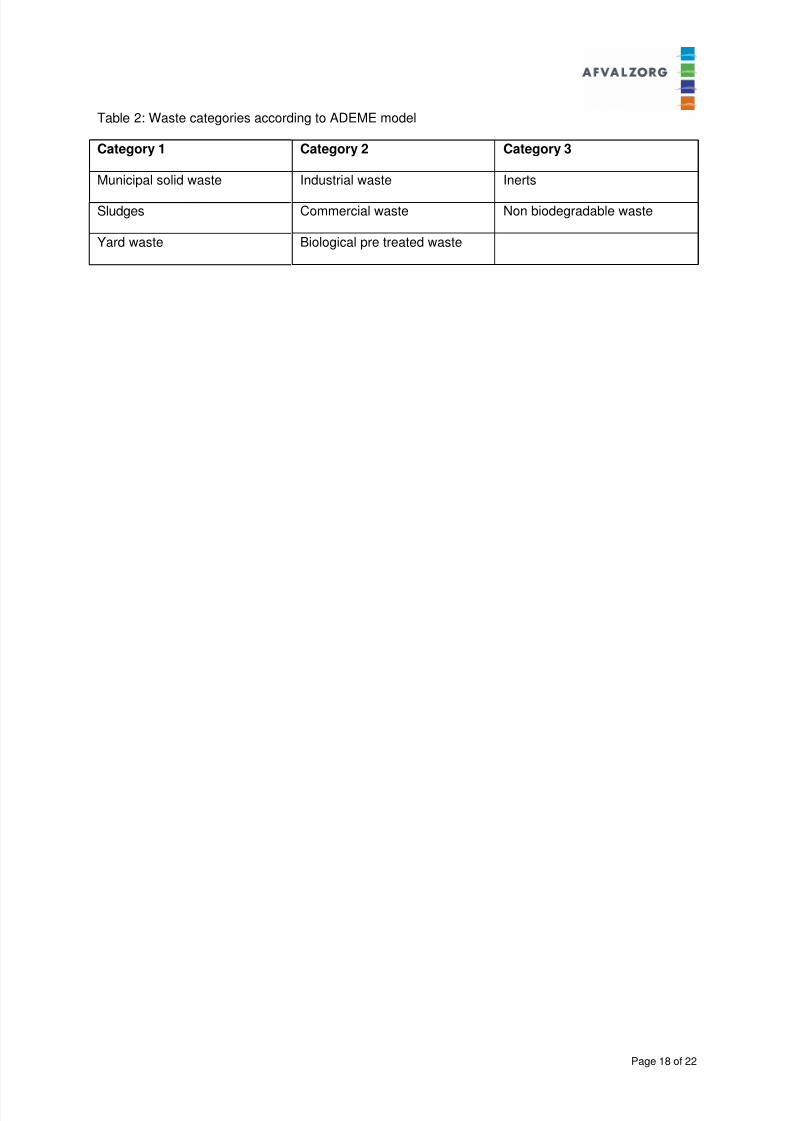
The model describes three categories of waste and every category has a specific LFG formation
capacity per tonne waste. The three categories are given in Table 2.
8/13/2019 Comparison of Methane Emission Models to Methane Emission Measurements
http://slidepdf.com/reader/full/comparison-of-methane-emission-models-to-methane-emission-measurements 9/22
Page 9 of 22
The EPER model assumes an oxidation capacity of the top cover of 10%. The total methane emission
is calculated by
CH4 emission = P(1- ) *0,9 + FE CH4 * 0,9 (Eq. 9)
EPER model Germany
The EPER model (Wielenga, 2003) used in Germany is a zero order model and can mathematically
be described by:
C DF BDC BDC M Me f ***** (Eq. 10)
Where:
Me = amount of diffuse methane emission [Mg.y-1
]
M = annual amount of land filled waste [Mg]
BDC = proportion of biodegradable carbon [MgC.Mg waste-1
]
BDC f = proportion of biodegradable C converted into LFG [%]
F = calculation factor of carbon converted into CH4 [-]
D = collection efficiency active degassing 0.4; no recovery 0.9;
active LFG recovery and cover 0.1
C = [CH4] [%]
LandGem US EPA
The US EPA model (US-EPA, 2001) is based on the LandGEM model and uses eq. 2, 4 and 5.
RESULTS CALCULATED METHANE EMISSIONS
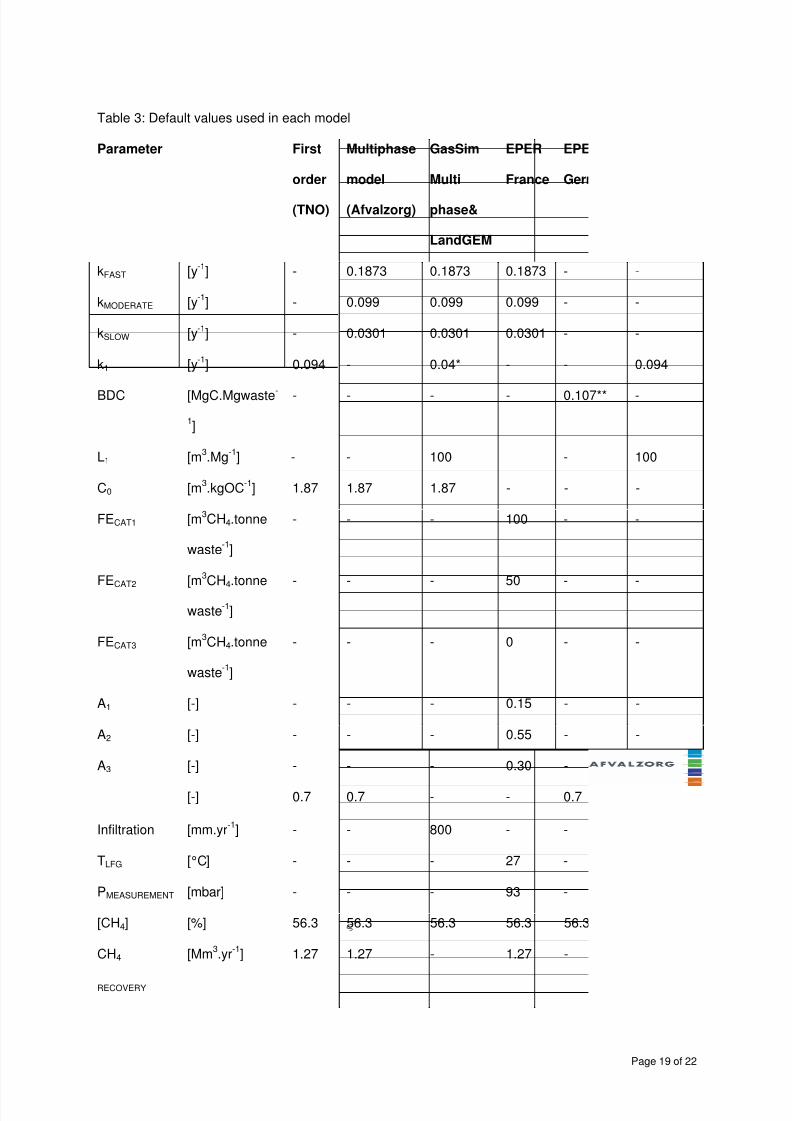
For comparable results the usage of equal values for every model is important. For instance, slight
variations in applied k values can have great influence on methane emissions calculated. Therefore
equal values based on the experience of the landfill operator were used for every model in which k
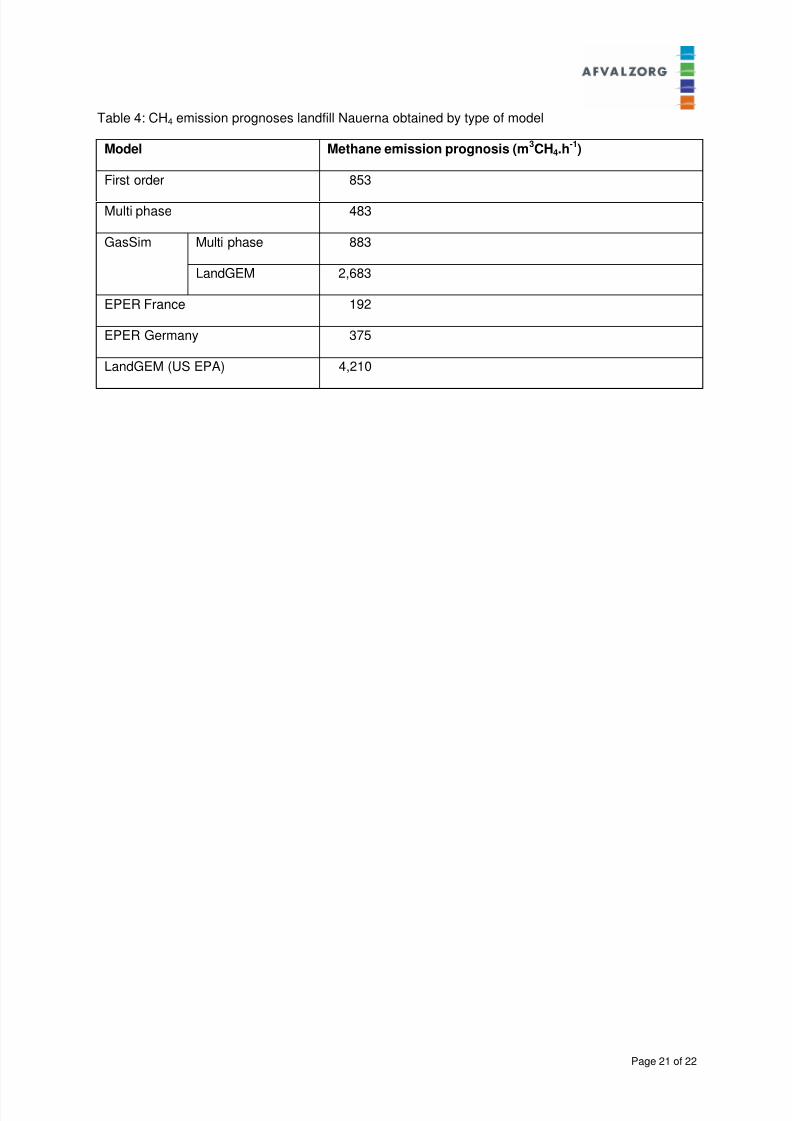
values could be altered. In Table 3 applied values for each model are shown. After data input each
model was run and prognoses were calculated. The results are given in Table 4. Results shown in
Table 4 reveal a huge variation in calculated methane emission. The difference between the largest
8/13/2019 Comparison of Methane Emission Models to Methane Emission Measurements
http://slidepdf.com/reader/full/comparison-of-methane-emission-models-to-methane-emission-measurements 10/22
Page 10 of 22
and smallest emission is 4,018 m3CH4.h
-1. The LandGEM models in both the GasSim as the US EPA
package calculate methane emissions which may be considered extremely high. The difference in
methane emissions between the two LandGEM models can be explained by the fact that LandGEM
US EPA assumes Municipal Solid Waste (MSW) as the total amount of waste land filled. MSW is
known to contain far more organic carbon and thus produce far more methane in comparison to waste
mixtures landfilled in the Netherlands. LandGEM in the GasSim package uses the waste composition
as shown in Table 1 and therefore takes into account the differences in organic carbon per waste
stream, which eventually degrades into methane. Furthermore GasSim LandGEM uses a lower value
for k1, which also results in a lower methane emission. Both factors explain the somewhat lower
methane emission calculated by GasSim in contrast to LandGEM (US EPA) model.
The lowest methane emission is calculated by the French EPER model, which is 192 m3CH4.h
-1.
The methane emissions calculated by the multi phase and German EPER model are comparable and
respectively 483 and 375 m3CH4.h
-1 which is rather remarkable. An earlier Dutch case study (Oonk et
al., 1994) showed a large mean relative error of 44% in methane production prognoses generated by
zero order models in contrast to first order and multi phase models.
Higher emissions of 853 and 965 m3CH4.h
-1are calculated by the first order and GasSim multi phase
model respectively. The higher calculated emission for the first order model can be explained by the
difference in the used amount of organic carbon in each specific waste stream. The model uses larger
amounts of organic carbon, which eventually degrade into methane and therefore the calculated
methane emission is also higher.
QUANTIFYING METHANE EMISSIONS
In 2001 and 2002 a large scale project was performed by several Dutch landfill owners in the
framework of the program Reductie Overige Broeikasgassen (Reduction other Greenhouse gasses)
(Scharff et al., 2003) at several landfills among which Nauerna. The project aimed at developing
simpler measurement techniques for methane emissions.
During the project three measurement techniques were used, which are:
Mobile Plume Measurement with Tuneable Diode Laser (TDL);
Stationary Plume Measurement (SPM) and
Mass Balance Measurement (MBM)
8/13/2019 Comparison of Methane Emission Models to Methane Emission Measurements
http://slidepdf.com/reader/full/comparison-of-methane-emission-models-to-methane-emission-measurements 11/22
Page 11 of 22
The mobile plume measurement technique is internationally accepted and gives an estimation of the
methane emission of a complete landfill site. In this method the methane concentration downwind of
the site is measured in a transect through the plume, that is composed by all the small methane
emission spots on the landfill surface. The concentration measurements are performed driving a
tuneable diode laser along a transect through the methane plume. A plume transect takes
approximately 5 to 7 minutes. For determination of the whole landfill emission 8 to 12 transects are
made. Due to fact that the emission of methane by degradation of waste will not be constant in time
and the short period of time of actual measuring, a TDL measurement only gives a good estimation of
the emission level on the day of measurement.
There is a similarity between the SPM and TDL measurement method. Both quantify methane
emissions by use of the downwind plume originating from the landfill site. The SPM uses four fixed
gasbag sampling stations around the landfill. Combining meteorological data and computer modelling
the four receptor stations can be activated whenever predicted methane concentrations surpass a
certain threshold level. Once activated, air samples are taken for a 30 minute period of time at two
computer selected stations. One station is activated for background methane concentrations and the
second station is activated to measure plume concentrations. The samples are analysed using the
GC-FID technique. A Gaussian model is used to calculate expected methane concentrations at the
receptor stations.
In the MBM a vertical methane concentration profile is measured along with a wind velocity profile.
The profiles are gathered by means of sampling points in a pole up to 26 meters in height. In order to
asses the temporal variation of the landfill methane emission a landfill is divided in several sections.
With changing wind directions the contribution of each sector to the methane emission of the landfill
can be assessed.
Both SPM and MBM measurement techniques can obtain an annual methane emission for a particular
landfill in contrast to the TDL technique. Both techniques have advantages and disadvantages and are
suitable in different situations. In combination the SPM and MBM techniques are complementary to
the TDL measurement technique and give more insight in the temporal variation of the emission
originating of the landfill.
8/13/2019 Comparison of Methane Emission Models to Methane Emission Measurements
http://slidepdf.com/reader/full/comparison-of-methane-emission-models-to-methane-emission-measurements 12/22
Page 12 of 22
RESULTS METHANE EMISSIONS MEASURED
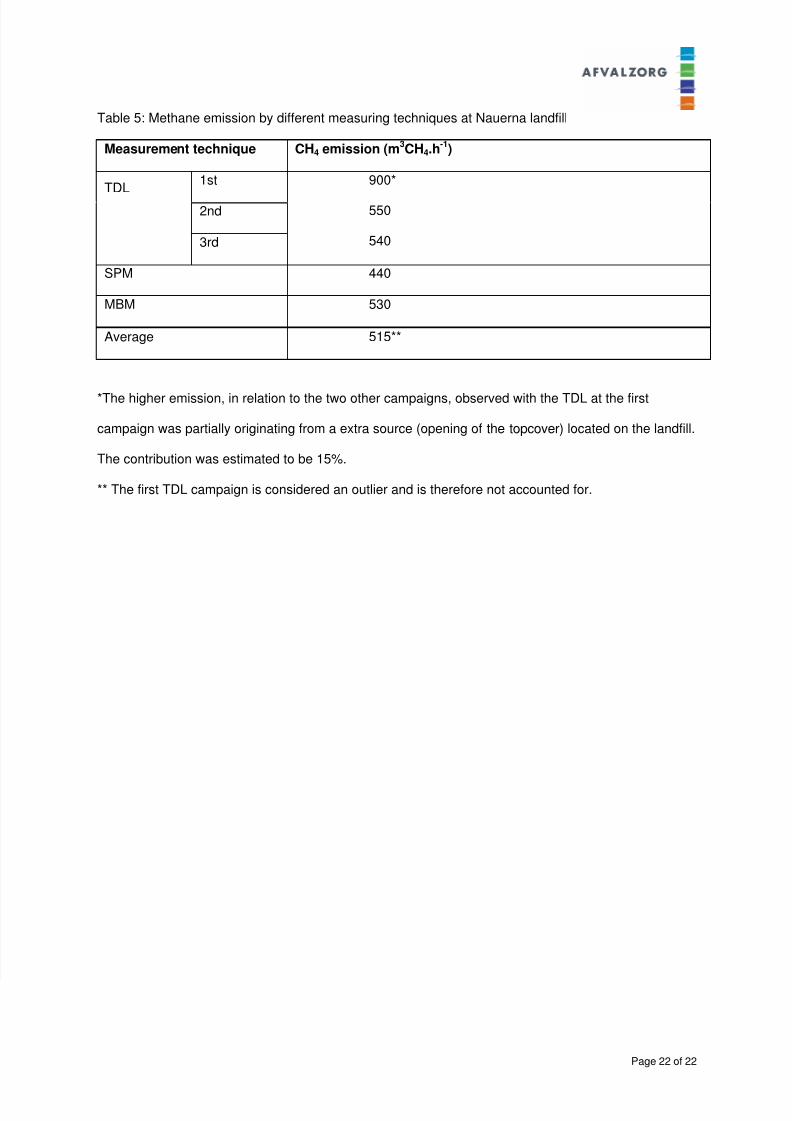
In total three TDL campaigns were carried out. The SPM and MBM were stationed at Nauerna during
8 weeks. Measured methane emission by different measuring techniques is presented in Table 5. The
results of the different methane measuring techniques are in the same order of magnitude. If the first
TDL campaign is considered an outlier and omitted, the average measured emission of Nauerna for
2001 is 515 m3CH4.h
-1.
DISCUSSION
The comparison in this case study is based on one landfill site. It is possible that this landfill site is not
representative. This case study clearly shows a huge difference in methane emission prognoses
obtained from six different methane emission models. In comparison to the average measured
methane emission of a single landfill the first order (TNO), GasSim multi phase, the LandGEM and
LandGEM US EPA model seem to overestimate the methane emission. The multi phase (Afvalzorg),
German EPER and French EPER model seem to have a tendency to underestimate methane
emissions at Nauerna.
The largest deviation between measured and calculated methane emission is 3,695 m3CH4.h
-1 and
was calculated by LandGEM (US EPA). The assumption in the model, that the total amount of land
filled waste is MSW, does not represent the waste mixture of Nauerna. The smallest deviation
between measured and calculated emission is only 31 m3CH4.h
-1 and was calculated by the multi
phase model of Afvalzorg. The applied values as shown in Table 3 used in the multi phase model
describes the methane emission at Nauerna fairly accurate, but may be inaccurate for other landfills.
The first order TNO model calculates a methane emission that is 370 m3CH4.h
-1larger than the multi
phase model (Afvalzorg). This is remarkable as an earlier study (Oonk et al., 1994) showed good
agreement between a first order and multi phase model. One must keep in mind that the similar
results were found on landfills before 1994 and could resemble MSW more than Nauerna in 2001. The
first order model does not take into account the difference in readily and slowly degrading carbon. And
the used amount of organic carbon per waste stream differs from the applied values (Table 1) by the
Afvalzorg multi phase model. Therefore the model could calculate a larger methane emission and
show a larger deviation with respect to the measured emission of this particular site.
8/13/2019 Comparison of Methane Emission Models to Methane Emission Measurements
http://slidepdf.com/reader/full/comparison-of-methane-emission-models-to-methane-emission-measurements 13/22
Page 13 of 22
GasSim (multi phase) seems to overestimate the methane emission by 368 m3CH4.h
-1. It was not
possible to describe the waste composition in the GasSim model. This resulted in a higher amount of
degradable organic carbon than actually present and consequently a higher methane emission. With
GasSim it is very difficult to come to a waste mixture which represents the case at Nauerna, i.e. poor
in organic waste. In order to use the package application of default waste mixtures was inevitable.
This will represent a British waste mixture and clearly not the waste mixture at Nauerna. Furthermore
a considerable amount of industrial waste (585,533 tonnes until 2002) is landfilled at Nauerna.
Industrial waste does contain a certain amount of organic carbon. In case large quantities are involved
it contributes significantly to the formation of methane and to the methane emission of the landfill.
However in the GasSim model, industrial waste does not contain any organic carbon. Instinctively
methane emission should even be higher than the presented emission in this study, as the methane
contribution due to industrial waste is disregarded.
The French EPER model seems to underestimate the methane emission by 323 m3CH4.h
-1. The
model calculates an average LFG production of 7.68 m3.(tonne waste.y)
-1 for category 1 waste, which
seems low. Also the second category produces a rather small amount of LFG, namely 3.84 m3.(tonne
waste.y)-1
. In addition the model has a fixed extraction rate for the landfill cells that are connected to a
gas extraction system. And the production is calculated by means of the extraction not the available
organic carbon. Because the Nauerna landfill has a large surface, a limited depth and a low organic
carbon content it is extremely difficult to design an efficient extraction system and simultaneously
prevent intake of atmospheric air. The extraction efficiency at Nauerna landfill is approximately 20%.
This is much lower than the 65% in the French model. This results in a lower total methane emission
and the underestimation by the ADEME model.
A 140 m3CH4.h
-1 deviation is obtained with the German EPER model. This model seems to
underestimate methane emissions. As mentioned earlier zero order models appeared not to describe
methane formation very accurately. Nevertheless the German EPER model in this case study gives a
rather good approximation of the methane emission in contrast to several more complex models. One
must bear in mind that this may be a good approximation for operational landfills. But once a landfill is
closed a zero order model calculates a constant production or emission. This is in contradiction with
reality as the evidence that LFG production decreases after closure of a landfill is overwhelming.
8/13/2019 Comparison of Methane Emission Models to Methane Emission Measurements
http://slidepdf.com/reader/full/comparison-of-methane-emission-models-to-methane-emission-measurements 14/22
Page 14 of 22
CONCLUSION AND RECOMMENDATION
The intention of the UN-PRTR s and E-PRTR s is to disclose emission data to the general public and
the regulators. In itself this is a positive trend. We should however bear in mind that a number in a
database represents the absolute truth in the eyes of the reader. There is no room for explanation
what the number means or caution about its accuracy.
The huge differences in results indicate that current models do not supply a reliable tool to estimate
landfill methane emissions. It can not be concluded that the minimum accuracy has been achieved
that might be considered necessary before admission in a database can be regarded useful. The
authors do not consider it useful or fair to compile and compare data that have such an incomparable
origin.
The difference in results between the various measurement techniques is smaller than between the
different models. A further development of these techniques may provide a more reliable tool in the
near future than modelling.
The comparison has however been made for one landfill. This site may not be representative. It is
recommended that more data sets are compared before a draft guidance model is proposed in the
Netherlands. It is also recommended that an attempt is made to harmonise the different existing
models in order to enable a fair review of the future methane emission data reported to UN- or
E-PRTR s.
8/13/2019 Comparison of Methane Emission Models to Methane Emission Measurements
http://slidepdf.com/reader/full/comparison-of-methane-emission-models-to-methane-emission-measurements 15/22
Page 15 of 22
REFERENCES
Budka, A. (2003) personal communication.
Gregory, R.G., G.M. Attenborough, D.C. Hall, C. Deed, 2003. The validation and development of an
integrated landfill gas risk assessment model GasSim, Sardinia Proceedings 2003, Cagliari, Italy.
Hensen, A., 1997. Evaluatie van de methaanemissie van de deponie bij Nauerna en Hollandse Brug,
ECN Report ECN-C--97-062 (in Dutch), Petten, Netherlands.
Hensen, A., 1998. Validatie van de methaanemissiereductie op stortplaats Nauerna, ECN Report
ECN-C--98-052 (in Dutch), Petten, Netherlands.
Hensen, A., 2000a. Methaanemissie van de deponie bij Nauerna, ECN Report ECN-C--00-056 (in
Dutch), Petten, Netherlands.
Hensen, A., 2000b. Evaluatie van de methaanemissie van de deponie Braambergen, ECN Report
ECN-C--00-006 (in Dutch), Petten, Netherlands.
Huitric R., R. Soni, 1997. Making the most of LFG projection models, Proceedings from SWANA's 20th
annual LFG symposium, Monterey California, USA.
Oonk, J., A. Weenk, O. Coops, L. Luning, 1994. Validation of landfill gas formation models. NOVEM
Programme Energy Generation from Waste and Biomass (EWAB), TNO report 94-315, Apeldoorn,
Netherlands.
Oonk, J., A. Boom, 1995. Landfill gas formation, recovery and emissions. NOVEM Programme Energy
Generation from Waste and Biomass (EWAB), TNO report R95-203, Apeldoorn, Netherlands.
8/13/2019 Comparison of Methane Emission Models to Methane Emission Measurements
http://slidepdf.com/reader/full/comparison-of-methane-emission-models-to-methane-emission-measurements 16/22
8/13/2019 Comparison of Methane Emission Models to Methane Emission Measurements
http://slidepdf.com/reader/full/comparison-of-methane-emission-models-to-methane-emission-measurements 17/22
Page 17 of 22
Table 1: Age and amount of waste landfilled at Nauerna landfill (tonnes).
Year Soil &
Gravel
Construction
& demolition
waste
Commercial
waste
Shredder
waste
Street
cleansing
waste
Coarse
Household
waste
Sewage
sludge
Annual
Total
1985 238,765 3,227 53,153 2,695 3,601 1,223 10,347 313,011
1986 358,148 4,841 79,729 4,044 5,400 1,835 15,521 469,518
1987 425,061 7,239 119,225 6,047 8,076 2,743 23,210 591,601
1988 514,590 10,858 178,836 9,070 12,115 4,115 34,815 764,399
1989 306,198 13,820 110,098 28,366 15,420 872 34,050 508,824
1990 188,314 8,914 110,836 9,442 12,930 51,398 55,762 437,596
1991 217,746 7,794 121,350 5,436 21,534 61,915 34,824 470 ,599
1992 290,651 27,137 138,885 1,943 10,563 20,329 53,467 542,975
1993 243,840 66,810 151,971 28,005 25,339 12,201 117,386 645,552
1994 239,961 55,385 72,313 27,596 29,807 10,563 161,345 596,970
1995 309,100 72,950 76,022 35,663 25,426 5,941 136,718 661,820
1996 188,629 29,945 41,559 26,020 11,885 116 43,308 341,462
1997 130,545 22,769 26,340 17,980 8,319 0 25,970 231,923
1998 207,571 83,836 40,359 27,861 13,645 16,688 29,381 419,341
1999 374,714 47,273 64,524 35,590 13,023 2,707 28,356 566,187
2000 461,598 48,802 48,197 40,518 10,939 15,856 16,995 642,905
2001 590,204 56,227 49,878 39,183 5,116 18,805 6,540 765,953
2002 415,807 17,506 9,390 30,630 2,597 770 3,604 480,305
Total 5,701,442 585,333 1,492,665 376,089 235,735 228,077 831,599 9,450,9 41
8/13/2019 Comparison of Methane Emission Models to Methane Emission Measurements
http://slidepdf.com/reader/full/comparison-of-methane-emission-models-to-methane-emission-measurements 18/22
Page 18 of 22
Table 2: Waste categories according to ADEME model
Category 1 Category 2 Category 3
Municipal solid waste Industrial waste Inerts
Sludges Commercial waste Non biodegradable waste
Yard waste Biological pre treated waste
8/13/2019 Comparison of Methane Emission Models to Methane Emission Measurements
http://slidepdf.com/reader/full/comparison-of-methane-emission-models-to-methane-emission-measurements 19/22
Page 19 of 22
Table 3: Default values used in each model
Parameter First
order
(TNO)
Multiphase
model
(Afvalzorg)
GasSim
Multi
phase&
LandGEM
EPER
France
EPER
Germany
LandGEM
(US-EPA)
kFAST [y-1] - 0.1873 0.1873 0.1873 - -
kMODERATE [y-1
] - 0.099 0.099 0.099 - -
kSLOW [y-1] - 0.0301 0.0301 0.0301 - -
k1 [y-1
] 0.094 - 0.04* - - 0.094
BDC [MgC.Mgwaste-
1]
- - - - 0.107** -
L1 [m3.Mg
-1] - - 100 - 100
C0 [m3.kgOC
-1] 1.87 1.87 1.87 - - -
FECAT1 [m3CH4.tonne
waste-1
]
- - - 100 - -
FECAT2 [m3CH4.tonne
waste-1]
- - - 50 - -
FECAT3 [m3CH4.tonne
waste-1
]
- - - 0 - -
A1 [-] - - - 0.15 - -
A2 [-] - - - 0.55 - -
A3 [-] - - - 0.30 - -
[-] 0.7 0.7 - - 0.7 -
Infiltration [mm.yr-1
] - - 800 - - -
TLFG [°C] - - - 27 - -
PMEASUREMENT [mbar] - - - 93 - -
[CH4] [%] 56.3 56.3 56.3 56.3 56.3 -
CH4
RECOVERY
[Mm3.yr
-1] 1.27 1.27 - 1.27 - -
8/13/2019 Comparison of Methane Emission Models to Methane Emission Measurements
http://slidepdf.com/reader/full/comparison-of-methane-emission-models-to-methane-emission-measurements 20/22
Page 20 of 22
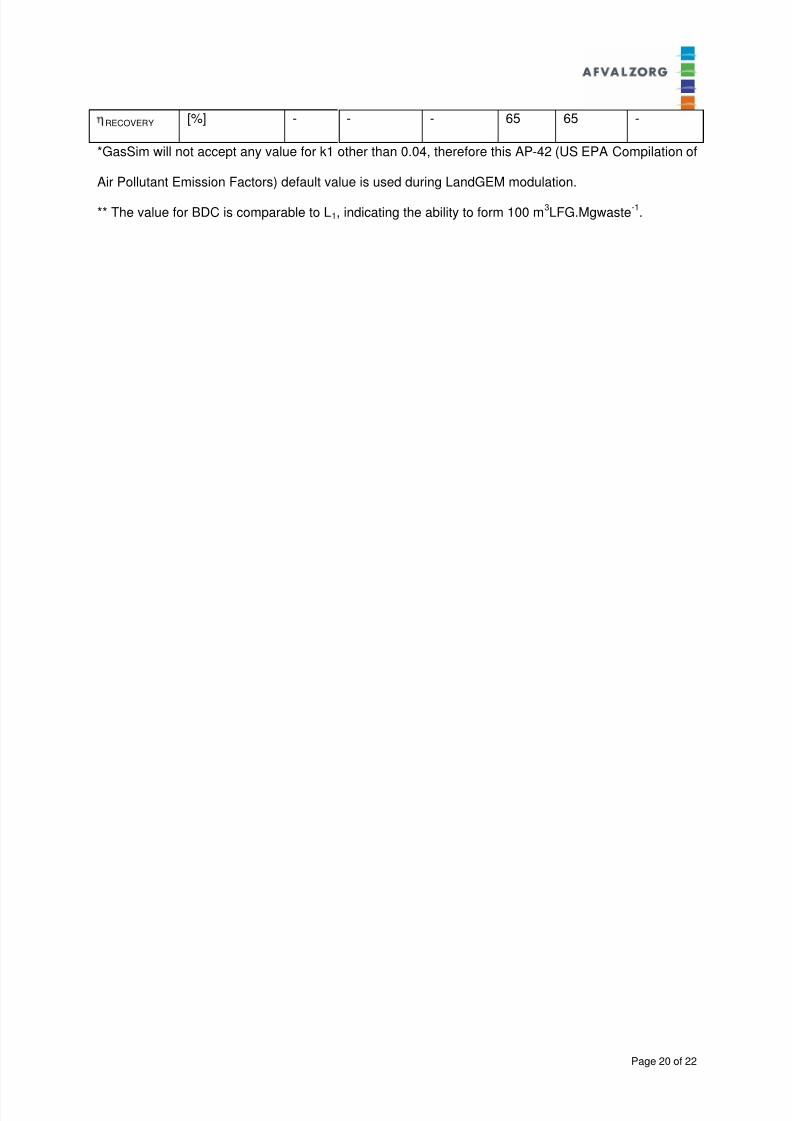
RECOVERY [%] - - - 65 65 -
*GasSim will not accept any value for k1 other than 0.04, therefore this AP -42 (US EPA Compilation of
Air Pollutant Emission Factors) default value is used during LandGEM modulation.
** The value for BDC is comparable to L1, indicating the ability to form 100 m3LFG.Mgwaste
-1.
8/13/2019 Comparison of Methane Emission Models to Methane Emission Measurements
http://slidepdf.com/reader/full/comparison-of-methane-emission-models-to-methane-emission-measurements 21/22
Page 21 of 22
Table 4: CH4 emission prognoses landfill Nauerna obtained by type of model
Model Methane emission prognosis (m3CH4.h
-1)
First order 853
Multi phase 483
Multi phase 883 GasSim
LandGEM 2,683
EPER France 192
EPER Germany 375
LandGEM (US EPA) 4,210
8/13/2019 Comparison of Methane Emission Models to Methane Emission Measurements
http://slidepdf.com/reader/full/comparison-of-methane-emission-models-to-methane-emission-measurements 22/22
Table 5: Methane emission by different measuring techniques at Nauerna landfill
Measurement technique CH4 emission (m3CH4.h
-1)
1st
2nd
TDL
3rd
900*
550
540
SPM 440
MBM 530
Average 515**
*The higher emission, in relation to the two other campaigns, observed with the TDL at the first
campaign was partially originating from a extra source (opening of the topcover) located on the landfill.
The contribution was estimated to be 15%.
** The first TDL campaign is considered an outlier and is therefore not accounted for.