Clemson University TigerPrints All eses eses 5-2010 COMPARISON OF RNA QUALITY FROM STRESSED AND UNSTRESSED RECOMBINANT ESCHERICHIA COLI Mary alice Salazar Clemson University, [email protected]Follow this and additional works at: hps://tigerprints.clemson.edu/all_theses Part of the Analytical Chemistry Commons is esis is brought to you for free and open access by the eses at TigerPrints. It has been accepted for inclusion in All eses by an authorized administrator of TigerPrints. For more information, please contact [email protected]. Recommended Citation Salazar, Mary alice, "COMPARISON OF RNA QUALITY FROM STRESSED AND UNSTRESSED RECOMBINANT ESCHERICHIA COLI" (2010). All eses. 768. hps://tigerprints.clemson.edu/all_theses/768
Transcript
Clemson UniversityTigerPrints
All Theses Theses
5-2010
COMPARISON OF RNA QUALITY FROMSTRESSED AND UNSTRESSEDRECOMBINANT ESCHERICHIA COLIMary alice SalazarClemson University, [email protected]
Follow this and additional works at: https://tigerprints.clemson.edu/all_theses
Part of the Analytical Chemistry Commons
This Thesis is brought to you for free and open access by the Theses at TigerPrints. It has been accepted for inclusion in All Theses by an authorizedadministrator of TigerPrints. For more information, please contact [email protected].
Recommended CitationSalazar, Mary alice, "COMPARISON OF RNA QUALITY FROM STRESSED AND UNSTRESSED RECOMBINANTESCHERICHIA COLI" (2010). All Theses. 768.https://tigerprints.clemson.edu/all_theses/768
COMPARISON OF RNA QUALITY FROM STRESSED AND UNSTRESSED RECOMBINANT ESCHERICHIA COLI
A Thesis Presented to
the Graduate School of Clemson University
In Partial Fulfillment of the Requirements for the Degree
Master of Science Chemistry
by Mary Alice Salazar
May 2010
Accepted by: Sarah W. Harcum, Committee Chair
Kenneth Christensen George Chumanov
ii
ABSTRACT
High quality, intact RNA is required for DNA microarray studies, cloning, and
reverse transcriptase polymerase chain reaction (rt-PCR) analysis. There are several
analytical methods used to assess the RNA quality. The RNA Integrity Number (RIN)
from the Agilent Bioanalyzer is one quality control assay used to evaluate RNA. For
recombinant E. coli cultured under stressful conditions the RNA profiles obtained using
the Agilent Bioanalyzer indicate RNA degradation; however, RNA obtained and purified
in parallel from unstressed recombinant cultures indicate acceptable RNA values without
significant degradation. We proposed that for stressed E. coli the RIN value is not
necessarily indicative of RNA purification-related degradation but could be used as a tool
to characterize and detect stressful culture conditions that target ribosomal RNA. Also,
these results suggest the need for caution when assessing RNA quality based on
ribosomal RNA abundance in stressed cells.
iii
DEDICATION
I dedicate this work to my parents.
iv
ACKNOWLEDGMENTS
The TV1PGFP plasmid was generously provided by E. Garcia-Fruitos and A.Villaverde,
Universitat Autònoma de Barcelona. The GFPbrightCAT plasmid was constructed by M.T.
Morris, Clemson University. The pTrcHis-GFPUV/CAT plasmid was donated by W.E.
Bentley, University of Maryland. I thank N. Vyavahare, Clemson University, for the use
of the Agilent Bioanalyzer 2100. My thanks also go to Lawrence Fernando, for his
generous contributions to this work.
v
TABLE OF CONTENTS
Page
TITLE PAGE....................................................................................................................i ABSTRACT.....................................................................................................................ii DEDICATION................................................................................................................iii ACKNOWLEDGMENTS ..............................................................................................iv LIST OF FIGURES ........................................................................................................vi CHAPTER I. INTRODUCTION .........................................................................................1 II. METHODS ....................................................................................................3 III. RESULTS AND DISCUSSION....................................................................5 REFERENCES ..............................................................................................................13
vi
LIST OF FIGURES
Figure Page 1.1 Growth curves for synchronized recombinant cultures of E. coli .................9 2.1 Representative electropherograms for total RNA........................................10 3.1 Gel electrophoresis images of ribosomal RNA from E. coli MG1655........12
CHAPTER ONE
INTRODUCTION
DNA microarrays are a powerful tool for analyzing global gene expression in
cells. Typically, the total RNA is purified from the cells to remove DNA, proteins, and
other cellular components. For prokaryotic organisms, most isolation methods target
purification of the total RNA, which includes the messenger RNA (mRNA) species, from
the cells since most prokaryotic mRNA lacks a stable poly(A) tail.[11] The quality and
relative concentration of the purified total RNA can be evaluated by a variety of methods.
The most common RNA analysis methods are absorbance and electrophoresis separation.
Absorbance methods use characteristic wavelengths to indicate purity and concentration,
but cannot distinguish the RNA species.[30] Electrophoresis methods use the electrical
charge of the RNA to separate the RNA molecules by apparent size, and fluorescent dye
staining to visualize the RNA species.[21, 30] The Agilent Bioanalyzer uses an
electrophoresis-based method to generate an electropherogram and a simulated gel
image. The electropherogram provides an RNA intactness assessment, the RNA
Integrity Number (RIN), to evaluate the RNA intactness.[19, 31] The RIN value is
calculated from the proportion of expected RNA fragment sizes and is independent of
sample concentration.[19, 31] Low RIN values are usually attributed to RNA
degradation during the purification steps, where these detailed studies have mostly
focused on eukaryotic RNA.[3, 10, 16, 19, 31]
It has also been observed that ribosomal RNA levels decrease due to recombinant
protein expression in Escherichia coli.[5, 14, 23, 28, 35, 36] In Wood and Peretti (1991),
2
the overexpression of β-galactosidase decreased ribosomal RNA levels up to 4-fold.[36]
In Haddadin and Harcum (2005), it was observed that the mRNA species encoding for
the ribosomal RNA species decreased 5.7-fold due to chloramphenicol acetyl-transferase
(CAT) expression.[14] Additionally, Richins, et al. (2001) observed decreased cellular
ribosomal RNA content during protein overexpression.[28] These results from multiple
researchers indicate that ribosome degradation occurs due to the stress of recombinant
protein expression, which could confound RNA assessment methods that rely on
ribosomal RNA abundance.
The objective of this study was to examine the quality of total RNA obtained from
recombinant E. coli cultured under stressful conditions. In this study, total RNA was
purified from E. coli using standard RNA purification techniques. Recombinant cells
expressing either an insoluble-prone protein or a soluble protein were examined. Total
RNA was evaluated by standard absorbance techniques and by the Agilent Bioanalyzer
(2100) assay using the Prokaryotic Total RNA Nano software. It was observed the total
RNA profiles for cells expressing the insoluble protein were significantly different from
the cells expressing the soluble protein. Additionally, the RNA profiles for cell lines
expressing the insoluble protein changed quickly after recombinant protein expression
was induced. These results indicate that the Agilent Bioanalyzer can be used to detect
stressful culture conditions that target ribosomal RNA degradation.
3
CHAPTER TWO
METHODS
E. coli MG1655 were transformed with either pTV1PGFP or pGFPbrightCAT
plasmids. Both plasmids are isopropyl β-D thiogalactopyranoside (IPTG; Anatrace)
inducible via a trc promoter and carry ampicillin resistance. The pTV1PGFP plasmid
(donated by A. Villaverde[13]) encodes for a fusion protein which contains the VP1
capsid protein from the Foot and Mouth Disease Virus[25] fused to a GFP protein.[13]
The GFPbrightCAT plasmid was constructed by replacing the GFPuv with the GFP from
pTV1PGFP into the pTrcHis-GFPUV/CAT plasmid (donated by W.E. Bentley[9]). The
GFP substitution primers used were Forward: 5’ GATC CAT ATG AGC AAA GGA
GAA GAA CTT TTC 3’ and Reverse: 5’ GATC CAT ATG T TGT AGA GCT CAT
CCA TGC CAT GTG TAA TCC 3’. CAT overexpression was confirmed by growth on
high-levels of chloramphenicol (0.12 – 0.61 mM) containing plates and the CAT activity
assay.[29, 33] GFP expression was confirmed by obtaining fluorescence emission
2nm slits). Insoluble protein expression of pTV1PGFP was confirmed by fluorescence
microscopy (Nikon Ti, 60X TIRF oil).[12]
Cells were cultured in a minimal media described previously.[20, 32] Frozen E.
coli (1 mL) were added to minimal media in the presence of ampicillin (40 µg/mL,
Hyclone),[30] and cultivated overnight at 37°C, 250 rpm (New Brunswick Scientific,
C24 incubator shaker) to an optical density of 2.5 OD. E. coli pCATbrightGFP and
pTV1PGFP (10% inoculums) were added to 500 mL shake flasks (120 mL working
4
volume) at 37°C in a water bath shaker at 200 rpm (New Brunswick Scientific, C76
incubator shaker). Cell growth was monitored by optical density (OD600) using a
spectrophotometer (Spectronic 20 Genesys). Samples were diluted with deionized water
to obtain absorbances the linear range (0–0.25 OD units), and deionized water was used
as the blank for all readings.
The synchronized cultures were induced (1 mM IPTG) in the mid-exponential
phase (OD600 = 0.5). Parallel non-induced cultures were run as controls. Samples were
collected prior to induction (Time 0) and 5, 20, 40, and 60 minutes post-induction for the
induced cultures and at a synchronized Time 0 and 60 minutes for the non-induced
cultures. Samples were immediately added to RNAProtect Bacteria Reagent (Qiagen)
and processed as per manual instructions. To assure sufficient material for the total RNA
isolation was collected, 2 and 4 mL broth samples were collected for the 0 to 40 time
points, and 1 and 2 mL broth samples were collected for the 60 minute time points.
Pellets were stored in -80˚C until used for RNA isolation. All culture conditions were
conducted in biological triplicates.
Total RNA was isolated using the RNAeasy Bacteria Kits (Qiagen, Mini kits
and/or Midi kits were used depending on the cell numbers to be processed). RNA was
quantified by a Nanodrop spectrophotometer (ND 1000, Thermo Scientific). To obtain
greater than 10 µg total RNA for further DNA microarray analysis, both collected sample
volumes were processed separately. No significant differences in RIN values were
observed between the smaller and larger sample volumes. The Agilent Bioanalyzer was
used to assess the total RNA quality as per manual instruction (Agilent).
5
CHAPTER THREE
RESULTS AND DISCUSSION
The objective of the overall study was to investigate the transcriptional
differences between E. coli cells expressing an insoluble protein versus a soluble protein.
Cytoplasmic inclusion bodies in E. coli are described as refractive, insoluble protein
aggregates that are sometimes partially active polypeptides.[7, 18, 24, 26, 27, 34] Recent
studies have shown that stress responses, including a heat-shock-like response, is up-
regulated during expression of inclusion body proteins.[2, 22] For example, Lesley et al.
(2002) noted that inclusion body formation at normal culture temperatures resulted in
increased heat-shock gene expression levels one hour post-induction, while soluble
proteins did not.[22]
To better study the transcriptional response, total RNA was isolated from cells
over time for cells expressing either a soluble or an insoluble protein and for non-induced
cells. Total RNA was isolated from the synchronized cultures expressing either the
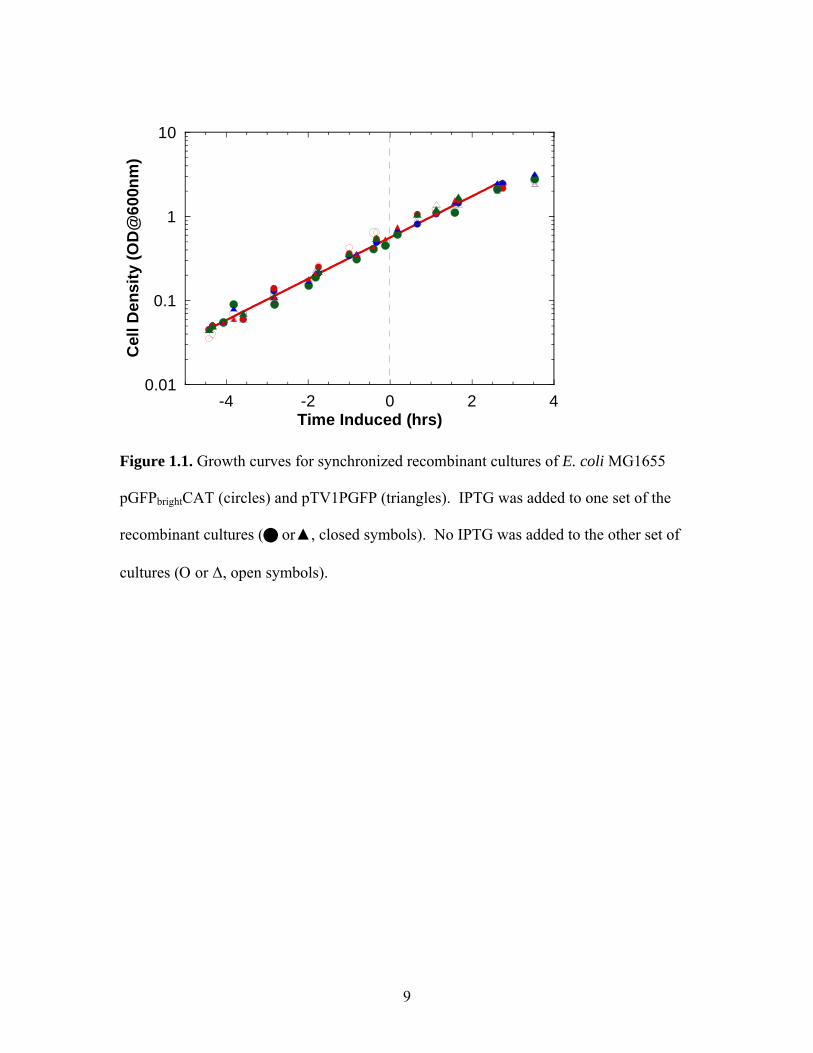
soluble protein GFPbrightCAT or inclusion-body prone protein TV1PGFP. The growth
profiles for these cultures are shown in Figure 1, and includes both the induced and non-
induced cultures. Each culture condition was conducted in triplicate. The culture times
have been aligned to the induction time of the induced cultures, which corresponds to a
cell density of approximately 0.5 OD. Samples for the total RNA purification were taken
just prior to induction (non-induced) and 5, 20, 40, and 60 minutes post-induction. All
samples were taken in exponential growth phase, and the addition of the inducer (IPTG)
did not significantly alter the growth rate of the induced cultures compared to the non-
6
induced cultures, as shown by the solid line passing through the growth data in Figure 1.
Recombinant protein expression in cultures was verified separately (results not shown).
Interestingly, the growth rates for the cultures expressing either the soluble or insoluble
protein are also not different.
Once the total RNA was purified, it was quantified using a Nanodrop
spectrophotometer. The 260/280 nm and the 260/230 nm ratios indicate that cellular
contaminates had been sufficiently removed (> 2.0) and that the purity was sufficient (2.0
to 2.2), respectively, from all samples.[1, 4] Total RNA was then examined using the
Agilent Bioanalyzer for all samples, including all biological triplicates. Despite the
acceptable Nanodrop 260/280 and 260/230 ratios, we were surprised to see RIN values
indicated the degradation of RNA for most samples.[19, 31] Detailed examination of the
samples indicated that all the non-induced culture samples had acceptable RIN values and
electropherograms, whereas the cultures induced to express the insoluble protein
TV1PGFP had the lowest RIN values. Representative electropherograms for the non-
induced and IPTG-induced cultures are shown in Figure 2. An E. coli pTV1PGFP non-
induced sample (panel A) and a 60-minute post-induction sample (panel B) are shown in
Figure 2, and highlight the dramatic decrease in the 23S and 16S rRNA peaks for
induced samples relative to non-induced samples. Interestingly, for the pGFPbrightCAT
expressing cultures, the rRNA peaks were not significantly affected by induction in
contrast to what was observed for E. coli pTV1PGFP. To summarize the RIN value
change due to induction of the insoluble protein, the average and standard deviations are
also shown in Figure 2 (panel C). The data for the expression of the soluble protein
7
(GFPbrightCAT) suggest the RIN value initially decreased; however not significantly. In
contrast, the expression of the insoluble protein (TV1PGFP) significantly decreased the
RIN values. Additionally, since the cell samples were immediately stabilized in
RNAProtect upon removal from shake flasks, and the rRNA peak differences are
observed only between non-induced and induced cultures, these results indicated that the
observed ribosomal RNA degradation occurred inside the cell and not during RNA
purification processes. Moreover, the RNA profile decreased for all of the induced
pTV1PGFP samples, including the 5-minute post-induction, indicates that the
intracellular ribosomal RNA degradation occurred quickly post-induction and
significantly faster than complete cellular turnover.
In a related study, we previously observed changes in the ribosomal RNA profiles
for heat-shocked E. coli MG1655 pPROEx-CAT, where the expressed protein (CAT) was
a soluble protein. In this previous study, the cells were subjugated to either a heat-shock
or a dual heat-shock and induction (5 mM IPTG). The mRNA from the heat-shocked
cultures was used for DNA microarray analysis without issue.[14] Figure 3 shows the
rRNA bands for both the heat-shocked and dual heat-shocked induced cultures using a
conventional gel electrophoresis separation of the total RNA: Note the shift in the 16S
rRNA band and the prominent third band. In comparison, rRNA bands obtained from
IPTG-treated wild-type,[14] IPTG-induced recombinant,[17] and serine hydroxamate-
treated recombinant cultures[15] are also shown in Figure 3, where the total RNA was
prepared by the same method for all these samples.[14, 15, 17] The 23S and 16S rRNA
bands for the IPTG-treated wild-type, IPTG-induced recombinant, and serine
8
hydroxamate-treated recombinant cultures are clearly visible and at the expected
migration distances. Additionally, it is known that insoluble protein overexpression and
the heat-shock response share many common characteristics.[2, 22] The rRNA gel
profiles obtained for the heat-shocked cultures and the Agilent Bioanalyzer RNA profiles
obtained for the insoluble protein expressing cultures taken together indicate that in vivo
ribosomal RNA can be significantly affected by cell stress. The RIN values and
electropherograms may provide an additional benchmark assay to evaluate the cellular
stress response in recombinant E. coli to complement current fluorescence and gel
electrophoresis methods for assessing intracellular RNA quality.
9
0.01
0.1
1
10
-4 -2 0 2 4
Cel
l Den
sity
(OD
@60
0nm
)
Time Induced (hrs)
Figure 1.1. Growth curves for synchronized recombinant cultures of E. coli MG1655
pGFPbrightCAT (circles) and pTV1PGFP (triangles). IPTG was added to one set of the
recombinant cultures ( or▲, closed symbols). No IPTG was added to the other set of
cultures (Ο or ∆, open symbols).
10
Figure 2.1. Representative electropherograms for total RNA obtained from E. coli
pTV1PGFP for non-induced (A) and induced (B) samples. Peaks for the dye (d), 16S
rRNA and 23S rRNA are labeled. The peak intensities, measured in fluorescence units
(FU), have been scaled relative to each other to aid comparison. (C) Average RIN values
11
for induced E. coli MG1655 pGFPbrightCAT (circles) and pTV1PGFP (triangles). Data
presented as mean + sd.
12
Figure 3.1. Gel electrophoresis images of ribosomal RNA from E. coli MG1655. Lane A
is rRNA from an IPTG-treated wild-type (WT) culture.[14] Lanes B and C are rRNA
from recombinant heat-shocked cultures.[17] Lanes D through F are rRNA from
recombinant heat-shocked and IPTG-induced cultures.[17] Lane G is rRNA from a
recombinant serine hydroxamate-treated (SR) culture.[15] Lane H is rRNA from an
IPTG-induced recombinant culture.[14] The non-heat-shocked cultures all have clear
23S (1.4 kbp) and 16S (0.75 kbp) rRNA bands, as expected, while the heat-shocked
cultures have clear 23S rRNA bands, a shifted 16S rRNA (0.8 kbp) bands, and prominent
third rRNA bands (0.7 kbp). IPTG-induced cultures are indicated (+).
13
REFERENCES
1. Short protocols in protein science: a compendium of methods from current protocols in
protein science, ed. J.E. Coligan. 2003: John Wiley & Sons, Inc. 2. Allen, S.P., et al., Two novel heat shock genes encoding proteins produced in response
to heterologous protein expression in Escherichia coli. Journal of Bacteriology, 1992. 174(21): p. 6938-6947.
3. Auer, H., et al., Chipping away at the chip bias: RNA degradation in microarray
analysis. Nature Genetics, 2003. 35(4): p. 292-293. 4. Baelde, H.J., et al., High quality RNA isolation from tumours with low cellularity and
high extracellular matrix component for cDNA microarrays: application to chondrosarcoma. Journal of Clinical Pathology, 2001. 54: p. 778-782.
5. Borth, N., et al., Flow cytometric analysis of bacterial physiology during induction of
foreign protein synthesis in recombinant Escherichia coli cells. Cytometry, 1998. 31: p. 125-129.
6. Cao, G.-J. and N. Sakara, Identification of the gene for an Escherichia coli poly (A)
polymerase. Proceedings of National Academy of Science, 1992. 89: p. 10380-10384.
7. Carrio, M. and A. Villaverde, Localization of chaperones DnaK and GroEL in
bacterial inclusion bodies. Journal of Bacteriology, 2005. 187(10): p. 3599-3601. 8. Carrio, M. and A. Villaverde, Role of molecular chaperones in inclusion body
formation. FEBS Letters, 2003. 537(1-3): p. 215-221. 9. Cha, H.J., et al., Observations of green fluorescent protein as a fusion partner in
genetically engineered Escherichia coli: Monitoring protein expression and solubility. Biotechnology and Bioengineering, 2000. 67(5): p. 565-574.
10. Copois, V., et al., Impact of RNA degradation on gene expression profiles:
Assessment of different methods to reliably determine RNA quality. Journal of Biotechnology, 2007. 127(4): p. 549-559.
11. Dreyfus, M., P. Regnier, and E.N. Superieure, The poly(A) tail of mRNAs: Body
guardian in eukaryotes, scavenger in bacteria. Cell, 2002. 111: p. 611-613.
14
12. Garcia-Fruitos, E., A. Aris, and A. Villaverde, Localization of functional polypeptides in bacterial inclusion bodies. Applied and Environmental Microbiology, 2007. 73(1): p. 289-294.
13. Garcia-Fruitos, E., et al., Aggregation as bacterial inclusion bodies does not imply
inactivation of enzymes and fluorescent proteins. Microbial Cell Factories, 2005. 4(27).
14. Haddadin, F. and S.W. Harcum, Transcriptome profiles for high-cell-density
recombinant and wild-type Escherichia coli. Biotechnology and Bioengineering, 2005. 90(2): p. 127-153.
15. Haddadin, F., H. Kurtz, and S.W. Harcum, Serine hydroxamate and the transcriptome
of high cell density recombinant Escherichia coli MG1655. Applied Biochemistry and Biotechnology, 2009. 157: p. 124-139.
16. Haller, A.C., et al., Transcriptional profiling of degraded RNA in cryopreserved and
fixed tissue samples obtained at autopsy. BMC Clinical Pathology, 2006. 6(9). 17. Harcum, S.W. and F. Haddadin, Global transcriptome response of recombinant
Escherichia coli to heat-shock and dual heat-shock recombinant protein induction. J. Ind. Microbiol. Biotechnol, 2006. 33: p. 801-814.
18. Idicula-Thomas, S. and P.V. Balaji, Protein aggregation: a perspective from amyloid
and inclusion-body formation. Current Science, 2007. 92(6): p. 758-767. 19. Imbeaud, S., et al., Towards standardization of RNA quality assessment using user-
independent classifiers of microcapillary electrophoresis traces. Nucleic Acids Research, 2005. 33(6): p. e56 1-12.
20. Korz, D.J., et al., Simple fed-batch technique for high cell density cultivation of
Escherichia coli. Journal of Biotechnology, 1995. 39(1): p. 59-65. 21. Lehrach, H., et al., RNA molecular weight determinations by gel electrophoresis
under denaturing conditions, a critical reexamination. Biochemistry, 1977. 16(21): p. 4743-4751.
22. Lesley, S.A., et al., Gene expression response to misfolded protein as a screen for
soluble recombinant protein. Protein Engineering, 2002. 15(2): p. 153-160. 23. Li, X. and K.B. Taylor, Effect of glucose on the expression parameters of
recombinant protein in Escherichia coli during batch growth in complex medium. Biotechnology Prog., 1994. 10: p. 160-164.
15
24. Lim, W.K., H.E. Smith-Somerville, and J.K. Hardman, Solubilization and renaturation of overexpressed aggregates of mutant tryptophan synthase α-subunits. Applied and Environmental Microbiology, 1989. 55(5): p. 1106-1111.
25. Liu, Y., et al., Expression of the Foot-and-Mouth Disease Virus VP1 protein using a
replication-competent recombinant canine adenovirus type 2 elicits a humoral antibody response in a porcine model. Viral Immunology, 2006. 19(2): p. 202-209.
26. Medwid, R.D., L. Krebs, and S. Welch, Evaluation of Escherichia coli cell disruption
and inclusion body release using nucleic acid binding fluorochromes and flow cytometry. BioTechniques, 2007. 43(6): p. 777-781.
27. Middelberg, A.P.J., Preparative protein folding. TRENDS in Biotechnology, 2002.
20(10): p. 437-443. 28. Richins, R. and W. Chen, Effects of FIS overexpression on cell growth, rRNA
synthesis, and ribosome content in Escherichia coli. Biotechnology Prog., 2001. 17: p. 252-257.
29. Rodriguez, R.L. and R.C. Tait, Recombinant DNA Techniques: An Introduction.
1983, London: The Benjamin/Cummings Publishing Company, Inc. 236. 30. Sambrook, J., E.F. Fritsch, and T. Maniatis, Molecular Cloning A Laboratory
Manual. 2nd ed, ed. C. Nolan. Vol. 3. 1989: Cold Spring Harbor Laboratory Press.
31. Schroeder, A., et al., The RIN: an RNA integrity number for assigning integrity
values to RNA measurements BMC Molecular Biology, 2006. 7(3). 32. Sharma, S.S., F.R. Blattner, and S.W. Harcum, Recombinant protein production in an
33. Sharma, S.S., et al., Expression of two recombinant chloramphenicol
acetyltransferase variants in highly reduced genome Escherichia coli strains. Biotechnology and Bioengineering, 2007. 98(5): p. 1056-1070.
34. Ventura, S. and A. Villaverde, Protein quality in bacterial inclusion bodies. Trends in
Biotechnology, 2006. 24(4): p. 179-185. 35. Wood, T.K. and S.W. Peretti, Depression of protein synthetic capacity due to
cloned-gene expression in E. coli. Biotechnology and Bioengineering, 1990. 36: p. 865-878.
16
36. Wood, T.K. and S.W. Peretti, Effect of chemically-induced, cloned-gene expression on protein synthesis in E. coli. Biotechnology and Bioengineering, 1991. 38: p. 397-412.