Comparison of Single Shot Methods for R2* Comparison Thesis Defense Rick Deshpande Committee: • Dr. Donald Twieg, Chair • Dr. N. Shastry Akella • Dr. Georg Deutsch University of Alabama at Birmingham, Department of Biomedical Engineering, Thesis Defense March 16th, 2009 1
Transcript
Comparison of Single Shot Methods for R2* Comparison
Thesis Defense
Rick Deshpande
Committee: • Dr. Donald Twieg, Chair• Dr. N. Shastry Akella• Dr. Georg Deutsch
University of Alabama at Birmingham, Department of Biomedical Engineering, Thesis Defense March 16th, 2009 1
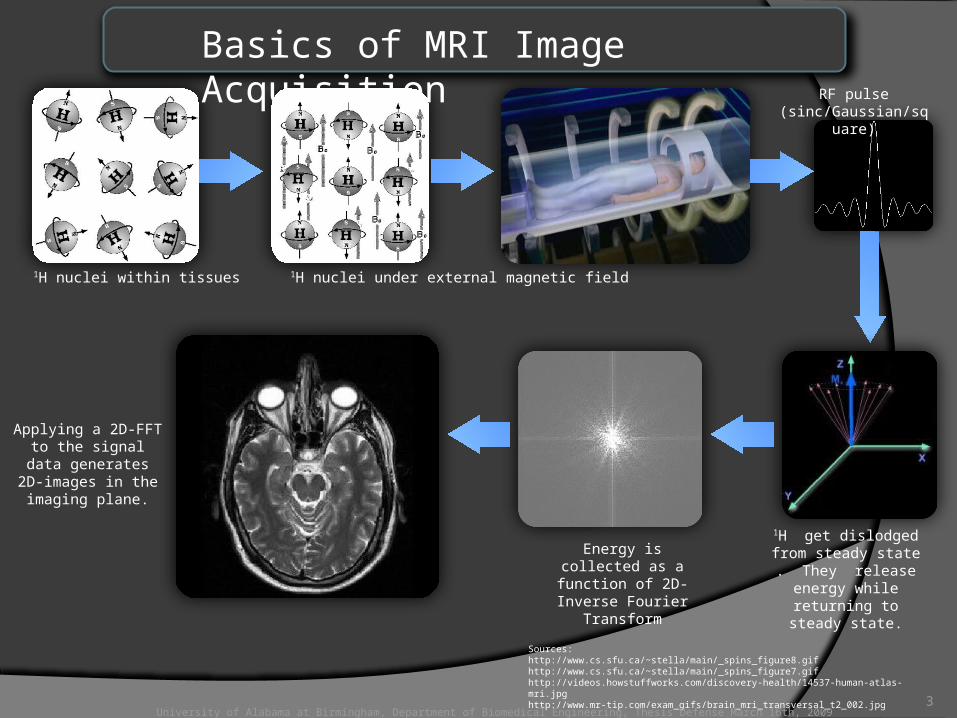
Include local phase evolution & local signal decay
Estimate maps (images) of M(x), R2* (x), ω(x) by solving an inverse problem.
It uses Progressive Length Conjugate Gradient (PLCG) algorithm which requires optimal parameters to minimize least squared residuals to generate parameter maps.
University of Alabama at Birmingham, Department of Biomedical Engineering, Thesis Defense March 16th, 2009
Single-Shot Parameter Assessment by Retrieval from Signal Encoding
8
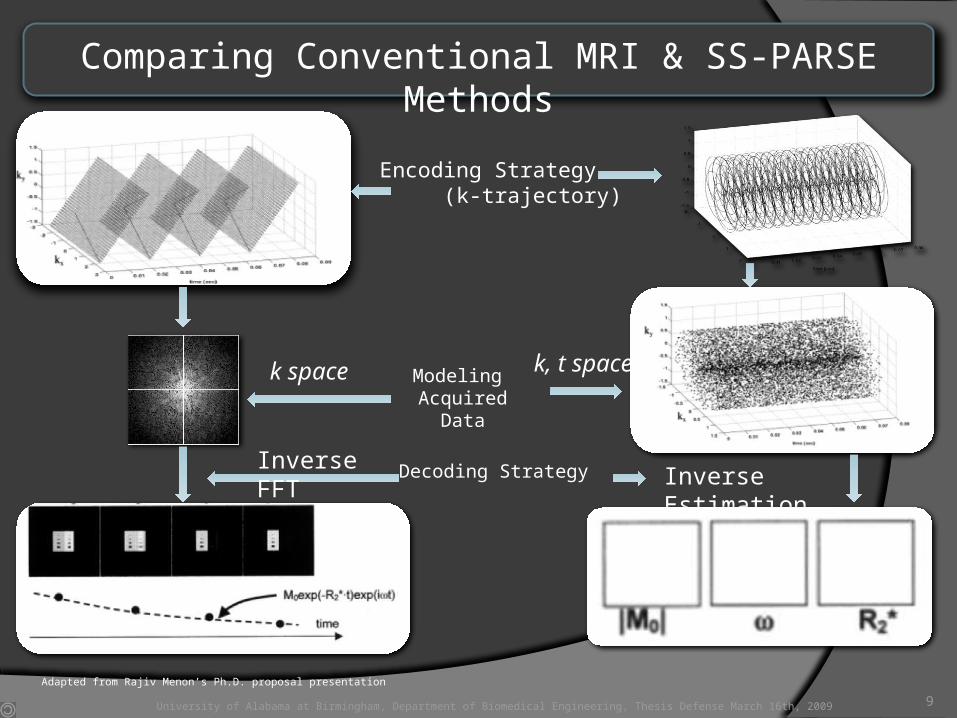
Encoding Strategy (k-trajectory)
k space k, t spaceModeling
Acquired Data
Comparing Conventional MRI & SS-PARSE Methods
Decoding StrategyInverse FFTInverse Estimation
Adapted from Rajiv Menon’s Ph.D. proposal presentation
University of Alabama at Birmingham, Department of Biomedical Engineering, Thesis Defense March 16th, 2009 9
University of Alabama at Birmingham, Department of Biomedical Engineering, Thesis Defense March 16th, 2009 11
Project goals – Theoretical Inferences
Factors contributing towards performance of SS-PARSE:
1. Gmax values – Find relationship between
• Gmax and R2* estimates (compared with gradient-echo values)
2. Shimming – Find effects of field inhomogeneity in SS-PARSE and MEPI studies.
3. Performance over R2* range - Observe the changes in temporal
behavior over R2* values typically found in human brain tissues
(20 to 40 sec-1 in 4.7 T MRI systems)
University of Alabama at Birmingham, Department of Biomedical Engineering, Thesis Defense March 16th, 2009 12
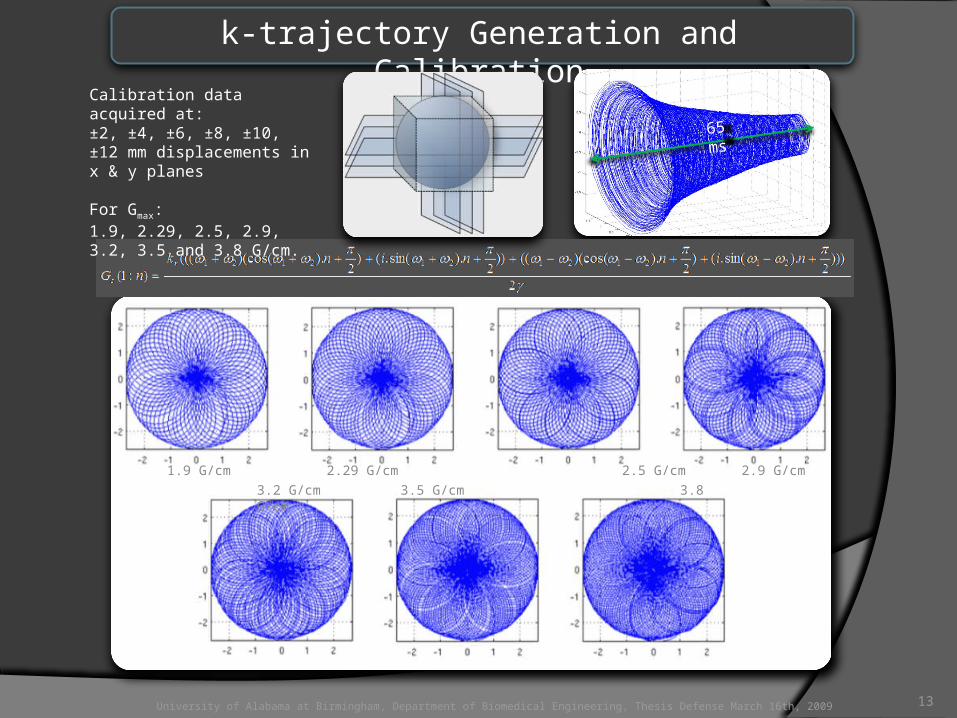
65 ms
1.9 G/cm 2.29 G/cm 2.5 G/cm 2.9 G/cm
3.2 G/cm 3.5 G/cm 3.8 G/cm
University of Alabama at Birmingham, Department of Biomedical Engineering, Thesis Defense March 16th, 2009
k-trajectory Generation and Calibration
Calibration data acquired at: ±2, ±4, ±6, ±8, ±10, ±12 mm displacements in x & y planes
For Gmax:1.9, 2.29, 2.5, 2.9, 3.2, 3.5 and 3.8 G/cm.
13
Phantom For Data Acquisition
R2* Range: 15 sec-1 to 45 sec-1
University of Alabama at Birmingham, Department of Biomedical Engineering, Thesis Defense March 16th, 2009 14
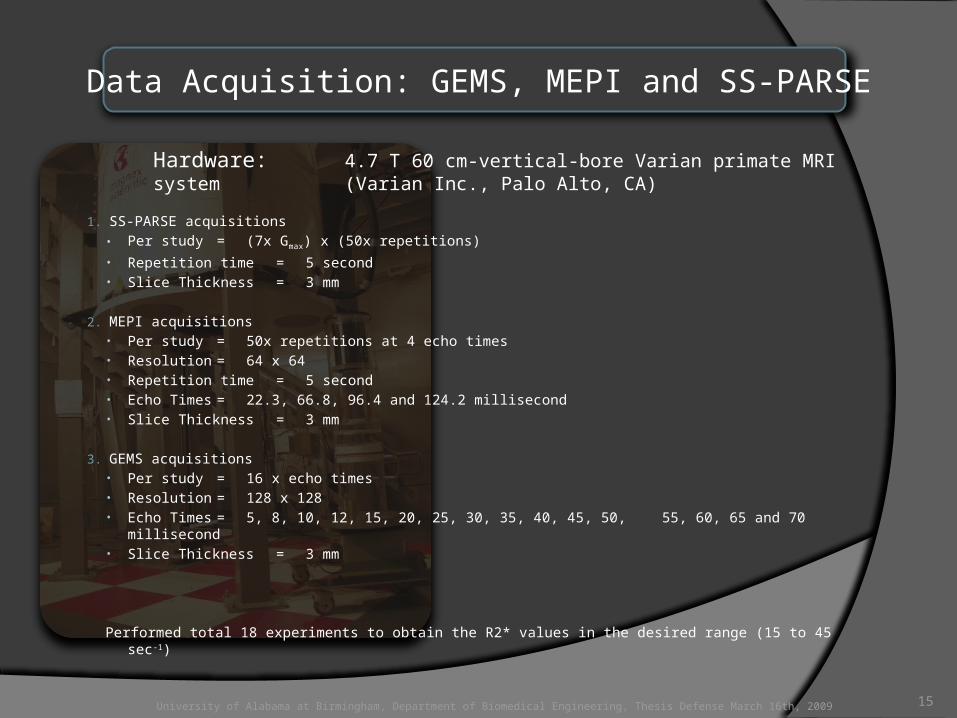
Data Acquisition: GEMS, MEPI and SS-PARSE
1. SS-PARSE acquisitions• Per study = (7x Gmax) x (50x repetitions)
• Repetition time = 5 second• Slice Thickness = 3 mm
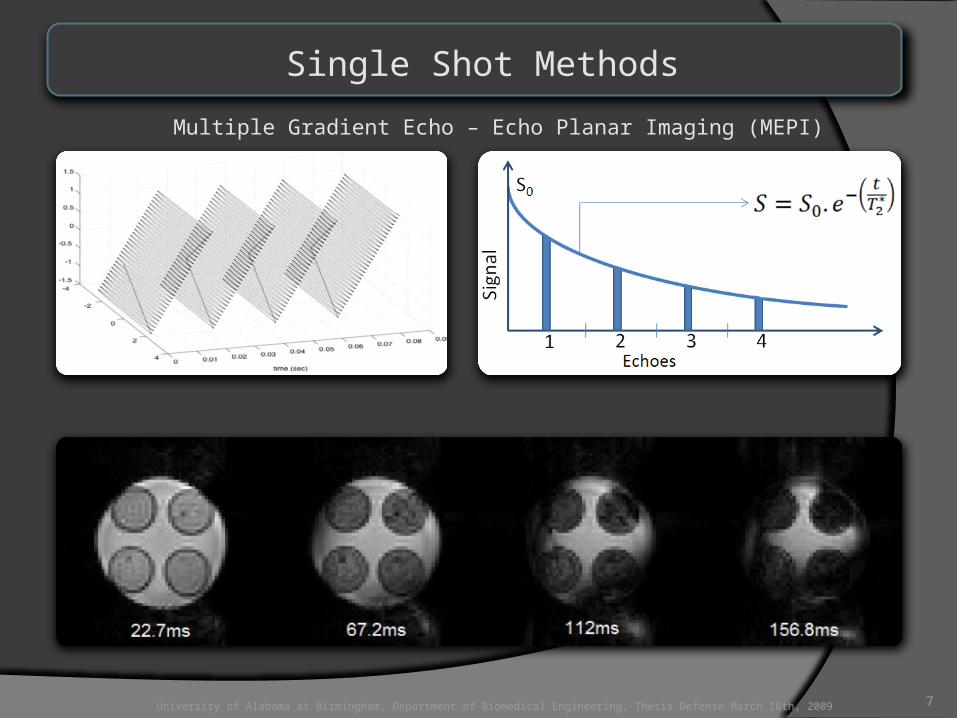
2. MEPI acquisitions• Per study = 50x repetitions at 4 echo times• Resolution = 64 x 64• Repetition time = 5 second• Echo Times = 22.3, 66.8, 96.4 and 124.2 millisecond• Slice Thickness = 3 mm
3. GEMS acquisitions• Per study = 16 x echo times• Resolution = 128 x 128• Echo Times = 5, 8, 10, 12, 15, 20, 25, 30, 35, 40, 45, 50,
55, 60, 65 and 70 millisecond• Slice Thickness = 3 mm
Performed total 18 experiments to obtain the R2* values in the desired range (15 to 45 sec-1)
Hardware: 4.7 T 60 cm-vertical-bore Varian primate MRI system (Varian Inc., Palo Alto, CA)
University of Alabama at Birmingham, Department of Biomedical Engineering, Thesis Defense March 16th, 2009 15
University of Alabama at Birmingham, Department of Biomedical Engineering, Thesis Defense March 16th, 2009
1. Swoop length (N1): Number of Samples between two echoes.Increases with Gmax
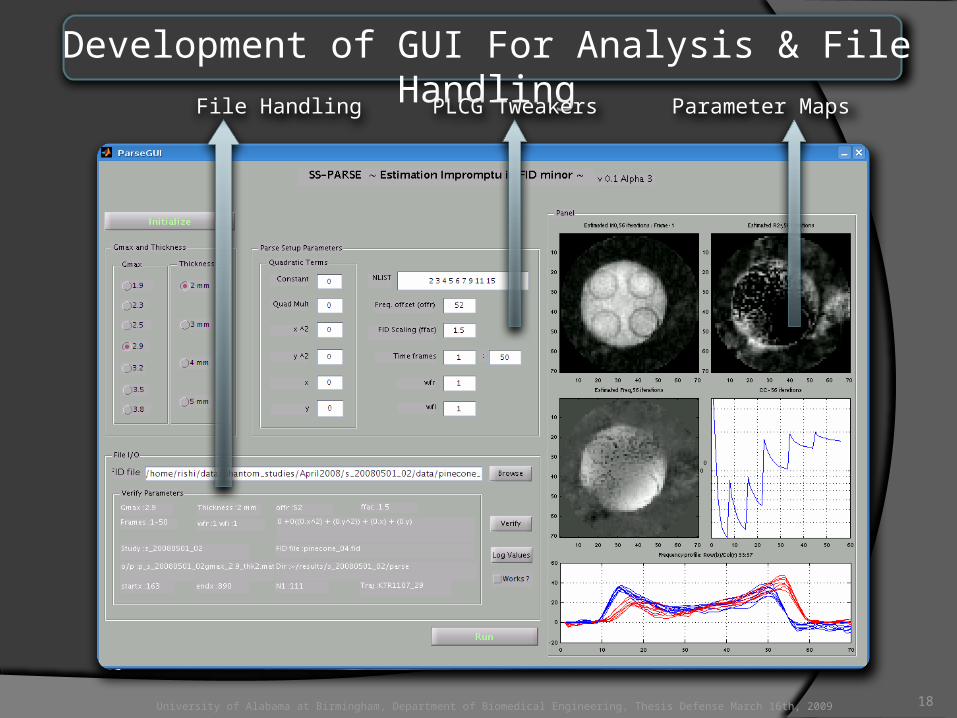
2. Data lengths (NLIST): Incrementally progressive integral multiples of swoops required for PLCG. They need to be set empirically
3. Tolerances (FLIST): Minimum desired accuracy of estimation for a data length before incrementing data length
4. Initial freq. estimate (offr): Empirically determined value which helps in faster and more accurate convergence of points in the x,y grid
5. Scaling (ffac): Sometimes scaling the signal (FID) is essential in order to correctly estimate the parameters. It is determined
empirically.17University of Alabama at Birmingham, Department of Biomedical Engineering, Thesis Defense March 16th, 2009
Development of GUI For Analysis & File Handling
File Handling PLCG Tweakers Parameter Maps
18University of Alabama at Birmingham, Department of Biomedical Engineering, Thesis Defense March 16th, 2009
R2* Evaluation: GEMS and MEPI
•R2* is computed over a ROI
• •Monoexponential fitting of signal to echo times.
MEPI
GEMS
19University of Alabama at Birmingham, Department of Biomedical Engineering, Thesis Defense March 16th, 2009
Parameters Estimates in SS-PARSE
Reconstruction (SS-PARSE)
Parameter maps were computed using the PLCG algorithm from all the SS-PARSE acquisitions. Maps were created for all Gmax values (1.9 G/cm to 3.8 G/cm).
20University of Alabama at Birmingham, Department of Biomedical Engineering, Thesis Defense March 16th, 2009
Accuracy of R2* Estimation
• GEMS is used as the gold standard
• Accuracy of estimation at each pixel is computed by using the ratio:
|R2* MEPI - R2
* GEMS |
|R2* SSPARSE - R2
* GEMS|
• If the ratio > 1, SS-PARSE estimation is more accurate at that pixel
• If the ratio < 1, MEPI estimation is more accurate at that pixel.
• The accuracy test was conducted for 20 ROIs, over all Gmax values
21University of Alabama at Birmingham, Department of Biomedical Engineering, Thesis Defense March 16th, 2009
Accuracy of R2* Estimation
1. R2* estimates from SS-PARSE and MEI plotted vs. R2
* from GEMS2. Ratio of R2
* accuracy plotted vs. R2* estimates from GEMS
SS-PARSE and MEPI estimates and accuracy plot at SS-PARSE Gmax = 2.9 G/cm
22University of Alabama at Birmingham, Department of Biomedical Engineering, Thesis Defense March 16th, 2009
Accuracy Over Gradient Amplitudes
Accuracy of R2* estimation computed by using the ratio:
|R2* MEPI - R2
* GEMS |
|R2* SSPARSE - R2
* GEMS|
was > 1 for following percentage points over the Gmax range:
Accuracy of estimation (ratio) was maximum at Gmax = 2.9 G/cm
23University of Alabama at Birmingham, Department of Biomedical Engineering, Thesis Defense March 16th, 2009
Null hypothesis: There is no difference in the standard deviation of R2
* distributions obtained using MEPI and SS-PARSE at 95% confidence interval.
The test was performed on 80 pixels (ROI with radius = 5), over 20 R2*
values (tubes), gave a sample size of 1600 pixels for MEPI and SS-PARSE.
Rejection of null hypothesis at any pixel would indicate a difference in standard deviation for that confidence interval.
F-test: Difference in Standard Deviation for R2*
Estimation (SS-PARSE and MEPI)
University of Alabama at Birmingham, Department of Biomedical Engineering, Thesis Defense March 16th, 2009 24
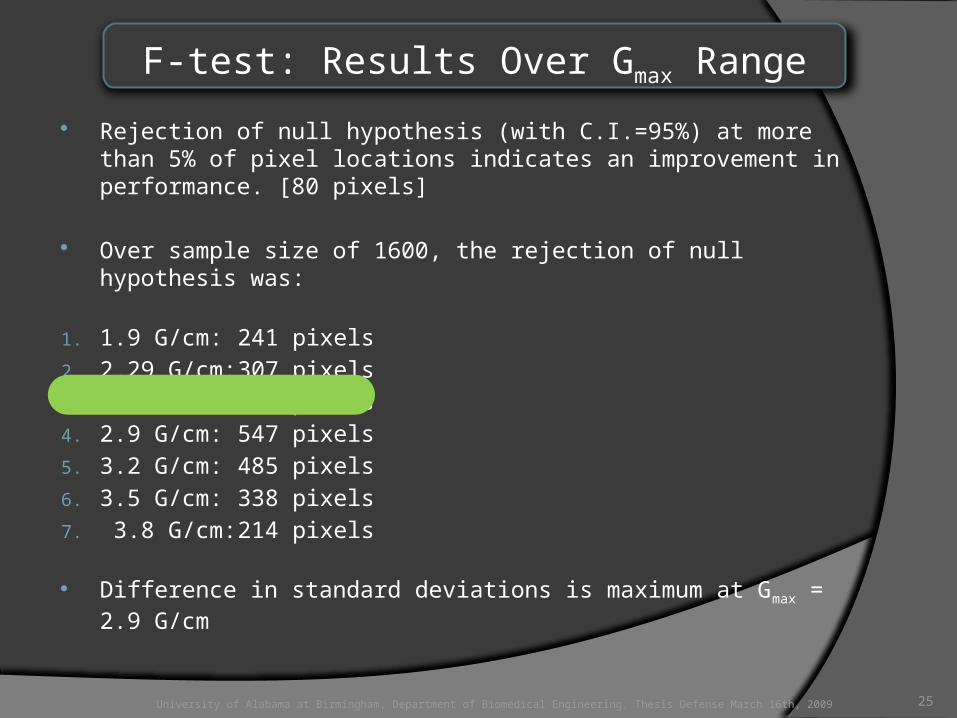
Rejection of null hypothesis (with C.I.=95%) at more than 5% of pixel locations indicates an improvement in performance. [80 pixels]
Over sample size of 1600, the rejection of null hypothesis was:
1. 1.9 G/cm: 241 pixels
2. 2.29 G/cm: 307 pixels
3. 2.5 G/cm: 468 pixels
4. 2.9 G/cm: 547 pixels
5. 3.2 G/cm: 485 pixels
6. 3.5 G/cm: 338 pixels
7. 3.8 G/cm: 214 pixels
Difference in standard deviations is maximum at Gmax = 2.9 G/cm
F-test: Results Over Gmax Range
University of Alabama at Birmingham, Department of Biomedical Engineering, Thesis Defense March 16th, 2009 25
Temporal Variation of R2* Over 50 Repetitions
TSD computed for:
• Each pixel over 50 repetitions
• Each ROI over 50 repetitions
• For MEPI and SS-PARSE
• For Gmax with best accuracy
26University of Alabama at Birmingham, Department of Biomedical Engineering, Thesis Defense March 16th, 2009
Compute the TSD over each pixel in each ROI over 50 repetitions
Find the value: TSDMEPI – TSDSS-PARSE for each pixel
If the difference is +ve, SS-PARSE has lower TSD, thus better repeatability
TSD comparison is performed for SS-PARSE Gmax with best accuracy (2.9 G/cm)
Comparing Temporal Standard Deviation
27University of Alabama at Birmingham, Department of Biomedical Engineering, Thesis Defense March 16th, 2009
Depiction of TSD
28University of Alabama at Birmingham, Department of Biomedical Engineering, Thesis Defense March 16th, 2009
TSD Plots
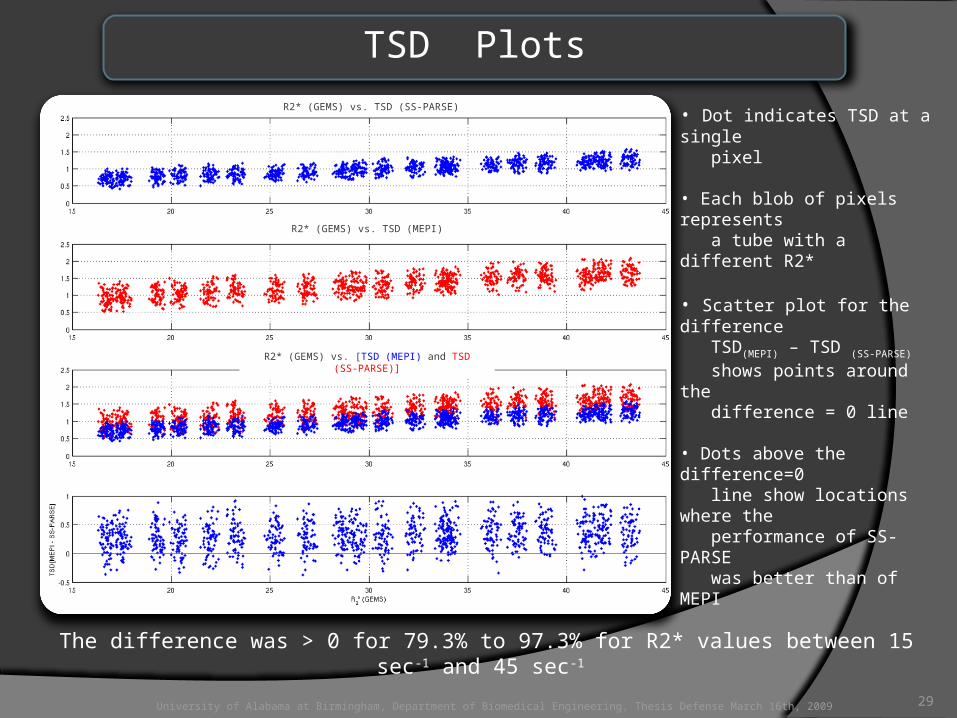
The difference was > 0 for 79.3% to 97.3% for R2* values between 15 sec-1 and 45 sec-1
• Dot indicates TSD at a single pixel
• Each blob of pixels represents a tube with a different R2*
• Scatter plot for the difference TSD(MEPI) – TSD (SS-PARSE) shows points around the difference = 0 line
• Dots above the difference=0 line show locations where the performance of SS-PARSE was better than of MEPI
R2* (GEMS) vs. TSD (SS-PARSE)
R2* (GEMS) vs. TSD (MEPI)
R2* (GEMS) vs. [TSD (MEPI) and TSD (SS-PARSE)]
29University of Alabama at Birmingham, Department of Biomedical Engineering, Thesis Defense March 16th, 2009
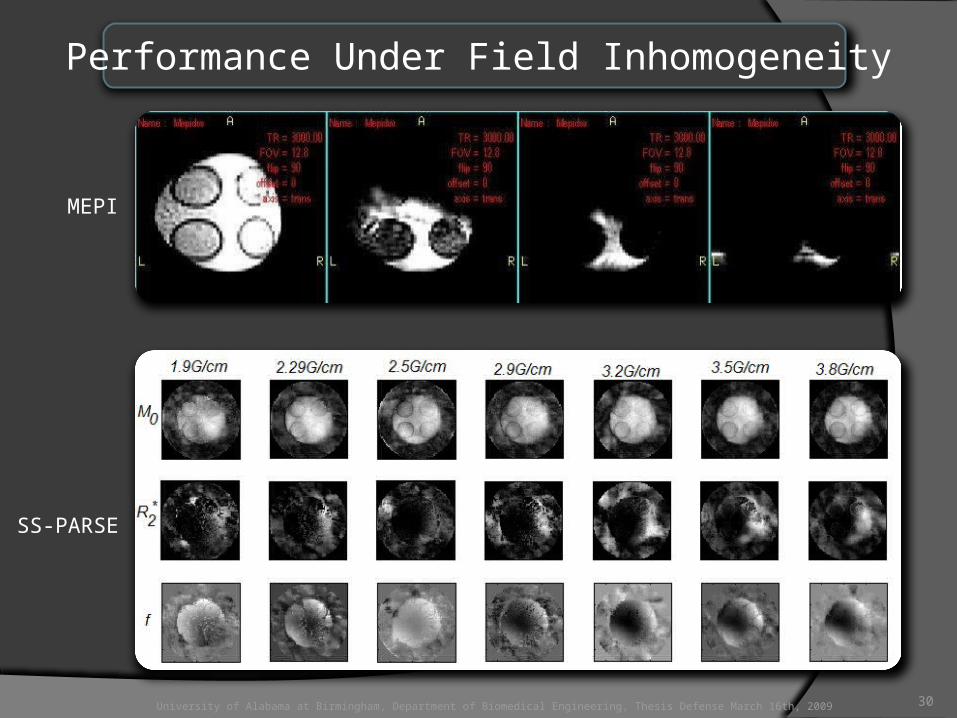
Performance Under Field Inhomogeneity
MEPI
SS-PARSE
30University of Alabama at Birmingham, Department of Biomedical Engineering, Thesis Defense March 16th, 2009
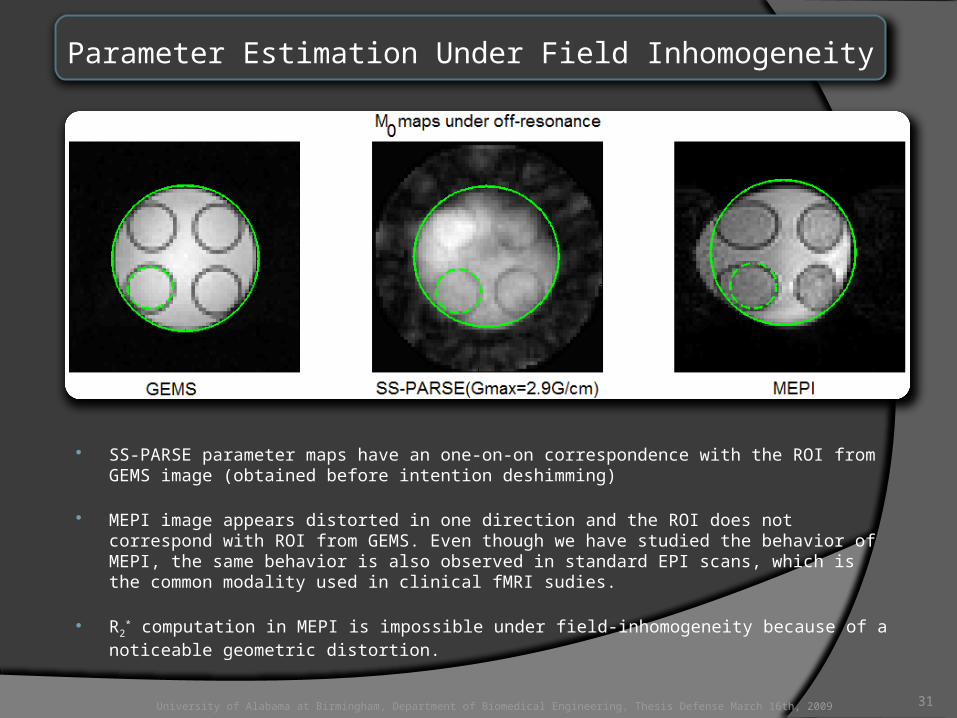
Parameter Estimation Under Field Inhomogeneity
SS-PARSE parameter maps have an one-on-on correspondence with the ROI from GEMS image (obtained before intention deshimming)
MEPI image appears distorted in one direction and the ROI does not correspond with ROI from GEMS. Even though we have studied the behavior of MEPI, the same behavior is also observed in standard EPI scans, which is the common modality used in clinical fMRI sudies.
R2* computation in MEPI is impossible under field-inhomogeneity because of a noticeable
geometric distortion.
31University of Alabama at Birmingham, Department of Biomedical Engineering, Thesis Defense March 16th, 2009
Discussion
PLCG tweakers need to be determined empirically in order to minimize the least squared residuals.
However once we have arrived at an optimal value for one set, the same value can be used for all the repetitions.
Accuracy of R2* estimates in SS-PARSE are comparable to estimates in MEPI at
lower values of R2*, but are significantly better at higher values of R2
*.
In SS-PARSE, the trajectory samples the center of k-space (k=0) several times at the beginning and has enough samples required for reconstruction. For MEPI the signal strength declines around the 3rd and 4th echo; especially in regions with high R2
* values. Using MEPI to generate activation maps in regions with high R2* can
lead to erroneous results.
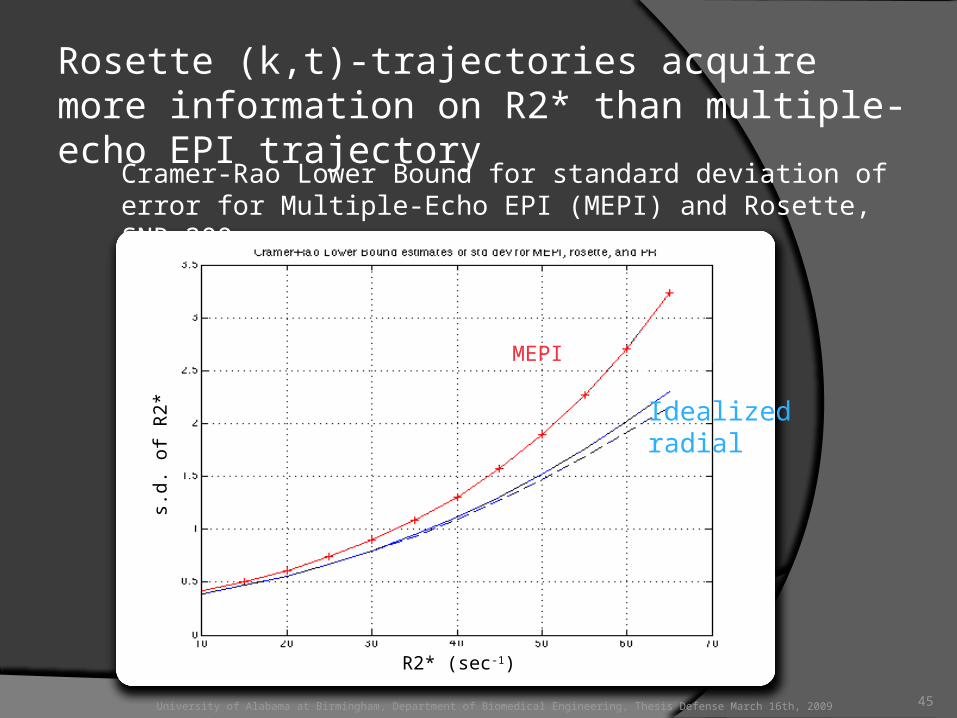
Temporal variability of R2* estimates in SS-PARSE is comparable to that of MEPI at lower R2* values, but SS-PARSE has lower variability as R2* increases.
This finding is consistent with theoretical predictions (Cramer-Rao Lower Bound)
32University of Alabama at Birmingham, Department of Biomedical Engineering, Thesis Defense March 16th, 2009
Discussion
In k-trajectory used for SS-PARSE, lower gradient strengths trajectories (Gmax) give fewer samples, while higher gradient strength trajectories give more samples
More samples result in better conditioning of the inverse problem, and likely, more accurate parameter maps
The minimum number of samples required for parameter estimation is 4x pixels in the evaluation grid (3217 x 4).
This is to estimate the 4 unknowns within the estimation grid by solving simultaneous equations
We saw the performance improve until Gmax reached 2.9 G/cm, after which the estimation accuracy started to deteriorate.
This performance was pertinent to our experimental setup. In practice we expect the optimal performance at a Gmax value somewhere between 2.5 G/cm and 3.2 G/cm.
33University of Alabama at Birmingham, Department of Biomedical Engineering, Thesis Defense March 16th, 2009
Inverse Problem Conditioning in Heisenberg’s Terms
34University of Alabama at Birmingham, Department of Biomedical Engineering, Thesis Defense March 16th, 2009
Discussion By keeping track of local frequencies, SS-PARSE can estimate reliable parameter
maps even under field inhomogeneity. This is not possible in conventional MRI sequences since they rely solely upon spatial Fourier transform for encoding and reconstruction.
The data acquired under poor shimming can be reliably reconstructed with SS-PARSE. However we get noticeable geometric distortion when reconstructing data obtained using MEPI, making the study more difficult to interpret.
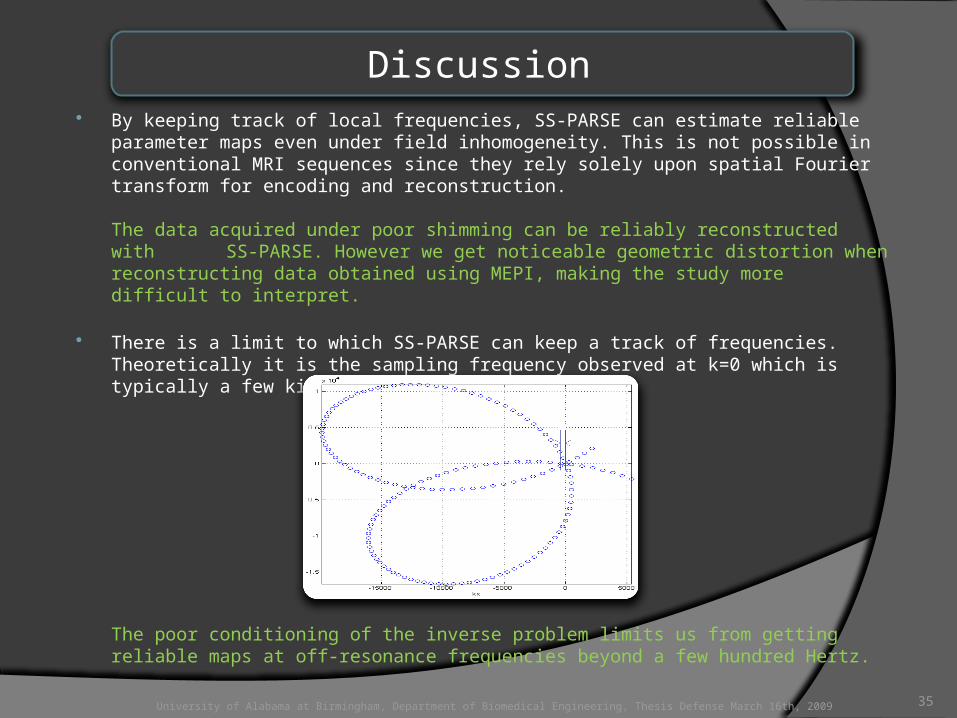
There is a limit to which SS-PARSE can keep a track of frequencies. Theoretically it is the sampling frequency observed at k=0 which is typically a few kilohertz.
The poor conditioning of the inverse problem limits us from getting reliable maps at off-resonance frequencies beyond a few hundred Hertz.
35University of Alabama at Birmingham, Department of Biomedical Engineering, Thesis Defense March 16th, 2009
Discussion
Continuing the iterative search in PLCG for a longer duration would give more accurate estimates
However, running the algorithm for longer would give a little improvement in accuracy. With faster processors and using a parallelized code, these times can be lowered
Time taken to estimate a parameter map is typically about 10 minutes.
In clinical fMRI analysis, the estimates from first scan can then be used as starting parameters for remaining scans, thus reducing the estimation times for subsequent slides to few tens of a second.
Reliability of SS-PARSE is dependent on the stability of scanning hardware. We need to calibrate the k-trajectory and local phase information any time there is a change in hardware settings.
However hardware changes are very infrequent – typically every 2 years in clinical systems.
36University of Alabama at Birmingham, Department of Biomedical Engineering, Thesis Defense March 16th, 2009
37University of Alabama at Birmingham, Department of Biomedical Engineering, Thesis Defense March 16th, 2009
Conclusions
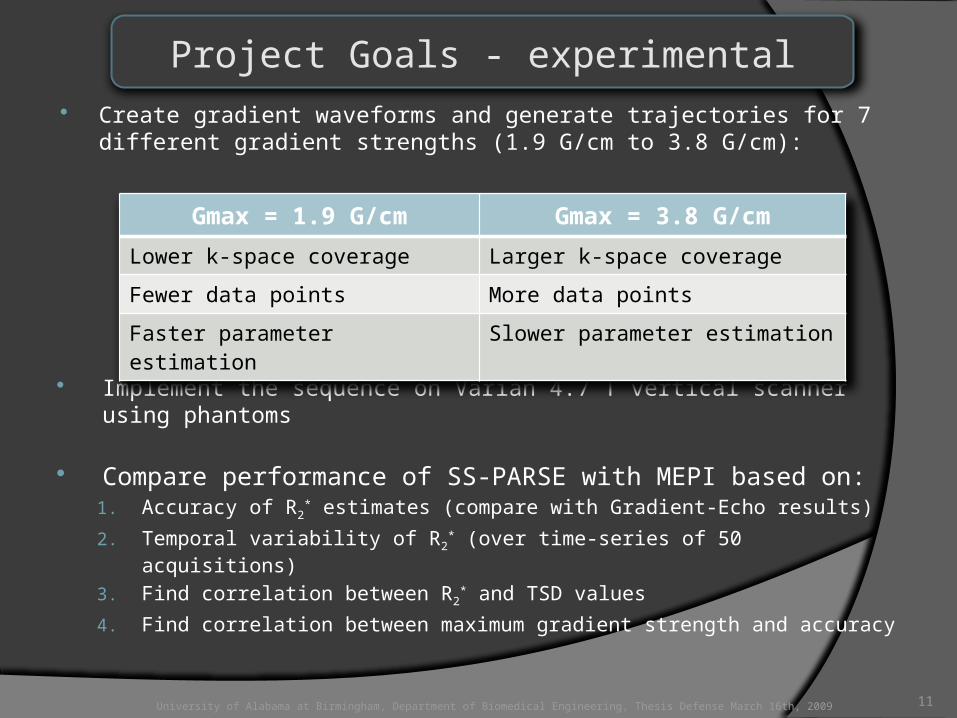
Gradient waveforms for seven Gmax values were developed for SS-PARSE and were used to acquire phantom data
Parameter maps for SS-PARSE were constructed using PLCG algorithm
Performance of SS-PARSE and MEPI was compared using GEMS as the gold standard
Accuracy of R2* estimation of SS-PARSE was compared with MEPI for a
range of Gmax values.
Performance of SS-PARSE improved with increasing gradient amplitude until 2.9 G/cm. Thereafter the performance deteriorates.
38University of Alabama at Birmingham, Department of Biomedical Engineering, Thesis Defense March 16th, 2009
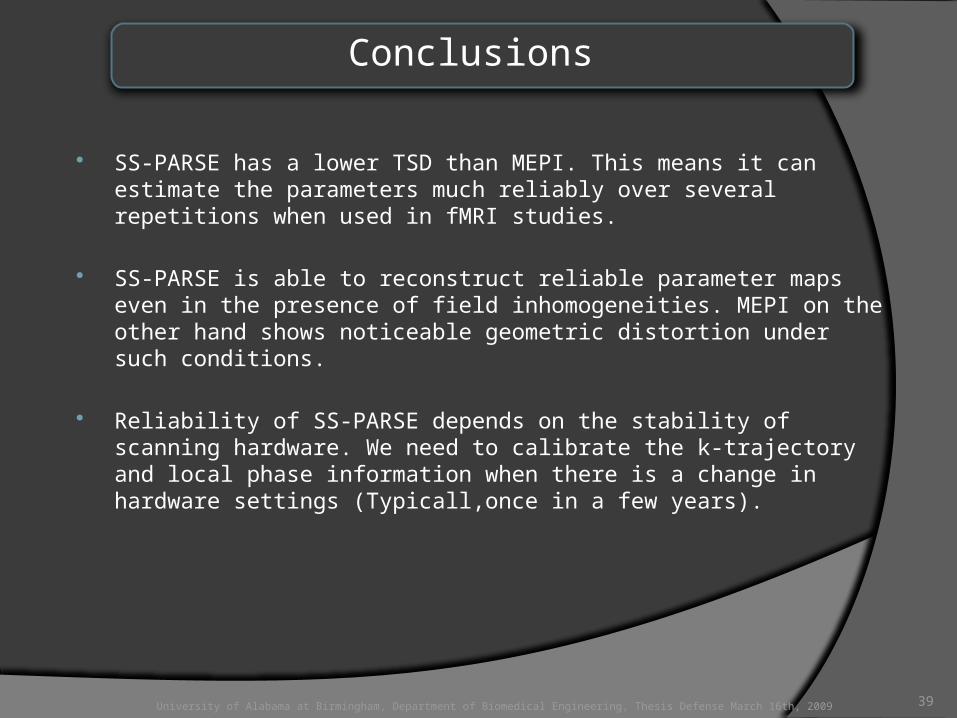
Conclusions
SS-PARSE has a lower TSD than MEPI. This means it can estimate the parameters much reliably over several repetitions when used in fMRI studies.
SS-PARSE is able to reconstruct reliable parameter maps even in the presence of field inhomogeneities. MEPI on the other hand shows noticeable geometric distortion under such conditions.
Reliability of SS-PARSE depends on the stability of scanning hardware. We need to calibrate the k-trajectory and local phase information when there is a change in hardware settings (Typicall,once in a few years).
39University of Alabama at Birmingham, Department of Biomedical Engineering, Thesis Defense March 16th, 2009
Future Scope
PLCG algorithm requires adjusting the algorithm tweakers heuristically. With better knowledge about the estimation process we should be able to set the parameters in a deterministic manner.
With better problem conditioning, and with MRI systems capable of delivering more than 6.5 G/cm (hardware limit of Varian 4.7 T system), we should be create trajectories with much higher sampling rates, thus giving accurate parameter estimation.
Parallel acquisition and multiple shot trajectories, increases the number of sample points, thus improving conditioning of the inverse problem and leading to more accurate estimates.
40University of Alabama at Birmingham, Department of Biomedical Engineering, Thesis Defense March 16th, 2009
Acknowledgement
Advisor:Dr. Donald Twieg
Committee MembersDr. N. Shastry AkellaDr. Georg Deutsch
Dr. Stan Reeves (Auburn)
CDFI & VSRC colleagues:
Mark BoldingRajiv MenonNingzhi LiMatt WardDebbie WhittenJerry Millican
Parents and Sister
FriendsMichelleJonChris
Grant Support:
NIH # R21/R33 EB003292
City of Birmingham
41University of Alabama at Birmingham, Department of Biomedical Engineering, Thesis Defense March 16th, 2009
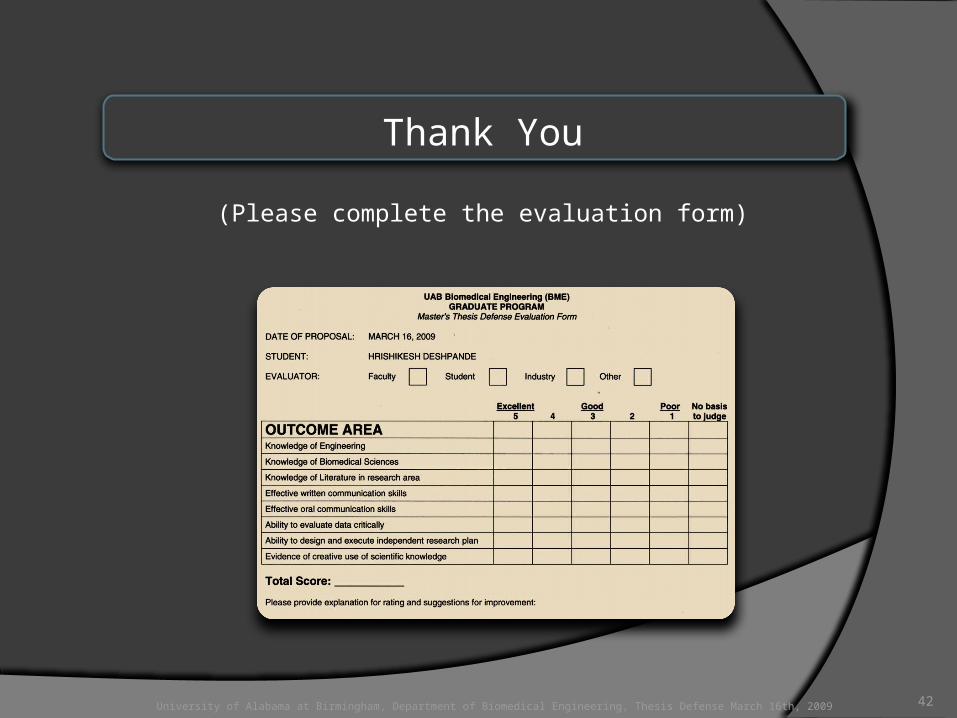
Thank You
(Please complete the evaluation form)
University of Alabama at Birmingham, Department of Biomedical Engineering, Thesis Defense March 16th, 2009 42