Comparison of Visual Business Modeling Techniques for Software Companies Garm Lucassen, Sjaak Brinkkemper, Slinger Jansen, Eko Handoyo Department of Information and Computing Sciences, Utrecht University, Princetonplein 5, 3584 CC Utrecht The Netherlands {g.lucassen,s.brinkkemper,slinger.jansen,eko.handoyo}@uu.nl Abstract. Despite the widespread adoption of business modeling tech- niques in academic research and business, no research has been done into how efficient and effective business modeling techniques document and communicate business models. This paper compares three visual busi- ness modeling techniques with a visual approach and identifies the strong and weak points of each modeling technique, based on applying the tech- niques to three startups and interviews with industry experts. With this comparison, visual business modeling technique developers can improve their own techniques and software companies can determine which tech- nique to apply in their specific case. Key words: Visual Business Modeling Techniques, Software Business Models, Software Business Analysis 1 Introduction According to Gordijn, Akkermans and van Vliet[1], a business model presents the business essentials of the business case to be developed and is seen as a first step in requirements engineering for any e-commerce information systems. Based on an elaborate literature study of business model definitions, Osterwalder et al. [3] defined the term business model as: ”A conceptual tool that contains a set of elements and their relationships and allows expressing the business logic of a specific firm. It is a de- scription of the value a company offers to one or several segments of customers and of the ar- chitecture of the firm and its network of partners for creating, marketing, and delivering this value and relationship capital, to generate profitable and sustain- able revenue streams.” In order to create business models, dozens of scientists have done research into universally applicable techniques. In the past ten years this has resulted in as many different techniques with varied approaches and results [1, 4, 5, 6, 7, 8, 9, 10, 11, 12]. But it was not until the introduction of Osterwalder’s business modeling ontology [12] and corresponding book [13] that business models have become a frequently discussed topic and widely adapted tool in science and all forms of business. According to Google Scholar, Osterwalder’s thesis outlining
Transcript
Comparison of Visual Business ModelingTechniques for Software Companies
Abstract. Despite the widespread adoption of business modeling tech-niques in academic research and business, no research has been done intohow efficient and effective business modeling techniques document andcommunicate business models. This paper compares three visual busi-ness modeling techniques with a visual approach and identifies the strongand weak points of each modeling technique, based on applying the tech-niques to three startups and interviews with industry experts. With thiscomparison, visual business modeling technique developers can improvetheir own techniques and software companies can determine which tech-nique to apply in their specific case.
Key words: Visual Business Modeling Techniques, Software BusinessModels, Software Business Analysis
1 Introduction
According to Gordijn, Akkermans and van Vliet[1], a business model presents thebusiness essentials of the business case to be developed and is seen as a first stepin requirements engineering for any e-commerce information systems. Based onan elaborate literature study of business model definitions, Osterwalder et al. [3]defined the term business model as:
”A conceptual tool that contains a set of elements and their relationships andallows expressing the business logic of a specific firm. It is a de- scription of thevalue a company offers to one or several segments of customers and of the ar-chitecture of the firm and its network of partners for creating, marketing, anddelivering this value and relationship capital, to generate profitable and sustain-able revenue streams.”
In order to create business models, dozens of scientists have done researchinto universally applicable techniques. In the past ten years this has resulted inas many different techniques with varied approaches and results [1, 4, 5, 6, 7,8, 9, 10, 11, 12]. But it was not until the introduction of Osterwalder’s businessmodeling ontology [12] and corresponding book [13] that business models havebecome a frequently discussed topic and widely adapted tool in science and allforms of business. According to Google Scholar, Osterwalder’s thesis outlining
2 Lucassen, Brinkkemper, Jansen, Handoyo
the business modeling ontology has been cited 475 times to date. Furthermore,the Business Model Canvas is currently being deployed by larger consultancyfirms. All technique creators argue that they have identified essential conceptswhich any given business model is made up of. It can be argued that no sin-gle business modeling technique successfully reached this goal. All techniquestake widely diverging approaches, none of which have been fully accepted inbusiness nor academics. Of all these techniques, some provide visual elementsthat can be used to create a business model, we refer to these as visual businessmodeling techniques. Three visual business modeling techniques: The BusinessModel Canvas [13], Software Ecosystem Model [4] and Board of Innovation [5]will be studied in this paper. We expect that these techniques are more effectiveand efficient when communicating the business models than non-visual businessmodeling techniques.
Yet, despite the widespread adaption of the Business Model Canvas, no re-search has been done into how effectively and efficiently different business mod-eling techniques document and communicate business models. In this paper weaddress this hiatus by asking the research question ”What business modelingtechnique documents and communicates the business model of a software busi-ness most effectively and efficiently?”. In section 2 the research method we usedto formulate an answer to this question is introduced. Section 3 will identify therequired concepts that modeling techniques should include. Following, section 4introduces the business modeling techniques that will be examined in this papermore elaborately. Section 5 compares the aforementioned techniques’ conceptualadherence to a list of requirements based on literature research and document-ing and communicating effectiveness and efficiency based on application of thebusiness modeling techniques to three software start-ups and interviews withindustry experts. In this context effectiveness is regarded as to what extent thebusiness modeling technique successfully captures and communicates the en-tirety of the business model, whereas efficiency is defined as how flexible andadaptable the business model capturing process is and how comprehensible andexplicit all modeled information is communicated to the reader. To conclude, insection 6 the (dis)advantages extracted from the comparison of each model willbe discussed and compared in order to formulate the recommended approach.The paper ends with a conclusion and future research possibilities in section 7.
2 Research Method
In this research several visual business modeling techniques (BMTs) are dis-cussed and compared. In order to be able to generate a scientifically accountablelist of requirements a literature study was conducted. Google Scholar and ACMDigital Library searches were performed with combinations of business model,business modeling, technique, e-business, as keywords. Business model defini-tions based on 16 authors and 10 relevant modeling techniques were accumulatedthis way. Furthermore, the studied BMTs were applied to three high-tech star-tups in order to investigate the effectiveness and efficiency of the documenting
Comparison of Visual Business Modeling Techniques for Software Companies 3
process. This part of the research was conducted using Yin’s case study method[2]. First the startups were modeled based on information extracted from theproducts. Afterwards a meeting with a founder of the startups took place wherethe modeling process was repeated. Upon completion the models were com-pared and discussed with the entrepreneur. Ultimately the digital models wereredesigned and confirmed by the entrepreneurs via email. Last but not least,structured interviews with industry experts consisting of six (ex-)entrepreneurs,two network partners and one venture capitalist were conducted in order to ex-amine the effectiveness and efficiency of communicating the business models.The experts were asked what concepts they saw as essential, to evaluate severalbusiness models presented in each BMT, discuss (dis)advantages and articulatetheir preferred technique. After conducting the interviews and startup modelinglists of (dis)advantages were extracted within 24 hours of the interviews.
3 Identification of Core Concepts
Osterwalder’s definition of business models [3] as presented in the introductioncorresponds with our perception of business models and contains the foundationof what concepts we expect the BMTs to include:
1. Customer Value Proposition2. Partnerships3. Architecture of the firm4. Revenue streams5. Logic of earning money
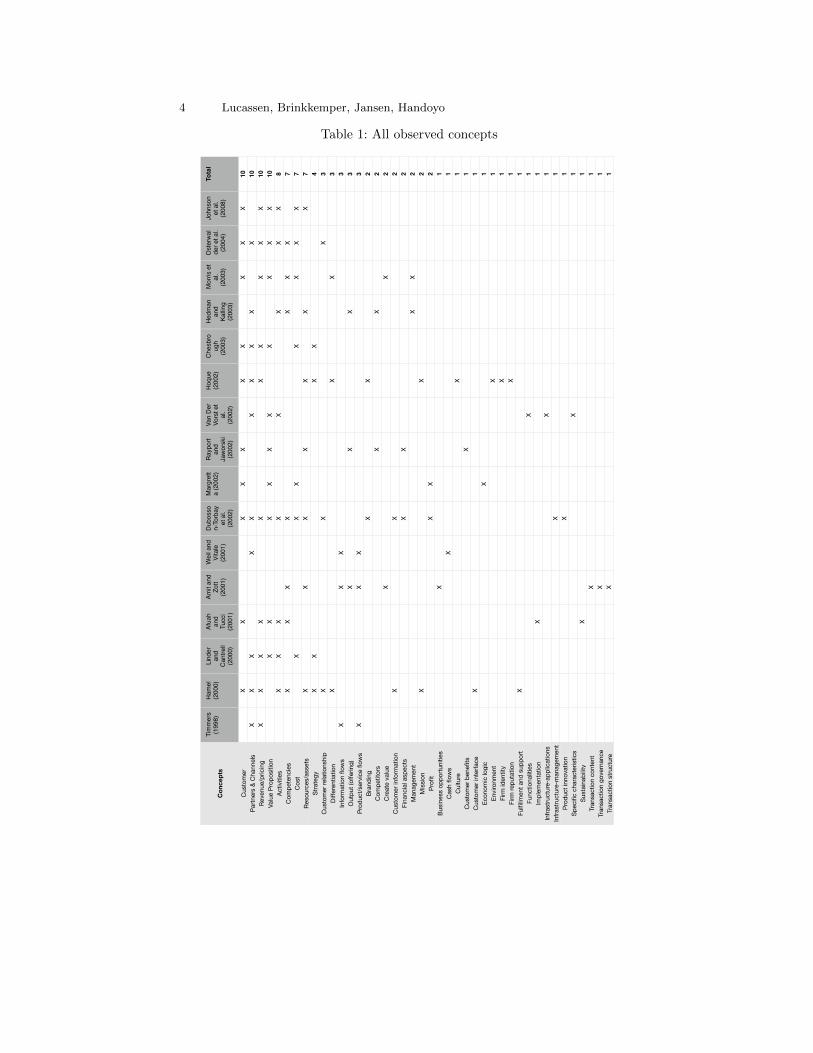
To confirm whether this list of concepts is still viable, we reiterated upon Shaferet al.’s [14] research into essential business model concepts for business modelingtechniques. In the paper, 12 business model definitions in academic articles,originating between 1998-2002, are dissected in order to find one list of essentialbusiness model concepts. We reiterated upon this study in Table 1 by adding4 more definitions by different authors between 2000-2008 [7, 8, 9, 15]. Amongthese definitions, 9 concepts were observed significantly more frequently thanothers. Descriptions of these concepts can be found in Table 2.
1. Customer2. Value Proposition3. Revenue4. Costs5. Activities
6. Partners
7. Distribution Channels
8. Resources
9. Competencies
4 Lucassen, Brinkkemper, Jansen, Handoyo
Table 1: All observed concepts
Con
cepts
Tim
mer
s (1
998)
Ham
el
(200
0)Li
nder
an
d Ca
ntre
ll (2
000)
Afua
h an
d Tu
cci
(200
1)
Amit
and
Zott
(200
1)
Wei
l and
Vi
tale
(2
001)
Dubo
sso
n-To
rbay
et
al.
(200
2)
Mar
gret
ta
(200
2)Ra
ypor
t an
d Ja
wors
ki (2
002)
Van
Der
Vors
t et
al.
(200
2)
Hoqu
e (2
002)
Ches
bro
ugh
(200
3)
Hedm
an
and
Kallin
g (2
003)
Mor
ris e
t al
. (2
003)
Ost
erwa
lde
r et a
l. (2
004)
John
son
et a
l. (2
008)
Total
Cust
omer
Partn
ers
& Ch
anne
lsRe
venu
e/pr
icin
gVa
lue
Prop
ositi
onAc
tiviti
esCo
mpe
tenc
ies
Cost
Reso
urce
s/as
sets
Stra
tegy
Cust
omer
rela
tions
hip
Diffe
rent
iatio
nIn
form
atio
n flo
ws
Out
put (
offe
ring)
Prod
uct/s
ervic
e flo
ws
Bran
ding
Com
petit
ors
Crea
te v
alue
Cust
omer
info
rmat
ion
Fina
ncia
l asp
ects
Man
agem
ent
Miss
ion
Prof
itBu
sines
s op
portu
nitie
sCa
sh fl
ows
Cultu
reCu
stom
er b
enef
itsCu
stom
er in
terfa
ceEc
onom
ic lo
gic
Envir
onm
ent
Firm
iden
tity
Firm
repu
tatio
nFu
lfillm
ent a
nd s
uppo
rtFu
nctio
nalit
ies
Impl
emen
tatio
nIn
frast
ruct
ure-
appl
icat
ions
Infra
stru
ctur
e-m
anag
emen
tPr
oduc
t inn
ovat
ion
Spec
ific
char
acte
ristic
sSu
stai
nabi
lity
Tran
sact
ion
cont
ent
Tran
sact
ion
gove
rnan
ceTr
ansa
ctio
n st
ruct
ure
XX
XX
XX
XX
XX
10X
XX
XX
XX
XX
X10
XX
XX
XX
XX
XX
10X
XX
XX
XX
XX
X10
XX
XX
XX
XX
8X
XX
XX
XX
7X
XX
XX
XX
7X
XX
XX
XX
7X
XX
X4
XX
X3
XX
X3
XX
X3
XX
X3
XX
X3
XX
2X
X2
XX
2X
X2
XX
2X
X2
XX
2X
X2
X1
X1
X1
X1
X1
X1
X1
X1
X1
X1
X1
X1
X1
X1
X1
X1
X1
X1
X1
X1
Comparison of Visual Business Modeling Techniques for Software Companies 5
When applied to software companies, two of these concepts are consideredunnecessary. First, analysis of business models made with the Business ModelCanvas revealed that the most important resources are the result of activitiesof the company. Explicitly specifying resources displays redundant informationto the reader. Secondly, information concerning competencies compared to thecompetitors does not fit the scope of a business model. A business model specifi-cally provides information about the business being studied. Not its competitors.Considering that Osterwalder’s definition includes all 7 remaining concepts, weconclude that his definition is viable for the scope of our research.
However, interviews with industry experts identified only 4 essential conceptsthat are relevant in their position. They mainly use business models to communi-cate the business its potential to investors in a visually pleasing way. In order toreach this goal a wide variety of concepts that should be included were identified,varying between backgrounds, experience with BMTs and role specific needs. Af-ter extensive analysis of recordings of all interviews, 4 concepts were found tobe essential: (1) Value proposition, (2) Identification of customers, (3) Logic ofearning money, consisting of costs and revenues in concrete figures and (4) Ac-tivities. These concepts encapsulate the diversifying aspects of a business, whichare the defining factors for investors according to the experts. These requiredconcepts conform to the concepts identified by the literature study excludingchannels and partners. Although experts acknowledged that channels and part-ners are important, they were deemed inessential due to their often replaceablenature and limited added value when communicating a unique value proposition.
In order to effectively compare all BMTs in section 5, one uniform list of re-quired concepts needs to be formulated. The five concepts identified throughinterviews with experts and supported by the literature study form the founda-tion. All BMTs include partners and two out of three BMTs include channels intheir approach extensively. Not including channels and partners in the compari-son would mitigate the use of both the Software Ecosystem Model and Board ofInnovation extensively. Therefore, both channels and partners are added. The fi-nal list of required concepts, shown in Table 2, effectively mirrors the 7 conceptsidentified in the literature study.
Table 2: Final list of required concepts for visual business modeling techniques
Which customer segments are targeted? [16]What bundle of products and services creates value for a specific customer segment? [12]How much money can be made by price x volume? [8]Who are the partners that provide the key resources to the company? [13]What makes the profitable delivery of the value proposition repeatable and scalable? [8]What are the most important assets required to make the business model work? [13]How are costs allocated? [8]
6 Lucassen, Brinkkemper, Jansen, Handoyo
4 Introduction of Business Modeling Techniques
In this section three BMTs will be introduced by discussing their approach.Specifically visual business modeling techniques were used for this research be-cause the resulting models incorporate visually distinguishable elements thatfacilitate easy and fast communication of the business model. More specificallythese three techniques were selected because of three different factors. The Busi-ness Model Canvas was chosen because of its widespread acceptance among busi-ness and academics. The Software Ecosystem Model is used in several coursesand developed at Utrecht University, where this study took place. Lastly, theBoard of Innovation was adopted because it is the latest visual BMT and gen-erating publicity quickly.
Business Model Canvas [13] is derived from Osterwalder et al.’s research [12]into a business model ontology. His research identified four areas with nine build-ing blocks that a business model should address to create a complete visualrepresentation which displays the links between all business segments. Modelingstarts on the right side of the canvas by clearly formulating the customer andvalue proposition. The remaining seven building blocks, consisting of Key Part-ners, Key Activities, Key Resources, Customer Relationships, Channels, RevenueStreams and Cost Structure, are derived from the needs and requirements of thecustomer segments and value proposition. Figure 1 in the next section providesan example of a completed Business Model Canvas.
Software Ecosystem Model [4] is based on Weil and Vitale’s supply net-works [16] and specifically aimed at modeling product software businesses. Theapproach combines two models. (1) A Product Deployment Context (PDC) pro-vides a simple, quick overview of the architecture and dependencies of a softwareproduct in its running environment by describing the context in which the prod-uct operates. The stacking order of the elements defines the hierarchy betweendifferent products and components. (2) The accompanying Software Supply Net-work (SSN) displays all parties that facilitate the company to provide a valueadding product. The diagram shows asset, knowledge and software transactionsbetween the different parties in the company’s network. Examples of both theSSN and PDC are shown in Figure 2 in the next section. Modeling starts bydefining all entities and flows. Company of interest, customers, potential inter-mediaries are connected by product, service, finance and content transactionsbetween the entities. Afterwards all suppliers are listed and transactions withthe company of interest added. Based on the list of suppliers the PDC is modeledof how the technology of the product is made up.
Board of Innovation [5] is a technique that aims to provide users an easyway to create a visual representation of transactions within any company. Thescope of this technique is limited to visually representing concrete activities andasset transaction that take place in the context of the business. Intangible in-formation such as customer relationships, positioning and strategy are left out.
Comparison of Visual Business Modeling Techniques for Software Companies 7
By using 16 distinctive icons a comprehensive image of the business model takesshape. 6 Actor icons represent the business, companies and suppliers in the valuenetwork, consumers, non-profits and government. The 10 remaining icons repre-sent product, service, experience, exposure, reputation, money, less money, data,right and credit transactions. Icons can easily be moved around to facilitate busi-ness model innovation. The Board of Innovation is used as a whiteboard kit withmagnets that represent the actors and transactions. Modeling starts by identify-ing all actors in the ecosystem, followed by defining the initial transaction withthe customer. Afterwards all transactions with suppliers, partners and stake-holders related to the initial transaction are added. An example is presented inFigure 3 in the next section.
5 Comparison of Business Modeling Techniques
This section will compare the BMTs introduced in the previous section. Firstwe will research whether the BMTs theoretically include all required conceptsintroduced in section 3. Afterwards, an assessment will be done concerning towhat extent the required concepts are effectively and efficiently communicatedand documented based on experiences with the documenting process of threesoftware startups and interviews with industry experts. The next section willpresent the recommended BMT based on (dis)advantages of each technique,which are in turn based on the findings of this section.
5.1 Comparison on Concepts
As seen in Figure 1 the Business Model Canvas explicitly provides segments foreach required concept. The technique also includes key resources, which we con-sidered to be inessential in section 3 because it displays redundant information.In this example you can see that all the resources can be derived from the key ac-tivities segment. Thanks to the flexibility of this technique redundant segments,such as key resources, can be ignored when necessary.
8 Lucassen, Brinkkemper, Jansen, Handoyo
What are the most important costs inherent in our business model? Which Key Resources are most expensive? Which Key Activities are most expensive?
Through which Channels do our Customer Segments want to be reached? How are we reaching them now?How are our Channels integrated? Which ones work best?Which ones are most cost-efficient? How are we integrating them with customer routines?
For what value are our customers really willing to pay?For what do they currently pay? How are they currently paying? How would they prefer to pay? How much does each Revenue Stream contribute to overall revenues?
For whom are we creating value?Who are our most important customers?
What type of relationship does each of our CustomerSegments expect us to establish and maintain with them?Which ones have we established? How are they integrated with the rest of our business model?How costly are they?
What value do we deliver to the customer?Which one of our customer’s problems are we helping to solve? What bundles of products and services are we offering to each Customer Segment?Which customer needs are we satisfying?
What Key Activities do our Value Propositions require?Our Distribution Channels? Customer Relationships?Revenue streams?
Who are our Key Partners? Who are our key suppliers?Which Key Resources are we acquiring from partners?Which Key Activities do partners perform?
What Key Resources do our Value Propositions require?Our Distribution Channels? Customer Relationships?Revenue Streams?
Day Month Year
No.
This work is licensed under the Creative Commons Attribution-Share Alike 3.0 Unported License. To view a copy of this license, visit http://creativecommons.org/licenses/by-sa/3.0/
or send a letter to Creative Commons, 171 Second Street, Suite 300, San Francisco, California, 94105, USA.
Advertising space
availableDevelopment &
MaintenanceAnalyse image
uploads
Advertising space available
MobileApplication
Frapp.it
Automated mass customization
Customer acquisition & Retention Medium & Large B2C Businesses
Western t-shirt wearers
Large amount of diverse, active users Distribution
Advertising feesDistribution
Ad sales force
Customer Acquisition Costs Platform Costs
Advertisements
Customer engagement through gamification
T-shirt costs
Gam
ificat
ion
More t-shirts
Motivate people to wear your
merchandise
Promotional
Advertisinganalytics
Wednesday, January 11, 12 Fig. 1: Business Model Canvas - Software Startup 1
Figure 2 shows an example of a Software Ecosystem Model for a fictitious soft-ware company. The SSN uses light (yellow) and dark (orange) labels for cus-tomers and suppliers respectively. Transaction flows with labels map the valueproposition, cost and revenue. Internal processes and activities are not explic-itly identified, instead the model exclusively focuses on the product by modelingwhat architectural elements the product comprises of in the PDC. Channelsare occasionally included when the customer is reached through an intermedi-ary, but more often than not the model assumes customers are being reachedwithout specifying how.
P.4MS IIS
S.1 Product
P.1SYBASE
P.3OS
Internet
Col
loca
tion
Sid
eC
lient
Sid
e
Web Browser
P.8 CycloconnectPlugin
.NET FrameworkP.5
iTextSharp ChilkatP.6
P.2HP Server
P.7
Figure 6: CubicEyes PDC Diagram.
4.1 Product Deployment ContextEYE-move is a large software product that is used by Real
Estate agents and agencies that want to integrate most or allof their internal functions in one information system. EYE-move o↵ers functionality for customer relationship manage-ment, multi-channel marketing and publishing, task andwork flow management, real estate object properties man-agement, etc. Furthermore, EYE-move provides access tothe Dutch Association of Real Estate Brokers real estatedatabase. Designed as a CMS, the software product is highlyexpandable and customizable both by the customer and thecompany itself, making it relatively easy to design and buildcustom modules that extend EYE-move’s functionality.
A real estate agent-customer typically pays for the EYE-move service and accesses the application through a browser.EYE-move is hosted on the company’s self-owned servers,collocated with the ISP and hooked-up directly on the In-ternet backbone.
Figure 6 presents the PDC diagram of CubicEyes. A cus-tomer’s request will be answered by the MS Internet In-formation Services (IIS) web-sever (P.4), which in turn isforwarded to EYE-move (S.1). EYE-move makes use of the.NET Framework (P.5) to communicate with the SYBASEdatabase (P.1) and store/retrieve the necessary data. On re-quest, EYE-move might also make use of iTextSharp PDF-editor component (P.7) and Chilkat XML .NET (P.6) com-ponent in order to read and write XML files. The server-sidecomponents run on a Microsoft Operating System. It is crit-ical to mention at this point that the EYE-move applicationhas been assigned the ID“S.1”(S marks a service) for consis-tency with the SSN and represents a software product thatprovides some service.
The PDC of CubicEyes shows that Eye-move is dependenton many other components. Typically, products that arelower in the stack tend to change less frequently, and aretherefor more stable. The same holds in this example, wherethe Eye-move product is updated frequently, whereas theHP server and its software are only updated when securityrequires it.
4.2 Software Supply NetworkFigure 7 models CubicEyes’ SSN with CubicEyes at the
center of the SSN, connected through multiple trade re-lationships to its suppliers, partners and customers. Cu-bicEyes is directly supplying its customers with the EYE-move application service (S.1) and customers pay the ap-propriate fee (e.1) for it. Each customer also provides Cu-bicEyes with its own real estate objects (C.1).
A number of suppliers supply EYE-move with compo-nents, services and content. The Chilkat XML library isfree for commercial use and iTextSharp is a free open-sourcelibrary. Cyclomedia provides optional on-demand customerservice and is paid for on a per usage basis (e.10). NetInventis providing important network security services to both Cu-bicEyes and its customers (S.3) and is being paid a monthlyfee (e.3) NVM is providing data (C.2) on Netherlands-widereal estate objects.
Vdvorm is the UI designer (S.5) for CubicEyes softwareproducts, receiving a per design fee (e.4). Hewlett Packard(HP) provides with the servers (P.2) which run a Microsoft(MS) Operating System (P.3), MS IIS Webserver (P.4), MS.NET Framework (P.5) and SYBASE DBMS (P.1).
The SSN of CubicEyes enables further analysis of the busi-ness model of the company. The SSN of CubicEyes showsthat though it is a relatively small company, it is depen-dent on a large amount of components from other parties.Furthermore, the company participates in several SECOs,such as the Microsoft SECO, the Sybase SECO, and thereal estate SECO. The company is mostly dependent onthree suppliers, being Microsoft, Sybase, and AMS-IX. Ineach of these main suppliers lies a risk for CubicEyes. Oneof these suppliers could decide no longer to support the re-quired software or AMS-IX could decide no longer to provideits service. Though improbable, these risks must be consid-ered during software development as well as during businessmodel development. Similar things are true in regards tothe data suppliers; if they decide to develop their own in-terfaces CubicEyes’ business model is threatened. Finally,the SSN can be used to theorize about new business models:CubicEyes could try supplying their service as a softwareproduct that is installed at the customer. Another exam-ple could be that CubicEyes starts providing their service insmaller segments, enabling others to resell those services.
5. DISCUSSION AND CONCLUSIONSWhile working on the CubicEyes case study the SEM
method was found to be of great use for communicatingaspects of the software product’s deployment and softwareecosystem. A number of issues regarding the PDC and SSNmodels were recognized though. For instance, the role of anorganization is of higher importance that the company in-stance. In other words, a company embodying a number ofsubstantially di↵erent roles is modeled accordingly equiva-lent times in the SSN, with di↵erent names that include thename of the company.
Another issue encountered relates to the scalability of themodeling method. Being explicitly developed with simplic-ity in mind, aiming at the “interoperability” between tech-nical and non-technical audiences (and biased in favor ofnon-technical audiences), the method was found not to scalewell. When there are large numbers of participants in theSSN or components in the PDC, the models appear to be
Customer
Designner
LeaseWeb
Microsoft
AMS-IX
SYBASE
NVM
Company
HP
Netinvent
S.1
S.5
S.3
S.4
S.3
C.2
P.1
P.2
P.3
S.2
€.6
€.1 C.1
€.2
€.3
€.4
€.5
€.9
€.8
Legend
Products
P.1 Sybase DatabaseP.2 Server MachinesP.3 Operating SystemP.4 MS IISP.5 .NET FrameworkP.6 Chilkat XML .NETP.7 iTExtSharpP.8 Cycloconnect Plugin
Services
S.1 Access to serviceS.2 High-Speed InternetS.3 Network SecurityS.4 User Interface DesignsS.5 Server CollocationS.6 Cycloramas
Finance
€.1 Fee for S.1€.2 Yearly fee for C.2€.3 Monthly fee for S.3€.4 Per design fee for S.4€.5 Fee for P.1€.6 Fee for P.2€.7 Fee for P.3€.8 Monthly fee for S.5€.9 Fee for P.4€.10 Fee for S.6
Content
C.1 Real estate objectsC.2 NL-wide Real Estate objects
P.4
€.7
P.5
iTextSharp
Chilkat Software
P.7
P.6
Cyclomedia
S.6
P.8
€.11
Figure 7: CubicEyes SSN Diagram.
Fig. 2: SSN & PDC - Example Software Company [17]
Comparison of Visual Business Modeling Techniques for Software Companies 9
Quirky Product Buyer
Product Designer
Design company
Product Idea Initiator
Supplier
New Product
Production only starts when enough pre-salesExposure
$ 99
Money
Product Idea
Co-design Product
Community
Fig. 3: Board of Innovation - Quirky [5]
The Board of Innovation uses distinct icons clarified by text to identify betweendifferent types of customers and partners. Flows with transactions representedby smaller icons model the value proposition, processes, activities and revenueflows. Costs are left out, although including them is possible. The model assumescustomers are reached without concretely specifying how, as can be seen inFigure 3.
5.2 Effectiveness and Efficiency Comparison
As mentioned in the introduction, in the context of this research effectiveness isregarded as to what extent the business modeling technique successfully commu-nicates and captures the entirety of the business model. Efficiency, on the otherhand, is defined as how comprehensible and explicit all modeled information iscommunicated to the reader and how flexible and adaptable the business modelcapturing process is. To be able to effectively assess these four aspects, each isbroken down into a number of elements that will be compared. Both definitionsand all elements were extracted from the interviews with industry experts.
Communicating effectiveness
1. Acceptance: of the technique in business and academics.2. Internal Cohesion: the elements of the model are related to one another.3. Number Concreteness: concrete numbers are shown in the model.
Capturing effectiveness
1. Explicit Modeling Method: instructions explicitly defining the approachare provided.
2. Method Efficacy: instructions are easily translated into practice.3. Absence of Redundancy, the resulting models contain no redundant
information.
10 Lucassen, Brinkkemper, Jansen, Handoyo
Communicating efficiency
1. Accessibility and Understandability: accessible and understandable atfirst encounter of a model resulting from the modeling technique.
2. Value Proposition, External Process, Internal Process, Transaction andPartner Explicitness: explicit representation of aforementioned elements inthe model.
Capturing efficiency
1. Evolvability: modeling approach can be changed without redesigning theentire approach.
2. Flexibility: inclusion of concepts can be adapted to the modeler’s needs.
With the evaluation of the preceding section in mind, we expect the Boardof Innovation and Software Ecosystem Model will be least effective and effi-cient in documenting and communicating business models of software companies,whereas the Business Model Canvas will have a negligible amount of complica-tions.
Business Model Canvas Modeling the startups appeared to be easy thanks tothe collaborative, iterative and segmented style of the business Model Canvas. Inpractice modelers struggled with the individual segments and considered themunclear concepts. The provided discussion questions for each segment that aresupposed to provide thinking guidelines turned out to be a double edged sword.More often than not the questions lead to considering the segment completedafter answering the questions or provoking discussion on semantics of the seg-ments instead of the segments themselves. Moreover, although including arrowsis encouraged in order to clarify relationships between segments this often resultsin cluttered models with reduced communication value. Lastly, it is difficult todetermine when a model is satisfyingly correct and/or complete thanks to theflexibility of the technique. Regardless of these inconveniences all entrepreneurspreferred the Business Model Canvas for documenting the business model be-cause it contained the most explicit information on both tangible and intangibleaspects of the business and communicated the information in a highly accessiblemanner.
Opinions regarding communicating effectiveness and efficiency were variedamong industry experts. Most stated the Business Model Canvas is a great toolbecause it provokes modelers to actively think about all required aspects of abusiness model and has a strong emphasis on clearly communicating the valueproposition. At the same time they thought the technique still had room forimprovement when it comes to explicitly presenting crucial aspects of businessmodels. Instead of using vague, general terms such as customer retention andacquisition, segments should clarify how the business aims to achieve these goals.Furthermore, although the Business Model Canvas identifies the cost factors,revenue streams, key partners and key activities, no information is given onconcrete figures of costs factors and revenue streams, what the role of thesepartners is, nor what concrete processes the key activities entail. According to the
Comparison of Visual Business Modeling Techniques for Software Companies 11
experts this information is crucial to communicate the differentiating factors ofthe business. Lastly, the experts stated that the ambiguous discussion questionslead to a confusing documenting process. One entrepreneur experienced withusing the technique in project groups reiterated that many people resort tostrictly filling in the discussion questions. Seven out of eight experts preferredthe Business Model Canvas for their communication needs, although three outof seven stressed that it was important to include a process focused model suchas the Board of Innovation.
Software Ecosystem Model Modeling the startups on a whiteboard was easycompared to the digital modeling process. The Software Ecosystem Model comeswith templates for use with modeling software such as Microsoft Visio or Omni-graffle, which do not facilitate automatically formatting the individual elements.Instead these software products require modelers to carefully align every singleelement by hand, resulting in a large amount of tedious tasks. Moreover, when-ever changes are necessary to maintain an up to date model, all numbers on thelabels and in the legend need to be changed manually. This discourages keep-ing the model current and results in a particularly painful modeling experience.Furthermore, although modelers are instructed to include all software suppliers,the questions was raised to what extent all reaches. Software products which arebuilt with Ruby, should theoretically include 31 gems by 21 different developerswhen deploying the core Ruby on Rails framework. Including all the tiniest sup-pliers will inevitably lead to a confusing SSN, cluttered by dozens of suppliers.Regardless of these inconveniences, the main objection for the entrepreneurs notto prefer this model was its incapability of including intangible elements of abusiness such as good-will, status or customer relationships. Last but not leastis the high level of entry for non-technical modelers. Without extensive technicalknowledge the model turned out to be inapplicable.
All experts considered the Software Ecosystem Model to be ineffective andinefficient at communicating a business model. Although the extensive inclusionof supplier details received praise, the model was deemed too technical, inac-cessible and unattractive to be used as a communication tool towards potentialinvestors. All experts said that they were not provoked to study the transactionsdue to the use of text instead of images. Moreover the priority of suppliers wasimpossible to discern because their transactions are not linked to the customer,caused by the congregating lines at both sides of the model. Another implica-tion of this disadvantage is that internal software and business logic can notbe included, which the entrepreneurs regard as an essential concept as identi-fied in section 3. Similar to the Business Model Canvas no concrete figures orprofitability estimates are provided. One entrepreneur with extensive experiencewith this technique did mention that the Software Ecosystem Model is the onlytechnique that is capable of effectively communicating money flow nuances suchas the difference between kick-back fees and license fees.
12 Lucassen, Brinkkemper, Jansen, Handoyo
Board of Innovation Modeling the startups was easy because of concreteguidelines as to what information is expected to be included. Moreover the white-board kit that facilitates collaboration was considered to be particularly usefulwhen discussing details of the company with colleagues. On the other hand, en-trepreneurs regarded the model to be too simplistic for extensive internal brief-ing on the business due to its lack of freedom concerning intangible elements.Equivalent to the Software Ecosystem Model, this was the main objection forthe entrepreneurs not to prefer this model.
Expert opinions on the Board of Innovation were divided in two camps.Half of the experts appreciated the clear, synoptic approach and lauded thetechnique’s inclusion of strictly essential aspects. The other half claimed thepresented models were too simplistic while still requiring to be extensively stud-ied to completely understand the business model and discover what aspectsare essential. A frustration all experts agreed on was that the relation betweentransactions of different actors was unclear. Again, missing information on coreinternal activities was a source of criticism.
6 Discussion of Advantages and Disadvantages
Table 3 was created by assessing the (dis)advantages identified in the precedingsection for each element introduced in section 5.2. Considering the results of thetheoretical comparison of BMTs and preference of entrepreneurs and industryexperts we expected the Business Model Canvas to have a negligible amount ofdisadvantages in comparison with the Software Ecosystem Model and Board ofInnovation. Although the Business Model Canvas is the strongest BMT whenit comes to communicating effectiveness and capturing efficiency, the Board ofInnovation is superior in efficiently communicating and effectively capturing abusiness model. Moreover the Board of Innovation has a larger absolute numberof positive aspects (7 versus 10). Therefore, we were inclined to think that theBoard of Innovation is the most effective and efficient BMT.
However, industry experts specifically stressed that the most important aspectof a BMT is to be able to include all differentiating factors of a business andeffectively communicate those factors to potential investors. This are the exactaspects the Business Model Canvas accomplishes best, while the Board of Inno-vation has a weaker approach. Furthermore, all negative aspects of the capturingeffectiveness are caused by the ambiguous guidelines presented in the handbook.These aspects can easily be improved by explicating what is expected of the mod-eler, providing concrete modeling guidelines and updating the examples to in-clude more explicit information. Although this simultaneously solves the partnerinexplicitness and number inconcreteness, explicit process information remainsabsent. This is where the Board of Innovation comes in. The flexibility allowsmodelers to painlessly incorporate internal processes by modeling the internallogic in a large business icon, perfectly complementing the Business Model Can-vas. In practice the Business Model Canvas can then be used as a first, general
Comparison of Visual Business Modeling Techniques for Software Companies 13Table 3: Comparison of all business modeling techniques
overview, while the Board of Innovation provides a more elaborate insight con-cerning role of the partners, the internal and external processes of the business.What BMT is best applicable in a specific use case depends on the working con-text, but with the knowledge presented in this section we recommend modelersto adopt both the Business Model Canvas and the Board of Innovation whenmodeling a software business.
7 Conclusions and Future Work
This paper discussed the effectiveness and efficiency of three visual businessmodeling techniques and presented concrete advantages and disadvantages ofeach technique. After conducting a literature study and interviews with expertsa list of seven essential concepts was identified which each technique shouldinclude in their framework. Based on theoretical inclusion of the essential con-cepts we expected the Business Model Canvas to be most effective and efficient atcommunicating and documenting business models, whereas the Software Ecosys-tem Model and the Board of Innovation were expected to garner a considerableamount of criticism.
The documenting process and interviews with experts concerning commu-nication of the business modeling techniques revealed that the Business Model
14 Lucassen, Brinkkemper, Jansen, Handoyo
Canvas is the preferred method because it effectively models explicit informationof both tangible and intangible aspects of the business and communicates thisinformation in a highly accessible manner to parties unfamiliar with the model-ing technique. However the technique still has room for improvement concerningits unclear modeling process and inexplicit representation of certain crucial as-pects, such as the provided discussion questions and how to determine when amodel is satisfyingly correct. The heaviest criticism was reserved for the SoftwareEcosystem Model, which was considered unpractical to work with, too technicalfor non-technical readers and to produce unattractive and inaccessible businessmodels. The Board of Innovation, on the other hand, received acclaim for itspleasant documenting process. Half of the experts praised the clear, synopticmodeling approach which results in accessible and efficient models. However,the other half of the experts considered the resulting models to be too sim-plistic for most of their needs. In the discussion we analyzed the strong andweak points of each technique and concluded that the Business Model Canvasis the most effective communicating and efficient documenting technique be-cause of its acceptance and internal cohesion, and evolvability and flexibilityrespectively. These aspects are considered to be the most important aspect of abusiness modeling technique by the industry experts. The Board of Innovation isconsidered as the most effective documenting and efficient communicating tech-nique due to its extremely simple approach when both capturing and modeling.The Business Model Canvas and Board of Innovation complement each other oncommunication of the entire business model. This resulted in the recommenda-tion of adopting both business modeling techniques when modeling a softwarebusiness.
Future work includes validating the (dis)advantages through quantitativeresearch consisting of more case studies and interviews with experts. Furthermoreimprovements based on the identified (dis)advantages need to be incorporatedinto the business modeling techniques. For example, the Software EcosystemModel requires a complete overhaul of the modeling approach and a graphicalredesign in order to become relevant and accessible for non-technical readers.
2. Yin, R. K.: Case Study Research - Design and Methods. SAGE Publications, New-bury Park (2003)
3. Osterwalder, A., Pigneur, Y., Tucci, C. L.: Clarifying Business Models: Origins,Present and Future of the Concept. In: Communications of the Association forInformation Science. 16, 1-25 (2005)
4. Brinkkemper, S., Soest, I., Jansen, S.: Modeling of Product Software Businesses:Investigation into Industry Product and Channel Typologies. In: 16th InternationalConference on Information Systems Development, pp. 307-325. Springer, Boston(2009)
5. Mey, N. de, Ridder, P. de: Board of Innovation, http://www.boardofinnovation.com
Comparison of Visual Business Modeling Techniques for Software Companies 15
6. Chesbrough, H., Rosenbloom, R.S.: The role of the business model in capturing valuefrom innovation: evidence from Xerox Corporation’s technology spin off companies.In: Industrial and Corporate Change. 1, 529-555 (2002)
7. Morris, M., Schindehutte, M., Allen, J.: The Entrepreneur’s Business Model: Towarda Unified Perspective. In: Journal of Business Research. 58, 726-735 (2005)
8. Johnson, M. W., Christensen, C. M., Kagermann, H.: Reinventing Your BusinessModel. Harvard Business Review. 12, 50-59 (2008)
9. Linder, J., Cantrell, S.: Changing Business Models: Surveying the Landscape. Ac-centure Institute for Strategic Change, Cambridge (2000)
10. Lagha, S. B., Osterwalder, A., Pigneur, Y.: Modeling e-business with eBM. In: 5thInternational Conference on Management of Networked Enterprises (CIMRE), pp.1-14. Mahdia (2001)
11. Pateli, A. G., Giaglis, G. M.: A Framework For Understanding and Analysinge-Business Models. In: Eur. J. Inf. Syst. 13, 302-314 (2004)
12. Osterwalder, A.: The Business Model Ontology - a proposition in a design scienceapproach. Unpublished doctoral dissertation, HEC Lausanne (2004a)
13. Osterwalder, A.: Business Model Generation: A Handbook for Visionaries, GameChangers, and Challengers. Wiley, Hoboken (2010)
14. Shafer, S. M., Smith, H. J., Linder, J.C.: The Power of Business Models. In: Busi-ness Horizons. 48, 199-207 (2005)
15. Osterwalder, A., Pigneur, Y.: Investigating the Use of the Business Model Conceptthrough Interviews. In: 4th International Conference on Electronic Business, pp.568-573. Academic Publishers/World Publishing Corporating, Beijing (2004b)
16. Weill, P., Vitale, M.: Place to Space: Migrating to Ebusiness Models. HarvardBusiness Press, Boston (2001)
17. Boucharas, V., Jansen, S., Brinkkemper, S.: Formalizing software ecosystem mod-eling. In: 1st international workshop on Open component ecosystems, pp. 41-50.ACM, New York (2009)
18. Penker, M., Eriksson, H.: Business Modeling With UML: Business Patterns atWork. Wiley, Hoboken (2000)