J NUCL. & Rel. TECH., Volume 5, No.2, December 2008, 35-45 35 COMPARISON STUDIES OF RESOLUTION AND NOISE PROPERTIES BETWEEN DRUM TYPE AND LASER TYPE FILM DIGITIZATION SYSTEMS Khairul Anuar Mohd Salleh 1 , Ab. Razak Hamzah 2 , Wan Muhammad Saridan Wan Hassan 3 1 & 2 Non-Destructive Testing Group, Industrial Technology Division, Malaysian Nuclear Agency, 43000, Bangi, Kajang, Selangor Darul Ehsan, Malaysia. Tel.: +60389250510 (ext. 1782 & 1231); Fax: +60389250907 E-mail: [email protected], [email protected]3 Department of Physics, Faculty of Science, Universiti Teknologi Malaysia (UTM), 81310, Skudai, Johor Darul Ta’zim, Malaysia Tel.: +6075534191; Fax: +6075566162; E-mail: E-mail: [email protected]ABSTRACT Developments of computer technology and image processing have shifted conventional industrial radiography application to industrial digital radiography (IDR) system. In this study, two types of IDR modules for non destructive testing (NDT), namely drum- and laser- type film digitizer with 50 μm pixel pitch have been evaluated for NDT applications. The modulation transfer function (MTF) and noise power spectrum (NPS) measurement were adapted to evaluate the image quality of IDR images. Results shown the averaged MTF for drum- and laser- type film digitizer at 20% modulation were 6.15 cycles/mm and 6.55 cycles/mm respectively. For NPS measurement and calculation, the result obtained shows that drum type film digitizer produced higher noise then laser type film digitizer. The study shows that the laser type film digitizer is the best system to be used for film digitization purposes because the MTF result shows that it modulates better than drum type and has the lowest and stable NPS. ABSTRAK Seiring dengan perkembangan teknologi perkomputeran dan pemprosesan imej, radiografi industri berbentuk konvensional telah bertukar arah kepada radiografi industri berasaskan digital. Didalam kajian ini, dua jenis alat pendigit filem radiografi industri untuk ujian tanpa memusnah (NDT) iaitu pendigit jenis drum dengan jarak piksel 50 μm dan pendigit jenis laser dengan jarak piksel juga 50 μm telah diuji dan diukur untuk menentukan kesesuaiannya dalam NDT. Ujian modulasi fungsi berpindah (MTF) dan kuasa spektrum hingar (NPS) telah dijalankan keatas kedua-dua peralatan ini bagi menilai imej yang dihasilkan. Daripada pengukuran dan pengiraan yang dijalankan, purata MTF untuk pendigit jenis drum pada modulasi 20% ialah 6.15 kitar/mm dan pendigit jenis laser pula memodulasikan isyarat 6.55 kitar/mm pada 20%. Untuk pengukuran dan pengiraan NPS keputusan yang terhasil menunjukkan pendigit jenis drum menghasilkan hingar yang lebih tinggi daripada pendigit jenis laser. Daripada pengukuran dan pengiraan yang dijalankan, dapatlah dikatakan bahawa untuk menjalankan satu ujian NDT, pengguna perlu tahu keupayaan sebenar sesebuat alat dan bagaimana ia dibina supaya ujian NDT dapat memberi gambaran tepat dan sebenar keatas sesuatu sampel atau barangan yang diuji.
Developments of computer technology and image processing have shifted conventional industrial radiography application to industrial digital radiography (IDR) system. In this study, two types of IDR modules for non destructive testing (NDT), namely drum- and laser- type film digitizer with 50 μm pixel pitch have been evaluated for NDT applications. The modulation transfer function (MTF) and noise power spectrum (NPS) measurement were adapted to evaluate the image quality of IDR images. Results shown the averaged MTF for drum- and laser- type film digitizer at 20% modulation were 6.15 cycles/mm and 6.55 cycles/mm respectively. For NPS measurement and calculation, the result obtained shows that drum type film digitizer produced higher noise then laser type film digitizer. The study shows that the laser type film digitizer is the best system to be used for film digitization purposes because the MTF result shows that it modulates better than drum type and has the lowest and stable NPS.
aBstraK
Seiring dengan perkembangan teknologi perkomputeran dan pemprosesan imej, radiografi industri berbentuk konvensional telah bertukar arah kepada radiografi industri berasaskan digital. Didalam kajian ini, dua jenis alat pendigit filem radiografi industri untuk ujian tanpa memusnah (NDT) iaitu pendigit jenis drum dengan jarak piksel 50 μm dan pendigit jenis laser dengan jarak piksel juga 50 μm telah diuji dan diukur untuk menentukan kesesuaiannya dalam NDT. Ujian modulasi fungsi berpindah (MTF) dan kuasa spektrum hingar (NPS) telah dijalankan keatas kedua-dua peralatan ini bagi menilai imej yang dihasilkan. Daripada pengukuran dan pengiraan yang dijalankan, purata MTF untuk pendigit jenis drum pada modulasi 20% ialah 6.15 kitar/mm dan pendigit jenis laser pula memodulasikan isyarat 6.55 kitar/mm pada 20%. Untuk pengukuran dan pengiraan NPS keputusan yang terhasil menunjukkan pendigit jenis drum menghasilkan hingar yang lebih tinggi daripada pendigit jenis laser. Daripada pengukuran dan pengiraan yang dijalankan, dapatlah dikatakan bahawa untuk menjalankan satu ujian NDT, pengguna perlu tahu keupayaan sebenar sesebuat alat dan bagaimana ia dibina supaya ujian NDT dapat memberi gambaran tepat dan sebenar keatas sesuatu sampel atau barangan yang diuji.
J NUCL. & Rel. TECH., Volume 5, No.2, December 2008.
36
Keywords: Non destructive testing (NDT), industrial digital radiography (IDR), modulation transfer function (MTF), noise power spectrum (NPS), drum type film digitizer and laser type film digitizer.
iNtrodUCtioN
Image quality is one of the most important aspects in industrial radiography. The concept of image quality has been undergoing a transformation with the widespread use of industrial digital radiography (IDR). The new film digitization systems, such as drum and laser types begin to be used as tools to scan films for the purpose of reusability, automatic defect recognition, digitally formatted and post processing freedoms. There are two main quantitative parameters that are traditionally used as part of evaluation for radiographic image quality. The parameters are modulation transfer function (MTF), M( ) and noise power spectrum (NPS) analysis. These two quantities can be combined to produce the Detective Quantum Efficiency (DQE), which is the currently accepted standard for imaging system performance.
The MTF which is being studied in this work will represents the maximum ability of IDR modules for transferring subject contrast, to the final image as a function of spatial frequency. The performed MTF measurement used an edge spread function method as it provides convenient measurement and portrayed better accuracy at low frequencies compared to other technique (Samei, E. 1997). In this paper, two film digitization systems, such as drum and laser types are studied and evaluated in terms of spatial resolution and noise property by performing two measurements and calculations.
PriNCiPLe of MeasUreMeNt
The MTF, M( ) is commonly measured for an evaluation of the spatial resolution properties of screen-film systems (ICRU Report 41, 1986). The M( ) as defined by Rossmann (Rossmann K., 1964 ) is a measure of image deterioration due to optical factors only, such as diffusion of image forming radiation. It is a measurement of sharpness for imaging system for component of a system and measured in cycles/mm or line pair over millimetre (lp/mm). MTF also describes the transfer of sinusoidal inputs in spatial frequency domain. Mathematically, the MTF is defined as the Fourier transform of a line spread function (LSF). A respond of an imaging towards a single line input creates the LSF where it is given by the differential of the edge spread function;
))(()( xe
dxdxl
|)(|)( 2 dxexlM iux
2),(41lim),( vuFxy
vuNPS Dxy
x
x
y
yD dxdyvyuxiyxDvuF )(2exp),(),(
22 vu
pixelpitchvN .2
1
078125.005.0256
1x
u
(6)
In this work, the edge spread function (ESF), )(xe is generated by using a sharp edge image produced from radiographed phantoms. The equation pertaining to M( ) is as follow (Dainty, J. C. et al, 1974):
))(()( xedxdxl
|)(|)( 2 dxexlM iux
2),(41lim),( vuFxy
vuNPS Dxy
x
x
y
yD dxdyvyuxiyxDvuF )(2exp),(),(
22 vu
pixelpitchvN .2
1
078125.005.0256
1x
u
(7)
The NPS provide the means of characterizing image noise and play a central role in the ultimate measure of image quality; the number of noise-equivalent quanta, (NEQ) and the fourier analysis is the important method in determining the NPS (Dobbins III, J. T and Boone J. M., 1998). Noise in images is recognized as an important factor in determining image quality. In performing NPS
J NUCL. & Rel. TECH., Volume 5, No.2, December 2008.
37
measurement, transmittance and density fluctuations were mostly taken into account as part of equation derivations and in this work, a measurement based on density fluctuations was used as the transmittance fluctuations consideration and is normally done on analogue method (Dobbins III, J. T and Boone J. M., 1998 ).
))(()( xedxdxl
|)(|)( 2 dxexlM iux
2),(41lim),( vuFxy
vuNPS Dxy
x
x
y
yD dxdyvyuxiyxDvuF )(2exp),(),(
22 vu
pixelpitchvN .2
1
078125.005.0256
1x
u
(8)
where
))(()( xedxdxl
|)(|)( 2 dxexlM iux
2),(41lim),( vuFxy
vuNPS Dxy
x
x
y
yD dxdyvyuxiyxDvuF )(2exp),(),(
22 vu
pixelpitchvN .2
1
078125.005.0256
1x
u
(9)
The NPS data is plotted against normalised spatial frequency which in accordance to Equation 15 (Dobbins III et al., 1995) and this data increased until the Nyquist Frequency of the system (limiting frequency) as in Equation 16.
Spatial Frequency
))(()( xedxdxl
|)(|)( 2 dxexlM iux
2),(41lim),( vuFxy
vuNPS Dxy
x
x
y
yD dxdyvyuxiyxDvuF )(2exp),(),(
22 vu
pixelpitchvN .2
1
078125.005.0256
1x
u
(15)
where u and v are pixel pitch of each modules and normalised towards number of pixel. The
limitation to MTF and NPS is limited to frequencies below the Nyquist frequency, Nv which is related to the size of the pixels in the image as:
))(()( xedxdxl
|)(|)( 2 dxexlM iux
2),(41lim),( vuFxy
vuNPS Dxy
x
x
y
yD dxdyvyuxiyxDvuF )(2exp),(),(
22 vu
pixelpitchvN .2
1
078125.005.0256
1x
u
(16)
MateriaLs aNd Methods
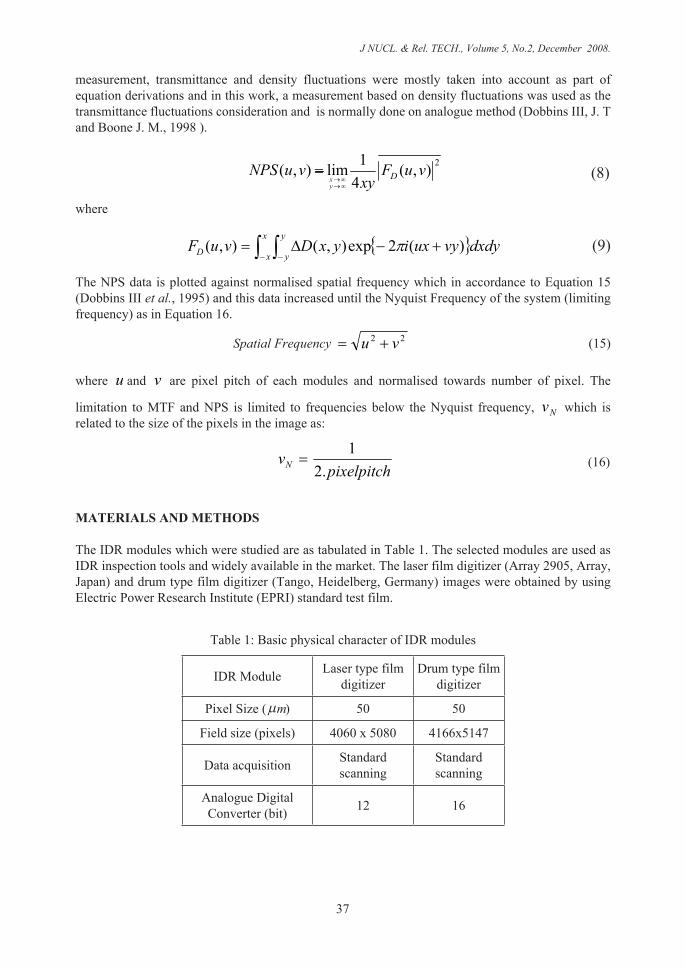
The IDR modules which were studied are as tabulated in Table 1. The selected modules are used as IDR inspection tools and widely available in the market. The laser film digitizer (Array 2905, Array, Japan) and drum type film digitizer (Tango, Heidelberg, germany) images were obtained by using Electric Power Research Institute (EPRI) standard test film.
Table 1: Basic physical character of IDR modules
IDR Module Laser type film digitizer
Drum type film digitizer
Pixel Size ( m) 50 50
Field size (pixels) 4060 x 5080 4166x5147
Data acquisition Standard scanning
Standard scanning
Analogue Digital Converter (bit) 12 16
J NUCL. & Rel. TECH., Volume 5, No.2, December 2008.
38
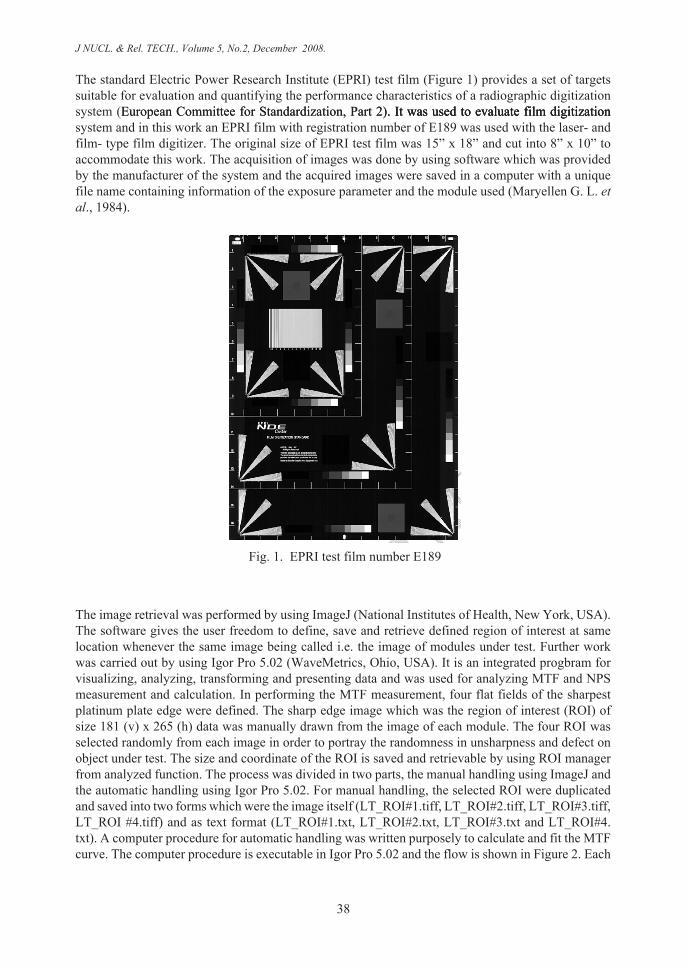
The standard Electric Power Research Institute (EPRI) test film (Figure 1) provides a set of targets suitable for evaluation and quantifying the performance characteristics of a radiographic digitization system (European Committee for Standardization, Part 2). It was used to evaluate film digitizationEuropean Committee for Standardization, Part 2). It was used to evaluate film digitization. It was used to evaluate film digitization system and in this work an EPRI film with registration number of E189 was used with the laser- and film- type film digitizer. The original size of EPRI test film was 15” x 18” and cut into 8” x 10” to accommodate this work. The acquisition of images was done by using software which was provided by the manufacturer of the system and the acquired images were saved in a computer with a unique file name containing information of the exposure parameter and the module used (Maryellen g. L. et al., 1984).JOURNAL Of NUCLEAR And Related TECHNOLOGIES, Volume 5, No.2, December 2008, x-x
4
Figure 1: EPRI test film number E189
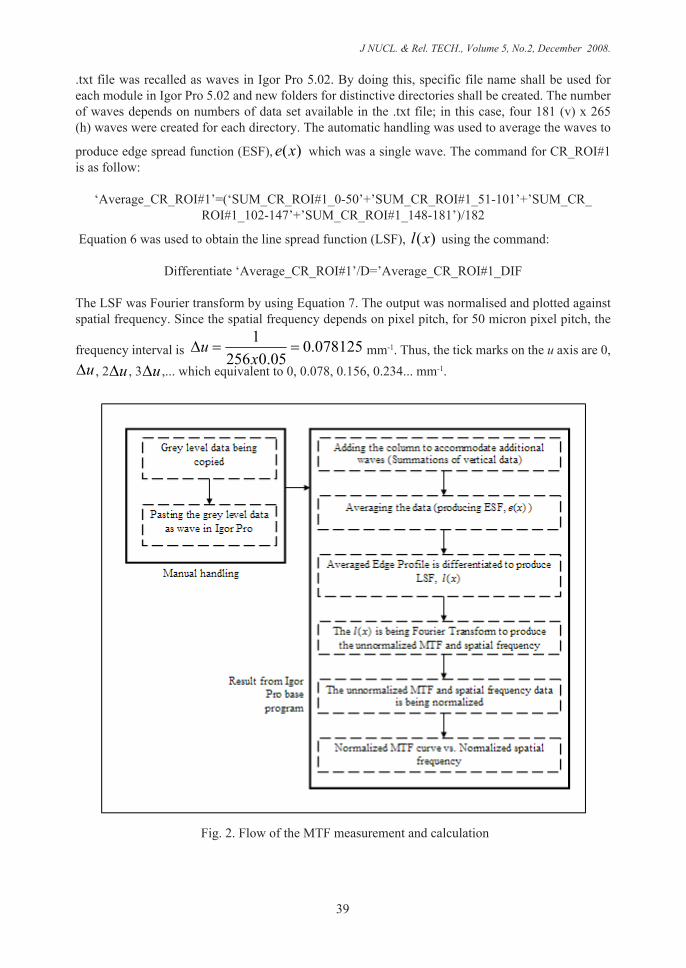
The image retrieval was performed by using ImageJ (National Institutes of Health, New York, USA). The software gives the user freedom to define, save and retrieve defined region of interest at same location whenever the same image being called i.e. the image of modules under test. Further work was carried out by using Igor Pro 5.02 (WaveMetrics, Ohio, USA). It is an integrated program for visualizing, analyzing, transforming and presenting data and was used for analyzing MTF and NPS measurement and calculation. In performing the MTF measurement, four flat fields of the sharpest platinum plate edge were defined. The sharp edge image which was the region of interest (ROI) of size 181 (v) x 265 (h) data was manually drawn from the image of each module. The four ROI was selected randomly from each image in order to portray the randomness in unsharpness and defect on object under test. The size and coordinate of the ROI is saved and retrievable by using ROI manager from analyzed function.The process was divided in two parts, the manual handling using ImageJ and the automatic handling using Igor Pro 5.02. For manual handling, the selected ROI were duplicated and saved into two forms which were the image itself (LT_ROI#1.tiff, LT_ROI#2.tiff, LT_ROI#3.tiff, LT_ROI #4.tiff) and as text format (LT_ROI#1.txt, LT_ROI#2.txt, LT_ROI#3.txt and LT_ROI#4.txt). A computer procedure for automatic handling was written purposely to calculate and fit the MTF curve. The computer procedure is executable in Igor Pro 5.02 and the flow is shown in Figure 2. Each .txt file was recalled as waves in Igor Pro 5.02. By doing this, specific file name shall be used for each module in Igor Pro 5.02 and new folders for distinctive directories shall be created. The number of waves depends on numbers of data set available in the .txt file; in this case, four 181 (v) x 265 (h) waves were created for each directory. The automatic handling was used to average the waves to produce edge spread function (ESF), )(xe which was a single wave. The command for CR_ROI#1 is as follow:
The image retrieval was performed by using ImageJ (National Institutes of Health, New York, USA). The software gives the user freedom to define, save and retrieve defined region of interest at same location whenever the same image being called i.e. the image of modules under test. Further work was carried out by using Igor Pro 5.02 (WaveMetrics, Ohio, USA). It is an integrated progbram for visualizing, analyzing, transforming and presenting data and was used for analyzing MTF and NPS measurement and calculation. In performing the MTF measurement, four flat fields of the sharpest platinum plate edge were defined. The sharp edge image which was the region of interest (ROI) of size 181 (v) x 265 (h) data was manually drawn from the image of each module. The four ROI was selected randomly from each image in order to portray the randomness in unsharpness and defect on object under test. The size and coordinate of the ROI is saved and retrievable by using ROI manager from analyzed function. The process was divided in two parts, the manual handling using ImageJ and the automatic handling using Igor Pro 5.02. For manual handling, the selected ROI were duplicated and saved into two forms which were the image itself (LT_ROI#1.tiff, LT_ROI#2.tiff, LT_ROI#3.tiff, LT_ROI #4.tiff) and as text format (LT_ROI#1.txt, LT_ROI#2.txt, LT_ROI#3.txt and LT_ROI#4.txt). A computer procedure for automatic handling was written purposely to calculate and fit the MTF curve. The computer procedure is executable in Igor Pro 5.02 and the flow is shown in Figure 2. Each
J NUCL. & Rel. TECH., Volume 5, No.2, December 2008.
39
.txt file was recalled as waves in Igor Pro 5.02. By doing this, specific file name shall be used for each module in Igor Pro 5.02 and new folders for distinctive directories shall be created. The number of waves depends on numbers of data set available in the .txt file; in this case, four 181 (v) x 265 (h) waves were created for each directory. The automatic handling was used to average the waves to
produce edge spread function (ESF), )(xe which was a single wave. The command for CR_ROI#1 is as follow:
The LSF was Fourier transform by using Equation 7. The output was normalised and plotted against spatial frequency. Since the spatial frequency depends on pixel pitch, for 50 micron pixel pitch, the
frequency interval is
))(()( xedxdxl
|)(|)( 2 dxexlM iux
2),(41lim),( vuFxy
vuNPS Dxy
x
x
y
yD dxdyvyuxiyxDvuF )(2exp),(),(
22 vu
pixelpitchvN .2
1
078125.005.0256
1x
u mm-1. Thus, the tick marks on the u axis are 0,
))(()( xedxdxl
|)(|)( 2 dxexlM iux
2),(41lim),( vuFxy
vuNPS Dxy
x
x
y
yD dxdyvyuxiyxDvuF )(2exp),(),(
22 vu
pixelpitchvN .2
1
078125.005.0256
1x
u , 2
))(()( xedxdxl
|)(|)( 2 dxexlM iux
2),(41lim),( vuFxy
vuNPS Dxy
x
x
y
yD dxdyvyuxiyxDvuF )(2exp),(),(
22 vu
pixelpitchvN .2
1
078125.005.0256
1x
u , 3
))(()( xedxdxl
|)(|)( 2 dxexlM iux
2),(41lim),( vuFxy
vuNPS Dxy
x
x
y
yD dxdyvyuxiyxDvuF )(2exp),(),(
22 vu
pixelpitchvN .2
1
078125.005.0256
1x
u ,... which equivalent to 0, 0.078, 0.156, 0.234... mm-1.
Fig. 2. Flow of the MTF measurement and calculation
J NUCL. & Rel. TECH., Volume 5, No.2, December 2008.
40
In order to determine the NPS, 10 flat-field free beam images of each module with 256 (v) x 256 (h) pixels were acquired as region of interest (ROI) by using ImageJ. The ROI was saved into two forms which were the image itself (.tiff) and as text format (.txt). The sizes and coordinates of the ROI were duplicated and saved.
The ROI was retrievable by using ROI manager from analyzed function of ImageJ. Another process function which exists in ImageJ was used to Fourier transform the image data in accordance with Equation 8 which estimates the noise power spectrum (NPS) of the recorded image noise from the averaged data. The data were then saved into two forms namely the .tiff format and .txt text format. The averaging procedure was performed by using Microsoft Excel and the averaged product was saved in text format. The text format was retrieved by using ImageJ and this gave the 2D NPS data. A profile for u128 to u256 gave the NPS curve. Thus 2D NPS was obtained by the 2D Fourier transformation of noise data. The noise power along u axis was taken as the NPS curve. The data was then saved as .txt format and plotted against its spatial frequency. Figure 3 shows the diagram in performing the NPS measurement.
Fig. 3. The flow procedure in performing the NPS measurement by using 2 dimensional (2D) Fourier transform method
J NUCL. & Rel. TECH., Volume 5, No.2, December 2008.
41
resULt aNd disCUssioN
Modulation transfer function (Mtf), M( )
3500
3000
2500
2000
1500
Gre
y va
lue
250200150100500Pixel
Laser Film Digitizer 50 micron Edge Spread Function (ESF)
'ROI#1' 'ROI#2' 'ROI#3' 'ROI#4'
-800
-600
-400
-200
0
200
400
600
800
Gra
die
nt
250200150100500Pixel
Laser Film Digitizer 50 micron Line Spread Function (LSF)
'ROI#1' 'ROI#2' 'ROI#3' 'ROI#4'
(a) (b)
1.0
0.8
0.6
0.4
0.2
0.0
MTF
1086420Spatial Frequency (cycles/mm)
Laser Film Digitizer 50 micron Modulation Transfer Function for:
'ROI #1' 'ROI #2' 'ROI #3' 'ROI #4'
(c)
Fig. 4. (a) Edge Spread Function, (b) Line Spread Function and (c) Modulation Transfer Function of four Regions of Interest of Laser Film Digitizer system 50 micron system
J NUCL. & Rel. TECH., Volume 5, No.2, December 2008.
42
25x103
20
15
10
Gre
y va
lue
250200150100500Pixel
Drum Scanner 50 micronEdge Spread Function (ESF)
'ROI#1' 'ROI#2' 'ROI#3' 'ROI#4'
8000
6000
4000
2000
0
Gra
die
nt
250200150100500Pixel
Drum Scanner 50 micron Line Spread Function (LSF)
'ROI#1' 'ROI#2' 'ROI#3' 'ROI#4'
(a) (b)
1.0
0.8
0.6
0.4
0.2
0.0
MTF
1086420Spatial Frequency (cycles/mm)
Drum Scanner Film Digitizer 50 micronModulation Transfer Function for:
'ROI#1' 'ROI#2' 'ROI#3' 'ROI#4'
(c)
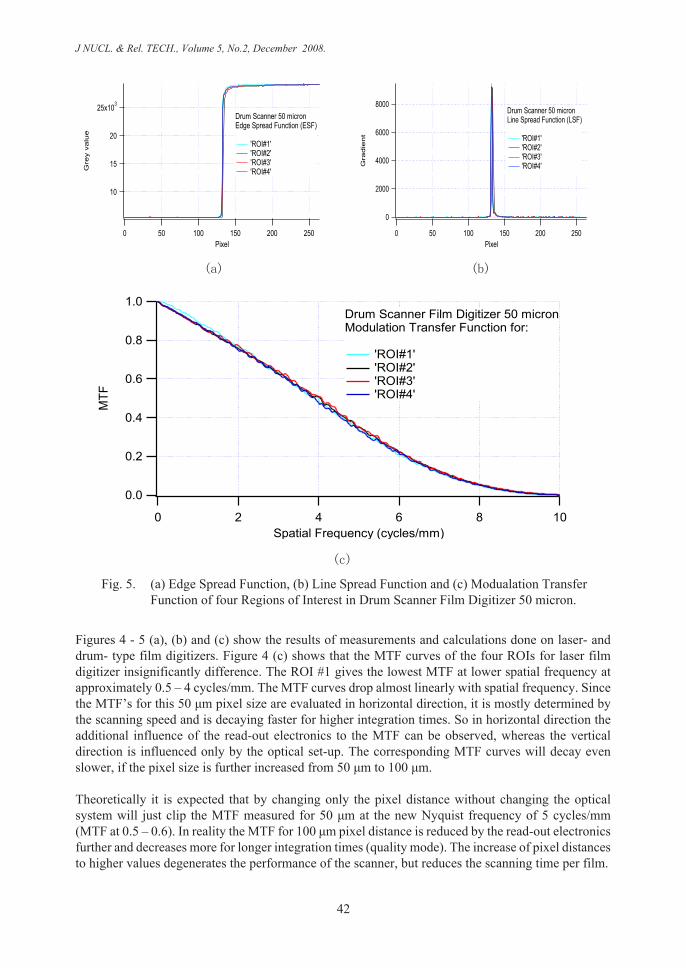
Fig. 5. (a) Edge Spread Function, (b) Line Spread Function and (c) Modualation Transfer Function of four Regions of Interest in Drum Scanner Film Digitizer 50 micron.
Figures 4 - 5 (a), (b) and (c) show the results of measurements and calculations done on laser- and drum- type film digitizers. Figure 4 (c) shows that the MTF curves of the four ROIs for laser film digitizer insignificantly difference. The ROI #1 gives the lowest MTF at lower spatial frequency at approximately 0.5 – 4 cycles/mm. The MTF curves drop almost linearly with spatial frequency. Since the MTF’s for this 50 μm pixel size are evaluated in horizontal direction, it is mostly determined by the scanning speed and is decaying faster for higher integration times. So in horizontal direction the additional influence of the read-out electronics to the MTF can be observed, whereas the vertical direction is influenced only by the optical set-up. The corresponding MTF curves will decay even slower, if the pixel size is further increased from 50 μm to 100 μm.
Theoretically it is expected that by changing only the pixel distance without changing the optical system will just clip the MTF measured for 50 μm at the new Nyquist frequency of 5 cycles/mm (MTF at 0.5 – 0.6). In reality the MTF for 100 μm pixel distance is reduced by the read-out electronics further and decreases more for longer integration times (quality mode). The increase of pixel distances to higher values degenerates the performance of the scanner, but reduces the scanning time per film.
J NUCL. & Rel. TECH., Volume 5, No.2, December 2008.
43
The MTF curves of the drum scanner film digitizer are almost the same and the curves can hardly be distinguished and are nearly straight until 6 cycles/mm. The almost straight line which is portrayed in Figure 5 (c) is a typical character of a film digitizer as it results from running mean or moving averaging process that the scanner used to acquire the image and collecting the grey value. This behaviour can also be seen in Figure 4 (c). After 6 cycles/mm, the curve started to incline due to electronic noise which degrades the MTF further to lower value.
Table 2: Estimation of 20% modulation from each modality on each four Region of Interest (ROI)
Table 2 shows the estimation of spatial frequency at which 20% modulation, MTF20% occurred. The average MTF20% for each modality is also given in the table. The laser film digitizer and drum scanner film digitizer gave the best modulation value due to the film characteristic that has a good response towards incident radiation
Fig. 6. Averaged Modulation Transfer Function (MTF) for each modality
Figure 6 shows the average MTF of each film digitizer. The average MTF was calculated from four ROI of each modality. The figure summarises the results of MTF measurement and calculation and shows the MTF for both film digitization systems.
J NUCL. & Rel. TECH., Volume 5, No.2, December 2008.
44
Noise Power spectrum (NPs) Measurement
6.0x10⁻⁶
5.5
5.0
4.5
4.0
Noi
se P
ower
543210Spatial Frequency (cycles/mm)
Noise Power Spectrum (NPS)
'Drum Scanner Film Digitizer - 50 micron' 'Laser Film Digitizer - 50 micron'
Fig. 7. The Noise Power Spectrum (NPS) curves of the four IDR modalities up to 5 cycles/mm.
Figure 7 shows the NPS of the two modalities for the main frequency axes. The two film digitizerThe two film digitizer systems have significantly different noise power spectra – similar to the differences in MTF. Between the laser- and drum- type, the NPS curve for the laser type is lower than the drum type. In case of too many spikes exist in both film digitization systems, it maybe due to grain of the film it self which contributes to the spikes.
CoNCLUsioN
Two quantitative methods in determining quality of digital images produced by laser and drum type film digitizers were performed. The result shows that the averaged MTF at 20% modulation for laser type film digitizer system is 6.55 cycles/mm where else the drum type film digitizer modulate 6.15 cycles/mm. The laser type film digitizer produced less noisy image compared to drum type. From the result, laser type film digitizer is the most suitable system to be used in obtaining IDR images and the MTF determination shows dependency on sampled noise. The lower MTF value for drum type film digitizer might come from noisy image and causes the declination of MTF curve after 6 cycles/mm. By using the two quantitative methods, NDT practitioner could know in which conditions, certain modalities are used especially when it involves a very critical inspection and needs a precise indication of discontinuities.
J NUCL. & Rel. TECH., Volume 5, No.2, December 2008.
45
aCKNowLedgeMeNt
The authors would like to thank Dr. Uwe zscherpel and Dr. Oleksandr Alekseychuk of Federal Institute for Materials Research and Testing (BAM), Berlin for assistance in acquiring the digital images and Research Management Centre (RMC) of Malaysian Nuclear Agency for funding this work.
refereNCes
Dainty, J. C. and Shaw, R., (1974), Image Science, London, Academic Press.
Dobbins III, J. T and Boone J. M., (1998), A simplified method of estimating noise power spectra. Physics of Medical Imaging. Proc. SPIE 3336. 243-250.
Dobbins III, J. T., Ergun, D. L., Rutz, L., Hinshaw, D. A., Blume, H. and Clark, D. C., (1995),.DQE(f) of four generations of computed radiography acquisition devices. Medical Physics, 22, 1581–1593.
European Committee for Standardization, (2002), Non-destructive testing - Qualification of radiographic film digitisation systems - Part 2: Minimum requirements digitisation systems - Part 2: Minimum requirementsdigitisation systems - Part 2: Minimum requirements. EN 14096-1.EN 14096-1.
ICRU – Modulation Transfer Function of Screen-Film System, ICRU Report 41, (1986), International Commission on Radiation Units and Measurements, Bethesda, Maryland, USA.
Maryellen g. L., Doi K. and Metz C. E., (1984), Investigation of basic imaging properties in digital radiography. 2. Noise Wiener Spectrum. Med. Phys. 11(6): 797-805.
Rossmann, K., (1964), Measurement of the Modulation Transfer Function of Radiographic Systems Containing Fluorescent Screens. Phys. Med. Biol. vol. 9 (4): 551- 557.
Samei, E., (1997), The performance of Digital x-ray imaging systems in detection of subtle lung nodules. PhD Thesis, University of Michigan.