Competitiveness and the future of carbon trading: a European perspective Michael Grubb Chief Economist, Carbon Trust & Chairman, Climate Strategies Chief Economist, Carbon Trust & Chairman, Climate Strategies Senior Research Associate, Faculty of Economics, Cambridge University Visiting Professor Imperial College London Visiting Professor, Imperial College London
Transcript
Competitiveness and the future of carbon trading: a European perspective
Senior Research Associate, Faculty of Economics, Cambridge UniversityVisiting Professor Imperial College LondonVisiting Professor, Imperial College London
Outline
The evolution of the European Emissions Trading Scheme to date:– Phase I lessons– Technical lessons, ‘devil in the detail’
Ph II ll ti liti & i li tiPhase II allocation, politics & implicationsAllocation, profits and competitivenessBeyond 2012Beyond 2012Core Conclusions
EU Emissions Trading Scheme –the central instrument for emission reduction and ‘b kb ’ f l‘backbone’ of Kyoto implementation
All EU 27 t i • All EU 27 countries • All electricity, ferrous metals, cement, refineries, pulp & paper, glass and all facilities > 20MW, total 46% of EU emissions• Aviation to be included from 2011 (internal) and 2012
Participants
( )(external)• International links through Kyoto project crediting
• Member states develop National Allocation Plans (NAPs) by sector and installation• To be consistent with Kyoto targets and anti-subsidy provisions
Allocation
provisions
1. 2005-7: phase 1, no national target, opt-out provisions2 2008 12 d b K t t t t i ibilitiPh 2. 2008-12: governed by Kyoto target, opt-in possibilities3. 2013+: Design proposals published 23 Jan
Phases
Phase I prices volatile, complex determinants, and ended with slide towards zero whilst forward market f Ph II t k t i [US$25 35]/tCO2for Phase II took over at price range [US$25-35]/tCO2
EU ETS Price Development
35.00
40.00 Phase I AllowancesPhase II Allowances (2011)Phase II Allowances (2008)
25.00
30.00
uros
)
15.00
20.00
EUA
Pric
e (E
u
0.00
5.00
10.00
01/11
/2004
01/01
/2005
01/03
/2005
01/05
/2005
01/07
/2005
01/09
/2005
01/11
/2005
01/01
/2006
01/03
/2006
01/05
/2006
01/07
/2006
01/09
/2006
01/11
/2006
01/01
/2007
01/03
/2007
01/05
/2007
Phase I, intended as the initial, trial phase, proves success in market design and verification, reveals important lessons on profits and allocation
An EU-wide market that gives value to company efforts to reduce CO2 emissions and incentivises them to seek out the reduce CO2 emissions, and incentivises them to seek out the least-cost means of doing soThe market mechanics have worked well – extensive trading through various mechanismsthrough various mechanismsThe stringent verification requirements have proved effective and valuable
B t i ti b t h th th th h ld f 20MW .. But raise questions about whether the threshold of 20MW thermal is too low, increasing transaction costs for small environmental gainDi t ti th f th l i 2005 Disputes continue over the reasons for the surplus in 2005 -but it is some combination of overallocation and greater than predicted abatement (eg. in cement sector)
2005 S l 5% – 2005 Surplus was 5% – Abatement represented … how much .. 25-75% of this ?
Lessons from Phase I – complex price incentives and big profits for power generators - also link emerging between rents and technology investment
•Power sector profits from EU EU ETS Price Development
•Power sector profits from EU ETS €5bn+ during 2005
•Likely aggregate Phase II profits €5-10bn/yr @ €20/tCO230 00
35.00
40.00 Phase I AllowancesPhase II Allowances (2011)Phase II Allowances (2008)
profits €5 10bn/yr @ €20/tCO2
•International and sectoral investment linkages emerging through the CDM
International negotiations and Nairobi20.00
25.00
30.00
rice
(Eur
os)
through the CDM
•Also funding technology
•E.On announce €100m R&D Centre
UK E i t l T f ti
10.00
15.00EUA
P
•UK Environmental Transformation Fund announced ‘co-incident’ with Auctioning decision
The market ‘crash’ – and reactions - point to the core issuespoint to the core issues
“Allocation, allocation, and allocation ….” The danger of small cutbacks combined with projection uncertainties:uncertainties:– “Energy forecasting was invented to make economic
forecasting look good …”“Politics of forecasting” has been acknowledged for – “Politics of forecasting” has been acknowledged for more than two decades
Gaming of the system given asymmetric informationlack of ha monisation makes it a p oblem of EU lack of harmonisation makes it a problem of EU coordinationThese and lack of post 2012 certainly are looming concernsconcerns
“Energy forecasting was invented to make economic forecasting look good ”economic forecasting look good …
The ‘politics of forecasting’ was acknowledged two decades ago ..– “largely because of the importance of forecasters in the
policy process, they are subject to a variety of influences which prevent their forecasts from being objective” (review f B d Midd Th P li i f E of Baumgartner and Middtun, The Politics of Energy
Forecasting, 1987)Improved forecasting at national level masks sectoral errors :– “Low errors for total energy consumption are concealing
much larger sectoral errors .. [for EIA] 5-year forecasts made between 1982 and 1998 industrial sector was
ti t d b f 5 9% d th overestimated by an average of 5.9%, and the transportation sector was underestimated by an average of 4.5%. .. no evidence that forecasts within each sector have improved over the two decades studied here ” (Winebrake improved over the two decades studied here. (Winebrake and Sakva, 2006)
No comparable dataset outside the US
Systematic upward bias in emission projections is to be expected and the empirical evidence is now overwhelming
At least three factors explain upward bias in emission projections– Inherent optimism of macroeconomic and sector growth
assumptions: no-one plans for or promotes the possibility of underperformance or failure
– The ‘gaming’ incentives combined with asymmetric i f ti b t t d i d tinformation between government and industry
– ‘You don’t know what you don’t know’ in emission abatement possibilities: repeated evidence of ‘awareness’ effects in mitigation delivery
Th i i l id i i i t t d h l iThe empirical evidence in is consistent and overwhelming– UK ETS– Climate Change Agreements – .. And now European-wide overallocation for 2005p
“From a limited evidence base, we conclude that uncertainty is at least ±2%/yr, overlaying an upward bias (projection inflation) on the order of 1%/yr, cumulative … this has important implications both for allocation approaches, and for
h d i l i h EU ETS” (G bb d F i some other design elements in the EU ETS” (Grubb and Ferrario, Climate Policy 6:4)
Phase II allocation and Phase II allocation and implementation issues
Context for Phase II allocations(K t fi t i d 2008 12)(Kyoto first period, 2008-12)
Deadline for Phase II NAPs to be submitted was just a few k ft th l f th Ph I ifi ti d tweeks after the release of the Phase I verification data
Continued diverse perspectives on prospects with big downside potential on prices
L l f CDM / JI di (100 200 M CO2/ – Large volume of CDM / JI credits (100-200 MtCO2/yr through period from CDM alone)
– Additional potential governmental supply associated with Kyoto surplus in eastern Europe and other Transition Kyoto surplus in eastern Europe and other Transition Economies
– Baselines have been universally readjusted to world of high gas prices: fall in gas prices could remove 10s MtCO2 high gas prices: fall in gas prices could remove 10s MtCO2 from market
Auctioning restricted to 10% of total allocations; a continuing hot topic of debate hot topic of debate Competitiveness unlikely to be problem in course of Phase II but is a strategic issue about expected future revenue streams from investment in different regions
Commission intervention cut more than 10% from Member State proposalsbased on Kyoto consistency & anti-subsidy provisions
30%
UK
Spain
10%
20%
)
Actual reduction in EU ETS Phase II NAP
Austria
Germany
Greece
IrelandNetherlands
B l i
-10%
0%-50% -40% -30% -20% -10% 0% 10% 20% 30% 40%
s 20
05 E
mis
sion
s (%
)
Poland
Czech Republic Sweden
BelgiumFrance
-30%
-20%
duct
ion:
PII
NA
Ps v
s
Slovakia
Poland
Luxembourg
-50%
-40%
Act
ual r
ed
EU ETS Sector "proportional
tb k" li
-70%
-60%
Required reduction: Kyoto Target vs 2004 emissions (%)
cutback" lineEstimated reductions required by Kyoto target
The politics & implications of th E ll ti b ttlthe European allocation battle
The general context of European target-setting Initial EU hesitation at US proposal on ‘legally binding’ for the Kyoto targetsSet in context of the European politics of climate and Kyoto… and the German G8 PresidencyAn interesting take on the ‘bottom-up vs top-down’ debate to climate policyF d t l hift i th b i t tiFundamental shift in the core business expectations– Price expectations €20-25/tCO2 for Phase II (to 2012)– Expectations of higher carbon prices post 2012– Price volatility still likely, though on much lesser scale
than Phase I (dampened by banking, and could be managed through reserve price on auctions)
Intervention rescued Phase II and made it both economically and environmentally credible
MtCO2/year
- but given still modest cutbacks, prices unstable?
2000
2500
Final 88
125 Proposed NAP II**
Price setby price floor
1500 NAP II + (JI/CDM range)
NAP II***
Adjustments for opt-in in Phase II
Other Adjustments*
ocat
ion
ocat
ion
500
1000
Verified
Max projection
Min Projection
20% projections60%projections Fr
ee a
llo
Free
allo
02005 2008 2009 2010 2011 2012
Verified Emissions
Avg. 2008-12
Min Projection
C di t d ti ith i fl d i k f l iCoordinated auction with price floor can reduce risk of low prices
Source: Emissions Projections 2008-2012 versus NAP2 (2006) by Neuhoff, Ferrario, Grubb, Gabel, and Keats and . Published in Climate Policy 6(5), pp 395-410.
Design distortions the ‘devil in Design distortions – the devil in the detail’
Repeated allocations to power sector incumbents can lead to significant distortions, -d d t d d ll ti th ddegree and nature depends on allocation method
AuctionCapacity only XCapacity only X
Capacity by fuel/plant type X XOutput only X X
Output by fuel/plant type X X XUpdating fromPrevious periods
Benchmarking
Xp y p ypEmissions X X X XPrevious periods
X
• Increased expenditure on extending plant-life
Impacts
• Inefficient fuel choice• Less efficiency improvements
Closure and new entrant allocation rules can induce additional investment-related
Executive Summary: Distortions from allocation
can induce additional investment related distortions
Withdrawing allocations upon power station closure (“ i ” ll i ”) l d d lif i (“contingent” allocation”) leads to unwarranted life-time extensions (relative to new build), increasing system costs and allowance pricesAll ti l t f ll t t t tl Allocation plans grant free allowances to new entrants partly to compensate for distortions created by closure conditionsIf new entrant allocation is fuel or technology-specific– The more CO2-intensive technology is shielded from CO2 costs
but benefits disproportionately from price uplift– Leads to inefficient additional investment in carbon-intensive
plants extra costs and higher long term electricity pricesplants, extra costs, and higher long term electricity prices
If new entrant allocation is based on uniform benchmark (tCO2/kWe)
Acts as a capacity payment supporting all new investment– Acts as a capacity payment supporting all new investment– Can reduce electricity prices as it reduces scarcity premium and
lowers marginal carbon intensity over time
Profits and competitiveness
Project convened by:
Competitiveness impacts in a world of unequal action are small macroeconomic, but significant sectoral for
Lime
All ti d d t (di t) CO t / GVA40%
a few specific cases
ed a
t Sta
ke
Other inorganic Household paper Casting of iron
Allocation dependent (direct) CO2 costs / GVA
Electricity (indirect) CO2 costs / GVA
30%
40%
s Va
lue
Add
e
Fertilisers & Nitrogen
gbasic chemicals
MaltCoke oven
Industrial gasesNon-wovens
Household paper
CopperCasting of iron
Flat glassVeneer sheets
20%
30%
xim
um G
ross
Cem
ent
iron
& s
teel
Malt
Hollow glass
Finishing
Rubber tiers & tubes
20%
Pote
ntia
l Max
Bas
ic
Alum
iniu
m Pulp &Paper
Refined petroleumof textiles10%
Hourcade et.al. Differentiation and dynamics of EU ETS industrial competitiveness impacts. Embargoed until publication Nov 2007.
P A
UK GDP
CO2 = €20/t CO2; Electricity = €10/MWh
0%
0.0% 0.2% 0.4% 0.6% 0.8% 1.0%
Allocation, profit and competitiveness:d di h Fi P i i lunderstanding the Five Principles
• In general, the economic rents associated with CO2 constraints g ,mean that free allocation gives potential to profit, subject to:
(a) degree of alignment of allowances with costs (eg. Not sectors outside EU ETS or affected primarily by electricity pass-through costs)
(b) constraints on cost pass through due to imports and other factors(b) constraints on cost pass-through due to imports and other factors
Profit and market share are not synonymous, and in short term they are usually in oppositionAccumulated evidence confirms that where there are competitive Accumulated evidence confirms that where there are competitive power markets, power sector is passing through bulk of opportunity costs, resulting in substantial profits and downstream costsMost other sectors within EU ETS can be expected to profit but to much less degree with some loss of market share over time details much less degree, with some loss of market share over time, details complicated by details of market regulation, by international trade, and by downstream company, regional and product differentiationNew entrant, closure, and incumbent allocation rules all affect the , ,incentives, pricing and efficiency of the scheme
Out of 159 UK manufacturing activities studied, only a few are potentially exposed: l ifi ti &classification & responses
Significantly:cement/clinker;
EU cement and steel producers could lose up to 8% market share to overseas production in central price cases withcement/clinker;
steel from blast oxygen furnaces; aluminium.
share to overseas production in central price cases with highest trade sensitivities. Sufficient free allocation to maintain their profits can buy time to negotiate a multilateral response to trade exposure.
Pl ibl Sh ld b i h EU ETS i h i f fPlausibly :fertilisers & nitrogen compounds; ‘other’ inorganic basic chemicals; pulp and paper
Should be in the EU ETS with a compensating rate of free allocation, combined with others measures to help them tackle their exposure to carbon and electricity costs.
Potentially at higher C prices:some refineries;manufacture of glass; household paper;
At higher carbon prices some products from some refineries and from a few other big activities could face trade impacts. Should be in the EU ETS; modest free allocation in Phase III, particularly for new sectors. would protect profits and give time ouse o d pape ;
tyres; copper; possibly 1-2 other basic chemicals
pa t cu a y o e secto s ou d p otect p o ts a d g e t eto invest in lower carbon solutions, but should not extend beyond that.
Exposed but very small: Loss of market share to overseas production would involveExposed, but very small:Notably lime production
Loss of market share to overseas production would involve tiny absolute carbon leakage. A political decision as to whether to ignore, offer protection, or exempt.
Combination of allocation and cost pass-through decisions drive profit or loss- latter drives consumption, leakage & hence production impact
Design of the EU ETS post 2012
Setting the sceneSetting the scene
the EU Council of Ministers ’20:20:20 by 2020’ targets:– 20% GHG below 1990 – 20% improvement in energy intensityg– 20% of EU-27 final energy consumption from renewables
responsibility of Commission to bring forward implementation proposals, released 23 Jan:proposals, released 23 Jan:– Phase III design of the EU ETS– National CO2 emission targets for rest of economy
Renewables Directive devolving renewables obligations for – Renewables Directive devolving renewables obligations for each Member State with ‘origin’ flexibility
The goal of Europe as a leader in low carbon, high efficiency and renewables towards deep mid Century reductionsand renewables towards deep mid-Century reductions
Key points of the Commission EU ETS lEU ETS proposal
Scope, definitions and legal bases– Definitional clarifications & thresholds – combustion plants; small
installations– New sectors
– Deletion of “ferrous” – Aluminium & other non-ferrous includedDeletion of ferrous Aluminium & other non ferrous included– Rock wool, gypsum – for ‘balance’ with glass wool– Chemical industry the big one (basic organic; nitric, adipic, glyoxal
and clyoxoylic acid; ammonia..)H2 production soda ash and sodium bicarbonate– H2 production, soda ash and sodium bicarbonate
– + CCS-related technologies
Harmonised allocations – the disappearance of National Allocation Plans and shift to auctioning as the ‘default’g– no free allocation for power – Others:
– free allocation for manufacturing declining from a 2005 base year (based on 2005 verified emissions) towards zero by 2020(based on 2005 verified emissions) towards zero by 2020
– Up to 100% free for ‘internationally exposed ….’ with 2011 review– The East-west tension and 10% allowance (auction) redistribution
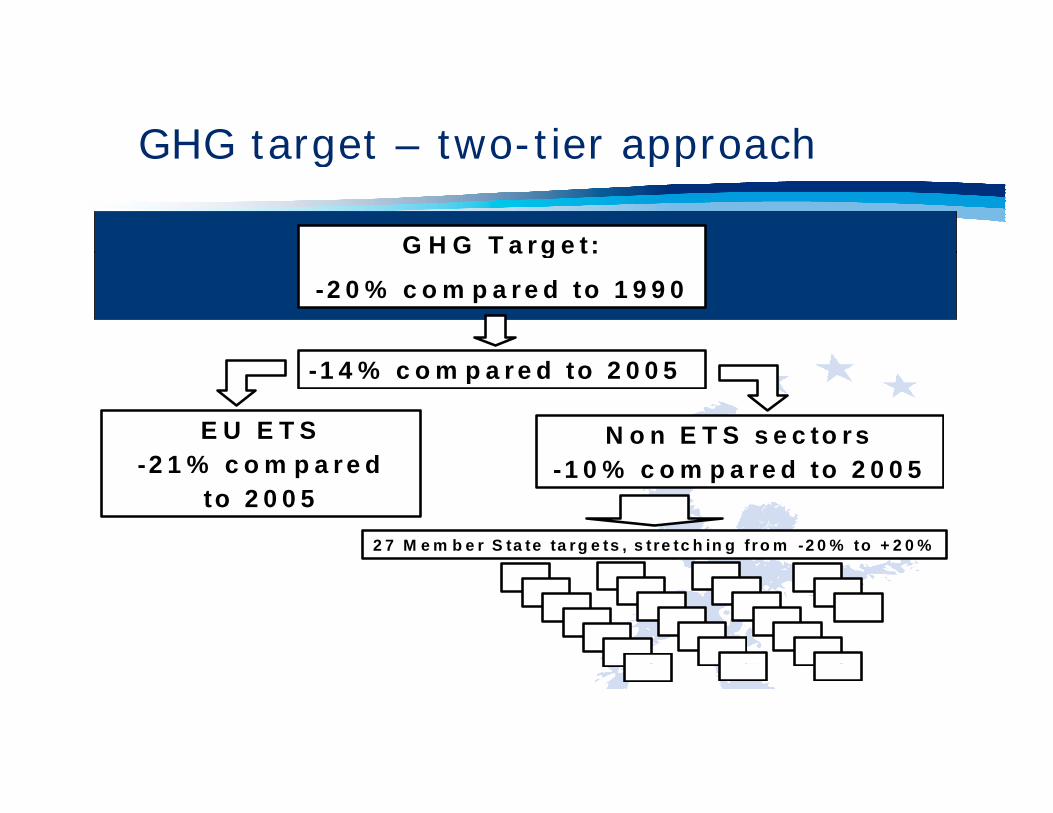
GHG target – two-tier approachGHG target two tier approach
G H G T a r g e t :G H G T a r g e t :
-2 0 % c o m p a r e d to 1 9 9 0
-1 4 % c o m p a r e d to 2 0 0 5
E U E T S2 1 % d
N o n E T S s e c to r s -2 1 % c o m p a r e d
to 2 0 0 5-1 0 % c o m p a r e d to 2 0 0 5
2 7 M e m b e r S ta te ta rg e ts , s t re tc h in g f ro m -2 0 % to + 2 0 %
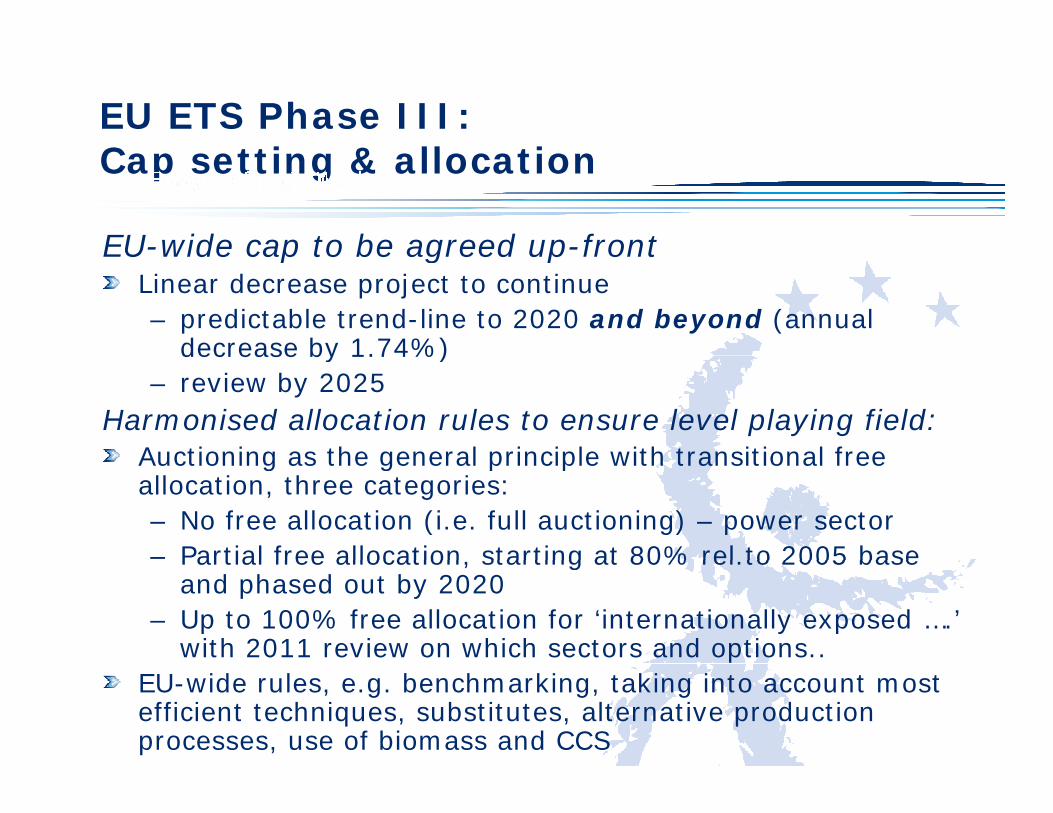
EU ETS Phase III: C tti & ll tiCap setting & allocation
EU-wide cap to be agreed up-front EU wide cap to be agreed up front Linear decrease project to continue– predictable trend-line to 2020 and beyond (annual
decrease by 1.74%)decrease by 1.74%)– review by 2025
Harmonised allocation rules to ensure level playing field:Auctioning as the general principle with transitional free Auctioning as the general principle with transitional free allocation, three categories:– No free allocation (i.e. full auctioning) – power sector– Partial free allocation starting at 80% rel to 2005 base Partial free allocation, starting at 80% rel.to 2005 base
and phased out by 2020– Up to 100% free allocation for ‘internationally exposed ….’
with 2011 review on which sectors and options..EU-wide rules, e.g. benchmarking, taking into account most efficient techniques, substitutes, alternative production processes, use of biomass and CCS
Auctions and moneyAuctions and money
Shifting the reference point to auctioning (link also to liberalisation /price controls) : – Auctioning rights distributed to Member States, but relatively
more rights to MS with lower GDP/capita to balance high i t t tinvestment costs
– Auctions must be non-discriminatory, open to everybody and will be carried out by Member States on the basis of harmonised rulesharmonised rules
20% of auction revenues should be used for combating climate change and promoting renewable energiesclimate change and promoting renewable energies– a tentative shift in emphasis about what’s required to solve
climate (maybe even re balance between competition policy and environmental policy)
The many roles of the ‘Kyoto h i ’mechanisms’
Complex rules around use of the CDM U d j t dit i t b k d f 2012– Unused project credits in system banked from 2012
– Automatic post 2012-crediting for projects from Least Developed Countries
– Non-traded sector access – ‘Community projects’– More expansive rules in event of international agreement
Incentives to participation– Much more generous rules Much more generous rules – To match much stronger commitment, -30% below 1990, in
event of international agreement The balancing act:
Flexibility without undermining domestic effort– Flexibility without undermining domestic effort– Efficiency without unacceptable levels of international transfers– CDM as political glue – reference to crediting rules even in absence of international
d ldeal, etcUse of revenues for international cohesion
Going for broke, or going for gold? Implications of the 30% targetp g
Symbiotic relationship between EU ETS and Kyoto in first Commitment Period (CP1), and between strengthened EU ETS and CP2The international scene after Bali – Kyoto II track joined by global track for Copenhagen
that requires US to take on “quantified commitments”, also see this in context of Presidential race
– Japanese developments– May address “equity” but not “competitiveness”
concerns– Same may be true of sectoral agreements
EU implications of a 30% targetBrainstorm Brainstorm
Using auction revenuesUsing auction revenues
PRELIMINARY EU PROJECTIONS at €20/tCO2
30
35OtherPower sector
The issues:
Hypothecation
PRELIMINARY EU PROJECTIONS at €20/tCO2
WITHOUT any 100% free sectors DO NOT QUOTE OR CITE
20
25e
ve
nu
es
€b
n
UK Auction revenues
yp
Governance
Applications:
5
10
15
Au
cti
on
re
RenewablesThe non-
ETS sectorsAdaptation
0
5
2013 2014 2015 2016 2017 2018 2019 2020
Climate Strategies research & website as a public source of information and EU ETS: Learning the Lessons
a public source of information and analysis
www.climate-strategies.orggCS supports Climate Policy as the leading applied research journal
ETS Special Issues of Climate Policy:
Allocation and competitivenessVol.6 no.1, June 2006
Phase I Lessons and Phase II analysisVol.6 no.4, March 2007 ( bli h d li 13 M h)(published online 13 March)
www.climatepolicy.com
Climate Strategies EU ETS 2006 research sponsored by Carbon Trust, DEFRA, DTI, Dutch Min. Econ., Swedish Min.Sus Dev, and BP