www.all4inc.com Philadelphia, PA | 610.933.5246 Atlanta, GA | 678.460.0324 Houston, TX | 281.937.7553 Washington, DC | 703.793.9103 Complying with the NAAQS – PM 2.5 Air Quality Modeling Considerations Dan Dix | [email protected] | 610.933.5246 x118 May 12, 2015 Presented to NCASI Northern Regional Meeting by All4 Inc.
Transcript
www.all4inc.com Philadelphia, PA | 610.933.5246
Atlanta, GA | 678.460.0324 Houston, TX | 281.937.7553
Washington, DC | 703.793.9103
Complying with the NAAQS – PM2.5 Air Quality Modeling
2 Your environmental compliance is clearly our business.
Agenda
PM2.5 NAAQS (Where are we now)
Fugitive PM2.5 Impacts vs. Point Source in the forest products industry
Ambient Air Boundary (Important for PM2.5 fenceline impacts)
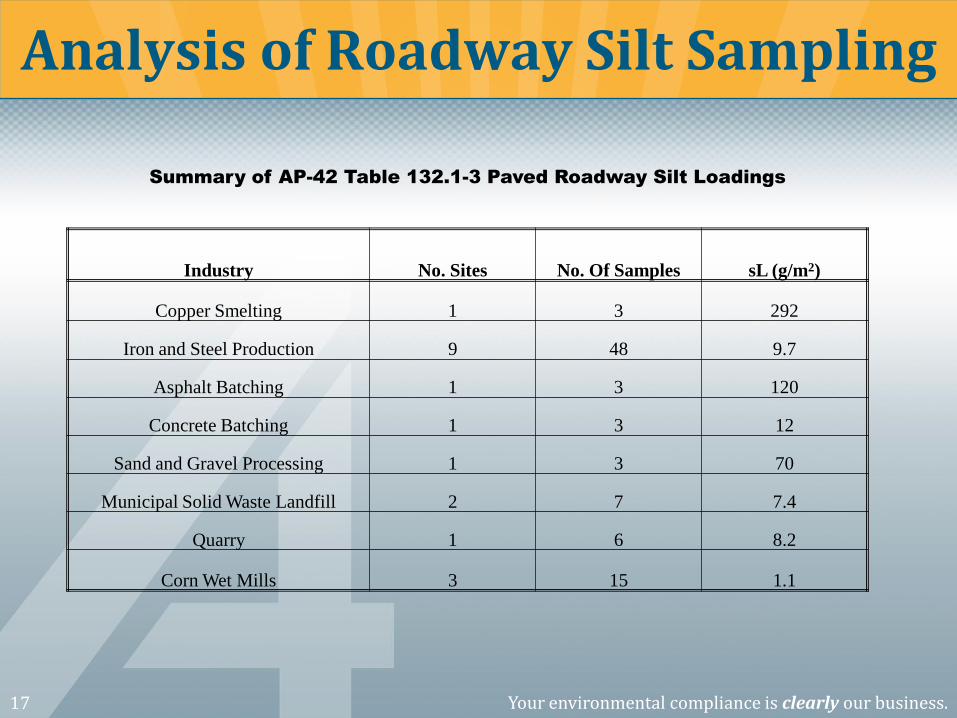
Source Information (Roadway and Storage Pile Silt Content)
PM2.5 Background Concentrations for NAAQS Analyses
Beta Options (LOWWIND1 and ADJ_U*)
Meteorological Data (Onsite vs. NWS)
Additional Considerations
3 Your environmental compliance is clearly our business.
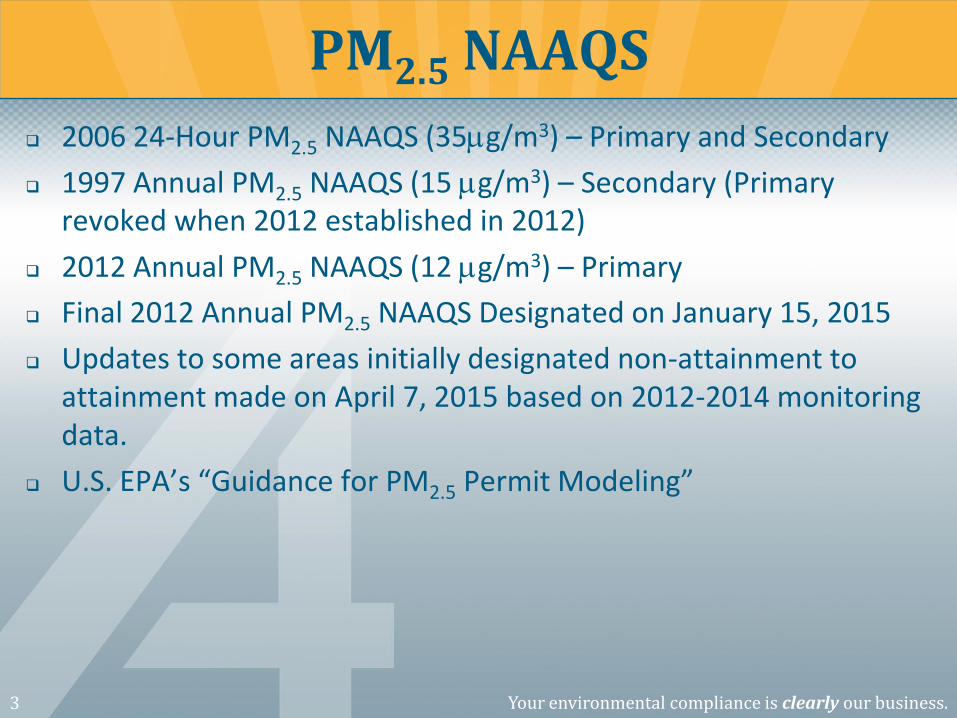
PM2.5 NAAQS
2006 24-Hour PM2.5 NAAQS (35mg/m3) – Primary and Secondary
1997 Annual PM2.5 NAAQS (15 mg/m3) – Secondary (Primary revoked when 2012 established in 2012)
2012 Annual PM2.5 NAAQS (12 mg/m3) – Primary
Final 2012 Annual PM2.5 NAAQS Designated on January 15, 2015
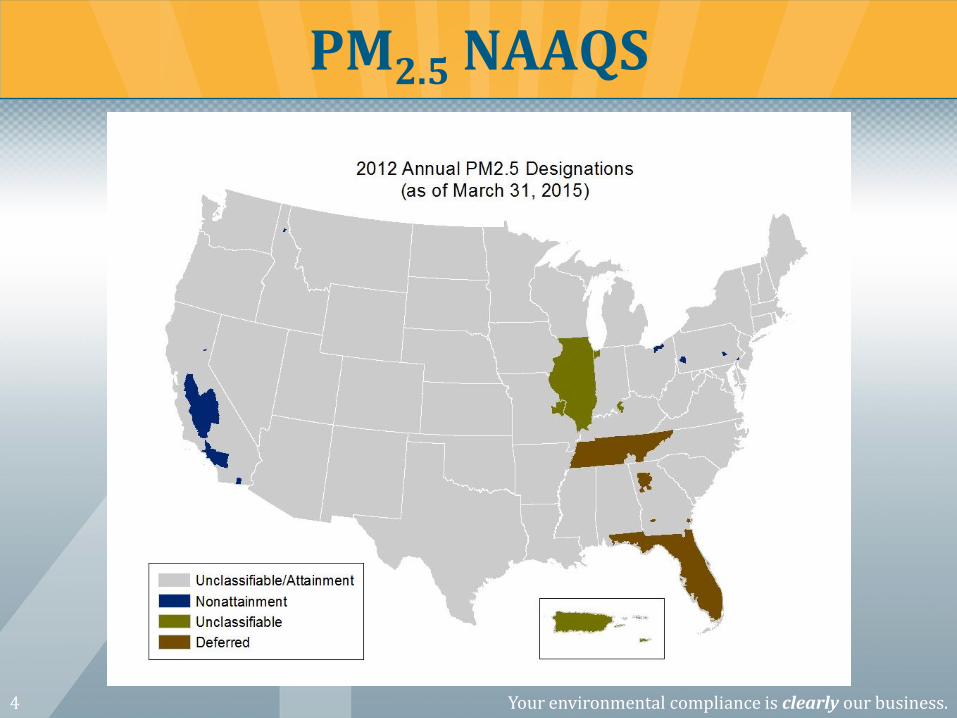
Updates to some areas initially designated non-attainment to attainment made on April 7, 2015 based on 2012-2014 monitoring data.
U.S. EPA’s “Guidance for PM2.5 Permit Modeling”
4 Your environmental compliance is clearly our business.
PM2.5 NAAQS
5 Your environmental compliance is clearly our business.
Fugitive PM2.5 Modeling
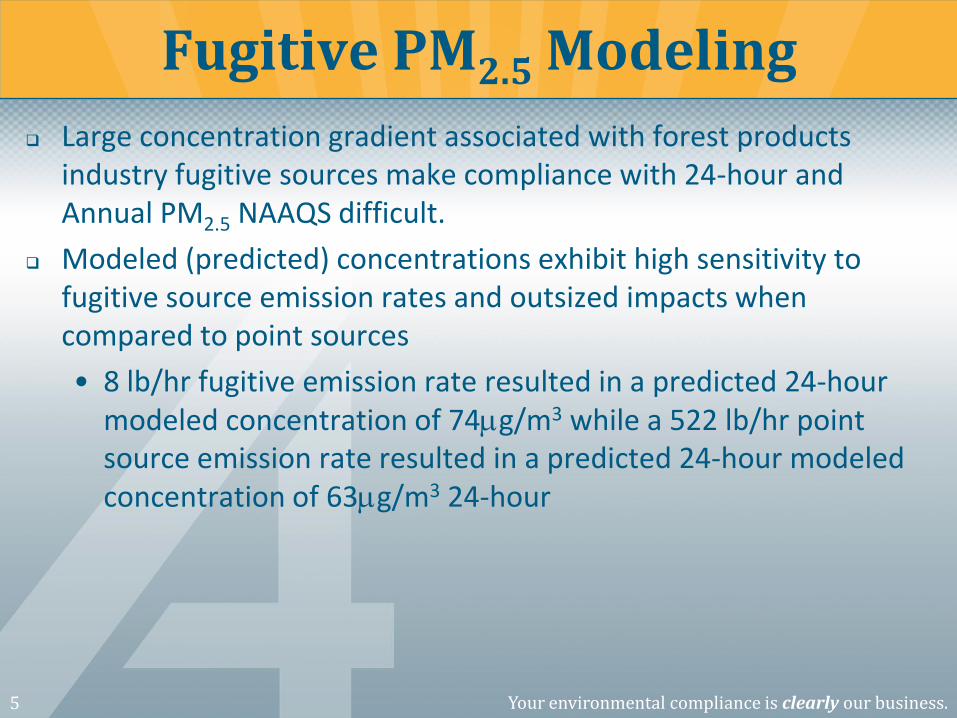
Large concentration gradient associated with forest products industry fugitive sources make compliance with 24-hour and Annual PM2.5 NAAQS difficult.
Modeled (predicted) concentrations exhibit high sensitivity to fugitive source emission rates and outsized impacts when compared to point sources
• 8 lb/hr fugitive emission rate resulted in a predicted 24-hour modeled concentration of 74mg/m3 while a 522 lb/hr point source emission rate resulted in a predicted 24-hour modeled concentration of 63mg/m3 24-hour
6 Your environmental compliance is clearly our business.
Fugitive PM2.5 Modeling
0.00
1.00
2.00
3.00
4.00
5.00
6.00
7.00
8.00
0.00
10.00
20.00
30.00
40.00
50.00
60.00
70.00
80.00
Scenario 1 Scenario 2 Scenario 3 Scenario 4
Mo
dele
d E
mis
sio
n R
ate
(lb
/hr)
Mo
dele
d C
on
cen
trati
on
(µ
g/m
3 )
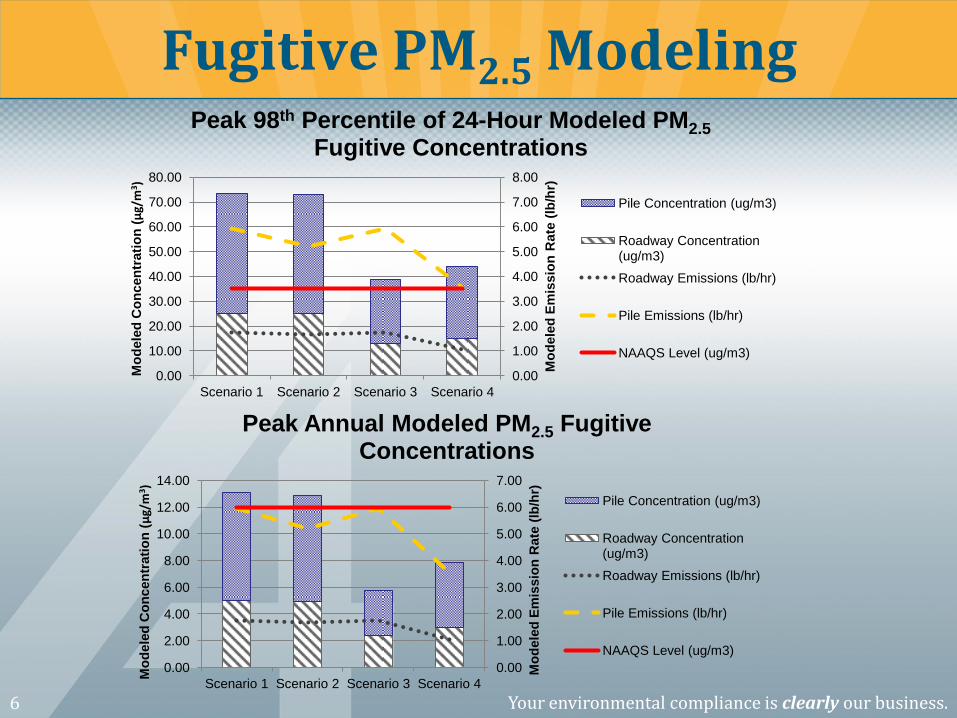
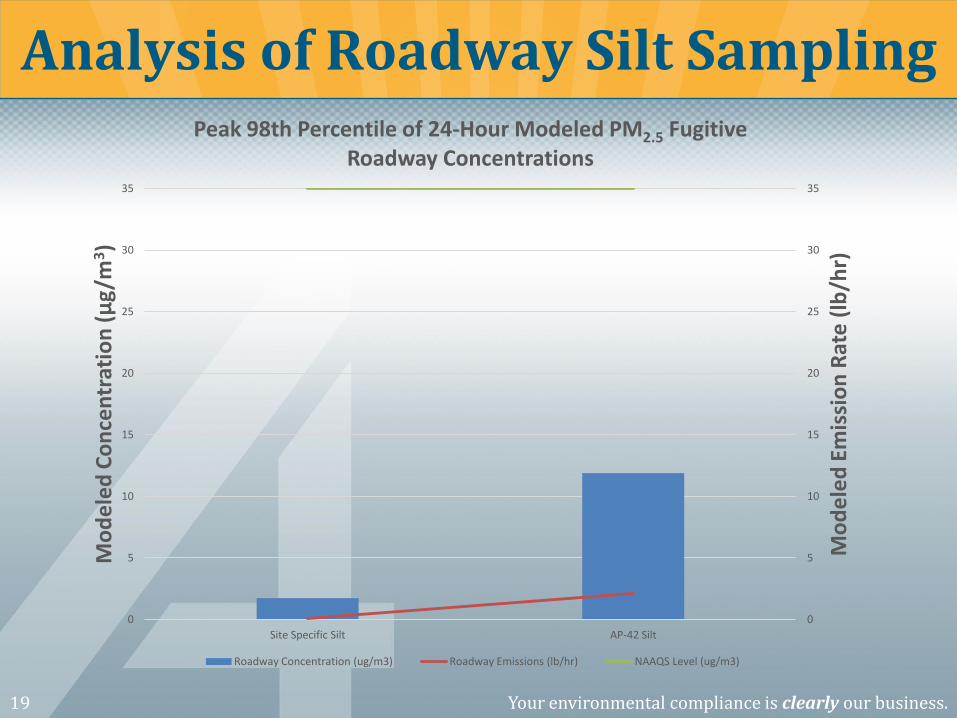
Peak 98th Percentile of 24-Hour Modeled PM2.5 Fugitive Concentrations
Pile Concentration (ug/m3)
Roadway Concentration (ug/m3)
Roadway Emissions (lb/hr)
Pile Emissions (lb/hr)
NAAQS Level (ug/m3)
0.00
1.00
2.00
3.00
4.00
5.00
6.00
7.00
0.00
2.00
4.00
6.00
8.00
10.00
12.00
14.00
Scenario 1 Scenario 2 Scenario 3 Scenario 4
Mo
dele
d E
mis
sio
n R
ate
(lb
/hr)
Mo
dele
d C
on
cen
trati
on
(µ
g/m
3 )
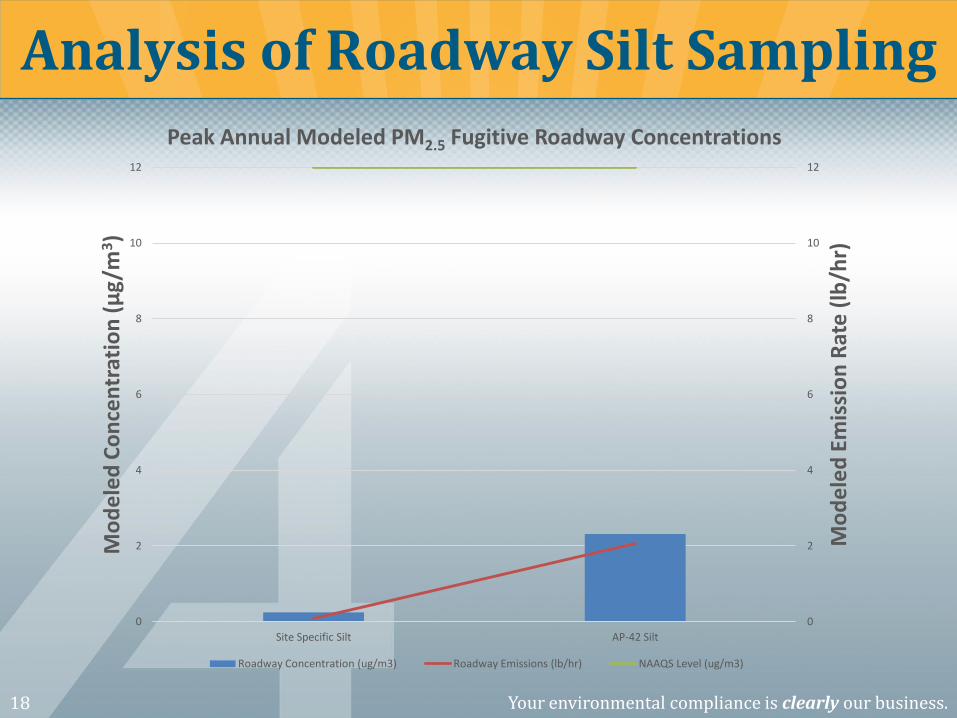
Peak Annual Modeled PM2.5 Fugitive Concentrations
Pile Concentration (ug/m3)
Roadway Concentration (ug/m3)
Roadway Emissions (lb/hr)
Pile Emissions (lb/hr)
NAAQS Level (ug/m3)
7 Your environmental compliance is clearly our business.
Ambient Air Boundary
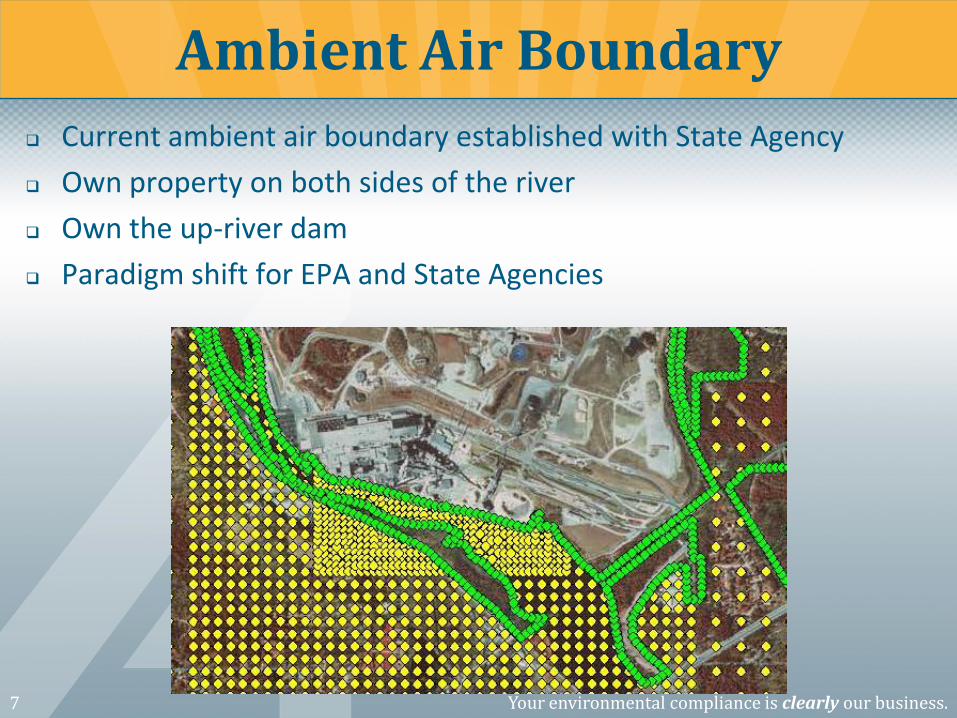
Current ambient air boundary established with State Agency
Own property on both sides of the river
Own the up-river dam
Paradigm shift for EPA and State Agencies
8 Your environmental compliance is clearly our business.
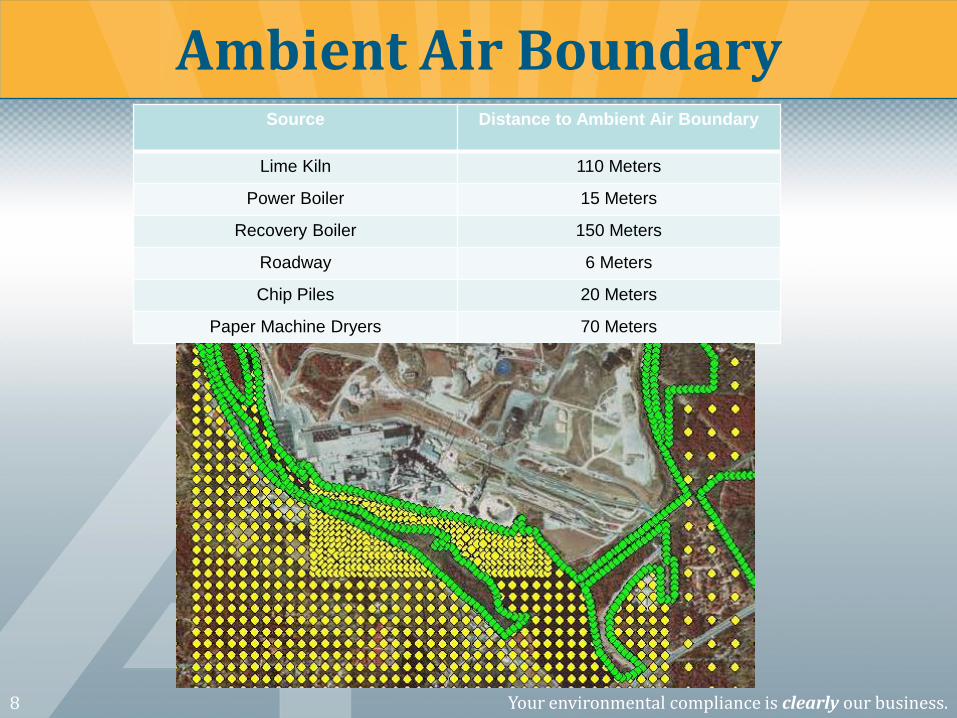
Ambient Air Boundary Source Distance to Ambient Air Boundary
Lime Kiln 110 Meters
Power Boiler 15 Meters
Recovery Boiler 150 Meters
Roadway 6 Meters
Chip Piles 20 Meters
Paper Machine Dryers 70 Meters
9 Your environmental compliance is clearly our business.
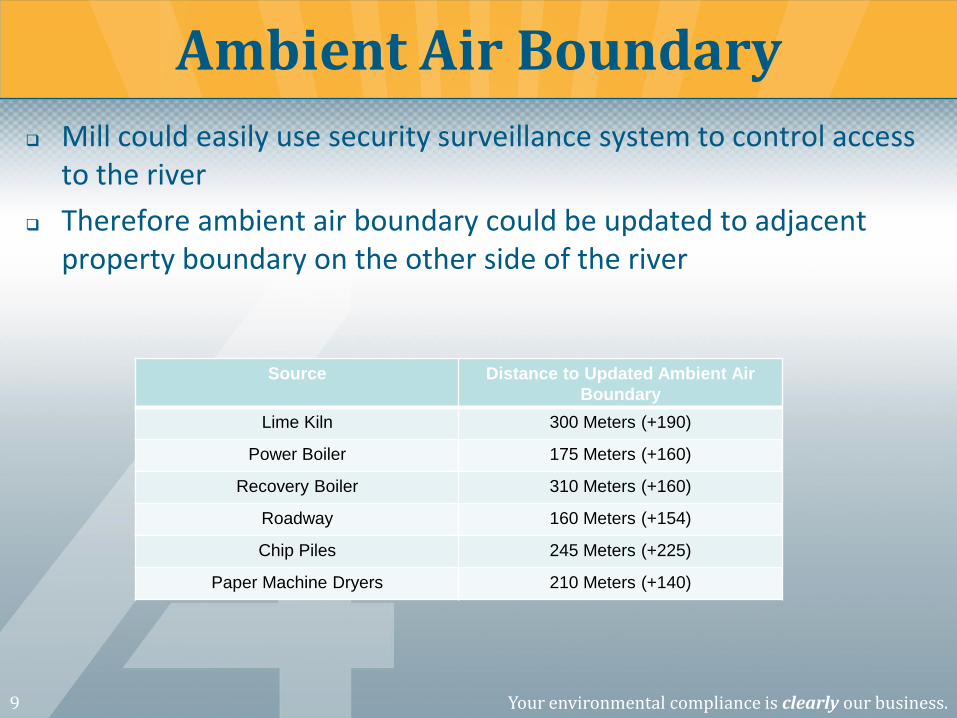
Mill could easily use security surveillance system to control access to the river
Therefore ambient air boundary could be updated to adjacent property boundary on the other side of the river
Ambient Air Boundary
Source Distance to Updated Ambient Air
Boundary
Lime Kiln 300 Meters (+190)
Power Boiler 175 Meters (+160)
Recovery Boiler 310 Meters (+160)
Roadway 160 Meters (+154)
Chip Piles 245 Meters (+225)
Paper Machine Dryers 210 Meters (+140)
10 Your environmental compliance is clearly our business.
Understand your ambient air boundary
Work with State Agency to develop appropriate ambient air boundary
Understand where your fugitive (i.e., roadway/pile) and low release point (i.e., process silos/starch silos) sources are relative to your ambient air boundary
Ambient Air Boundary
11 Your environmental compliance is clearly our business.
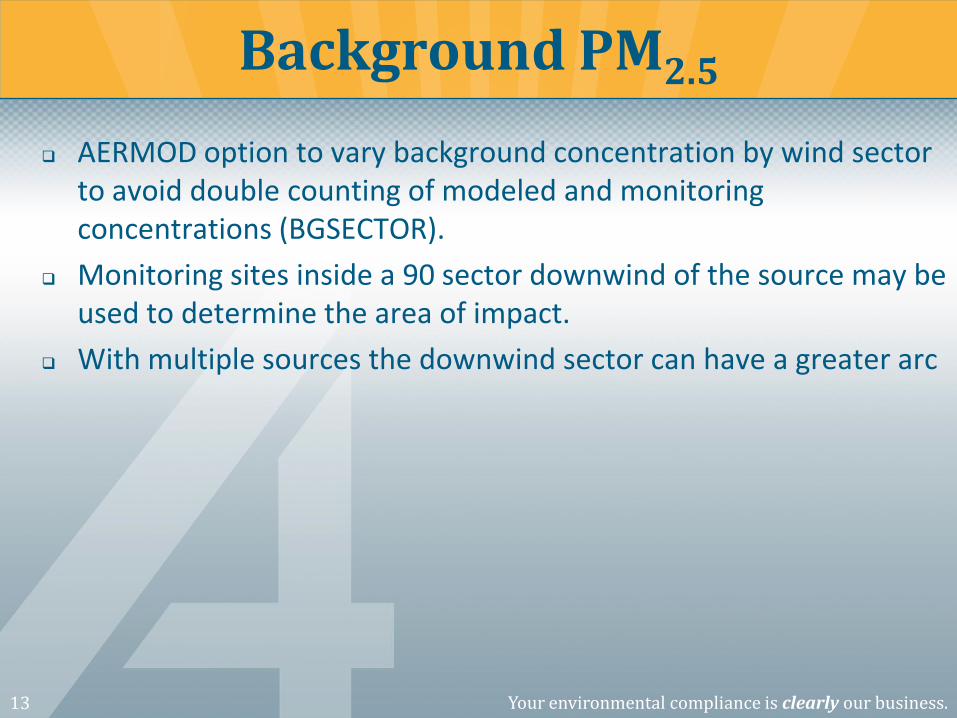
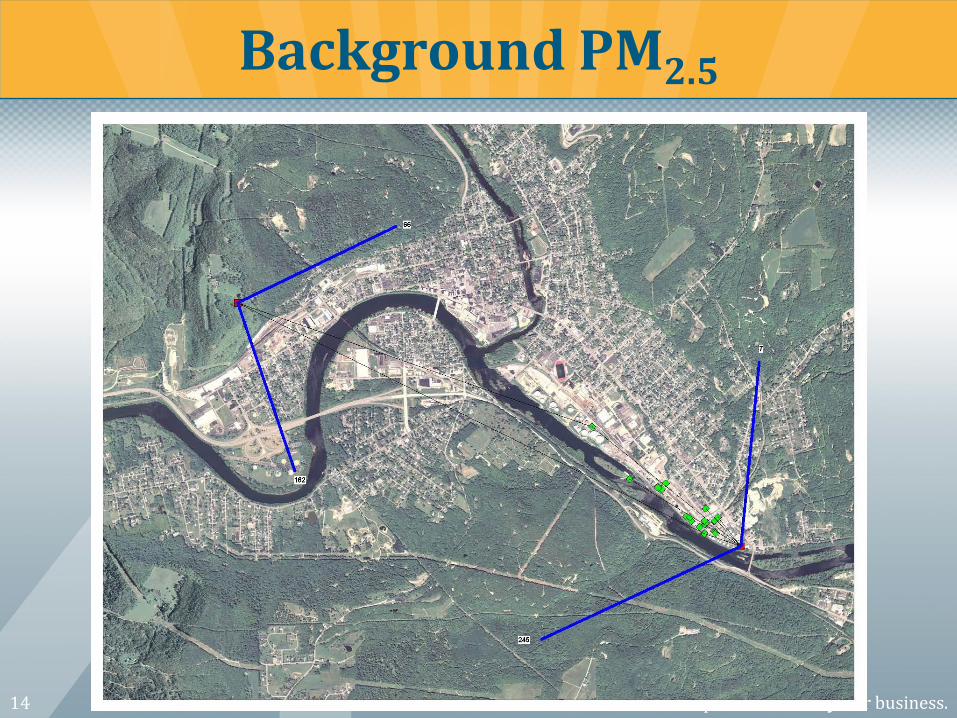
Background PM2.5 ambient monitoring data required for NAAQS analyses along with other local sources.
Two methods for combining PM2.5 monitoring data and modeling data summarized in U.S. EPA’s “Guidance for PM2.5 Permit Modeling” finalized in May 2014.
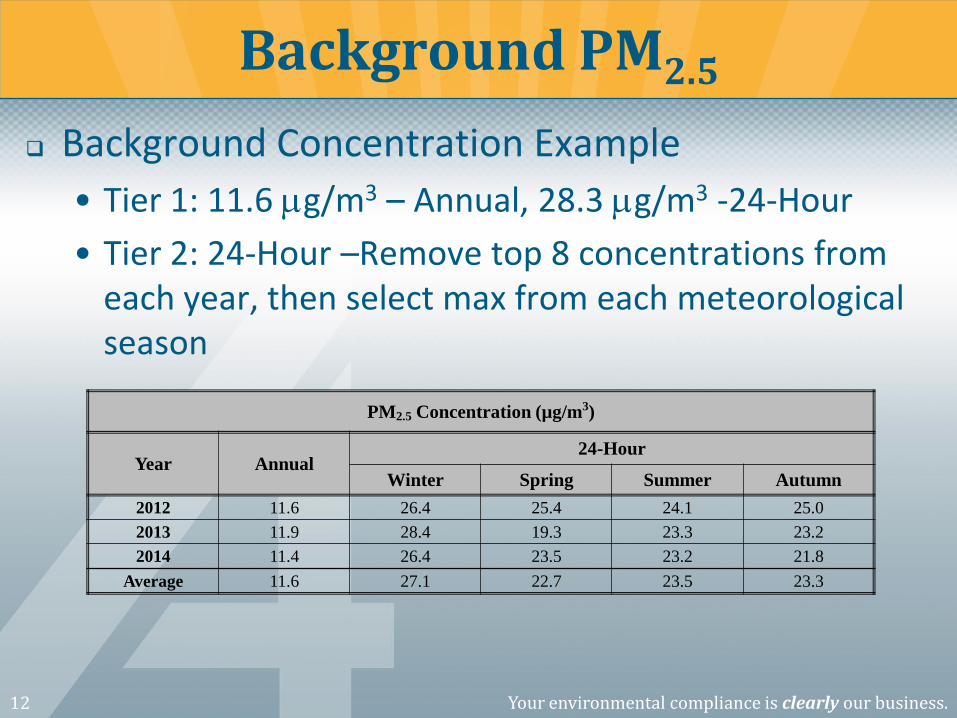
• Tier 1 – Combine design value (i.e., 3-year average annual or 3-year average of 98th percentile of 24-hour)
• Tier 2 – Incorporates seasonal variation for 24-hour NAAQS.
Background PM2.5
12 Your environmental compliance is clearly our business.
20 Your environmental compliance is clearly our business.
In the 12345 version release of AERMOD LOWWIND1 and ADJ_U* beta options were incorporated that can be useful in low release point and fugitive source modeling
• Friction velocity (U*) used to calculate mixing height, initial horizontal, and vertical dispersion
• ADJ_U* option for low wind speed stable conditions based on Quian and Venkatram
• LOWWIND1 option increase the minimum value of sigma-v and turns off the meander component
AERMOD Beta Options
21 Your environmental compliance is clearly our business.
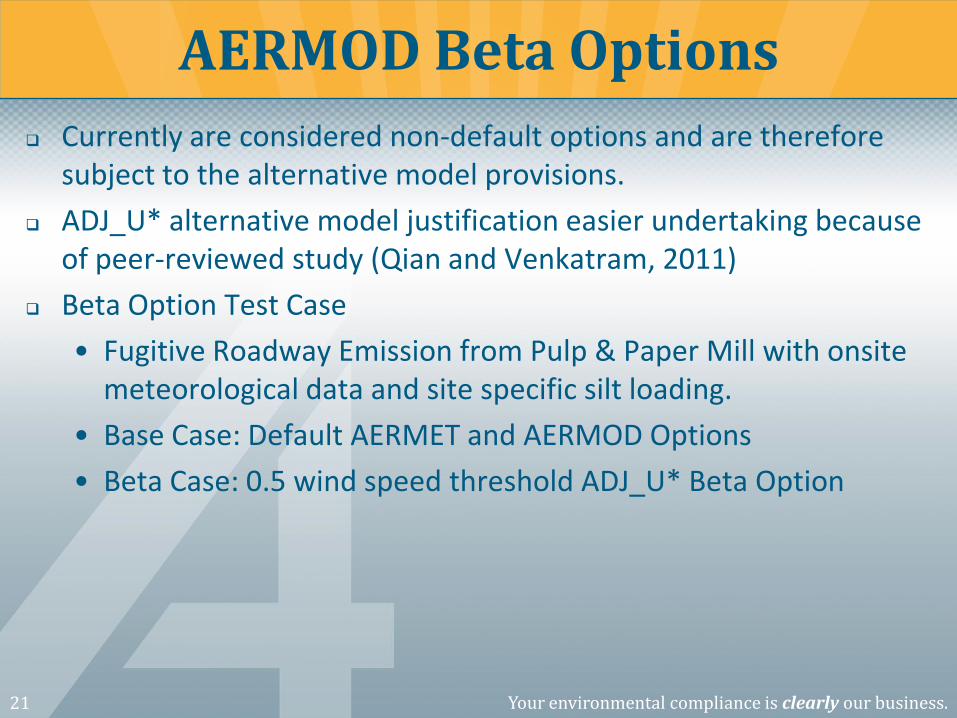
Currently are considered non-default options and are therefore subject to the alternative model provisions.
ADJ_U* alternative model justification easier undertaking because of peer-reviewed study (Qian and Venkatram, 2011)
Beta Option Test Case
• Fugitive Roadway Emission from Pulp & Paper Mill with onsite meteorological data and site specific silt loading.
22 Your environmental compliance is clearly our business.
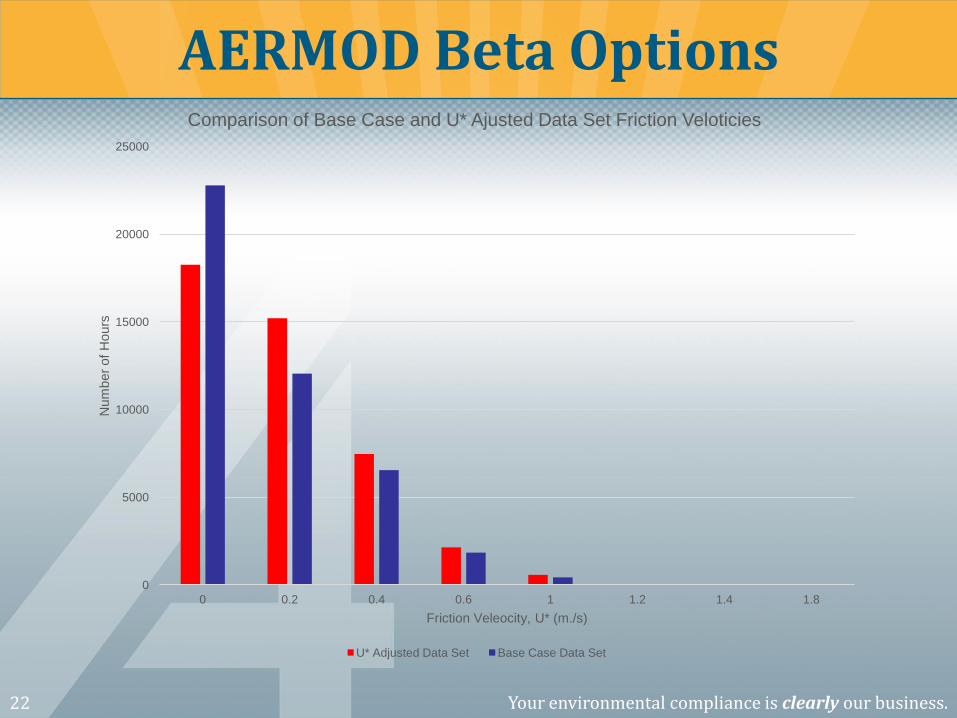
AERMOD Beta Options
0
5000
10000
15000
20000
25000
0 0.2 0.4 0.6 1 1.2 1.4 1.8
Num
ber
of
Hours
Friction Veleocity, U* (m./s)
Comparison of Base Case and U* Ajusted Data Set Friction Veloticies
U* Adjusted Data Set Base Case Data Set
23 Your environmental compliance is clearly our business.
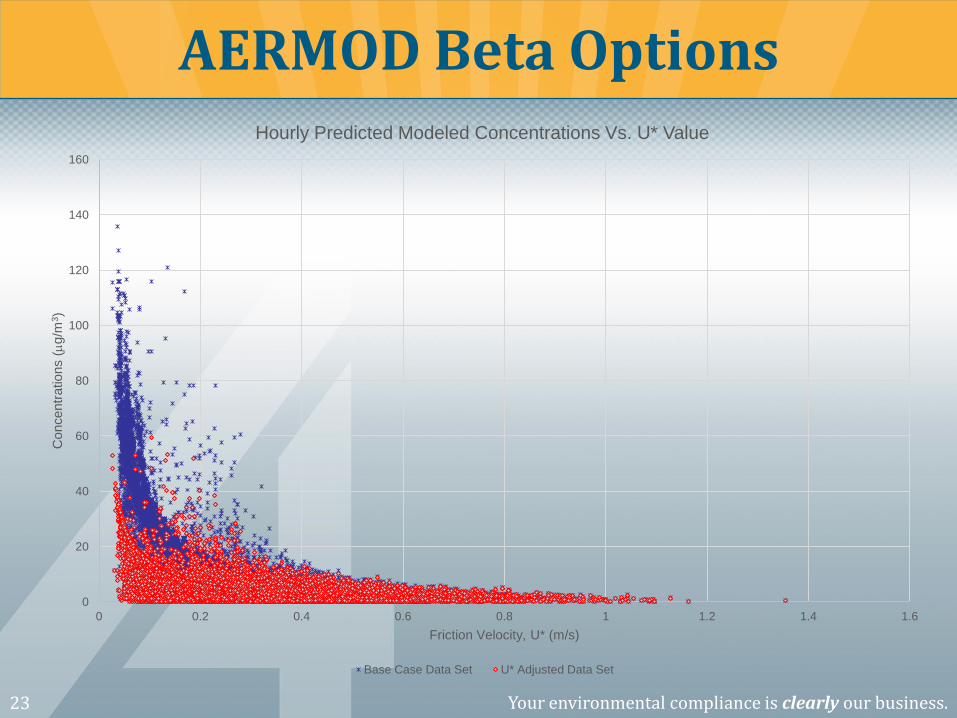
AERMOD Beta Options
0
20
40
60
80
100
120
140
160
0 0.2 0.4 0.6 0.8 1 1.2 1.4 1.6
Concentr
ations (mg/m
3)
Friction Velocity, U* (m/s)
Hourly Predicted Modeled Concentrations Vs. U* Value
Base Case Data Set U* Adjusted Data Set
24 Your environmental compliance is clearly our business.
Use of offsite meteorological data (usually National Weather Service Data) for PSD air quality modeling analyses requires 5-years of onsite data which usually includes the following measurements used by AERMET:
• Horizontal Wind Speed and Direction
• One Temperature Level
• Pressure
• Cloud Cover
Onsite Met vs. Offsite Met
25 Your environmental compliance is clearly our business.
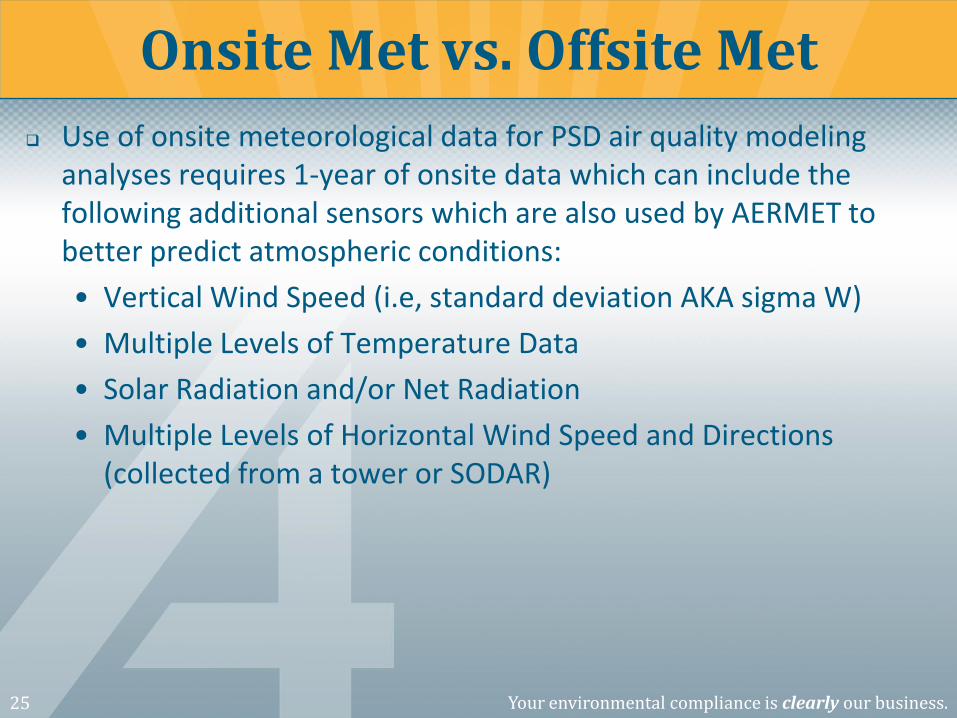
Use of onsite meteorological data for PSD air quality modeling analyses requires 1-year of onsite data which can include the following additional sensors which are also used by AERMET to better predict atmospheric conditions:
• Vertical Wind Speed (i.e, standard deviation AKA sigma W)
• Multiple Levels of Temperature Data
• Solar Radiation and/or Net Radiation
• Multiple Levels of Horizontal Wind Speed and Directions (collected from a tower or SODAR)
Onsite Met vs. Offsite Met
26 Your environmental compliance is clearly our business.
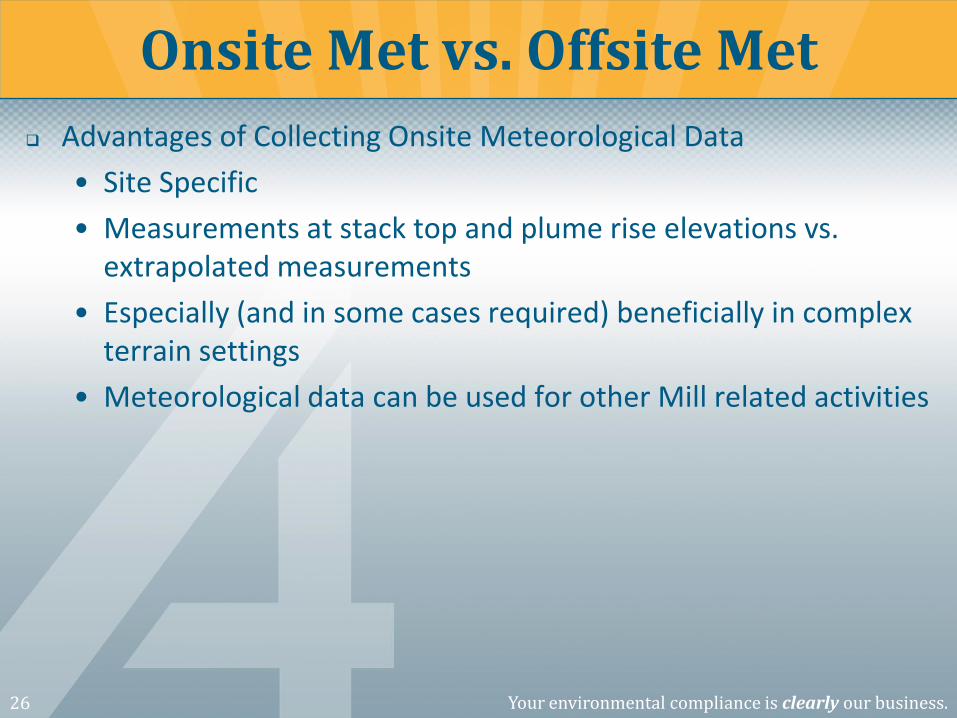
Advantages of Collecting Onsite Meteorological Data
• Site Specific
• Measurements at stack top and plume rise elevations vs. extrapolated measurements
• Especially (and in some cases required) beneficially in complex terrain settings
• Meteorological data can be used for other Mill related activities
Onsite Met vs. Offsite Met
27 Your environmental compliance is clearly our business.
Elephant in the Room
• Addressing cumulative PM2.5 impacts of PM2.5 precursors SO2 and NO2.
Additional PM2.5 Modeling Considerations
www.all4inc.com Philadelphia, PA | 610.933.5246
Atlanta, GA | 678.460.0324 Houston, TX | 281.937.7553
Washington, DC | 703.793.9103
Complying with the NAAQS – PM2.5 Air Quality Modeling