1 October 13, 2016 12 Dear Friends and Investors, The rally in stocks since February gained momentum in Q3 as the Federal Reserve again passed on the opportunity to raise rates and investors celebrated by markedly increasing their appetite for risk. Across asset classes, sectors, market caps, and style factors, investors eschewed traditionally defensive investments in favor of more volatile, more cyclical, higher beta, and lower quality ones. As a result, small caps led large cap by a wide margin (+9% versus +4%) and growth beat value across all market caps. While the “risk-on” environment made it a challenging quarter for River Road, several strategies met or exceeded our expectations. Additionally, a majority of River Road strategies continue to outperform their benchmarks year to date. The outstanding strategy for Q3 (and year to date) was Focused Absolute Value ® (FAV), which beat the benchmark by +469 bps (+458 bps net). Both strong stock selection and sector allocation drove the positive performance with 66% of holdings outpacing the benchmark return. We have frequently touted FAV’s unconstrained approach as a showcase for River Road’s proprietary Absolute Value ® approach. FAV is a concentrated (20 - 30 stocks) portfolio comprised of what our analyst team believes are the “best and most timely ideas” selected from the stocks held across all River Road portfolios. 3 Selection is based upon the firm’s formal and highly disciplined conviction and valuation assessment criteria. Unlike many concentrated strategies, FAV seeks to be fully invested (cash ≤ 2%) at all times. 3 Funded in 2009, the FAV Strategy has a nearly eight-year GIPS-compliant track record, featuring both highly attractive return AND downside volatility characteristics. We believe FAV is IDEAL for inclusion in a core-satellite approach or an opportunistic/all cap allocation. We are further pleased to announce that the FAV Strategy exceeded $100 MM in AUM during the quarter. Achieving this important milestone comes less than seven months after the firm accepted its first separate account mandate in the Strategy. Capacity in the FAV Strategy is very limited and preference is given to existing firm relationships. For information on how to invest, please contact Michele Robbins at (502) 371-4132. River Road’s Dividend All-Cap Value Strategies (including DAV and DAV II) modestly underperformed the benchmark in Q3. Considering the significant headwinds for our Absolute Value ® style and dividend-focused strategies, in general, we were pleased with relative performance. Indeed, the firm’s value discipline served the Strategies well, as it resulted in underweighting the high-yielding, but richly-valued defensive sectors that suffered most during the quarter. For the year- to-date period, the DAV and DAV II Composites remain ahead of the benchmark by +331 bps (+279 bps net) and +321 bps (+286 bps net), respectively. River Road’s Small Cap Value (SCV) and Small-Mid Cap Value (SMID) Strategies fell short of their respective benchmarks during the quarter. While disappointed with relative performance, we would expect the strategies to underperform in such a strong return environment dominated by high beta, low quality factors. Indeed, the Small Cap Value team stated in their commentary last quarter, “Our current positioning should support the Portfolio’s relative 1 Please see the attached disclosures. Past performance is no guarantee of future results. 2 Benchmarks: SCV – Russell 2000 Value; SMID – Russell 2500 Value; DAV – Russell 3000 Value; DAV II – Russell 3000 Value; FAV – Russell 3000 Value; Long-Short Equity – 50% Russell 3000 index/50% BofA Merrill Lynch U.S. T-Bill 0-3 month index. 3 Holdings, market cap, and cash limits are working policies and, as such, are subject to change without notification. Q3 YTD Q3 YTD Q3 YTD Q3 YTD Q3 YTD Q3 YTD Gross 5.06% 14.08% 4.46% 15.42% 3.53% 13.71% 3.42% 13.61% 8.56% 16.42% 2.75% 1.23% Net 4.85% 13.38% 4.30% 14.88% 3.37% 13.19% 3.32% 13.26% 8.45% 15.89% 2.44% 0.32% Benchmark 2 8.87% 15.49% 6.18% 14.51% 3.87% 10.40% 3.87% 10.40% 3.87% 10.40% 2.25% 4.32% + / - -3.81% -1.41% -1.72% +0.91% -0.34% +3.31% -0.45% +3.21% +4.69% +6.02% +0.50% -3.09% Long-Short Equity Composite Performance Summary 1 Small Cap Value Small-Mid Cap Value Dividend All- Cap Value Dividend All- Cap Value II Focused Absolute Value®
Transcript
1
October 13, 2016
12
Dear Friends and Investors,
The rally in stocks since February gained momentum in Q3 as the Federal Reserve again passed on the opportunity to raise rates and investors celebrated by markedly increasing their appetite for risk. Across asset classes, sectors, market caps, and style factors, investors eschewed traditionally defensive investments in favor of more volatile, more cyclical, higher beta, and lower quality ones. As a result, small caps led large cap by a wide margin (+9% versus +4%) and growth beat value across all market caps.
While the “risk-on” environment made it a challenging quarter for River Road, several strategies met or exceeded our expectations. Additionally, a majority of River Road strategies continue to outperform their benchmarks year to date.
The outstanding strategy for Q3 (and year to date) was Focused Absolute Value® (FAV), which beat the benchmark by +469 bps (+458 bps net). Both strong stock selection and sector allocation drove the positive performance with 66% of holdings outpacing the benchmark return.
We have frequently touted FAV’s unconstrained approach as a showcase for River Road’s proprietary Absolute Value® approach. FAV is a concentrated (20 - 30 stocks) portfolio comprised of what our analyst team believes are the “best and most timely ideas” selected from the stocks held across all River Road portfolios.3 Selection is based upon the firm’s formal and highly disciplined conviction and valuation assessment criteria. Unlike many concentrated strategies, FAV seeks to be fully invested (cash ≤ 2%) at all times.3 Funded in 2009, the FAV Strategy has a nearly eight-year GIPS-compliant track record, featuring both highly attractive return AND downside volatility characteristics.
We believe FAV is IDEAL for inclusion in a core-satellite approach or an opportunistic/all cap allocation. We are further pleased to announce that the FAV Strategy exceeded $100 MM in AUM during the quarter. Achieving this important milestone comes less than seven months after the firm accepted its first separate account mandate in the Strategy. Capacity in the FAV Strategy is very limited and preference is given to existing firm relationships. For information on how to invest, please contact Michele Robbins at (502) 371-4132.
River Road’s Dividend All-Cap Value Strategies (including DAV and DAV II) modestly underperformed the benchmark in Q3. Considering the significant headwinds for our Absolute Value® style and dividend-focused strategies, in general, we were pleased with relative performance. Indeed, the firm’s value discipline served the Strategies well, as it resulted in underweighting the high-yielding, but richly-valued defensive sectors that suffered most during the quarter. For the year-to-date period, the DAV and DAV II Composites remain ahead of the benchmark by +331 bps (+279 bps net) and +321 bps (+286 bps net), respectively.
River Road’s Small Cap Value (SCV) and Small-Mid Cap Value (SMID) Strategies fell short of their respective benchmarks during the quarter. While disappointed with relative performance, we would expect the strategies to underperform in such a strong return environment dominated by high beta, low quality factors. Indeed, the Small Cap Value team stated in their commentary last quarter, “Our current positioning should support the Portfolio’s relative
1 Please see the attached disclosures. Past performance is no guarantee of future results. 2 Benchmarks: SCV – Russell 2000 Value; SMID – Russell 2500 Value; DAV – Russell 3000 Value; DAV II – Russell 3000 Value; FAV – Russell 3000 Value; Long-Short Equity – 50% Russell 3000
index/50% BofA Merrill Lynch U.S. T-Bill 0-3 month index. 3 Holdings, market cap, and cash limits are working policies and, as such, are subject to change without notification.
performance if markets move modestly higher OR if they reverse course and head lower. The biggest challenge to relative performance would be a sharp, unexpected move higher...” For the year-to-date period, SCV trails the benchmark by -141 bps (-211 bps net) while SMID leads by +91 bps (+37 bps net).
River Road’s Long-Short Equity Strategy performed reasonably well during the quarter, beating its baseline return objective (50% R3000 Index / 50% BofA Merrill Lynch U.S. T-Bill 0-3 month index) by +50 bps (+19 bps net). Strong stock selection, especially in the long portfolio, helped to partly overcome the challenging macro environment.
With regard to firm news, we are thrilled to announce that William W. Yang, CFA, a well-regarded international equity investment manager, has joined the firm. William will serve as Portfolio Manager of the firm’s new International Value Equity Strategy. William brings nearly 15 years of investment experience to the firm. Prior to joining River Road, he served as Senior Portfolio Manager for Boston Private Wealth LLC. William and his family will relocate to Louisville, KY from their home in Plano, TX.
Hiring William and launching the firm’s new International Value Equity Strategy are the first steps toward offering our clients a global suite of Absolute Value® investment solutions. River Road expects to make its International Value Equity Strategy available to clients in the first half of 2017.
We hope you enjoy reading River Road’s portfolio commentary and outlook and welcome your questions and feedback.
R. Andrew Beck James C. Shircliff, CFA Henry W. Sanders, III, CFA President & CEO, Chief Investment Officer & Executive Vice President & Senior Portfolio Manager Senior Portfolio Manager Senior Portfolio Manager
3
Disclosures:
River Road Asset Management, LLC (“RRAM”) is a registered investment adviser formed in April 2005 and is majority owned by Affiliated Managers Group, Inc. This presentation may be presented by an employee of Affiliated Managers Group, Inc., AMG Funds, or another AMG entity, which are affiliates of RRAM. RRAM claims compliance with the Global Investment Performance Standards (GIPS®). The firm maintains a complete list and description of composites and a presentation that complies with the requirements of the GIPS® standards, which is available upon request by contacting Thomas D. Mueller, CPA, CFA at (502) 371-4100 or [email protected].
For all composites, the U.S. dollar is the currency used to express performance and performance includes the reinvestment of income.
Small Cap Value Composite Disclosures:
Inception date: January 1, 1998. The composite contains fully discretionary accounts that seek capital appreciation by investing primarily in small cap value domestic equity securities that trade at a discount to our assessed valuation as determined using RRAM’s proprietary Absolute Value® approach. For this composite, RRAM defines a small cap company as one whose market capitalization is less than $3 B. The Manager selects securities from a universe of companies with a market capitalization at the time of initial purchase typically between $50 MM and $3 B, employing a value-driven, bottom-up fundamental approach. The official benchmarks for the Small Cap Value Equity Composite are the Russell 2000 Value and Russell 2000.
As of September 30, 2016, net of fees returns for the Small Cap Value Composite are as follows for the month, QTD, YTD, 1 year, 3 year, 5 year, 10 year, and Inception to Date periods: -0.29%, 4.85%, 13.38%, 16.62%, 6.10%, 13.96%, 5.83%, and 10.14%. As of September 30, 2016, returns for the Russell 2000 Value are as follows for the month, QTD, YTD, 1 year, 3 year, 5 year, 10 year, and Inception to Date periods: 0.79%, 8.87%, 15.49%, 18.81%, 6.77%, 15.45%, 5.78%, and 8.02%.
Performance presented prior to April 1, 2005 occurred while the original members of the Portfolio Management Team were affiliated with a prior firm and those Portfolio Management Team members were the only individuals primarily responsible for selecting the securities to buy and sell. A review of this track record for compliance with portability requirements of the GIPS® standards was conducted by Ashland Partners & Company.
Small-Mid Cap Value Composite Disclosures:
Inception Date: March 1, 2007. The composite contains fully discretionary accounts that seek capital appreciation by investing primarily in small-mid cap value domestic equity securities that trade at a discount to our assessed valuation as determined using RRAM’s proprietary Absolute Value® approach. For this composite, RRAM defines a small to mid-cap company as one whose market capitalization is less than $10 B. RRAM selects securities form a universe of companies with a market capitalization at the time of initial purchase typically between $250 MM to $10 B, employing a value driven, bottom-up fundamental approach. The official benchmark of the Small-Mid Cap Value Composite Portfolio is the Russell 2500 Value.
As of September 30, 2016, net of fees returns for the Small-Mid Cap Value Composite are as follows for the month, QTD, YTD, 1 year, 3 year, 5 year, and Inception to Date periods: -0.77%, 4.30%, 14.88%, 18.05%, 5.81%, 14.22%, and 5.89%. As of September 30, 2016, returns for the Russell 2500 Value are as follows for the month, QTD, YTD, 1 year, 3 year, 5 year, and Inception to Date periods: 0.66%, 6.18%, 14.51%, 17.68%, 8.05%, 16.29%, and 6.04%.
Dividend All-Cap Value Composite (DAV) and Dividend All-Cap Value II Composite (DAV II) Disclosures:
Inception Date DAV: October 1, 2003. Inception Date DAV II: January 1, 2011. The composites contain fully discretionary accounts that seek to provide long term capital appreciation and high current income by investing primarily in a diversified, all-cap basket of income producing equity securities that trade at a discount to our assessed valuation as determined using RRAM’s proprietary Absolute Value® approach. The composites are primarily invested in dividend-paying common stocks. The composites may also be invested in a broad range of foreign stocks, publicly traded partnerships, convertible preferred stocks, Real Estate Investment Trusts (“REITS”), investment companies, and royalty income trusts. For the DAV II Composite only, the securities must have a market capitalization of typically at least $1 B at the time of initial purchase. RRAM employs a value-driven, bottom-up approach. The official benchmark for the composites is the Russell 3000 Value.
As of September 30, 2016, net of fees returns for the Dividend All-Cap Value Composite are as follows for the month, QTD, YTD, 1 year, 3 year, 5 year, 10 year, and Inception to Date periods: -0.51%, 3.37%, 13.19%, 18.27%, 8.97%, 14.11%, 7.67%, and 10.73%. As of September 30, 2016, returns for the Russell 3000 Value are as follows for the month, QTD, YTD, 1 year, 3 year, 5 year, 10 year, and Inception to Date periods: -0.13%, 3.87%, 10.40%, 16.38%, 9.46%, 16.09%, 5.84%, and 8.40%.
Performance presented prior to April 1, 2005 occurred while the original members of the Portfolio Management Team were affiliated with a prior firm and those Portfolio Management Team members were the only individuals primarily responsible for selecting the securities to buy and sell. A review of this track record for compliance with portability requirements of the GIPS® standards was conducted by Ashland Partners & Company.
As of September 30, 2016, net of fees returns for the Dividend All-Cap Value II Composite are as follows for the month, QTD, YTD, 1 year, 3 year, 5 year, and Inception to Date periods: -0.42%, 3.32%, 13.26%, 18.50%, 9.42%, 14.11%, and 11.21%. As of September 30, 2016, returns for the Russell 3000 Value are as follows for the month, QTD, YTD, 1 year, 3 year, 5 year, and Inception to Date periods: -0.13%, 3.87%, 10.40%, 16.38%, 9.46%, 16.09%, and 11.38%.
Long-Short Equity Composite Disclosures:
Inception date: July 1, 2010. The composite contains a fully discretionary account that seeks equity-like returns with reduced volatility over a full market cycle by investing primarily in long equity securities that trade at a discount to our assessed valuation and selling short equity securities that trade a premium to our assessed valuation as determined using RRAM’s proprietary Absolute Value® approach. The composite will invest in short securities. The long and short portfolios will typically represent 50-100% and 10-90% of the total composite, respectively. Additionally, the composite may use options, futures, and other derivatives but these will not represent a significant portion of the composite. The official benchmark for the Long-Short Equity Composite is the Russell 3000.
As of September 30, 2016, net of fees returns for the Long-Short Equity Composite are as follows for the month, QTD, YTD, 1 year, 3 year, 5 year, and Inception to Date periods: -1.54%, 2.44%, 0.32%, 2.08%, 1.43%, 6.18%, and 7.46%. As of September 30, 2016, returns for the Russell 3000 are as follows for the month, QTD, YTD, 1 year, 3 year, 5 year, and Inception to Date periods: 0.16%, 4.40%, 8.18%, 14.96%, 10.44%, 16.36%, and 14.97%.
Focused Absolute Value® Composite Disclosures:
Inception Date: January 1, 2009. The team of analysts involved with recommending investments for Focused Absolute Value® has changed and may continue to change over time. The portfolio managers may not have historically approved all trades prior to execution. Fully invested is as defined by RRAM and this standard may change over time. Prior to September 30, 2014, the composite was known as the Research Fund Composite.
The composite contains fully discretionary accounts that seek capital appreciation by investing primarily in equity securities that trade at a discount to our assessed valuation as determined using RRAM’s proprietary Absolute Value® approach. For this composite, RRAM selects securities from a universe of companies that are held by other RRAM strategies, which typically includes all market capitalizations. RRAM employs a value-driven, bottom-up fundamental approach. One client account is a current employee of RRAM. The official benchmark for the composite is the Russell 3000. Fully invested is as defined by RRAM.
As of September 30, 2016, net of fees returns for the Focused Absolute Value® Composite are as follows for the month, QTD, YTD, 1 year, 3 year, 5 year, and Inception to Date periods: -1.77%, 8.45%, 15.89%, 18.31%, 10.76%, 18.23%, and 18.41%. As of September 30, 2016, returns for the Russell 3000 Value are as follows for the month, QTD, YTD, 1 year, 3 year, 5 year, and Inception to Date periods: -0.13%, 3.87%, 10.40%, 16.38%, 9.46%, 16.09%, and 13.05%.
The following marks are all owned, and federally registered, by RRAM: RIVER ROAD ASSET MANAGEMENT & DESIGN (U.S. Registration No. 3,456,174); IDEALLY SITUATED 738 MILES FROM WALL STREET® (U.S. Registration No. 3,643,106); ABSOLUTE VALUE® (U. S. Registration No. 4,753,652); DISCOVERING VALUE OFF THE BEATEN PATH® (U.S. Registration No. 3,451,824); INDEPENDENT VALUE STRATEGY® (U.S. Registration No. 4,599,008); and FOCUSED ABSOLUTE VALUE® (U.S. Registration No. 4,943,492). Any use of these marks without the express written consent of River Road Asset Management, LLC is expressly prohibited.
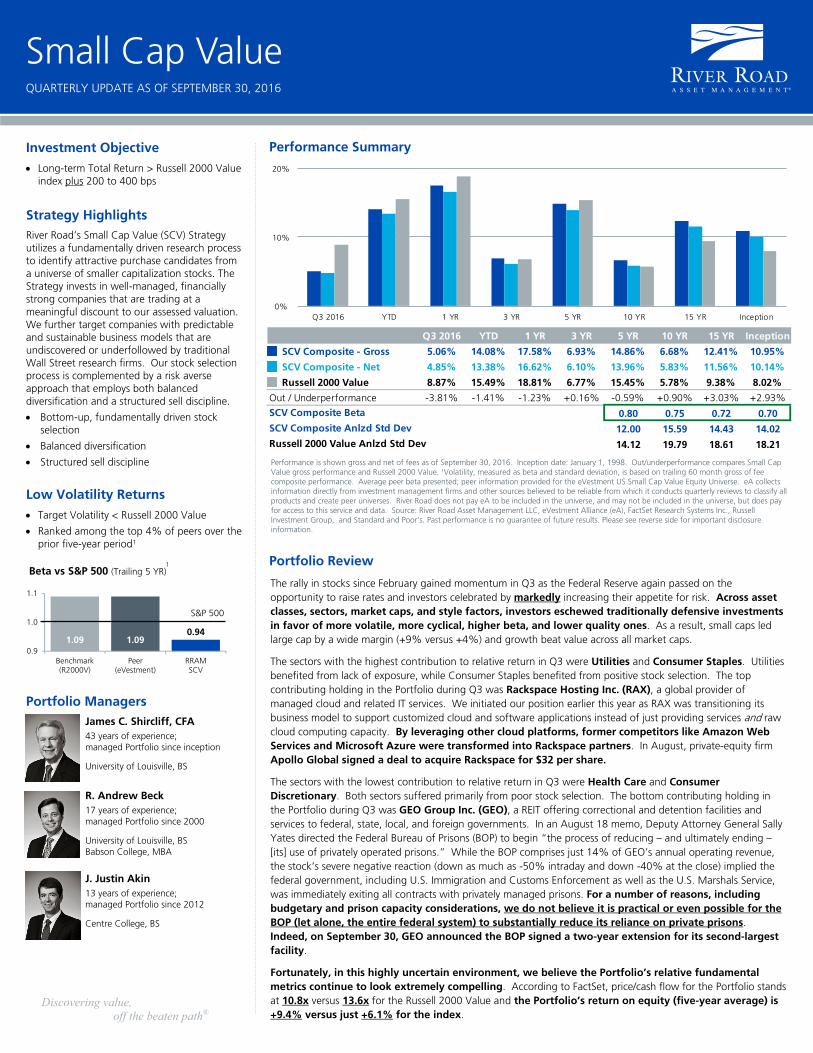
Investment Objective Long-term Total Return > Russell 2000 Value
index plus 200 to 400 bps
Strategy Highlights River Road’s Small Cap Value (SCV) Strategy utilizes a fundamentally driven research process to identify attractive purchase candidates from a universe of smaller capitalization stocks. The Strategy invests in well-managed, financially strong companies that are trading at a meaningful discount to our assessed valuation. We further target companies with predictable and sustainable business models that are undiscovered or underfollowed by traditional Wall Street research firms. Our stock selection process is complemented by a risk averse approach that employs both balanced diversification and a structured sell discipline.
Bottom-up, fundamentally driven stock selection
Balanced diversification
Structured sell discipline
Low Volatility Returns Target Volatility < Russell 2000 Value
Ranked among the top 4% of peers over the prior five-year period1
Portfolio Managers James C. Shircliff, CFA 43 years of experience; managed Portfolio since inception
University of Louisville, BS
R. Andrew Beck 17 years of experience; managed Portfolio since 2000
University of Louisville, BS Babson College, MBA
J. Justin Akin 13 years of experience; managed Portfolio since 2012
Centre College, BS
Small Cap Value QUARTERLY UPDATE AS OF SEPTEMBER 30, 2016
Portfolio Review
Performance Summary
Performance is shown gross and net of fees as of September 30, 2016. Inception date: January 1, 1998. Out/underperformance compares Small Cap Value gross performance and Russell 2000 Value. 1Volatility, measured as beta and standard deviation, is based on trailing 60 month gross of fee composite performance. Average peer beta presented; peer information provided for the eVestment US Small Cap Value Equity Universe. eA collects information directly from investment management firms and other sources believed to be reliable from which it conducts quarterly reviews to classify all products and create peer universes. River Road does not pay eA to be included in the universe, and may not be included in the universe, but does pay for access to this service and data. Source: River Road Asset Management LLC, eVestment Alliance (eA), FactSet Research Systems Inc., Russell Investment Group, and Standard and Poor's. Past performance is no guarantee of future results. Please see reverse side for important disclosure information.
The rally in stocks since February gained momentum in Q3 as the Federal Reserve again passed on the opportunity to raise rates and investors celebrated by markedly increasing their appetite for risk. Across asset classes, sectors, market caps, and style factors, investors eschewed traditionally defensive investments in favor of more volatile, more cyclical, higher beta, and lower quality ones. As a result, small caps led large cap by a wide margin (+9% versus +4%) and growth beat value across all market caps.
The sectors with the highest contribution to relative return in Q3 were Utilities and Consumer Staples. Utilities benefited from lack of exposure, while Consumer Staples benefited from positive stock selection. The top contributing holding in the Portfolio during Q3 was Rackspace Hosting Inc. (RAX), a global provider of managed cloud and related IT services. We initiated our position earlier this year as RAX was transitioning its business model to support customized cloud and software applications instead of just providing services and raw cloud computing capacity. By leveraging other cloud platforms, former competitors like Amazon Web Services and Microsoft Azure were transformed into Rackspace partners. In August, private-equity firm Apollo Global signed a deal to acquire Rackspace for $32 per share.
The sectors with the lowest contribution to relative return in Q3 were Health Care and Consumer Discretionary. Both sectors suffered primarily from poor stock selection. The bottom contributing holding in the Portfolio during Q3 was GEO Group Inc. (GEO), a REIT offering correctional and detention facilities and services to federal, state, local, and foreign governments. In an August 18 memo, Deputy Attorney General Sally Yates directed the Federal Bureau of Prisons (BOP) to begin “the process of reducing – and ultimately ending – [its] use of privately operated prisons.” While the BOP comprises just 14% of GEO’s annual operating revenue, the stock’s severe negative reaction (down as much as -50% intraday and down -40% at the close) implied the federal government, including U.S. Immigration and Customs Enforcement as well as the U.S. Marshals Service, was immediately exiting all contracts with privately managed prisons. For a number of reasons, including budgetary and prison capacity considerations, we do not believe it is practical or even possible for the BOP (let alone, the entire federal system) to substantially reduce its reliance on private prisons. Indeed, on September 30, GEO announced the BOP signed a two-year extension for its second-largest facility.
Fortunately, in this highly uncertain environment, we believe the Portfolio’s relative fundamental metrics continue to look extremely compelling. According to FactSet, price/cash flow for the Portfolio stands at 10.8x versus 13.6x for the Russell 2000 Value and the Portfolio’s return on equity (five-year average) is +9.4% versus just +6.1% for the index.
SMALL CAP VALUE QUARTERLY UPDATE AS OF SEPTEMBER 30, 2016
RIVER ROAD ASSET MANAGEMENT, LLC Meidinger Tower I 462 South Fourth Street I Suite 2000 I Louisville, KY 40202 USA
(502) 371-4100 I riverroadam.com
Sector Weightings Portfolio Characteristics
Portfolio Contribution Top 10 Holdings
Top ContributorsAverage Weight
Contribution to Return
RAX Rackspace Hosting Inc. 2.44% +1.03%
UNF UniFirst Corp. 4.24% +0.56%
FNFV Fidelity National Financial Inc. - FNFV Group 4.22% +0.35%
VVI Viad Corp. 1.89% +0.33%
SODA SodaStream International Ltd. 1.41% +0.33%
Bottom Contributors
GEO GEO Group Inc. 1.73% -0.60%
MYGN Myriad Genetics Inc. 0.47% -0.42%
PAY VeriFone Systems Inc. 2.13% -0.38%
HAWK Blackhawk Network Holdings Inc. (Cl A) 3.03% -0.31%
AIRM Air Methods Corp. 1.62% -0.19%
RRAM SCV
Russell 2000 Value
Number of Holdings 56 1,336
Price / Earnings1 19.5 18.9
Price / Cash Flow 10.8 13.6
Price / Book 1.59 1.49
ROE (5 YR Avg) 9.4 6.1
EPS Growth (5 YR) 7.8 6.4
Cash Flow Growth (5 YR) 9.4 4.0
LT Growth Forecast 11.4 9.5
Annualized Standard Deviation2 12.00 14.12
Annualized Alpha2 2.34
Beta2 0.80
Turnover3 47.23%
Russell 2000 Value
Small Cap Value
6.9%
11.1%
0.7%
4.9%
5.2%
2.9%
30.1%
10.6%
10.6%
12.6%
0.0%
1.6%
2.2%
3.2%
3.2%
3.8%
18.0%
21.0%
21.6%
25.4%
Utilities
Real Estate
Telecommunication Services
Health Care
Energy
Consumer Staples
Financials
Information Technology
Consumer Discretionary
Industrials
Symbol Company% of
PortfolioUNF UniFirst Corp. 4.50%
FNFV Fidelity National Financial Inc. - FNFV Group 4.24%
WTM White Mountains Insurance Group Ltd. 4.06%
IMKTA Ingles Markets Inc. (Cl A) 2.82%
HAWK Blackhawk Network Holdings Inc. (Cl A) 2.72%
ATSG Air Transport Services Group Inc. 2.55%
ISCA International Speedway Corp. (Cl A) 2.45%
SP SP Plus Corp. 2.26%
BH Biglari Holdings Inc. 2.13%
AWH Allied World Assurance Co. Holdings AG 2.12%
Discovering value, off the beaten path ® | 1
MARKET & PORTFOLIO COMMENTARY
SMALL CAP VALUE
Q3 2016
Performance is shown gross and net of fees as of September 30, 2016. Inception date: January 1, 1998. Out/underperformance compares gross performance and the index. Source: River Road Asset Management LLC, FactSet Research Systems Inc., and Russell Investment Group. Past performance is no guarantee of future results. Beta and standard deviation are shown as supplemental information to the Composite presentation. Please see appendix for additional performance, representative portfolio, and holdings disclosures.
MARKET HIGHLIGHTS Stocks delivered robust gains for Q3 as investors shifted into high (beta) gear. Small cap stocks significantly outperformed large cap for Q3 and now lead year to date. The Russell 2000 index returned +9.05% for Q3 versus +4.03% for the Russell 1000. Growth outperformed value across all market caps, as did high beta and low quality factors. The Russell 2000 Growth index returned +9.22% for Q3 versus +8.87% for the Russell 2000 Value. Within the Russell 2000 Value index, Information Technology (+18.17%) delivered the highest total return, while
Utilities (-5.12%) delivered the lowest. Small cap value managers struggled in Q3, with just 20% outperforming the index.
PORTFOLIO HIGHLIGHTS For Q3, the Composite returned +5.06% (+4.85% net) versus +8.87% for the benchmark Russell 2000 Value index. Stock selection was a significant headwind during the quarter, while sector allocation was positive. The sectors with the highest contribution to relative return in Q3 were Utilities and Consumer Staples. The holdings with the highest contribution to Portfolio return were Rackspace Hosting Inc. (RAX) and UniFirst Corp.
(UNF). The sectors with the lowest contribution to relative return in Q3 were Health Care and Consumer Discretionary. The holdings with the lowest contribution to Portfolio return were GEO Group Inc. (GEO) and Myriad Genetics Inc.
(MYGN).
OUTLOOK While risk remains heightened, our indicators are providing mixed clues about the near-term direction of stocks.
Past performance is no guarantee of future results. Please see appendix for additional performance, representative portfolio, and holdings disclosures. | 2
MARKET & PORTFOLIO COMMENTARY
SMALL CAP VALUE
Q3 2016
MARKET REVIEW
Stocks delivered robust gains for Q3 as investors showed an increased appetite for risk
The rally in stocks since February gained momentum in Q3 as the Federal Reserve again passed on the opportunity to raise rates and investors celebrated by markedly increasing their appetite for risk. Across asset classes, sectors, market caps, and style factors, investors eschewed traditionally defensive investments in favor of more volatile, more cyclical, higher beta, and lower quality ones.
For Q3, small cap stocks led large cap with the Russell 2000 index returning +9.05% versus +4.03% for the Russell 1000 and +3.85% for the S&P 500. The Russell Midcap index returned +4.52%. Small caps also lead for the year-to-date period, with the Russell 2000 index returning +11.46% versus +10.26% for the Russell Midcap, +7.92% for the Russell 1000 index, and +7.84% for the S&P 500.
Small caps officially exited their bear market on July 12. As of September 30, the Russell 2000 index had rallied an impressive +33% from its February low, posting positive returns in six of the prior seven months.
Reported small cap earnings turn positive
While earnings expectations continue to fall, reported small cap earnings modestly rebounded in Q3. According to Jefferies, reported Q2 small cap earnings were +2.1% versus -3.6% for large cap and -1.7% for mid cap. This is the first positive result for small caps in the past five quarters and likely explains part of the strong relative performance in Q3. Top-line growth was also positive, with small cap sales increasing +2.6% versus -0.2% for large cap and +0.5% for mid cap.
Growth outperformed value across all market caps
From a style perspective, growth outperformed value across all market caps. For the quarter, the Russell 2000 Growth index returned +9.22% versus +8.87% for the Russell 2000 Value. Value remained solidly in the lead, however, for the year-to-date period with the Russell 2000 Value returning +15.49% versus +7.48% for the Russell 2000 Growth.
From a sector perspective, eight of the 10 economic sectors in the benchmark posted positive returns for the quarter. Sectors with the highest total return included Information Technology (+18.17%) and Health Care (+14.38%), while Utilities (-5.12%) and Telecommunication Services (-1.12%) posted the lowest returns.
High beta and low quality led in Q3
As previously noted, high beta and low quality factors sharply outperformed in Q3. Within the Russell 2000 Value index, the highest beta (fifth quintile) stocks returned +15.4% for Q3 versus a paltry +1.6% for the lowest beta (first quintile). For the second consecutive quarter, the lowest ROE (fifth quintile) stocks also outperformed returning +15.5% versus +8.8% for the highest ROE (first quintile).
Talk of higher rates weighed on dividend payers
Another factor worth commenting on is dividend yield, which experienced a sharp reversal in Q3 as rate expectations ticked higher and the richly priced “bond proxy” sectors, including Real Estate and Utilities, experienced significant outflows. According to Jefferies, high-yielding stocks in the Russell 2000 Value index returned +5.2% in Q3 versus +8.6% for low yielders and +13.3% for stocks with no yield.
Value managers struggled
While weak performance in Real Estate and Utilities should have benefited active small cap value managers, who have been underweight these sectors, the tailwind was overcome by the dominance of low quality factors. According to Bank of America/Merrill Lynch and Lipper Analytical Services, just 20% of active small cap value managers outperformed in Q3. Similarly, just 30% of small cap growth and 14% of small cap core managers outperformed in Q3.
Past performance is no guarantee of future results. Please see appendix for additional performance, representative portfolio, and holdings disclosures. | 3
For the year-to-date period, performance is equally poor with just 18% of small cap value managers beating the index. Other style managers are doing somewhat better, with 46% of small cap growth managers outperforming and 34% of small cap core.
Unfortunately, poor results are also being pressured by the continued outflows from active strategies. Since 2006, active small cap managers have seen only two years with positive inflows, while outflows over that period total nearly -$146 B versus nearly +$42 B of inflows for passive strategies. Year to date, active small cap strategies have experienced nearly -$17 B of outflows compared to more than +$3 B of inflows to passive small cap strategies (according to Jefferies).
Real Estate became a GICS sector on September 1
Effective September 1, Real Estate became the 11th sector in the GICS classification system. As noted last quarter, this is the first new GICS sector since the classification system’s inception in 1999 and is especially important for small cap investors since Real Estate represents a meaningful portion of most small cap indices, including 11.06% in the Russell 2000 Value index (as of September 30).
Please note River Road focuses on quarterly attribution in our Market and Portfolio Commentary. We will begin reporting Real Estate as a separate sector beginning with Q4 of this year. We appreciate your patience and apologize for any confusion during this transition.
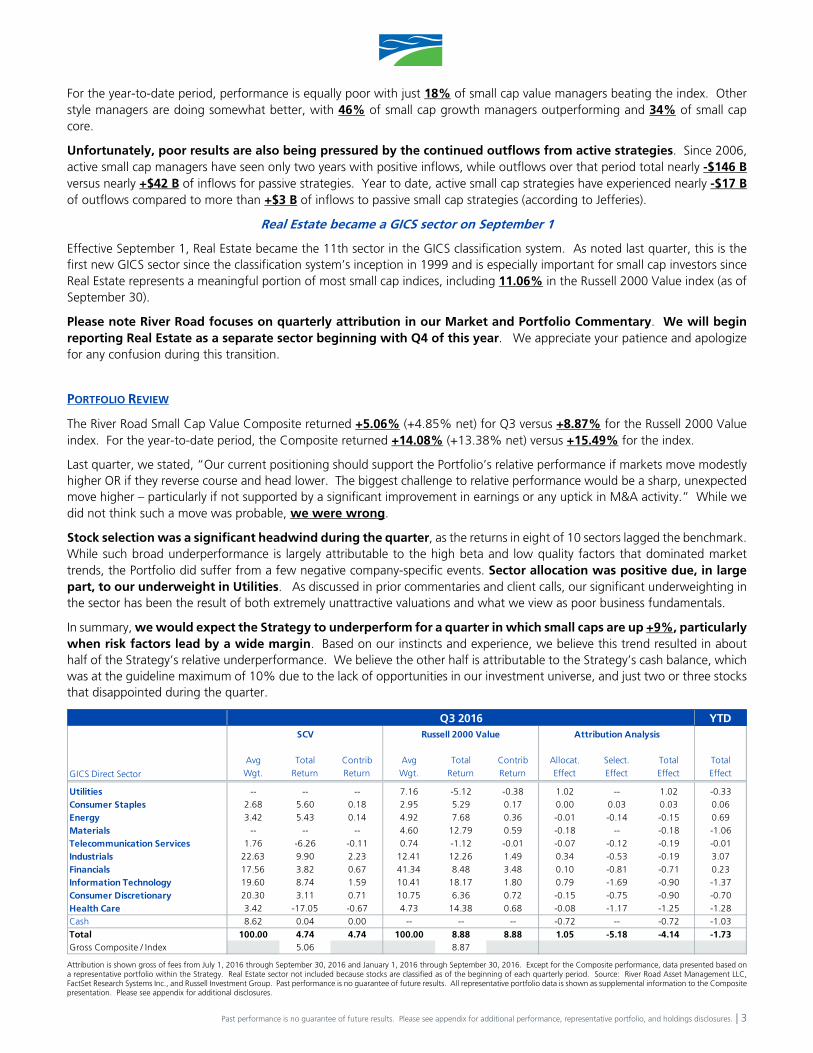
PORTFOLIO REVIEW
The River Road Small Cap Value Composite returned +5.06% (+4.85% net) for Q3 versus +8.87% for the Russell 2000 Value index. For the year-to-date period, the Composite returned +14.08% (+13.38% net) versus +15.49% for the index.
Last quarter, we stated, “Our current positioning should support the Portfolio’s relative performance if markets move modestly higher OR if they reverse course and head lower. The biggest challenge to relative performance would be a sharp, unexpected move higher – particularly if not supported by a significant improvement in earnings or any uptick in M&A activity.” While we did not think such a move was probable, we were wrong.
Stock selection was a significant headwind during the quarter, as the returns in eight of 10 sectors lagged the benchmark. While such broad underperformance is largely attributable to the high beta and low quality factors that dominated market trends, the Portfolio did suffer from a few negative company-specific events. Sector allocation was positive due, in large part, to our underweight in Utilities. As discussed in prior commentaries and client calls, our significant underweighting in the sector has been the result of both extremely unattractive valuations and what we view as poor business fundamentals.
In summary, we would expect the Strategy to underperform for a quarter in which small caps are up +9%, particularly when risk factors lead by a wide margin. Based on our instincts and experience, we believe this trend resulted in about half of the Strategy’s relative underperformance. We believe the other half is attributable to the Strategy’s cash balance, which was at the guideline maximum of 10% due to the lack of opportunities in our investment universe, and just two or three stocks that disappointed during the quarter.
Attribution is shown gross of fees from July 1, 2016 through September 30, 2016 and January 1, 2016 through September 30, 2016. Except for the Composite performance, data presented based on a representative portfolio within the Strategy. Real Estate sector not included because stocks are classified as of the beginning of each quarterly period. Source: River Road Asset Management LLC, FactSet Research Systems Inc., and Russell Investment Group. Past performance is no guarantee of future results. All representative portfolio data is shown as supplemental information to the Composite presentation. Please see appendix for additional disclosures.
YTD
Avg Total Contrib Avg Total Contrib Allocat. Select. Total Total
Q3 2016SCV Russell 2000 Value Attribution Analysis
Past performance is no guarantee of future results. Please see appendix for additional performance, representative portfolio, and holdings disclosures. | 4
What worked...
The sectors with the highest contribution to relative return in Q3 were Utilities and Consumer Staples. Utilities benefited from lack of exposure, while Consumer Staples benefited from positive stock selection.
The top contributing holding in the Portfolio during Q3 was Rackspace Hosting Inc. (RAX, +52%), a global provider of managed cloud and related IT services. We initiated our position earlier this year as RAX was transitioning its business model to support customized cloud and software applications instead of just providing services and raw cloud computing capacity. By leveraging other cloud platforms, former competitors like Amazon Web Services and Microsoft Azure were transformed into Rackspace partners. In August, private-equity firm Apollo Global signed a deal to acquire Rackspace for $32 per share, which was a +38% premium to the unaffected stock price.
As we have noted in previous commentaries, the Portfolio has benefited from several M&A events over the past 18 months, typically with transactions occurring very near our assessed values. However, River Road valued RAX at $42/share (7x 2017e EBITDA) versus the $32/share offered by Apollo (5.4x 2017e EBITDA). Rackspace’s business model transition created very attractive growth prospects, improved returns on invested capital, generated high margins, and increased free cash flow by reducing capital intensity. The company also had a strong balance sheet with net cash of $50 MM. Co-founder and Chairman Graham Weston owns approximately 15% of RAX and, prior to our investment, personally purchased $2.5 MM worth of RAX shares in the open market during Q3 2015 at $29.24/share. The board also believed the stock was cheap and authorized the first share repurchase program in the company’s history. From late 2014 through Q2 2016, Rackspace repurchased $700 MM of its shares at an average price of $31.39/share.
So if the chairman and the board found the stock an attractive investment at $28 - $31/share, why agree to sell the entire company at $32/share? Chairman Weston did not sell, and instead chose to roll over his equity with Apollo. The independent board members of Rackspace made no objections. While we were very disappointed with the transaction, we significantly trimmed the position as shares traded near the offer price.
Another top contributor during Q3 was UniFirst Corp. (UNF, +14%), the second-largest provider of workplace uniforms in North America. In the first significant industry transaction in approximately 10 years, UNF’s largest competitor Cintas (CTAS) agreed to acquire the industry’s fourth-largest player G&K Services for 13x forward EBITDA. The transaction demonstrates the positive attributes of industry consolidation, as CTAS’s acquisition multiple will fall from 13x to 7.2x if all expected synergies are captured. This deal also highlights the valuation discrepancy between CTAS and UNF, which at the announcement were trading at 12.5x and 7.3x forward EBITDA, respectively. Finally, in late September, UNF completed the accretive acquisition of Arrow Uniform (multiple not disclosed) – its largest acquisition since 2003. We maintained the position during the quarter.
Another top contributor was Fidelity National Financial Inc. - FNFV Group (FNFV, +9%), holder of various investments primarily focused in restaurants, software, and insurance brokerage. The company’s second quarter results demonstrated exceptionally strong revenue and EBITDA growth for its Digital Insurance unit and continuation of an important inflection for its Ceridian software business as cloud revenue is growing faster than legacy platform revenues are declining. We believe FNFV’s various businesses are becoming better understood by the market with each quarterly update, which should help to close the valuation gap between the stock price and net asset value. We maintained the position during the quarter.
Rounding out the top five contributors in Q3 were Viad Corp. (VVI, +19%) and SodaStream International Ltd. (SODA, +25%). VVI is a conglomerate with an exhibition/conference services segment and also provides travel and recreation services at U.S. and Canadian national parks. Viad rallied when management’s recent acquisitions and targeted capital spending drove strong quarterly results in both business segments. We maintained the position. SodaStream, a maker and distributor of home carbonation systems, followed exceptional Q1 results with equally impressive Q2 results, giving investors greater confidence management’s turnaround plan is working. We trimmed the position as the stock approached our assessed value.
Top ContributorsQ3
Rackspace Hosting Inc.
UniFirst Corp.
Fidelity National Financial Inc. - FNFV Group
Viad Corp.
SodaStream International Ltd.
Past performance is no guarantee of future results. Please see appendix for additional performance, representative portfolio, and holdings disclosures. | 5
What didn’t work…
The sectors with the lowest contribution to relative return in Q3 were Health Care and Consumer Discretionary. Both sectors suffered primarily from poor stock selection.
The bottom contributing holding in the Portfolio during Q3 was GEO Group Inc. (GEO, -29%), a REIT offering correctional and detention facilities and services to federal, state, local, and foreign governments. In an August 18 memo, Deputy Attorney General Sally Yates directed the Federal Bureau of Prisons (BOP) to begin “the process of reducing – and ultimately ending – [its] use of privately operated prisons.” While the BOP comprises just 14% of GEO’s annual operating revenue, the stock’s severe negative reaction (down as much as -50% intraday and down -40% at the close) implied the federal government, including U.S. Immigration and Customs Enforcement as well as the U.S. Marshals Service, was immediately exiting all contracts with privately managed prisons. For a number of reasons, including budgetary and prison capacity considerations, we do not believe it is practical or even possible for the BOP (let alone, the entire federal system) to substantially reduce its reliance on private prisons. Indeed, on September 30, GEO announced the BOP signed a two-year extension for its second-largest facility. After a thorough analysis of the facts, we maintained the position during the quarter.
Another bottom contributor was Myriad Genetics Inc. (MYGN, -32%), a molecular diagnostic testing company. In August, MYGN reported poor fiscal Q4 results, led by surprisingly weak performance from its core Hereditary Cancer Testing (HCT) business. Additionally, lower-than-expected fiscal 2017 guidance implied the HCT business will lose market share at a rate faster than its new product pipeline can backfill the revenue decline. Since the HCT business trajectory contradicted our investment thesis, we exited the position.
Another bottom contributor during the quarter was VeriFone Systems Inc. (PAY, -15%), a global leader in secure electronic payment systems and services. We added PAY to the Portfolio in late June after a disappointing Q2 earnings report sent the stock down to three-year lows. Slow merchant certification of EMV technology (chip readers for credit and debit cards) hindered PAY’s ability to recognize service revenue and weakness in Latin American economies suppressed international revenue growth. We viewed these issues as transitory and believed PAY offered an attractive risk/reward. In September, PAY’s Q3 earnings announcement revealed many small and medium-sized businesses have yet to become EMV compliant (have the necessary chip card technology). Further impacting Q3 results were continuing economic woes in Latin America and a virtual halt to business in Turkey following the failed coup attempt. We believe our investment thesis remains intact, but its timing has been delayed. We maintained the position during the quarter.
Rounding out the bottom five contributors in Q3 were Blackhawk Network Holdings Inc. (Cl A) (HAWK, -10%), a prepaid payment network offering branded gift cards, and Air Methods Corp. (AIRM, -12%), the largest provider of air medical transportation services in the United States. Despite HAWK management reducing its estimate of the negative EMV-related impact to 2016 revenue and EBITDA, the stock declined on renewed sell-side concern that a portion of HAWK’s merchant partners will not be EMV compliant by the end of September. This would increase the risk high value cards might not return to some retailers’ stores in time for the all-important holiday selling season. We view this as a temporary issue and maintained the position during the quarter. In July, AIRM announced Q2 results below expectations due to integration costs related to a recent acquisition, which resulted in lower service rates and flight volumes. We maintained our position.
Portfolio positioning…
As of September 30, the Portfolio held 56 positions. The Portfolio’s concentrated positioning and 10.3% cash balance reflect a diminished opportunity set, primarily due to unattractive valuations in the broader small cap universe.
Trading activity was moderate to brisk in Q3, with the rally driving more sales than purchases. For the quarter, 5 new holdings were purchased and 7 positions were eliminated. New purchases were relatively diversified, although two new positions (Barrett Business Services - BBSI and Resources Connection Inc. - RECN) are professional services providers. Market caps for new purchases range from $251 MM to $1.9 B, with two of the five having market caps less than $500 MM. In addition to the new purchases,
SCV1
Russell 2000 Value2 SCV1
Change from 6/30
Russell 2000 Value2
Change from 6/30
Industrials 27.5% 12.1% 27.0% -0.4% 12.6% 0.5%
Info. Tech. 16.9% 10.1% 18.9% 1.9% 10.6% 0.4%
Cons. Disc. 19.9% 10.7% 17.5% -2.4% 10.6% -0.1%
Financials 13.7% 41.3% 11.9% -1.8% 30.1% -11.2%
Cons. Staples 5.4% 3.0% 5.3% -0.2% 2.9% -0.1%
Energy 4.4% 5.1% 2.9% -1.5% 5.2% 0.1%
Health Care 3.9% 4.6% 2.8% -1.1% 4.9% 0.3%
Telecom 1.6% 0.8% 2.0% 0.4% 0.7% -0.1%
Real Estate – – 1.4% 1.4% 11.1% 11.1%
Materials – 4.5% – 0.0% 4.5% 0.0%
Utilities – 7.8% – 0.0% 6.9% -0.9%
Cash 6.6% – 10.3% 3.6% – –
Total 100.0% 100.0% 100.0% – 100.0% –
6/30/2016 9/30/2016
1RRAM sector classifications are internal and may differ from GICS; based on a representative portfo lio within the Strategy. 2As classified by GICS. Totals may not sum due to rounding.
Bottom ContributorsQ3
GEO Group Inc.
Myriad Genetics Inc.
VeriFone Systems Inc.
Blackhawk Network Holdings Inc. (Cl A)
Air Methods Corp.
Past performance is no guarantee of future results. Please see appendix for additional performance, representative portfolio, and holdings disclosures. | 6
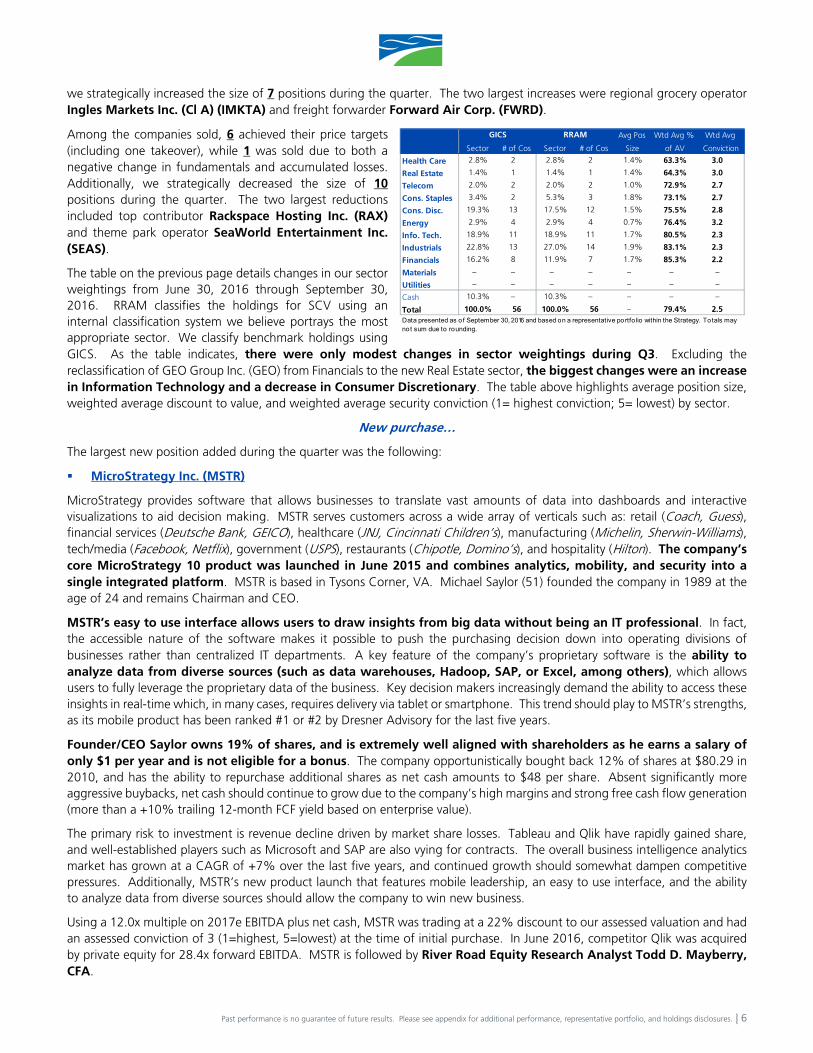
we strategically increased the size of 7 positions during the quarter. The two largest increases were regional grocery operator Ingles Markets Inc. (Cl A) (IMKTA) and freight forwarder Forward Air Corp. (FWRD).
Among the companies sold, 6 achieved their price targets (including one takeover), while 1 was sold due to both a negative change in fundamentals and accumulated losses. Additionally, we strategically decreased the size of 10 positions during the quarter. The two largest reductions included top contributor Rackspace Hosting Inc. (RAX) and theme park operator SeaWorld Entertainment Inc. (SEAS).
The table on the previous page details changes in our sector weightings from June 30, 2016 through September 30, 2016. RRAM classifies the holdings for SCV using an internal classification system we believe portrays the most appropriate sector. We classify benchmark holdings using GICS. As the table indicates, there were only modest changes in sector weightings during Q3. Excluding the reclassification of GEO Group Inc. (GEO) from Financials to the new Real Estate sector, the biggest changes were an increase in Information Technology and a decrease in Consumer Discretionary. The table above highlights average position size, weighted average discount to value, and weighted average security conviction (1= highest conviction; 5= lowest) by sector.
New purchase…
The largest new position added during the quarter was the following:
MicroStrategy Inc. (MSTR)
MicroStrategy provides software that allows businesses to translate vast amounts of data into dashboards and interactive visualizations to aid decision making. MSTR serves customers across a wide array of verticals such as: retail (Coach, Guess), financial services (Deutsche Bank, GEICO), healthcare (JNJ, Cincinnati Children’s), manufacturing (Michelin, Sherwin-Williams), tech/media (Facebook, Netflix), government (USPS), restaurants (Chipotle, Domino’s), and hospitality (Hilton). The company’s core MicroStrategy 10 product was launched in June 2015 and combines analytics, mobility, and security into a single integrated platform. MSTR is based in Tysons Corner, VA. Michael Saylor (51) founded the company in 1989 at the age of 24 and remains Chairman and CEO.
MSTR’s easy to use interface allows users to draw insights from big data without being an IT professional. In fact, the accessible nature of the software makes it possible to push the purchasing decision down into operating divisions of businesses rather than centralized IT departments. A key feature of the company’s proprietary software is the ability to analyze data from diverse sources (such as data warehouses, Hadoop, SAP, or Excel, among others), which allows users to fully leverage the proprietary data of the business. Key decision makers increasingly demand the ability to access these insights in real-time which, in many cases, requires delivery via tablet or smartphone. This trend should play to MSTR’s strengths, as its mobile product has been ranked #1 or #2 by Dresner Advisory for the last five years.
Founder/CEO Saylor owns 19% of shares, and is extremely well aligned with shareholders as he earns a salary of only $1 per year and is not eligible for a bonus. The company opportunistically bought back 12% of shares at $80.29 in 2010, and has the ability to repurchase additional shares as net cash amounts to $48 per share. Absent significantly more aggressive buybacks, net cash should continue to grow due to the company’s high margins and strong free cash flow generation (more than a +10% trailing 12-month FCF yield based on enterprise value).
The primary risk to investment is revenue decline driven by market share losses. Tableau and Qlik have rapidly gained share, and well-established players such as Microsoft and SAP are also vying for contracts. The overall business intelligence analytics market has grown at a CAGR of +7% over the last five years, and continued growth should somewhat dampen competitive pressures. Additionally, MSTR’s new product launch that features mobile leadership, an easy to use interface, and the ability to analyze data from diverse sources should allow the company to win new business.
Using a 12.0x multiple on 2017e EBITDA plus net cash, MSTR was trading at a 22% discount to our assessed valuation and had an assessed conviction of 3 (1=highest, 5=lowest) at the time of initial purchase. In June 2016, competitor Qlik was acquired by private equity for 28.4x forward EBITDA. MSTR is followed by River Road Equity Research Analyst Todd D. Mayberry, CFA.
Avg Pos Wtd Avg % Wtd Avg
Sector # of Cos Sector # of Cos Size of AV Conviction
Health Care 2.8% 2 2.8% 2 1.4% 63.3% 3.0
Real Estate 1.4% 1 1.4% 1 1.4% 64.3% 3.0
Telecom 2.0% 2 2.0% 2 1.0% 72.9% 2.7
Cons. Staples 3.4% 2 5.3% 3 1.8% 73.1% 2.7
Cons. Disc. 19.3% 13 17.5% 12 1.5% 75.5% 2.8
Energy 2.9% 4 2.9% 4 0.7% 76.4% 3.2
Info. Tech. 18.9% 11 18.9% 11 1.7% 80.5% 2.3
Industrials 22.8% 13 27.0% 14 1.9% 83.1% 2.3
Financials 16.2% 8 11.9% 7 1.7% 85.3% 2.2
Materials – – – – – – –
Utilities – – – – – – –
Cash 10.3% – 10.3% – – – –
Total 100.0% 56 100.0% 56 – 79.4% 2.5
GICS RRAM
Data presented as of September 30, 2016 and based on a representative portfo lio within the Strategy. Totals may not sum due to rounding.
Past performance is no guarantee of future results. Please see appendix for additional performance, representative portfolio, and holdings disclosures. | 7
OUTLOOK
No clear direction for stocks near term…
Across the firm, we found this an especially difficult quarter to formulate a market outlook. From our perspective, there is no clear direction for stocks, particularly in the near term. Most investors recognize the uptrend in stocks is mature and the risk/reward tradeoff is less than ideal. Indeed, all of our indicators and research indicate a heightened risk environment, including lofty valuations, weak growth, extended balance sheets, and declining expectations. However, very few of our indicators are at the extreme levels associated with a market top. Additionally, we can identify both positive catalysts (easy comps) and potentially negative catalysts (Fed, election) for investors in the final months of the year.
We believe overall earnings and economic growth will remain weak in the final months of 2016, but easy year-over-year earnings comparisons during the next two quarters will provide investors with positive news flow. Housing remains healthy and the economy is operating at full employment coming into the important Christmas selling season. A recession certainly does not appear imminent, which should boost confidence and retail sales. This is, in part, why we upgraded our outlook following Q2. However, certain segments of the economy are clearly weakening and may be pointing to trouble in 2017.
Additionally, there may be a relief rally when the November elections conclude, particularly if the outcome is what Wall Street expects (Clinton wins and Republicans retain control over Congress). On the other hand, an unexpected outcome could result in downside volatility. Further, regardless of the outcome, there is significant uncertainty about policy in the year(s) ahead.
For investors, perhaps most important in the near term is whether the Fed raises rates in December. When we upgraded our outlook following Q2, we said that the key driver was the continued dovish tone emanating from the Fed. From our perspective, “lower for longer” meant stocks would be “higher for longer.” Recently, the FOMC consensus has shifted in a more hawkish direction. If the likelihood of a December hike continues to rise, it could provide the catalyst for at least a modest sell-off in stocks.
… but risks are clearly elevated heading into 2017
Risks are clearly elevated. While most of our formal measures are not at extremes, there is very little that gets us excited about the broader market and its growth prospects. As stated earlier, the risk/reward trade-off is not very attractive and small caps have already logged big gains on the back of very little fundamental improvement.
Looking ahead, the key question is whether the recent trends are sustainable. Was the demand for risk in Q3 simply a valuation adjustment or does it indicate growth is poised to improve significantly? Is the rally from the February lows the beginning of a longer-term uptrend or part of a long topping process? Are stocks simply going to remain at very elevated levels until rates normalize?
Valuation measures only explain part of the challenge
From a valuation perspective, stocks remain expensive although below recent and historical extremes. Our proprietary top 20 discount-to-assessed valuation measure was 80% at quarter end, which is above average but well below the 85% range associated with market tops. More concerning is that the average multiple used to calculate this measure has been at, or even slightly above, its historical peak for the past 12 months – an important late cycle indicator. Additionally, valuations only explain part of the challenge facing investors. The ability to identify stocks that meet our discount and other critical criteria has become increasingly challenging over the past 12 months. High beta and low quality stocks might be cheap, but if they do not meet our investment criteria we do not buy them. This dilemma is reflected in the high level of concentration in the Strategy and external metrics that reflect sky-high leverage for small cap companies.
Average calculated using the last value for the given quarter. The top 20 % assessed valuation reflects monthly values from January 31, 2007 through December 31, 2009; and weekly values beginning January 1, 2010. All data is preliminary and subject to revisions. Starting January 1, 2014, data based on a representative portfolio. Source: River Road Asset Management LLC and FactSet Research Systems Inc.
60%
70%
80%
90%
2007 2008 2009 2010 2011 2012 2013 2014 2015 2016
SCV Top 20 Discount to Value
SCV Top 20 % ValueSCV Top 20 % Value Average
Past performance is no guarantee of future results. Please see appendix for additional performance, representative portfolio, and holdings disclosures. | 8
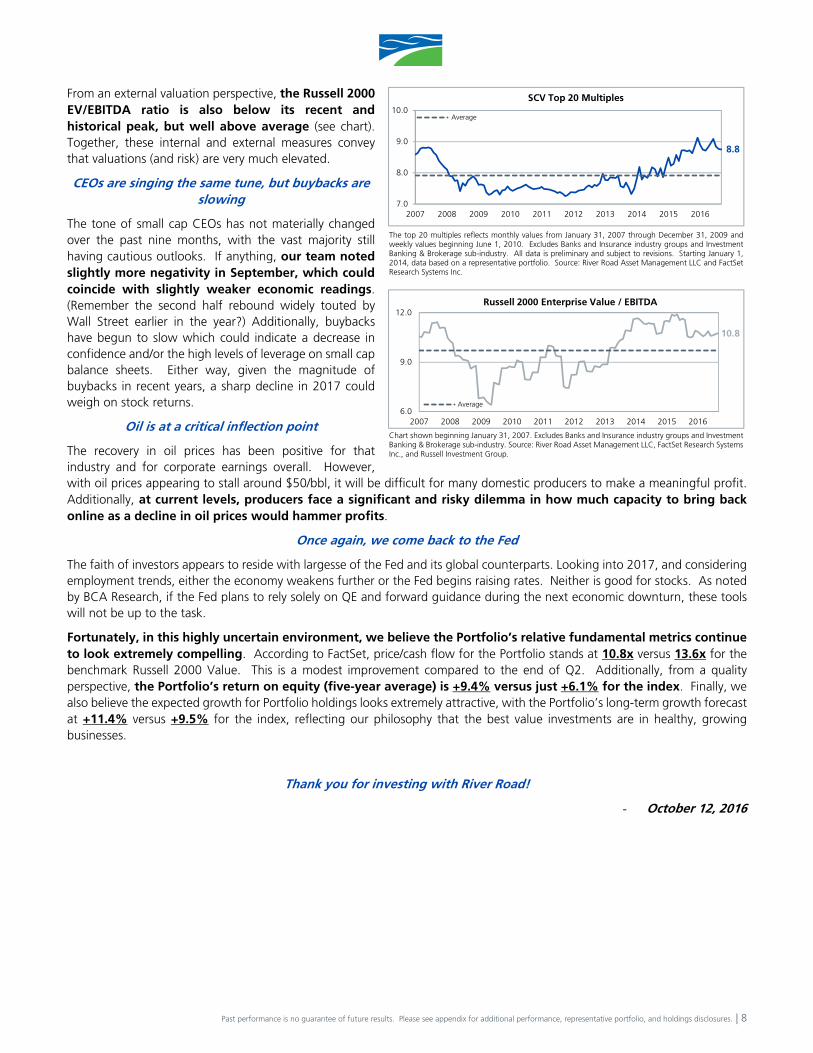
From an external valuation perspective, the Russell 2000 EV/EBITDA ratio is also below its recent and historical peak, but well above average (see chart). Together, these internal and external measures convey that valuations (and risk) are very much elevated.
CEOs are singing the same tune, but buybacks are slowing
The tone of small cap CEOs has not materially changed over the past nine months, with the vast majority still having cautious outlooks. If anything, our team noted slightly more negativity in September, which could coincide with slightly weaker economic readings. (Remember the second half rebound widely touted by Wall Street earlier in the year?) Additionally, buybacks have begun to slow which could indicate a decrease in confidence and/or the high levels of leverage on small cap balance sheets. Either way, given the magnitude of buybacks in recent years, a sharp decline in 2017 could weigh on stock returns.
Oil is at a critical inflection point
The recovery in oil prices has been positive for that industry and for corporate earnings overall. However, with oil prices appearing to stall around $50/bbl, it will be difficult for many domestic producers to make a meaningful profit. Additionally, at current levels, producers face a significant and risky dilemma in how much capacity to bring back online as a decline in oil prices would hammer profits.
Once again, we come back to the Fed
The faith of investors appears to reside with largesse of the Fed and its global counterparts. Looking into 2017, and considering employment trends, either the economy weakens further or the Fed begins raising rates. Neither is good for stocks. As noted by BCA Research, if the Fed plans to rely solely on QE and forward guidance during the next economic downturn, these tools will not be up to the task.
Fortunately, in this highly uncertain environment, we believe the Portfolio’s relative fundamental metrics continue to look extremely compelling. According to FactSet, price/cash flow for the Portfolio stands at 10.8x versus 13.6x for the benchmark Russell 2000 Value. This is a modest improvement compared to the end of Q2. Additionally, from a quality perspective, the Portfolio’s return on equity (five-year average) is +9.4% versus just +6.1% for the index. Finally, we also believe the expected growth for Portfolio holdings looks extremely attractive, with the Portfolio’s long-term growth forecast at +11.4% versus +9.5% for the index, reflecting our philosophy that the best value investments are in healthy, growing businesses.
Thank you for investing with River Road!
- October 12, 2016
The top 20 multiples reflects monthly values from January 31, 2007 through December 31, 2009 and weekly values beginning June 1, 2010. Excludes Banks and Insurance industry groups and Investment Banking & Brokerage sub-industry. All data is preliminary and subject to revisions. Starting January 1, 2014, data based on a representative portfolio. Source: River Road Asset Management LLC and FactSet Research Systems Inc.
8.8
7.0
8.0
9.0
10.0
2007 2008 2009 2010 2011 2012 2013 2014 2015 2016
SCV Top 20 Multiples
Average
Chart shown beginning January 31, 2007. Excludes Banks and Insurance industry groups and Investment Banking & Brokerage sub-industry. Source: River Road Asset Management LLC, FactSet Research Systems Inc., and Russell Investment Group.
10.8
6.0
9.0
12.0
2007 2008 2009 2010 2011 2012 2013 2014 2015 2016
Russell 2000 Enterprise Value / EBITDA
Average
Past performance is no guarantee of future results. Please see appendix for additional performance, representative portfolio, and holdings disclosures. | 9
Small Cap Value Disclosure:
River Road Asset Management, LLC (“RRAM”) is a registered investment adviser formed in April 2005 and is majority owned by Affiliated Managers Group, Inc. This presentation may be presented by an employee of Affiliated Managers Group, Inc., AMG Funds, or another AMG entity, which are affiliates of RRAM. RRAM claims compliance with the Global Investment Performance Standards (GIPS®). The firm maintains a complete list and description of composites and policies for valuing portfolios, calculating performance, and preparing compliant presentations which are available upon request by contacting Thomas D. Mueller, CFA, CPA at (502) 371-4100 or [email protected].
The Composite contains fully discretionary small cap value equity accounts that seek capital appreciation by investing primarily in small cap value domestic equity securities that trade at a discount to our assessed valuation as determined using RRAM’s proprietary Absolute Value® approach. For this composite, RRAM defines a small cap company as one whose market capitalization is less than $3 B. The Manager selects securities from a universe of companies with a market capitalization at the time of initial purchase typically between $50 MM and $3 B, employing a value-driven, bottom-up fundamental approach. The U.S. dollar is the currency used to express performance. Performance includes the reinvestment of income. The official benchmarks for the Small Cap Value Composite are the Russell 2000 Value and Russell 2000. All other indices are shown for additional information only.
Performance presented prior to April 1, 2005 occurred while the original members of the Portfolio Management Team were affiliated with a prior firm and those Portfolio Management Team members were the only individuals primarily responsible for selecting the securities to buy and sell. A review of this track record for compliance with portability requirements of the GIPS® standards was conducted by Ashland Partners & Company.
Representative Portfolios – Performance data, beta, and standard deviation based on the Composite, all other data presented is based on representative portfolios within the Small Cap Value Strategy. Since no single representative portfolio is available to represent the Strategy since inception, different representative portfolios are used for different periods (using the same selection criteria) to create a continuous representative portfolio. For any periods prior to April 1, 2006, Small Cap Value Composite data was used and combined with the representative portfolio data because underlying transaction information for representative portfolios is not available in the necessary format prior to April 1, 2006. All representative portfolio data is shown as supplemental information to the Small Cap Value Composite presentation.
The information provided in this report should not be considered a recommendation to purchase or sell any particular security. There is no assurance that any securities discussed herein will remain in our composite at the time you receive this report or that securities sold have not been repurchased. Characteristics and sector weightings of our Portfolio are shown and may not be indicative of this strategy’s current or future investments. It should not be assumed that any of the holdings discussed herein were or will be profitable or that the investment recommendations or decisions we make in the future will be profitable or will equal the investment performance of the securities discussed herein. RRAM will provide you with a list of all past specific recommendations over the past year if you so request. Past performance is no guarantee of future results. The holdings identified do not represent all of the securities purchased, sold, or recommended. To receive information regarding the methodology for calculating the top/bottom contributors or a list showing every holding’s contribution to the overall Portfolio performance contact [email protected]
Sector, Industry Group, Industry, or Sub-industry group levels are provided from the Global Industry Classification Standard (“GICS”), developed and exclusively owned by MSCI, Inc. (“MSCI”) and Standard & Poor’s Financial Services LLC (“S&P”), unless otherwise stated that they have been reclassified or classified by RRAM. Reclassifications/classifications by RRAM are not supported by S&P or MSCI. All GICS data is provided “As Is” with no warranties. RRAM does classify securities that are not automatically classified by MSCI and S&P.
Beta and standard deviation calculated monthly gross Composite performance. The performance number included in parentheses behind a stock’s name refers to that stock’s total gross return (dividends reinvested) for the representative portfolio during the period. Stock conviction determined by portfolio manager; 1 = highest; 5 = lowest.
Most company share-related characteristics exclude outliers. Outlier exclusion methods include interquartile and inverse interquartile; the universe for determining outliers is the Russell 3000. For more information, please contact RRAM.
The following marks are all owned, and federally registered, by RRAM: RIVER ROAD ASSET MANAGEMENT & DESIGN (U.S. Registration No. 3,456,174); IDEALLY SITUATED 738 MILES FROM WALL STREET® (U.S. Registration No. 3,643,106); ABSOLUTE VALUE® (U. S. Registration No. 4,753,652); DISCOVERING VALUE OFF THE BEATEN PATH® (U.S. Registration No. 3,451,824); INDEPENDENT VALUE STRATEGY® (U.S. Registration No. 4,599,008); and FOCUSED ABSOLUTE VALUE® (U.S. Registration No. 4,943,492). Any use of these marks without the express written consent of River Road Asset Management, LLC is expressly prohibited.