COMPREHENSIVE HOUSING MARKET ANALYSIS As of November 1, 2009 U.S. Department of Housing and Urban Development Office of Policy Development and Research Houston, Texas Harris Polk Tyler Brazoria Liberty Hardin Wharton Walker Matagorda Grimes Madison Brazos Austin Colorado Fort Bend Montgomery Waller Jefferson Trinity Chambers San Jacinto Washington Galves- ton Gulf of Mexico Housing Market Area The Houston Housing Market Area (HMA) is coterminous with the Houston-Sugar Land-Baytown Metro- politan Statistical Area (MSA). For purposes of this analysis, the HMA is divided into three submarkets: the Harris County submarket, which includes the central city of Houston; the Galveston County submarket; and the Remainder submarket, which consists of Austin, Brazoria, Chambers, Fort Bend, Liberty, Montgomery, San Jacinto, and Waller Counties. Market Details Economic Conditions ............... 2 Population and Households ..... 4 Housing Market Trends ............ 7 Data Profiles ........................... 14 Summary Economy Employment growth slowed in the Houston HMA in mid-2007 after nearly 4 years of increasing rates of growth. During the 12 months ending October 2009, nonfarm employment declined by 1.5 percent compared with a growth of 2.7 percent during the previous 12-month period. A period of slower growth is expected to occur during the 3-year forecast period as nonfarm employment is expected to grow by approximately 0.7 percent annually. Table DP-1 at the end of this report provides employment data for the HMA. Sales Market Recent declines in home sales coupled with continued, although moderated, homebuilding activity have led to con- siderable softening of the sales market in the Houston HMA. The current sales vacancy rate for the area is estimated at 3.5 percent, up from 1.7 percent in 2000 and 3.1 percent reported by the 2007 American Community Survey (ACS). Demand is expected for 50,500 new homes during the forecast period, as shown in Table 1. Rental Market The rental housing market in the Houston HMA is soft. The overall rental vacancy rate for the area is currently estimated at 16.4 percent, up from 9.1 percent in 2000 and 13.8 percent during the 2007 ACS. During the forecast period, all de- mand for additional rental units can be satisfied by the existing supply of vacant available units. Additional construction will only contribute to prolonging soft market conditions. Notes: Total demand represents estimated production necessary to achieve a balanced market at the end of the forecast period. Units under construction as of November 1, 2009. A portion of the estimated 125,000 other vacant units in the HMA will likely satisfy some of the forecast demand. Source: Estimates by analyst Houston HMA Harris County Submarket Galveston County Submarket Remainder Submarket Sales Units Rental Units Sales Units Rental Units Sales Units Rental Units Sales Units Rental Units Table 1. Housing Demand in the Houston HMA, 3-Year Forecast November 1, 2009 to November 1, 2012 Total Demand Under Construction 50,500 0 28,750 0 3,350 0 18,400 0 8,090 9,160 4,175 6,725 390 310 3,525 2,125
Transcript
C O M P R E H E N S I V E H O U S I N G M A R K E T A N A L Y S I S
As of November 1, 2009U.S. Department of Housing and Urban Development Office of Policy Development and Research
Houston, Texas
Collin
Dallas
Denton
Harris
Polk Tyler
Brazoria
Liberty
Hardin
Wharton
Walker
Matagorda
Grimes
Madison
Brazos
Austin
ColoradoFort Bend
Montgomery
Wal
ler
Jeff
erso
n
Trinity
Chambers
SanJacinto
Washington
Galves-
ton
Gulf of Mexico
Housing Market Area
The Houston Housing Market Area (HMA) is coterminous with the Houston-Sugar Land-Baytown Metro-politan Statistical Area (MSA). For purposes of this analysis, the HMA is divided into three submarkets: the Harris County submarket, which includes the central city of Houston; the Galveston County submarket; and the Remainder submarket, which consists of Austin, Brazoria, Chambers, Fort Bend, Liberty, Montgomery, San Jacinto, and Waller Counties.
Economy Employment growth slowed in the Houston HMA in mid-2007 after nearly 4 years of increasing rates of growth. During the 12 months ending October 2009, nonfarm employment declined by 1.5 percent compared with a growth of 2.7 percent during the previous 12-month period. A period of slower growth is expected to occur during the 3-year forecast period as nonfarm employment is expected to grow by approximately 0.7 percent annually. Table DP-1 at the end of this report provides employment data for the HMA.
Sales MarketRecent declines in home sales coupled with continued, although moderated, homebuilding activity have led to con-siderable softening of the sales market
in the Houston HMA. The current sales vacancy rate for the area is estimated at 3.5 percent, up from 1.7 percent in 2000 and 3.1 percent reported by the 2007 American Community Survey (ACS). Demand is expected for 50,500 new homes during the forecast period, as shown in Table 1.
Rental MarketThe rental housing market in the Houston HMA is soft. The overall rental vacancy rate for the area is currently estimated at 16.4 percent, up from 9.1 percent in 2000 and 13.8 percent during the 2007 ACS. During the forecast period, all de-mand for additional rental units can be satisfied by the existing supply of vacant available units. Additional construction will only contribute to prolonging soft market conditions.
Notes: Total demand represents estimated production necessary to achieve a balanced market at the end of the forecast period. Units under construction as of November 1, 2009. A portion of the estimated 125,000 other vacant units in the HMA will likely satisfy some of the forecast demand.Source: Estimates by analyst
HoustonHMA
Harris County
Submarket
Galveston County
Submarket
Remainder Submarket
SalesUnits
RentalUnits
SalesUnits
RentalUnits
SalesUnits
RentalUnits
SalesUnits
RentalUnits
Table 1. Housing Demand in the Houston HMA, 3-Year Forecast November 1, 2009 to November 1, 2012
Total Demand
Under Construction
50,500 0 28,750 0 3,350 0 18,400 0
8,090 9,160 4,175 6,725 390 310 3,525 2,125
Ho
us
ton
, T
X •
CO
MP
RE
HE
NS
IVE
HO
US
ING
MA
RK
ET
AN
ALY
SIS
2Economic Conditions
occupied housing stock in the metropolitan area.
Resident employment growth in the Houston HMA has slowed in recent years. Employment growth peaked at 3.1 percent, or 78,350 workers, during the 12 months ending June 2007 after steadily increasing since early 2004. During the 12 months ending October 2009, resident employment declined by 1.1 percent, or 27,800 workers, to a total of 2.6 million compared with a growth of 1.8 percent, or 46,450 workers, during the previous 12-month period. The unemployment rate in the HMA rose from 4.6 to 7.1 percent during the most recent 12 months. Figure 1 shows trends in
On September 13, 2008, Hurricane Ike made initial
landfall in Texas at Galveston before making final landfall near Baytown. The most significant damage occurred along the coast in Galveston, Harris, and Chambers Counties. According to the National Climatic Data Center, the hurricane caused nearly $14 billion in property damage to the Greater Houston area. According to Federal Emergency Management Agency (FEMA) estimates, approximately 3,300 owner-occupied and 1,425 renter- occupied dwellings were severely damaged by the storm. These figures represent an estimated 0.2 percent of the current owner- and renter-
Figure 1. Trends in Labor Force, Resident Employment, Unemployment Rate in the Houston HMA, 1990 to 2008
Source: U.S. Bureau of Labor Statistics
Lab
or F
orce
&R
esid
ent E
mp
loym
ent
Une
mp
loym
ent R
ate
3,100,000
2,900,000
2,700,000
2,500,000
2,300,000
2,100,000
1,900,000
1,700,000
Labor Force Resident Employment Unemployment Rate
10.0
9.0
8.0
7.0
6.0
5.0
4.0
3.0
2.0
1.0
0.0
1990
1992
1994
1996
1998
2000
2002
2004
2006
1991
1993
1995
1997
1999
2001
2003
2005
2007
2008
labor force, resident employment, and unemployment rates since 1990.
Nonfarm employment has also con-tinued to slow in the Houston HMA after peaking in mid-2007. Total nonfarm employment declined by 39,900 jobs, or 1.5 percent, during the 12 months ending October 2009 to 2.6 million (see Table 2), after a gain of 2.7 percent during the previous 12 months. Gains in the mining and logging, education and health services, and government sectors were more than offset by losses in the other sectors. The construction sector recorded the largest decline of 12,300 jobs, or 6 percent, as builders responded to
Notes: Based on 12-month averages through October 2008 and October 2009. Numbers may not add to totals due to rounding.
Source: U.S. Bureau of Labor Statistics
Table 2. 12-Month Average Employment in the Houston HMA, by Sector
in the HMA, according to data produced by The Perryman Group for the Greater Houston Partnership. Oil and gas extraction and support activities for mining, two subsectors of the mining and logging sector, account for virtually all the jobs in the sector. Several major energy sector companies are headquartered or have significant operations in the area, including CITGO Petroleum Cor-poration, ConocoPhillips Company, Halliburton, and Shell Oil Company. In addition, National Oilwell Varco recorded the greatest rate of employ-ment growth of the largest 15 compa-nies in the Houston HMA during the past year, growing by 30 percent to 8,250 employees and contractors.
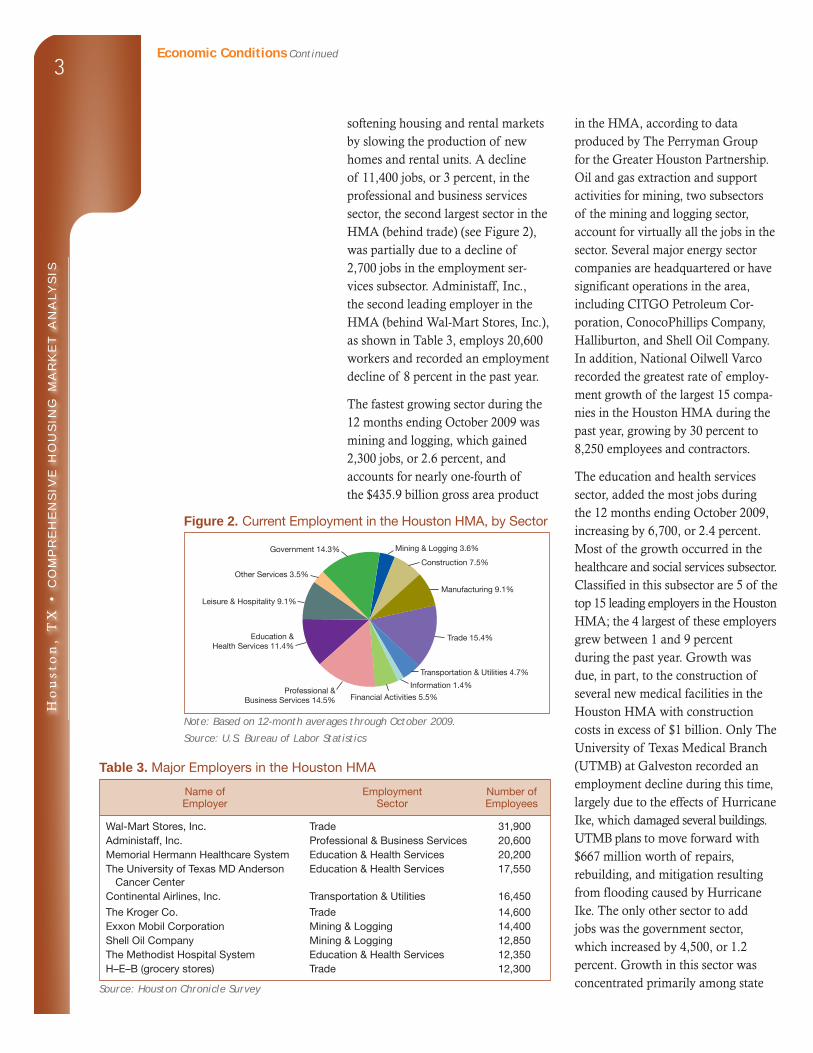
The education and health services sector, added the most jobs during the 12 months ending October 2009, increasing by 6,700, or 2.4 percent. Most of the growth occurred in the healthcare and social services subsector. Classified in this subsector are 5 of the top 15 leading employers in the Houston HMA; the 4 largest of these employers grew between 1 and 9 percent during the past year. Growth was due, in part, to the construction of several new medical facilities in the Houston HMA with construction costs in excess of $1 billion. Only The University of Texas Medical Branch (UTMB) at Galveston recorded an employment decline during this time, largely due to the effects of Hurricane Ike, which damaged several buildings. UTMB plans to move forward with $667 million worth of repairs, rebuilding, and mitigation resulting from flooding caused by Hurricane Ike. The only other sector to add jobs was the government sector, which increased by 4,500, or 1.2 percent. Growth in this sector was concentrated primarily among state
Figure 2. Current Employment in the Houston HMA, by Sector
Note: Based on 12-month averages through October 2009.
Source: U.S. Bureau of Labor Statistics
Government 14.3%
Other Services 3.5%
Leisure & Hospitality 9.1%
Education & Health Services 11.4%
Professional &Business Services 14.5%
Trade 15.4%
Manufacturing 9.1%
Mining & Logging 3.6%
Construction 7.5%
Transportation & Utilities 4.7%
Financial Activities 5.5%
Information 1.4%
Table 3. Major Employers in the Houston HMA
Name ofEmployer
Employment Sector
Number of Employees
Wal-Mart Stores, Inc. Trade 31,900Administaff, Inc. Professional & Business Services 20,600Memorial Hermann Healthcare System Education & Health Services 20,200The University of Texas MD Anderson
Cancer CenterEducation & Health Services 17,550
Continental Airlines, Inc. Transportation & Utilities 16,450
The Kroger Co. Trade 14,600Exxon Mobil Corporation Mining & Logging 14,400Shell Oil Company Mining & Logging 12,850The Methodist Hospital System Education & Health Services 12,350H–E–B (grocery stores) Trade 12,300
Source: Houston Chronicle Survey
softening housing and rental markets by slowing the production of new homes and rental units. A decline of 11,400 jobs, or 3 percent, in the professional and business services sector, the second largest sector in the HMA (behind trade) (see Figure 2), was partially due to a decline of 2,700 jobs in the employment ser- vices subsector. Administaff, Inc., the second leading employer in the HMA (behind Wal-Mart Stores, Inc.), as shown in Table 3, employs 20,600 workers and recorded an employment decline of 8 percent in the past year.
The fastest growing sector during the 12 months ending October 2009 was mining and logging, which gained 2,300 jobs, or 2.6 percent, and accounts for nearly one-fourth of the $435.9 billion gross area product
Ho
us
ton
, T
X •
CO
MP
RE
HE
NS
IVE
HO
US
ING
MA
RK
ET
AN
ALY
SIS
4Economic Conditions Continued
and local governments, which added 1,900 and 2,300 jobs, respectively. Figure 3 shows nonfarm growth by sector since 1990.
During the forecast period, nonfarm employment is expected to increase by 17,050 jobs, or 0.7 percent, annually. Job growth is expected to remain relatively flat during the
first year of the forecast period as the current economic downturn continues before beginning to recover during the second and third years of the forecast period. The government and the education and health services sectors will lead employment growth. Growth in the remaining sectors is expected to be well below levels recorded from 2004 to 2007.
2010
Figure 3. Sector Growth in the Houston HMA, Percentage Change, 1990 to Current
Note: Current is based on 12-month averages through October 2009.
Source: U.S. Bureau of Labor Statistics
Total Covered Employment
Goods Producing
Mining & Logging
Construction
Manufacturing
Service Providing
Wholesale & Retail Trade
Information
Financial Activities
Professional & Business Services
Education & Health Services
Government
Other Services
Leisure & Hospitality
Transportation & Utilities
0– 10 4030 906050 8070
Population and Households
The population of the Houston HMA increased by 119,000,
or 2.3 percent, annually since 2000 to 5,856,000 people, as shown in Figure 4. Net in-migration accounted for approximately one-half of the population increase during this time, as shown in Figure 5. The effects of Hurricane Katrina, which made landfall in New Orleans, Louisiana, in August 2005, significantly affected
migration into the Houston HMA, because many evacuees relocated into the city of Houston and surrounding areas. Between 2000 and mid-2005, net in-migration to the Houston HMA averaged 55,050 people annually. Between mid-2005 and mid-2006, following the occurrence of Hurricane Katrina, net in-migration to the Houston HMA increased to 120,800 people an-nually. Since that time, net in-migration
Ho
us
ton
, T
X •
CO
MP
RE
HE
NS
IVE
HO
US
ING
MA
RK
ET
AN
ALY
SIS
5
Population Households
Figure 4. Population and Household Growth in the Houston HMA, 1990 to Forecast
Sources: 1990 and 2000—1990 Census and 2000 Census; current and forecast—estimates by analyst
1990 to 2000 2000 to Current Current to Forecast
Ave
rage
Ann
ual C
hang
e
140,000
120,000
100,000
80,000
60,000
40,000
20,000
0
has tapered off as the economy has slowed and some of the Hurricane Katrina evacuees have left the area. Since mid-2006, the population of the Houston HMA has increased by an average of 111,300 people, or 2 per-cent, annually, and net in-migration has averaged 47,050.
Harris County absorbed approximately 85 percent of the Hurricane Katrina evacuees who migrated to the Houston HMA. Before Hurricane Katrina occurred, Harris County had an average annual population growth of 1.8 percent and a net in-migration of 18,800 people between 2000 and 2005. In the year after Hurricane Katrina, which forced many residents to move away from Louisiana and Mississippi, the population in Harris
County grew by 3.3 percent and net in-migration increased to 75,250. In the most recent 36 months ending October 2009, population growth in the Harris County submarket declined to a 1.6-percent annual rate.
The Galveston County submarket was affected less from Hurricane Katrina than were other parts of the Houston HMA. Galveston County is largely a second-home market, with a large number of vacation homes on and near the coast. Most of Galveston’s evacuees were able to find housing in areas closer to downtown Houston and the surrounding suburbs. From 2000 to 2006, population growth in this submarket averaged 1.8 percent annually. Since 2006, population growth has declined to 1.5 percent due to the slowing economy and the effects of Hurricane Ike.
The fastest growing portion of the Houston HMA has been the Remainder submarket, particularly Fort Bend County. Since 2000, the population of this submarket has grown by an average of 3.6 percent, or 45,300, annually. Most of the remaining 15 percent of Hurricane Katrina evacuees who relo-cated to the Houston HMA settled in this submarket, primarily in parts of Fort Bend, Montgomery, and Brazoria Counties abutting the city of Houston. Population growth in this submarket declined to an average of 3.2 percent annually during the past 3 years.
Due to the continued economic slowdown and the sustained trickle of out-migration of Hurricane Katrina evacuees, population growth in the HMA is forecast to slow to 1.5 percent annually during the 3-year forecast period, with approximately 25 percent of the increase occurring due to net
Population and Households Continued
Figure 5. Components of Population Change in the Houston HMA, 1990 to Forecast
1990 to 2000 2000 to Current Current to Forecast
70,000
60,000
50,000
40,000
30,000
20,000
10,000
0
Ave
rage
Ann
ual C
hang
e
Sources: 1990 and 2000—1990 Census and 2000 Census; current and forecast—estimates by analyst
Net Natural Change Net Migration
Ho
us
ton
, T
X •
CO
MP
RE
HE
NS
IVE
HO
US
ING
MA
RK
ET
AN
ALY
SIS
6
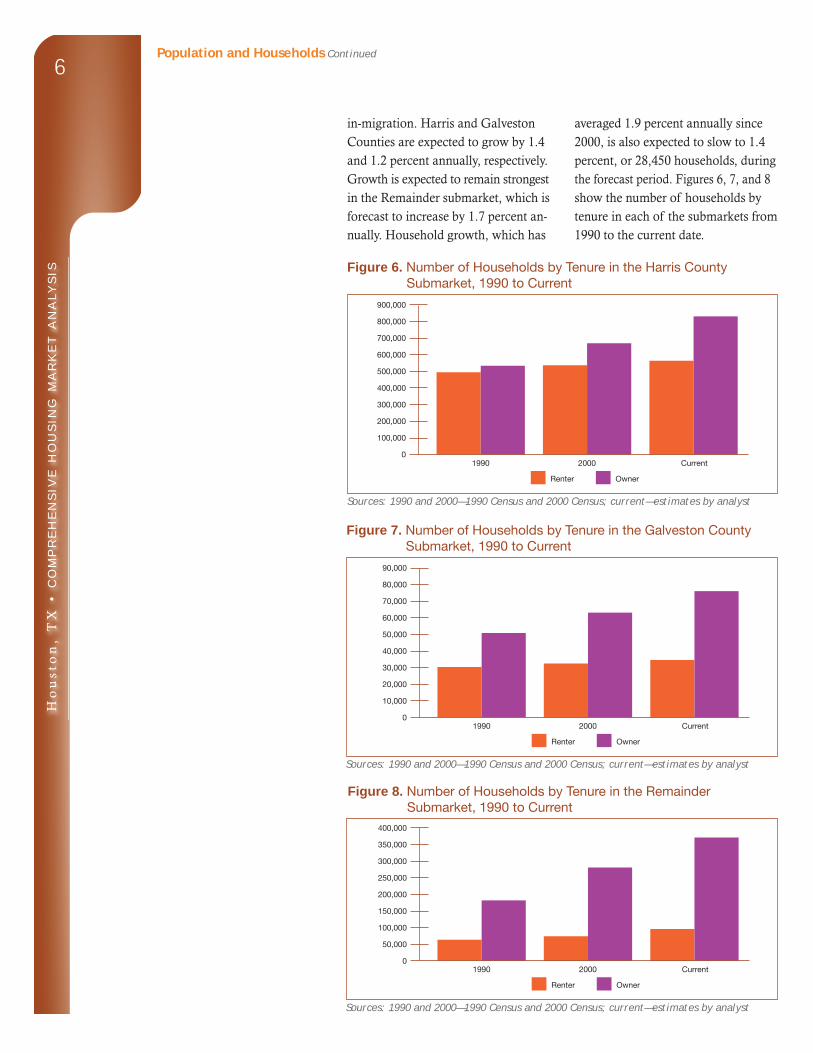
in-migration. Harris and Galveston Counties are expected to grow by 1.4 and 1.2 percent annually, respectively. Growth is expected to remain strongest in the Remainder submarket, which is forecast to increase by 1.7 percent an-nually. Household growth, which has
averaged 1.9 percent annually since 2000, is also expected to slow to 1.4 percent, or 28,450 households, during the forecast period. Figures 6, 7, and 8 show the number of households by tenure in each of the submarkets from 1990 to the current date.
Population and Households Continued
90,000
80,000
70,000
60,000
50,000
40,000
30,000
20,000
10,000
01990 2000 Current
Renter Owner
Sources: 1990 and 2000—1990 Census and 2000 Census; current—estimates by analyst
Figure 7. Number of Households by Tenure in the Galveston County Submarket, 1990 to Current
400,000
350,000
300,000
250,000
200,000
150,000
100,000
50,000
01990 2000 Current
Renter Owner
Sources: 1990 and 2000—1990 Census and 2000 Census; current—estimates by analyst
Figure 8. Number of Households by Tenure in the Remainder Submarket, 1990 to Current
900,000
800,000
700,000
600,000
500,000
400,000
300,000
200,000
100,000
01990 2000 Current
Renter Owner
Sources: 1990 and 2000—1990 Census and 2000 Census; current—estimates by analyst
Figure 6. Number of Households by Tenure in the Harris County Submarket, 1990 to Current
Ho
us
ton
, T
X •
CO
MP
RE
HE
NS
IVE
HO
US
ING
MA
RK
ET
AN
ALY
SIS
7Housing Market Trends
Sales Market—Harris County Submarket
The sales housing market in the Harris County submarket is soft, with a current estimated vacancy rate of 3.5 percent, up from 1.5 percent as reported in the 2000 Census and from 3 percent as reported in the 2007 ACS as shown in Table DP-2 (at the end of this report). Vacancy rates have increased during the past 2 years as the inventory of unsold homes increased as a result of declining de-mand and high levels of production. The number of months of unsold inventory remained high at 6.4 during the 12 months ending October 2009; it has remained above 6 months since late 2008, compared with 5.5 months for 2007, according to the Real Estate Center at Texas A&M University.
Home sales have slowed signifi-cantly during the past 2 years due to a combination of stricter lending requirements and the continued local economic downturn. The number of new and existing homes sold declined by more than 13 percent to 58,750 during the 12 months ending October 2009, according to the Real Estate Center at Texas A&M University. Home sales peaked at 81,750 during the 12 months ending February 2007. The average price of a new or existing home sold declined by nearly 5 percent to $197,900 during the most recent
12 months, following an increase of nearly 3 percent during the previous 12 months. Home sales price increases peaked at a 7-percent rate during the 12 months ending June 2006 and have declined steadily during the past 3 years.
In response to the slowdown in home sales, single-family homebuilding activity, as measured by the number of single-family building permits issued, declined significantly during the past 2 years. Building activity peaked in 2006 after growing steadily for more than 10 years because of consistent migration into Harris County and, in more recent years, increasing construc-tion of second homes and investment properties. Building activity has declined signifi cantly since that time, however, as shown in Figure 9. During the 12 months ending October 2009, the number of single-family building permits issued declined more than 30 percent compared with the number issued during the previous 12-month period, based on preliminary data. In addition to the 11,050 single-family permits issued during the most recent 12 months, permits were issued for an estimated 490 townhomes and condominiums. Approximately 11 percent of multi-family units permitted since 2000 in Harris County were intended for owner occupancy.
During the next 3 years, demand is estimated for 28,750 new homes, including single-family, townhome, and condominium units. Demand is expected to be concentrated in the last 2 years of the forecast period after the current supply of vacant units is absorbed and employment and household growth begins to return to normal levels. Because of the current excess supply of vacant Notes: Includes only single-family units. Includes data through October 2009.
Source: U.S. Census Bureau, Building Permits Survey
Figure 9. Single-Family Building Permits Issued in the Harris County Submarket, 1990 to 2009
2000
2001
2002
2003
2004
2005
2006
1992
1993
1994
1995
1996
1997
1998
1999
1991
1990
35,000
30,000
25,000
20,000
15,000
10,000
5,000
0
2008
2009
2007
Ho
us
ton
, T
X •
CO
MP
RE
HE
NS
IVE
HO
US
ING
MA
RK
ET
AN
ALY
SIS
8Housing Market TrendsSales Market—Harris County Submarket Continued
units and slower household growth, however, the demand for new units is expected to remain below recent levels of production. In addition, a portion of the estimated 77,000
other vacant units will likely come back on the market and satisfy some of the forecast demand. Prices for new homes are expected to start at $70,000. Some of the demand during the forecast period will be satisfied by the 4,175 homes currently under construction. Table 4 presents detailed information on the estimated demand for new market-rate sales housing by price range in Harris County during the forecast period.
Note: A portion of the estimated 77,000 other vacant units in the submarket will likely satisfy some of the forecast sales demand.Source: Estimates by analyst
Table 4. Estimated Demand for New Market-Rate Sales Housing in the Harris County Submarket, November 1, 2009 to November 1, 2012
Rental Market—Harris County Submarket
Hurricane Katrina evacuees who relocated to the submarket in 2006, the vacancy rate has remained high because the supply of new units brought to the market outpaced demand.
Multifamily building activity, as measured by the number of units permitted, more than doubled during the 3 years following Hurricane Katrina, from 8,375 units permitted in 2005 to a peak of 16,950 units per-mitted during the 12 months ending April 2008, as shown in Figure 11. Building activity has only recently begun to decline in Harris County as builders respond to declining demand and an increasing supply of vacant units. During the 12 months ending October 2009, 4,000 multifamily units were permitted, a decline of approxi-mately 71 percent compared with the number permitted during the previous 12 months, based on preliminary data.
The rental housing market in the Harris County submarket is very soft, with an estimated current overall vacancy rate of 17 percent (see Figure 10), up from 8.7 percent as reported in the 2000 Census and 14.7 percent as reported in the 2007 ACS. The apartment market in Harris County is also soft, with an estimated vacancy rate of 15 percent in October 2009. Despite the large number of
Sources: 1990 and 2000—1990 Census and 2000 Census; current—estimates by analyst
1990 2000 Current
14.3
8.7
17.018.0
16.0
14.0
12.0
10.0
8.0
6.0
4.0
2.0
0.0
Figure 10. Rental Vacancy Rates in the Harris County Submarket, 1990 to Current
Ho
us
ton
, T
X •
CO
MP
RE
HE
NS
IVE
HO
US
ING
MA
RK
ET
AN
ALY
SIS
9
During the next 3 years, after account-ing for the current excess supply of vacant available units, no demand is expected for additional new market-rate rental units in the Harris County submarket. The 6,725 units currently
under construction and the large number of excess vacant units should be more than sufficient to meet the demand for rental units in Harris County for the foreseeable future. In addition, a portion of the estimated 77,000 other vacant units will likely come back on the market and satisfy some of the forecast demand. The construction of additional units will only contribute to prolonging soft market conditions. Average effective rents for all apartment units in the submarket are currently estimated to be $640 for a one-bedroom unit, $820 for a two-bedroom unit, and $960 for a three-bedroom unit.
Housing Market TrendsRental Market—Harris County Submarket Continued
Notes: Includes all multifamily units in structures with two or more units. Includes data through October 2009.
Source: U.S. Census Bureau, Building Permits Survey
Figure 11. Multifamily Building Permits Issued in the Harris County Submarket, 1990 to 2009
2000
2001
2002
2003
2004
2005
2006
1992
1993
1994
1995
1996
1997
1998
1999
1991
1990
25,000
20,000
15,000
10,000
5,000
0
2007
2008
2009
Sales Market—Galveston County Submarket
The sales housing market in Galves-ton County is soft, with a current estimated vacancy rate of 3 percent, up from 2.3 percent as reported in the 2000 Census (see Table DP-3 at the end of this report) but down from 5.4 percent as reported in the 2007 ACS. Despite the slowing economy, vacancy rates in Galveston County declined over the past 2 years due largely to the effects of Hurricane Ike, as residents moved from damaged homes to vacant available homes. According to FEMA estimates, approximately 2,175 owner-occupied units in Galveston County were severely damaged by the storm and another 5,775 received heavy damage, repre-senting approximately 10 percent of the total owner-occupied housing stock in the county.
During the 12 months ending Octo-ber 2009, home sales in Galveston County slowed significantly. The number of homes sold declined by 28 percent to 800 during the most recent
12 months, according to the Real Es-tate Center at Texas A&M University. During the same 12-month period, the average price of a new or existing home sold also declined by 28 percent to $165,192. Home sales prices have been declining at an increasing rate since late 2008 due in part to the lingering effects of Hurricane Ike on the market as fewer higher priced vacation homes are being sold.
Galveston is a resort area with a significant number of vacation homes along, and within, several miles of the Gulf Coast. Single-family home construction activity, as measured by the number of single-family building permits issued, peaked in Galveston County in 2005 and has been dimin-ishing since that time, as shown in Figure 12. Declines in production have escalated in recent months, however, as the demand for new homes, particularly second homes, has subsided. During the 12 months ending October 2009, the number of
Ho
us
ton
, T
X •
CO
MP
RE
HE
NS
IVE
HO
US
ING
MA
RK
ET
AN
ALY
SIS
10Housing Market TrendsSales Market—Galveston County Submarket Continued
single-family building permits issued was nearly 30 percent lower than the number issued during the previous 12-month period. Approximately 18 percent of multifamily units permit-
ted since 2000 in Galveston County were estimated to be sales units. Much of this building activity oc-curred in the first half of the decade, when the market for vacation homes was stronger.
During the next 3 years, demand is estimated for 3,350 new homes, including single-family, townhome, and condominium units. Demand is expected to be concentrated in the last 2 years of the forecast period, after the current supply of vacant units is absorbed and employment and household growth begins to return to normal levels. Because of the current supply of vacant units and slower household growth, demand for new units is expected to be below recent levels of production. In addition, a portion of the estimated 14,000 other vacant units will likely come back on the market and satisfy some of the forecast demand. Prices for new units are expected to start at $100,000. Ap-proximately 390 homes are currently under construction. Table 5 presents detailed information on the estimated demand for new market-rate sales housing by price range in Galveston County during the forecast period.
Notes: Includes only single-family units. Includes data through October 2009.
Source: U.S. Census Bureau, Building Permits Survey
Figure 12. Single-Family Building Permits Issued in the Galveston County Submarket, 1990 to 2009
Note: A portion of the estimated 14,000 other vacant units in the submarket will likely satisfy some of the forecast sales demand.Source: Estimates by analyst
Table 5. Estimated Demand for New Market-Rate Sales Housing in the Galveston County Submarket, November 1, 2009 to November 1, 2012
Rental Market—Galveston County Submarket
The rental housing market in the Galveston County submarket is soft, with an estimated current overall vacancy rate of 13 percent (see Figure 13), up from 11.3 percent as reported in the 2007 ACS and down slightly from 13.3 percent as reported in the 2000 Census. The apartment market in Galveston County is also soft, with an estimated vacancy rate of 13 percent in October 2009. The
rental market in Galveston County tightened with vacancy rates between 5 and 6 percent in the months im-mediately following Hurricane Ike as residents moved from damaged homes into available vacant units; the market has since softened. According to FEMA estimates, approximately 890 renter-occupied units in Galveston County were severely damaged by the storm and another 4,750 received
Ho
us
ton
, T
X •
CO
MP
RE
HE
NS
IVE
HO
US
ING
MA
RK
ET
AN
ALY
SIS
11Housing Market Trends Rental Market—Galveston County Submarket Continued
Sources: 1990 and 2000—1990 Census and 2000 Census; current—estimates by analyst
1990 2000 Current
13.3 13.3 13.014.0
12.0
10.0
8.0
6.0
4.0
2.0
0.0
Figure 13. Rental Vacancy Rates in the Galveston County Submarket, 1990 to Current
Notes: Includes all multifamily units in structures with two or more units. Includes data through October 2009.
Source: U.S. Census Bureau, Building Permits Survey
Figure 14. Multifamily Building Permits Issued in the Galveston County Submarket, 1990 to 2009
2000
2001
2002
2003
2004
2005
2006
1992
1993
1994
1995
1996
1997
1998
1999
1991
1990
800
700
600
500
400
300
200
100
0
2007
2008
2009
heavy damage, representing approxi-mately 16 percent of the total renter-occupied housing stock in the county.
Since 2000, approximately 2,275 multi - family units were permitted in Galves-ton County, or an average of 240 annually, as shown in Figure 14. Multifamily building activity, as mea-sured by the number of units permit-ted, has fluctuated significantly from year to year during this time, from a high of 700 units in 2000 to a low of 50 units in 2002. Construction activ-ity, however, which never increased
as rapidly in Galveston County as in other parts of the HMA, has increased in recent months. During the 12 months ending October 2009, 320 multifamily units were permitted, representing an increase of 120 units compared with the number permitted during the previous 12-month period. The increase is primarily attributable to a 252-unit affordable apartment complex permitted in Texas City in June 2009. The project is expected to open in the spring of 2010, with monthly rents starting at $620, $741, $849, and $939 for one-, two-, three-, and four-bedroom units, respectively.
During the next 3 years, after ac-counting for the current excess supply of vacant available units, no demand is expected for additional new market- rate rental units in the Galveston County submarket. The 310 units currently under construction and the large number of excess vacant units should be more than sufficient to meet the demand for new units in Galveston County for the foreseeable future. In addition, a portion of the estimated 14,000 other vacant units will likely come back on the market and satisfy some of the forecast de-mand. The construction of additional units will only contribute to prolong-ing soft market conditions. Average effective rents for all apartment units in the submarket are currently esti-mated to be $660 for a one-bedroom unit, $850 for a two-bedroom unit, and $1,000 for a three-bedroom unit.
Ho
us
ton
, T
X •
CO
MP
RE
HE
NS
IVE
HO
US
ING
MA
RK
ET
AN
ALY
SIS
12Housing Market Trends Continued
Sales Market—Remainder Submarket
The sales housing market in the remaining eight counties of the HMA is soft, with a current estimated vacancy rate of 3.5 percent (see Table DP-4 at the end of the report), up from 1.8 percent as reported in the 2000 Census and 2.8 percent as reported in the 2007 American Com-munity Survey (ACS). Vacancy rates have increased over the past 2 years as the inventory of unsold homes grew as a result of declining demand and high levels of production.
Since 2000, most of the growth in this submarket has occurred in Brazoria, Fort Bend, and Montgomery Counties. These counties border Harris County to the south, southwest, and north, respectively, and have grown because of the spread of development around the city of Houston. During the 12 months ending October 2009, the number of homes sold declined 17 percent to 15,950 in these three counties compared with the number sold during the previous 12-month period, according to the Real Estate Center at Texas A&M University. During the same time, the average price of a new or existing home sold declined by approximately 1 percent to $220,200. During the previous 12 months ending October 2008, home sales prices increased by 4 percent.
Despite the slowdown in home sales, single-family home construction activity, as measured by the number of single-family building permits issued, only recently began to decline significantly in the Remainder sub-market. Building activity peaked in 2006 and has declined significantly in recent months as shown in Figure 15. During the 12 months ending October 2009, the number of single-family building permits issued in the eight-county submarket declined nearly 30 percent compared with the number issued during the previous 12-month period, based on preliminary data. Less than 5 percent of multifamily units permitted since 2000 in the Remainder submarket were for struc-tures intended for owner occupancy.
During the next 3 years, demand is estimated for 18,400 new homes, including single-family, townhome, and condominium units. Demand is expected to be concentrated in the last 2 years of the forecast period after the current supply of vacant units is absorbed and employment and household growth begins to return to normal levels. Because of the current supply of vacant units and much slower household growth, demand for new units is expected to be significantly below recent levels of construction. In addition, a portion of the estimated 34,000 other vacant units will likely come back on the market and satisfy some of the fore-cast demand. Most of the growth in this submarket is expected to continue to occur in Brazoria, Fort Bend, and Montgomery Counties. Prices for new units are expected to start at $90,000. A portion of the forecast demand will be met by the 3,525 homes currently
2000
2001
2002
2003
2004
2005
2006
Figure 15. Single-Family Building Permits Issued in the Remainder Submarket, 1990 to 2009
Notes: Includes only single-family units. Includes data through October 2009.Source: U.S. Census Bureau, Building Permits Survey
1992
1993
1994
1995
1996
1997
1998
1999
1991
1990
25,000
20,000
15,000
10,000
5,000
0
2007
2008
2009
Ho
us
ton
, T
X •
CO
MP
RE
HE
NS
IVE
HO
US
ING
MA
RK
ET
AN
ALY
SIS
13Housing Market TrendsSales Market—Remainder Submarket Continued
under construction. Table 6 presents detailed information on the estimated demand for new market-rate sales
housing, by price range, in the remaining eight counties of the HMA during the forecast period.
Note: A portion of the estimated 34,000 other vacant units in the submarket will likely satisfy some of the forecast sales demand.Source: Estimates by analyst
Table 6. Estimated Demand for New Market-Rate Sales Housing in the Remainder Submarket, November 1, 2009 to November 1, 2012
Rental Market—Remainder Submarket
The rental housing market in the Remainder submarket is soft, with an estimated current overall vacancy rate of 14 percent (see Figure 16), up from 9.9 percent as reported in the 2000 Census and from 9.1 percent as reported in the 2007 ACS. The apartment market in the Remainder submarket is also generally soft, with estimated current vacancy rates in the three primary counties of Brazoria, Fort Bend, and Montgomery at 13, 9, and 14 percent, respectively. Despite
strong economic and household growth in the submarket for much of the decade, the vacancy rate has increased in recent years as demand for new rental units has been out-paced by the large supply of new units being constructed.
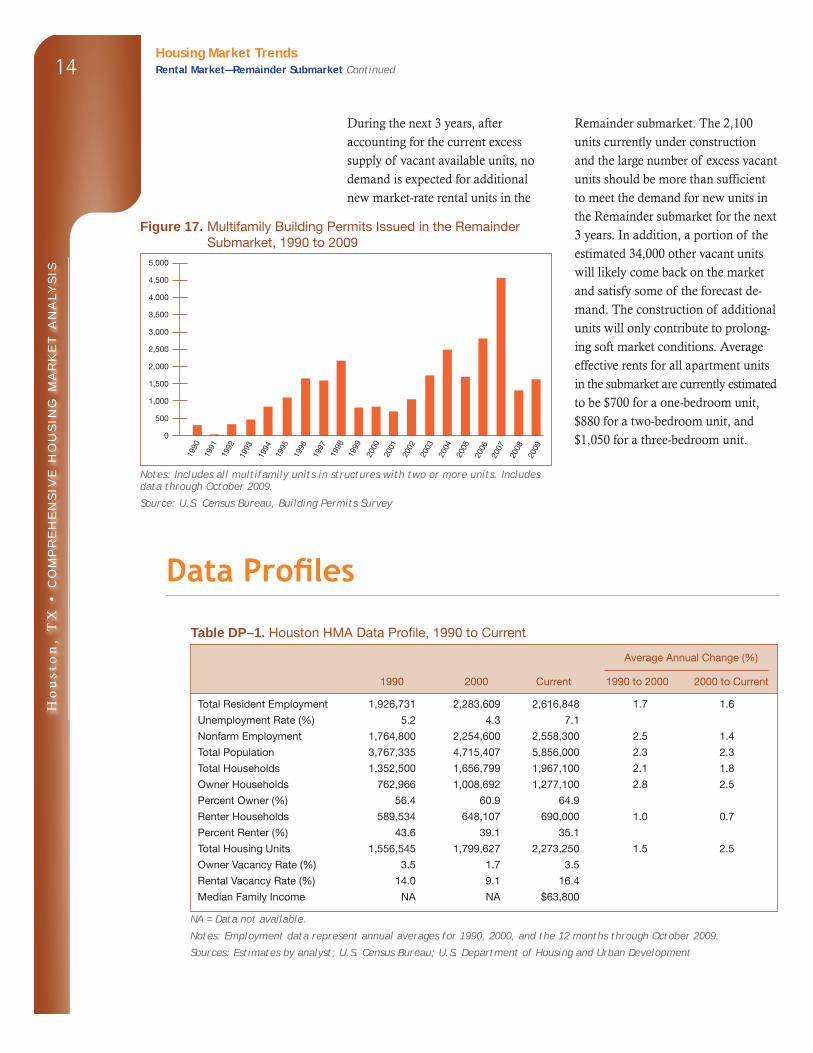
Since 2000, approximately 18,450 multifamily units have been permitted in the Remainder submarket, or an average of 1,975 annually, as shown in Figure 17. Multifamily building ac-tivity, as measured by the number of units permitted, grew steadily through much of the decade, from 750 units in 2001 to a peak of 4,575 units in 2007.Construction activity has declined significantly, however, since that time. During the 12 months ending October 2009, permits for 1,650 units were issued, representing a decline of 27 percent compared with the number issued during the previous 12-month period, based on preliminary data.
Sources: 1990 and 2000—1990 Census and 2000 Census; current—estimates by analyst
1990 2000 Current
11.5
9.9
14.016.0
14.0
12.0
10.0
8.0
6.0
4.0
2.0
0.0
Figure 16. Rental Vacancy Rates in the Remainder Submarket, 1990 to Current
Ho
us
ton
, T
X •
CO
MP
RE
HE
NS
IVE
HO
US
ING
MA
RK
ET
AN
ALY
SIS
14Housing Market TrendsRental Market—Remainder Submarket Continued
During the next 3 years, after account ing for the current excess supply of vacant available units, no demand is expected for additional new market-rate rental units in the
Remainder submarket. The 2,100 units currently under construction and the large number of excess vacant units should be more than sufficient to meet the demand for new units in the Remainder submarket for the next 3 years. In addition, a portion of the estimated 34,000 other vacant units will likely come back on the market and satisfy some of the forecast de-mand. The construction of additional units will only contribute to prolong-ing soft market conditions. Average effective rents for all apartment units in the submarket are currently estimated to be $700 for a one-bedroom unit, $880 for a two-bedroom unit, and $1,050 for a three-bedroom unit.
Notes: Includes all multifamily units in structures with two or more units. Includes data through October 2009.
Source: U.S. Census Bureau, Building Permits Survey
Figure 17. Multifamily Building Permits Issued in the Remainder Submarket, 1990 to 2009
2000
2001
2002
2003
2004
2005
2006
1992
1993
1994
1995
1996
1997
1998
1999
1991
1990
5,000
4,500
4,000
3,500
3,000
2,500
2,000
1,500
1,000
500
0
2007
2008
2009
NA = Data not available.
Notes: Employment data represent annual averages for 1990, 2000, and the 12 months through October 2009.
Sources: Estimates by analyst; U.S. Census Bureau; U.S. Department of Housing and Urban Development
Table DP–1. Houston HMA Data Profile, 1990 to Current
Average Annual Change (%)
1990 2000 Current 1990 to 2000 2000 to Current
Total Resident Employment 1,926,731 2,283,609 2,616,848 1.7 1.6