A Work Project, presented as part of the requirements for the Award of a Masters Degree in Management from the NOVA – School of Business and Economics. “Comprehensive Income: Evidence from Portuguese Listed Companies on Reporting Choices and Value Relevance” Filipa Bernardino Nunes Pereira, No. 1912 Project carried out on the Financial Statement Analysis course, under the supervision of: Professor Leonor Ferreira June 2015
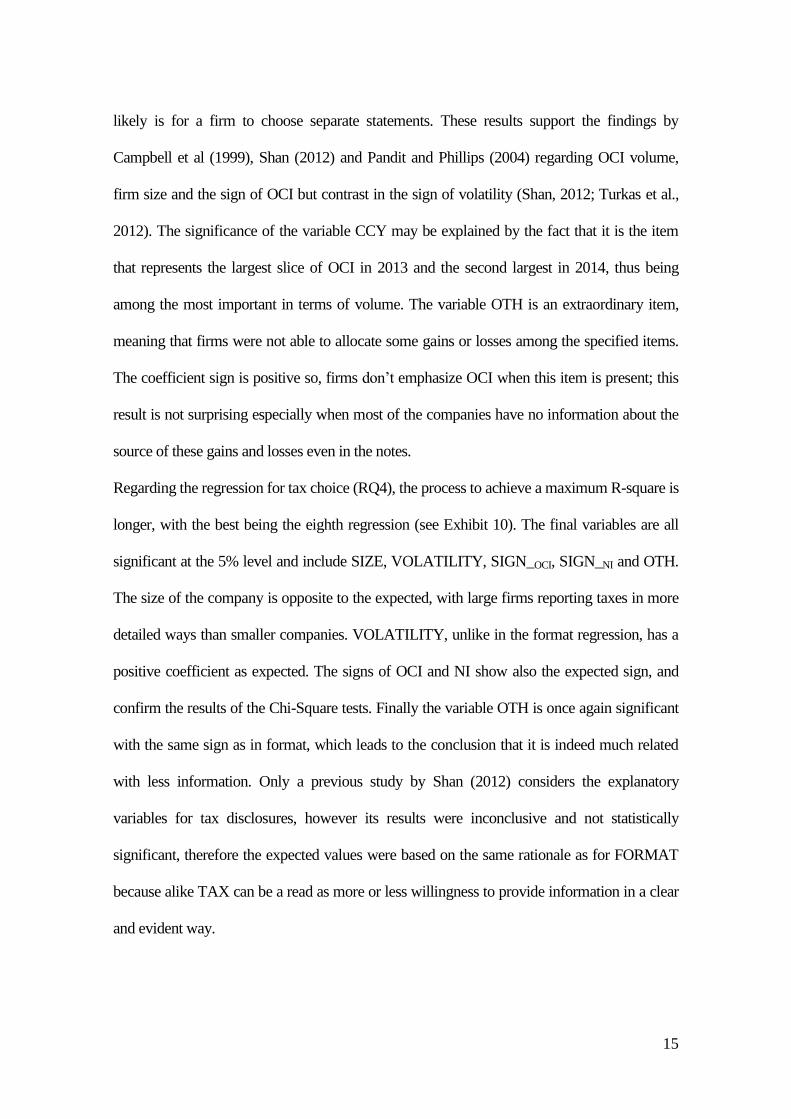
Transcript
A Work Project, presented as part of the requirements for the Award of a Masters Degree in
Management from the NOVA – School of Business and Economics.
“Comprehensive Income: Evidence from Portuguese
Listed Companies on Reporting Choices and Value
Relevance”
Filipa Bernardino Nunes Pereira, No. 1912
Project carried out on the Financial Statement Analysis course, under the supervision of:
Professor Leonor Ferreira
June 2015
1
ABSTRACT
This work project aims at analysing choices related to Comprehensive income (CI) of
Portuguese listed firms and understanding the reasons behind them. Additionally, it studies
the relevance of CI versus Net Income (NI). It was found that firm’s size and volume of Other
comprehensive income (OCI) are positively related with the choice for separate statements
while smaller firms with positive NI and negative OCI tend to disclose less information about
taxes. The value relevance of CI proved to be superior to that of NI but OCI seems to have no
Comprehensive income (CI) comprises all income and expense incurred by a company over a
period of time, including realized and non-realized items. According to IAS 1 – Presentation
of Financial Statements, it should be recognized, measured and presented in a financial
statement. However, companies are free to choose how to present CI, which can either be as
one single statement of profit and loss and other comprehensive income or, as two separate
statements, one of profit and loss and the one of comprehensive income [IAS 1.811]. This work
project aims at understanding how and why Portuguese listed firms report CI according to
IAS2 /IFRS
3 and how important CI is in this market.
This research contributes to the existing literature for standard setters and academics by
providing insight into the choices of Portuguese listed companies when reporting
comprehensive income and tracking the explanatory variables for financial presentation and
disclosure of this item. Furthermore is also provides an understanding of another reporting
1 EC staff consolidated version as of 18 February 2011.
2 International Accounting Standards (IAS) as issued by the International Accounting Standards
Committee (IASC). 3 International Financial Reporting Standards (IFRS) as issued by the International Accounting Standards
Board (IASB).
2
choice that regards tax disclosure. Additionally the value relevance of CI, Net Income (NI)
and Other Comprehensive Income (OCI) are also studied.
This paper proceeds as follows. Section 2 provides a background on the concept and the
regulation of comprehensive income. Section 3 reviews the literature about comprehensive
income, namely empirical studies. Section 4 describes the research questions, methodology
and data used to answer them. Section 5 presents the results and its analysis. Finally, Section 6
concludes with a summary of the main results, limitations and suggestions for future research.
2. Conceptual and Regulatory Framework
“Comprehensive income is the change in equity during a period resulting from
transactions and other events, other than those changes resulting from transactions with
owners in their capacity as owners”, as follows:
[1]
Where BV stands for book value of equity, Div is payment of dividends and N is equity
issued.
From a different perspective “Comprehensive income comprises all components of profit or
loss and of other comprehensive income”:
[2]
OCI includes all the items of income and expense that are not recognized in profit and loss,
such as – unrealized gains and losses, expected but not yet obtained and NI is the net balance
of earned revenues and gains and costs and losses that were incurred during the reporting
period. When an amount that has been previously classified as OCI is realized it needs to be
reclassified as profit or loss, there is then the need to adjust OCI in order not to double count
the gain (or loss).
EC regulation (No 1606/2002) has established that companies with listed shares in any EU
stock market must adopt the International Accounting Standards/ International Financial
3
Reporting Standards (IAS /IFRS) for the year 2005 onwards. This allows better comparison
between all European firms that are publicly traded. According to IAS 14 firms are required to
present Comprehensive Income for the reporting period, however “Statement of
Comprehensive Income” [IAS 1.81-1.105] includes one option, and companies are free to
choose reporting CI either in: (i) one single statement of profit and loss and other
comprehensive income; or (ii) two separate statements, one of profit and loss and
another of comprehensive income, the latter shall start with the value of net income. The
components of OCI must be classified by nature, and includes the items described in Table 1:
Table 1 – Composition of OCI
Nature of Other Comprehensive Income Reference
Changes in revaluation surplus of Property, Plant and Equipment as well as of intangible
assets
IAS 16/
IAS 38
Actuarial gains and losses of net defined benefit plans IAS 19
Exchange differences from translating functional into presentation currency IAS 21
Gains and losses on re-measuring available-for-sale financial assets IAS 39
The effective portion of gains and losses on hedging instruments in a cash flow hedge IAS 39
Gains and losses on re-measuring an investment in equity instruments where the entity has
elected to present them in other comprehensive income
IFRS 9
The requirement to present OCI is part of the amendment to IAS 1 in September 2007. It is
worth mentioning though that in this matter IAS/ IFRS differs from the US regulation, where
the Financial Accounting Standards Board (FASB) has firstly publicized Statement Nr. 130 in
1997. This means that publicly traded companies reporting in the USA have been presenting
CI for ten years more than European ones5.
In 20116 the IASB proposed several amendments to IAS 1 which included two relevant
chances regarding the comprehensive income reporting7. One proposal suggested entities to
present a unique statement of profit or loss and other comprehensive income with two
4 International Accounting Standard 1 – Presentation of Financial Statements.
5 Under the initial FAS 130 there was a third option to present CI, as part of the statement of
stockholders’ equity, in a column titled “Accumulated OCI," which totals all OCI amounts recorded. 6 In the same year FASB issued the Accounting Standards Update (ASU) 2011-05 with the reasoning that
it would enhance visibility of OCI as well as allow converging US GAAP with IFRS. Concerning the
presentation of CI, ASU 2011-05 reduced the options, to the same two options as in IFRS 7 Based on the Exposure Draft of May 2010 (ED/2010/05)
4
sections, namely profit (or loss) of the year and items of other comprehensive income.
Another proposal suggested entities to present separately items of other comprehensive
income (OCI) that will be reclassified to profit or loss (that is, recycled) in subsequent periods
upon derecognizing separately from items of OCI that will not be reclassified to profit or loss.
IASB believes that the proposal which sets the presentation under the same statement all non-
owner changes in equity enhances a better comparability, transparency and understandability
of CI of a company or group of companies8.
Comparability as the presentation option currently possible under IAS 1 would be
eliminated;
Understandability as a consequence of a clear distinction would be made between
profit or loss and OCI, thus preserving the importance of NI but simultaneously
highlighting the importance of all gains or losses;
Transparency of OCI items, thus highlighting to users the items in OCI that will never
be recycled into profit or loss.
Of the two proposals mentioned only the latter was accepted as part of the 2011
amendment to IAS 1 and it became effective for periods of reporting starting after 2012.
Its purpose is to facilitate the reclassification of items to NI and the necessary
adjustments that must be done to OCI. The proposal of limiting the presentation of CI to
a single statement was not approved, and thus companies are free to choose how to
report CI concerning the formats of presentation.
Choices made by companies are being explained by the managers as attempts to give more or
less relevance to OCI according to their preferences and as such there is still room to improve
regulation. Nevertheless consensus about which is the best reporting method has not yet been
reached. while some authors defend that two statements do not give enough visibility to CI
and may confuse the users (Solomon and Dragomirescu, 2009), others claim that separating
8 OCIFAQ.
5
realized from unrealized income is useful and avoids clouding NI with volatile items (Ferraro,
2011), and is easier for readers to analyze. Thus it is particularly interesting to explore CI and
OCI because the topic is still open, even among standard setters who recently proposed to
change the regulation.
3. Literature Review
Several empirical studies have been carried out over the topic but being CI a new concept,
and the regulation also relatively recent, the empirical research about CI dates back to no
earlier than 1997 in the US and 2005 in Europe. One stream of research about CI explores the
choice of format for the statement of CI and the reasons behind it (Exhibit 2). More recently,
research has focused on the value relevance and predictability of CI (Exhibit 3).
Studies about choice of format for statement of CI
The first studies were conducted in the US ever since 1999, as before 1997 there was no
legislation on CI. all conclude that the preferred choice by far was the statement of owner’s
equity, that is, the triple statement, as shown in several studies, such as Campbell et al. (1999)
and Pandit and Phillips’ (2004). Either reporting CI under a single or two statements were
rarely used in the US until the later revision of FAS 130 in 2011 that revoked the third option.
In Europe, and more recently in the US, studies were also carried out on when the firms have
only the two current alternatives. The results also demonstrated a clear preference but this
time for two statements over one single statement.
In Italy, Ferraro (2011) demonstrates that in the year 2011 among Italian companies only 14%
report OCI in the income statement, while 86% chose to report it in a separate statement. A
similar conclusion was found in a comparative research based in 2013 financial reports of a
sample of 600 companies listed in the French, German and Italian markets, with over 85% of
the companies reporting the CI in two separate statements, consistently for each of the
6
countries. As for Portugal, results also align with this conclusion, with 27 companies listed in
the Euronext Lisbon presented in their 2012 financial reports 79% of companies choosing to
report in CI in two separate statements (Amorim, 2014).
Accordingly the preference is for the reporting under the separated format, however, the
motivation behind this choice is unclear. The minority of companies reporting CI under one
single statement are companies with either no OCI or positive amounts of OCI (Ferraro,
2011; Amorim, 2014). This fact is very interesting because provided that reporting under one
statement is the alternative that provides more visibility to OCI and CI, while reporting in the
shareholder’s equity is the method that leads to less visibility (Turktas et al., 2013; Shan,
2012). It is possible to understand why the topic has been and still is under discussion: it is
important that firms report in the most transparent way possible and the IAS/ IFRS are meant
to be straightforward standards ideally with no margin to different interpretations.
Volatility, absolute value and sign of OCI have been previously been proven to be related to
the choice of reporting (Georgakopoulos et al., 2012; Shan, (2012); Ferraro, 2011; Campbell
et al., 1999; Pandit et al., 2004).
Studies about value relevance and predictive power of CI
A more recent stream of research about CI are studies on the value relevance9 and predictive
power10
of CI. This literature is not completely consistent. Most of the studies conclude that
CI is indeed value relevant (Biddle and Choia, 2006; Jones and Smith, 2011; Inchausti and
Pérez, 2011), however some of them found CI to be less value relevant than NI (Lin et al.
2007; Zülch and Pronobis, 2010, Mechelli, 2014). Research about the predictive power of CI
also shows not consistent results, with some finding that OCI has low predictive power (Jones
and Smith, 2011; Lin et al. 2007), and others finding that CI also has low predictive power
9 How much of the stock price/return is explained by CI versus NI – also referred to as price relevance.
10 How well are future earnings explained by CI versus NI.
7
(Choi and Zang, 2006). However, it has also been found that CI predicts NI better than NI
predicts itself (Biddle and Choia, 2006).
From the previous literature about CI, it is concluded that findings on the matter are still
scattered and somehow inconclusive. Regarding the Portuguese market, Amorim (2014)
carried a descriptive study about CI, hence included in the first stream of research. She
analyzes the formats adopted by Portuguese listed firms in the reporting year 2012 as well as
the main components, size and signal of OCI. Thus this work project adds to the literature by
studying two additional periods of reporting, the ones after the latest amendments, and also
the explanatory variables of the choice of CI format and tax disclosures in the CI statement.
Additionally, this research discusses the value relevance of CI.
4. Methodology and Data
This research has a two-folded motivation behind. Firstly it explores the reporting of
comprehensive income by Portuguese listed firms. to continue the exploratory study initiated
by Amorim (2014). Four research questions are developed about CI reporting choices, and
their causes. Two concerning the format of the statement and the other about tax reporting.
RQ1: Is the format reporting choice dependent on particular variables?
RQ2: Is the tax reporting choice dependent on particular variables?
RQ3: Which are the explanatory variables of the format reporting choice of CI in
Portuguese listed firms?
RQ4: Which are the explanatory variables of the tax reporting choice of CI in
Portuguese listed firms?
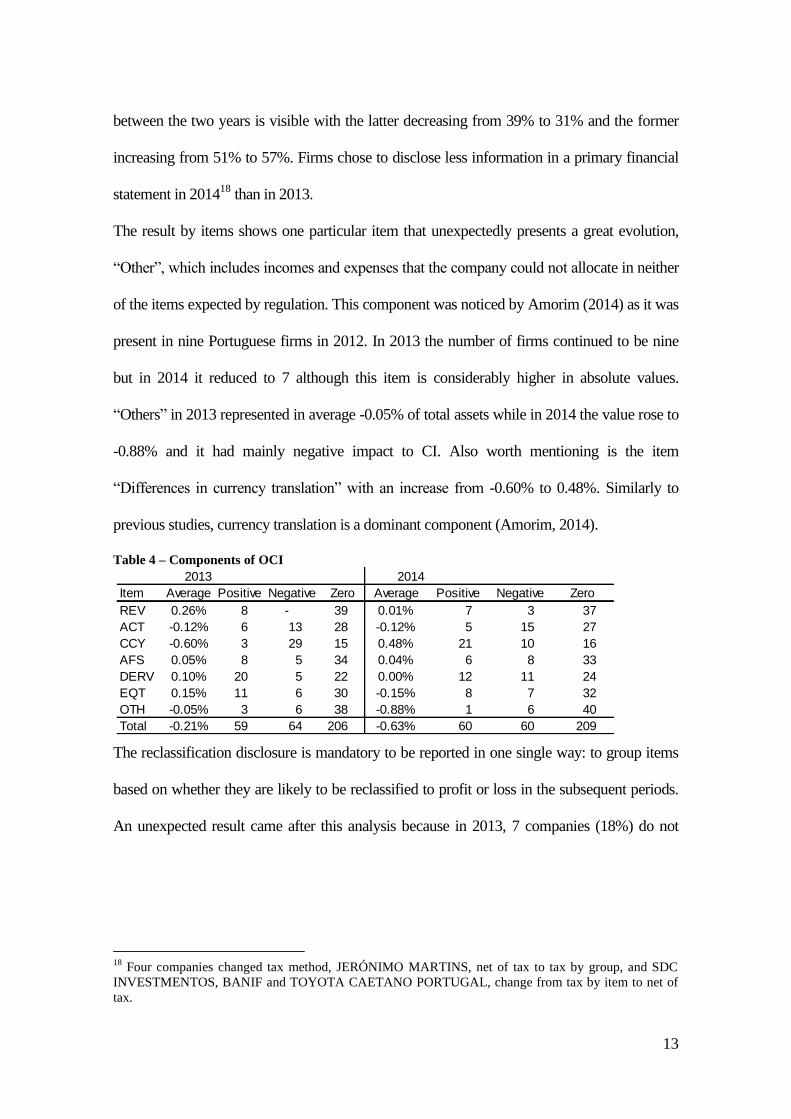
The variables include firm size, CI characteristics such as, volatility, absolute value and sign
of OCI, sign of NI; all items that compose OCI as detailed in section 2 (Table 1) such as
exchange differences or revaluation surplus and, an additional component, “Others”, for when
firms do not allocate the gains and losses to a specific nature of OCI. Prior studies suggest that
these variables are explanatory variables of the choice of format (Shan, 2012; Ferraro, 2011).
8
The second part follows the most recent literature and aims at providing insight on the value
relevance of CI in Portuguese listed companies11
. The importance of understanding revelance
of CI is based on the fact that it may provide standard setters with a final decision on the
reporting method. As said in Section 3 there are advantages and disadvantages of both report
choices, for example, the single statement does not give NI the visibility it had before. If the
results of this study prove CI as not being the good performance measure expected, than it is
plausible to say that NI should have more visibility. The following research question is
answered in other to access the value relevance of CI:
RQ5: Are CI and OCI value-relevant among Portuguese listed firms?
Methodology
Chi-square tests are run to determine dependency or independency between variables, for the
choice of format (RQ1) and choice of tax method (RQ2). These tests include the relevant
dependent variable (FORMAT, TAX) and each independent variable as detailed in Table 2:
Table 2 – Description of Variables
Variable Proxies
FORMAT 1 if firm chooses separated statements, 0 otherwise.
TAX 1 if firm chooses to report net of taxes, 0 otherwise.
SIZE Natural logarithm of total assets (TA).
VOLATILITY* Absolute value of the difference between OCIt and OCIt-1.
VOLUME* Absolute value of OCI.
SIGN_OCI 1 if OCI is negative, 0 otherwise.
SIGN_NI 1 if NI is negative, 0 otherwise.
ITEMi, with i = 1, …, 7:
1. REV* Changes in revaluation surplus.
2. ACT* Actuarial gains and losses on benefit plans.
3. CCY* Exchange differences from translating functional currencies into presentation
currency.
4. AFS* Gains and losses on re-measuring available-for-sale financial assets.
5. DERV* Effective portion of gains and losses on hedging instruments in a cash flow hedge.
6. EQT* Gains and losses on re-measuring an investment in equity instruments where the
entity has elected to present them in other comprehensive income.
7. OTH* Items allocated as “Other gains and losses”.
*Values scaled by TA
11
Portuguese data has been previously used in a similar manner by Mechelli and Cimini (2014), but aggregated with 14
other European countries and therefore no conclusions can be made for the Portuguese market itself.
9
Later T-tests are used to compare the means of firms that chose one method or the other;
again parallel tests are developed for format choice (RQ3) and tax choice (RQ4). Finally the
following two regression models are used, one for format choice and the other for tax choice.
[3]
[4]
Note that because the number of companies in Portugal is considerably small it is not possible
to add all the variables, as such, the stepwise regression method is used manually with
backward elimination which consists on adding all the variables and in each step exclude the
less significant up to the point where the adjusted R2 is maximum.
It is expected that format choice to be positively related with size, volatility and volume with
less evident. Regarding the signs of OCI and NI previous studies suggest that firms presenting
positive OCI and negative NI choose to report the most evident way. The same reasoning is
used for tax choice although there is a lack of previous studies.
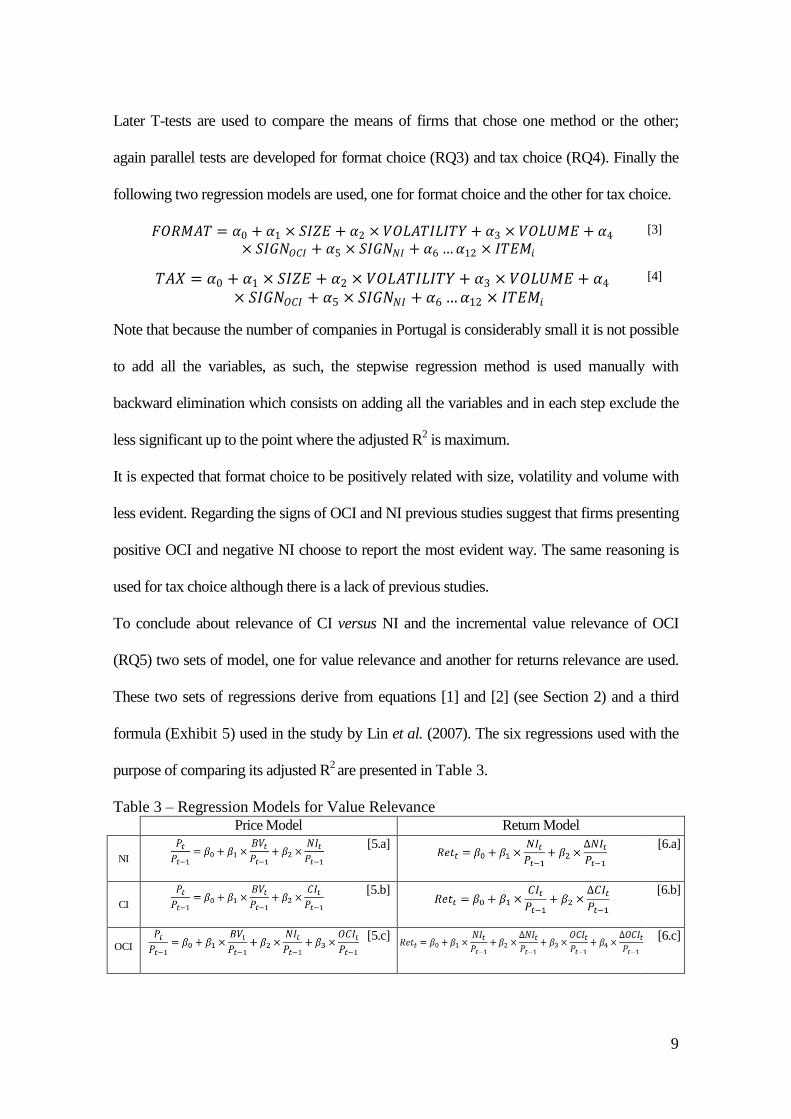
To conclude about relevance of CI versus NI and the incremental value relevance of OCI
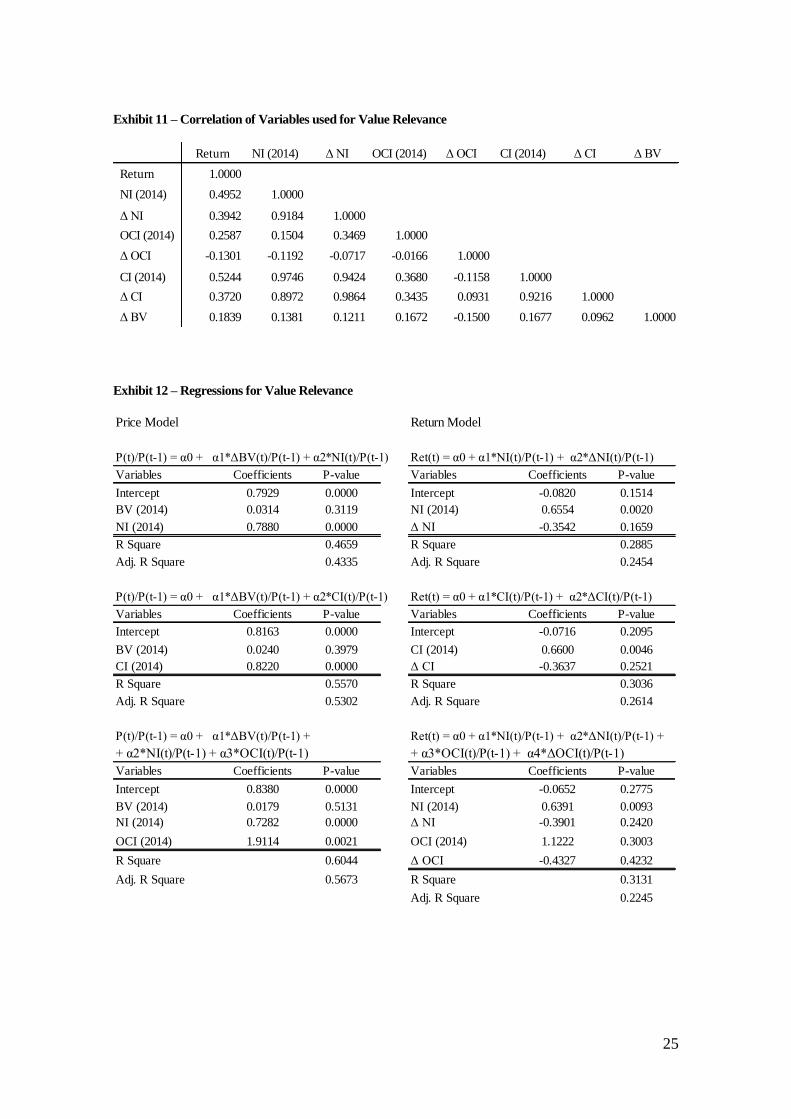
(RQ5) two sets of model, one for value relevance and another for returns relevance are used.
These two sets of regressions derive from equations [1] and [2] (see Section 2) and a third
formula (Exhibit 5) used in the study by Lin et al. (2007). The six regressions used with the
purpose of comparing its adjusted R2 are presented in Table 3.
Table 3 – Regression Models for Value Relevance Price Model Return Model