Page 1
U.P.B. Sci. Bull., Series B, Vol. 80, Iss., 1, 2018 ISSN 1454-2331
CONCEPTUAL DESIGN OF PROPYLENE PRODUCTION BY
METATHESIS OF 2-BUTENE
Andrei Maxim ANDREI1, Costin Sorin BÎLDEA2
As the demand for propylene is increasing, viable solutions for conversion of
low-value raw materials to high-value olefins are of interest. This article
investigates the economic feasibility of a process for propylene production by
metathesis of 2-butene (a by-product of fluid catalytic cracking). Process synthesis
by hierarchical approach is applied for several process alternatives, with the goal of
determining the best economical process flowsheet which returns the highest
revenue for a fixed flow rate of raw material.
Keywords: olefin metathesis, conceptual design, hierarchical approach, economic
analysis
1. Introduction
The demand of olefins, especially propylene, increased in the chemical
and petrochemical industries for applications such as polypropylene, acrylonitrile,
cumene, propylene oxide and other valuable products. Alternative technologies
for production of propylene have been applied such as propane dehydrogenation,
olefin metathesis, methanol to propylene, and cracking low-value olefins [1].
Currently the largest producers of propylene are fluid catalytic cracking units
(FCCU) and naphtha steam cracking units. Although extensive research is being
done for increasing the propylene yield in these units, alternative technologies
should be considered for on-purpose propylene production.
In this article, the process synthesis by hierarchical approach of 2-butene
olefin metathesis for propylene production will be considered, with the goal of
identifying the most cost-effective process alternative from several different
flowsheets. The metathesis reaction of 2-butene is carried out in the presence of
tungsten oxide catalyst which converts the butenes to valuable olefin products
ranging from C2 to C6, particularly propylene. The low-cost feedstock for olefin
metathesis is a by-product of fluid catalytic cracking unit (FCC), containing 70
mole % 2-butene (reactant, denoted by A) and 30 mole % n-butane (inert, denoted
by I), which is typically used in the liquified petroleum gas (LPG) pool. A fixed
feed flow rate of 5.7 t/h was considered for all process alternatives evaluated.
1 PhD student, Department of Chemical and Biochemical Engineering, University POLITEHNICA
of Bucharest, Romania, e-mail: [email protected] 2 Professor, Department of Chemical and Biochemical Engineering, University POLITEHNICA of
Bucharest, Romania, e-mail: [email protected]
Page 2
48 Andrei Maxim Andrei, Costin Sorin Bîldea
Firstly, the stoichiometry and kinetics of the reaction system is presented.
Then, the economic analysis is applied for the process synthesis by hierarchical
approach [2, 3], using Aspen Plus as efficient computer-aided design tool.
Sensitivity studies were performed, at several decision levels and for different unit
configurations, to reveal the best process flowsheet solution which has the highest
economic potential for the given feed flow rate.
2. Reaction system
The metathesis reactions of 2-butene can be performed in the presence of
tungsten oxide mesoporous silica catalyst [1]. The reactions take place in gas
phase and are slightly endothermic. The reaction mechanism includes three
reversible reactions (isomerization, cross-metathesis and self-metathesis) and one
irreversible reaction (cracking) in which propylene is produced via two main
alternatives routes: cross metathesis of 1-butene and 2-butene and cracking of 2-
butene. In the following, the components will be referred as: A (2-butene), B (1-
butene), C (propylene), D (2-pentene), E (ethylene), and F (3-hexene). The
stoichiometry of metathesis process is well described by the following reactions:
1
1
k
kA B
(1)
2
2
k
kA B C D
(2)
3
3
2k
kB E F
(3)
42 2k
A E C (4)
The kinetic model was developed [1] based on the following assumptions:
a) isomerization, cross-metathesis and self-metathesis are reversible, while
cracking is irreversible
b) The pentene isomers are considered as 2-pentene (D), and the hexene
isomers as 3-hentene (F)
c) All paraffin, isobutene and aromatic products are negligible
d) Contribution of secondary metathesis in propylene production is negligible
e) No oligomerization reactions are considered
The reaction rates are described by the following expressions [1]:
1 1
,1
1( )A B
eq
r k C CK
(5)
2 2
,2
1( )A B C D
eq
r k C C C CK
(6)
Page 3
Conceptual design of propylene production by metathesis of 2-butene 49
2
3 3
,3
1( )B E F
eq
r k C C CK
(7)
4 4 E Cr k C C (8)
where: ri = reaction rate, kmol/m3/s
ki = k0,i∙exp(-Ea,i/R/T) - rate constants, m3/kmol/s
Keq,i = exp(Ai + Bi/T) – equilibrium constants at various temperatures T
CA, CB, CC, CD, CE, CF = molar concentrations of components, kmol/m3
The kinetic parameters k0,i and Ea,i presented in Table 1 were numerically
determined by fitting the experimental data of 2-butene metathesis obtained from
reference [1] to the model of an isothermal plug-flow reactor, as shown in Fig 1.
The expressions for Keq,i were taken from the same reference [1]. Table 1
Estimated kinetic parameters
Reaction Pre-exponential
factor
k0 / [m3/kmol/s]
Activation
energy
Ea / [kJ/kmol]
A B / [K] Heat of
reaction /
[kJ/mol]
1: Isomerization 0.0287 25.12821 4.662791 -1154.68 6.87
2: Cross-metathesis 6.802 102.0203 5.480296 -144.335 -0.54
3: Self-metathesis 3.815 187.0776 9.544931 -3139.28 2.47
4: Cracking 0.123 84.56967 - - 53.61
0
10
20
30
40
50
60
70
80
90
100
7 9 11 13 15 17 19 21 23 25
Co
nvers
ion
, /[%
]
Residence time, /[s]
550 C
450 C
350 C
Fig. 1. Conversion of 2-butene vs. residence time, at different values of the reaction temperature:
markers - experimental data [1]; lines – calculated values.
3. Process analysis by hierarchical approach
In conceptual design, one of the most important aspects is hierarchical pre-
screening the most promising solutions from a bulk of process alternatives. A rule
of thumb in process design says that it is favorable to recover more than 99% of
all valuable materials [2,3]. Thus, unit structures US1 include the recycle of un-
reacted raw material but differ in the way the inert is removed. Analysis of the
structure US1a showed that high purge fraction lead to higher revenues. For this
Page 4
50 Andrei Maxim Andrei, Costin Sorin Bîldea
reason, process alternatives US2 without recycle were also investigated. In the
following figures, the stream denoted as PRODUCTS consists of valuable
components that can be sold: ethylene, propylene, pentene, hexene; the stream
denoted as INERT consists mainly of n-butane. The stream PURGE contains a
mixture of butenes and n-butane; the stream BY-PRODUCTS represents a C4
fraction containing butenes without or with inert (Fig. 5 and Fig. 6, respectively).
Flowsheets with recycle (US1)
i. US1a: Typical Reactor – Separation - Recycle structure. The inert is removed
from the system by means a purge (Fig. 2).
Fig. 2. US1a: Reactor – Separation – Recycle (A+B+I), with purge.
ii. US1b: Reactor – Separation - Recycle structure which uses an additional
separation unit to remove the inert from the system (Fig. 3).
Fig. 3. US1b: Reactor – Separation – Recycle (A+B). The inert (I) is separated and removed
downstream of reactor
iii. US1c: Reactor – Separation - Recycle structure where the inert is removed
before entering the plant (Fig. 4). In this way, both inert accumulation and
recycle are avoided.
Page 5
Conceptual design of propylene production by metathesis of 2-butene 51
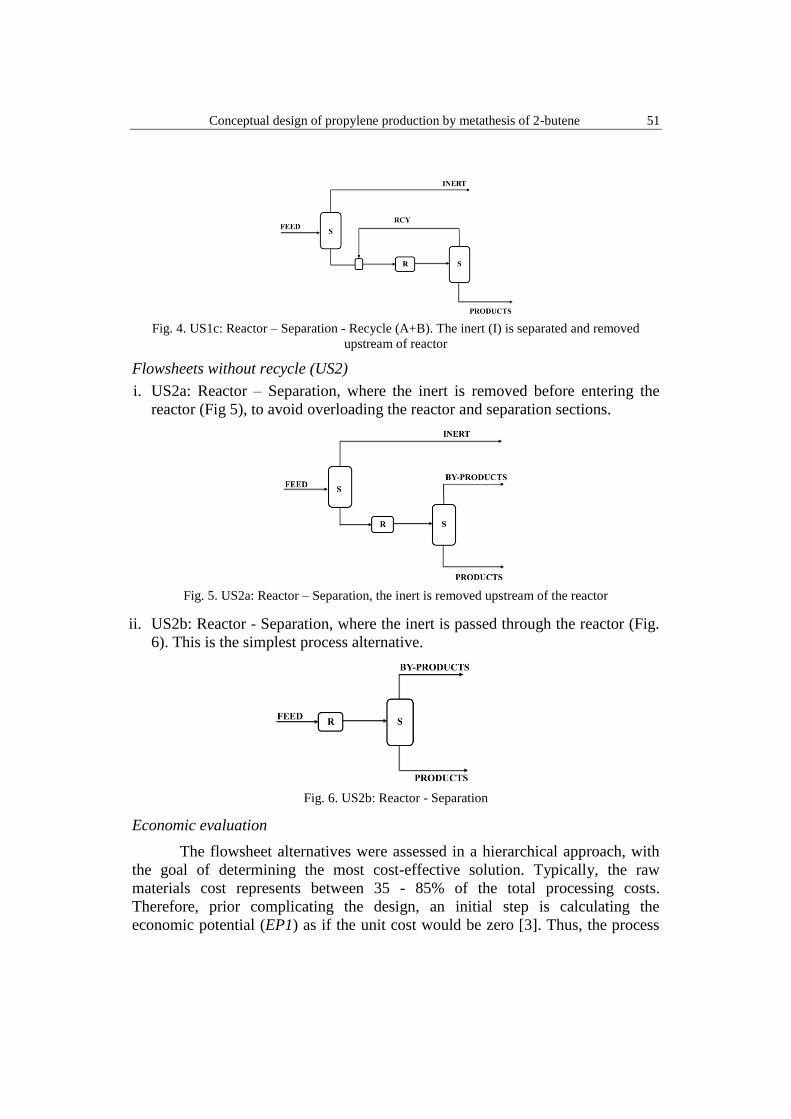
Fig. 4. US1c: Reactor – Separation - Recycle (A+B). The inert (I) is separated and removed
upstream of reactor
Flowsheets without recycle (US2)
i. US2a: Reactor – Separation, where the inert is removed before entering the
reactor (Fig 5), to avoid overloading the reactor and separation sections.
Fig. 5. US2a: Reactor – Separation, the inert is removed upstream of the reactor
ii. US2b: Reactor - Separation, where the inert is passed through the reactor (Fig.
6). This is the simplest process alternative.
Fig. 6. US2b: Reactor - Separation
Economic evaluation
The flowsheet alternatives were assessed in a hierarchical approach, with
the goal of determining the most cost-effective solution. Typically, the raw
materials cost represents between 35 - 85% of the total processing costs.
Therefore, prior complicating the design, an initial step is calculating the
economic potential (EP1) as if the unit cost would be zero [3]. Thus, the process
Page 6
52 Andrei Maxim Andrei, Costin Sorin Bîldea
alternatives were evaluated from an Input / Output point of view, being
considered black boxes, and taking into account only the cost of raw materials and
the value of products and by-products.
EP1= {value of products} – {cost of raw materials}
The feed, containing 2-butene (A) and n-butane (I), is usually sent to the
LPG pool and has a cost of 388.8 $ / ton. The same value is assigned to the C4
mix purged (containing 2-butene, 1-butene, n-butene), as it can be sent to the
same LPG pool. Table 2 also lists the prices considered in this study for products
(C, D, E, F) and for the high purity n-butane (I). Table 2
Prices of raw material and products (99% purity)
Component Feed C4 mix C D E F I
Prices / [$/tonne] 388.8 388.8 648 486 540 486 452
At the second level, more details are added to the analysis by including the
reactor and the catalyst costs and determining the new economic potential (EP2).
The balance between reactor size and recycle flowrate which ensures the optimum
economic potential is established by analyzing Reactor – Separation - Recycle
configurations, where the separation is considered as a “black-box” and the
reactor model incorporates the reaction kinetics [4].
EP2 = {value of products} – {cost of raw materials} – {reactor cost} – {catalyst
cost}
The capital cost estimation used in the article correspond to the simplified
version of Guthrie’s correlations [5] with the value for Marshall and Swift Index
M&S = 1536.5 corresponding to year 2011. A typical payback time of 3 years is
considered with plant operation of 8000 hours/year. The catalyst price considered
is 20 $/kg and the equation cost for reactor mentioned below is applicable for any
pressure vessels (e.g. reflux vessels, columns, separators): 1.066 0.82($) ( & / 280) (957.9 ) (2.18 )cInstalled Cost M S D H F (9)
with both D diameter and H height expressed in meters. The factor Fc takes into
account the material (Fm) and the operating pressure (Fp). 21 0.0074 ( 3.48) 0.00023 ( 3.48)pF P P (10)
with P in bar. The material factor Fm can be determined from Table 3. Table 3
Material factor for different types of material
Shell material Carbon steel Stainless steel Monel Titanium
Fm clad 1.00 2.25 3.89 4.25
Fm solid 1.00 3.67 6.34 7.89
Page 7
Conceptual design of propylene production by metathesis of 2-butene 53
The reactor diameter was determined considering a maximum pressure
drop of 0.005 bar / m. Further, the reactor length was varied for establishing the
optimum conversion with the highest benefit.
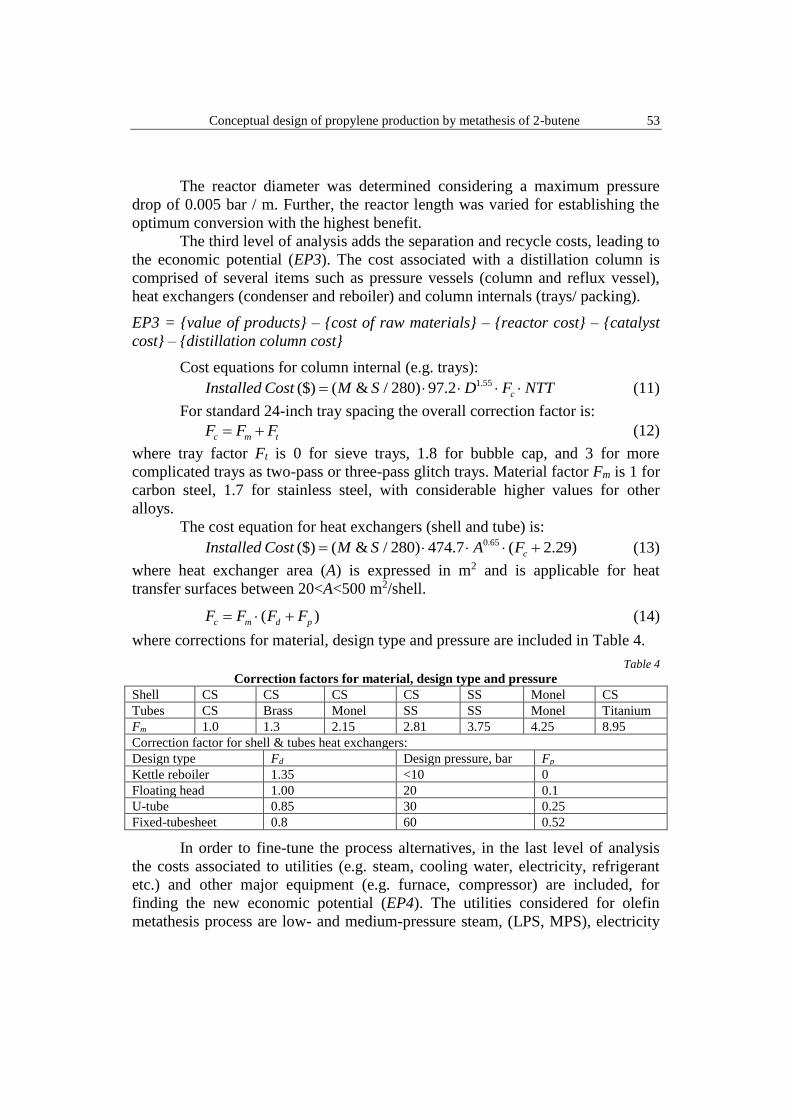
The third level of analysis adds the separation and recycle costs, leading to
the economic potential (EP3). The cost associated with a distillation column is
comprised of several items such as pressure vessels (column and reflux vessel),
heat exchangers (condenser and reboiler) and column internals (trays/ packing).
EP3 = {value of products} – {cost of raw materials} – {reactor cost} – {catalyst
cost} – {distillation column cost}
Cost equations for column internal (e.g. trays): 1.55($) ( & / 280) 97.2 cInstalled Cost M S D F NTT (11)
For standard 24-inch tray spacing the overall correction factor is:
c m tF F F (12)
where tray factor Ft is 0 for sieve trays, 1.8 for bubble cap, and 3 for more
complicated trays as two-pass or three-pass glitch trays. Material factor Fm is 1 for
carbon steel, 1.7 for stainless steel, with considerable higher values for other
alloys.
The cost equation for heat exchangers (shell and tube) is: 0.65($) ( & / 280) 474.7 ( 2.29)cInstalled Cost M S A F (13)
where heat exchanger area (A) is expressed in m2 and is applicable for heat
transfer surfaces between 20<A<500 m2/shell.
( )c m d pF F F F (14)
where corrections for material, design type and pressure are included in Table 4.
Table 4
Correction factors for material, design type and pressure
Shell CS CS CS CS SS Monel CS
Tubes CS Brass Monel SS SS Monel Titanium
Fm 1.0 1.3 2.15 2.81 3.75 4.25 8.95
Correction factor for shell & tubes heat exchangers:
Design type Fd Design pressure, bar Fp
Kettle reboiler 1.35 <10 0
Floating head 1.00 20 0.1
U-tube 0.85 30 0.25
Fixed-tubesheet 0.8 60 0.52
In order to fine-tune the process alternatives, in the last level of analysis
the costs associated to utilities (e.g. steam, cooling water, electricity, refrigerant
etc.) and other major equipment (e.g. furnace, compressor) are included, for
finding the new economic potential (EP4). The utilities considered for olefin
metathesis process are low- and medium-pressure steam, (LPS, MPS), electricity
Page 8
54 Andrei Maxim Andrei, Costin Sorin Bîldea
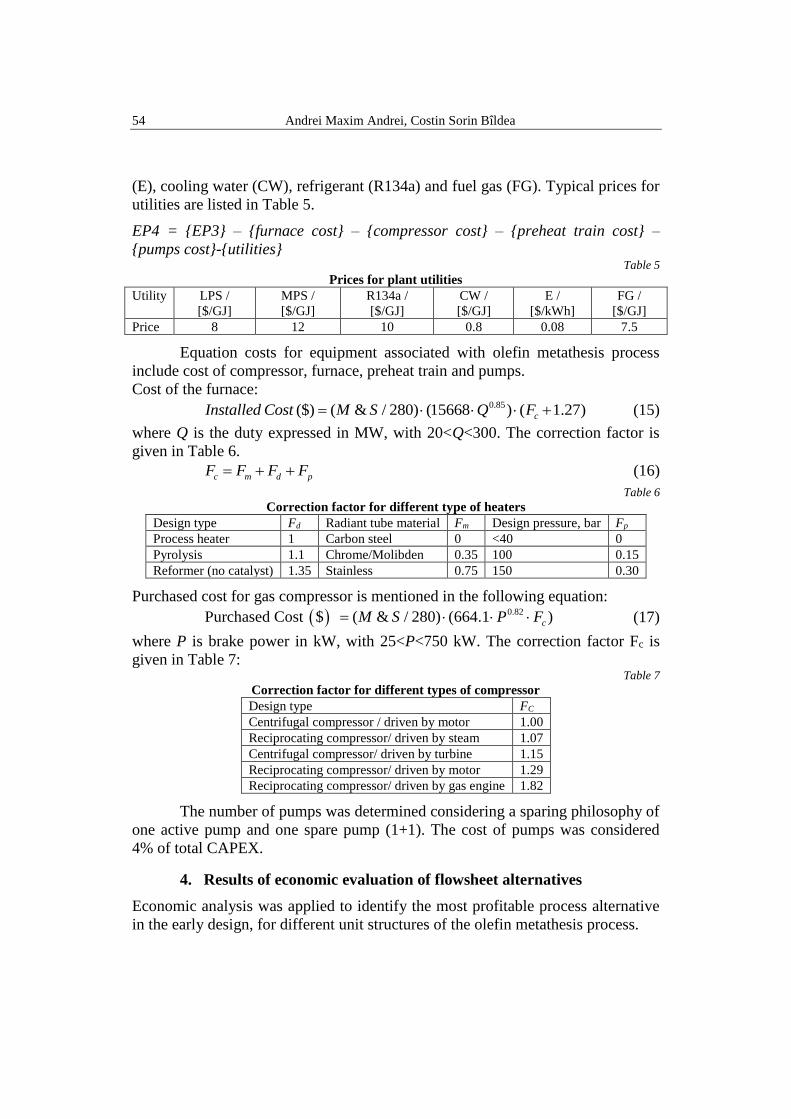
(E), cooling water (CW), refrigerant (R134a) and fuel gas (FG). Typical prices for
utilities are listed in Table 5.
EP4 = {EP3} – {furnace cost} – {compressor cost} – {preheat train cost} –
{pumps cost}-{utilities} Table 5
Prices for plant utilities
Utility LPS /
[$/GJ]
MPS /
[$/GJ]
R134a /
[$/GJ]
CW /
[$/GJ]
E /
[$/kWh]
FG /
[$/GJ]
Price 8 12 10 0.8 0.08 7.5
Equation costs for equipment associated with olefin metathesis process
include cost of compressor, furnace, preheat train and pumps.
Cost of the furnace: 0.85($) ( & / 280) (15668 ) ( 1.27)cInstalled Cost M S Q F (15)
where Q is the duty expressed in MW, with 20<Q<300. The correction factor is
given in Table 6.
c m d pF F F F (16)
Table 6
Correction factor for different type of heaters
Design type Fd Radiant tube material Fm Design pressure, bar Fp
Process heater 1 Carbon steel 0 <40 0
Pyrolysis 1.1 Chrome/Molibden 0.35 100 0.15
Reformer (no catalyst) 1.35 Stainless 0.75 150 0.30
Purchased cost for gas compressor is mentioned in the following equation:
0.82Purchased Cost $ ( & / 280) (664.1 )cM S P F (17)
where P is brake power in kW, with 25<P<750 kW. The correction factor Fc is
given in Table 7: Table 7
Correction factor for different types of compressor
Design type FC
Centrifugal compressor / driven by motor 1.00
Reciprocating compressor/ driven by steam 1.07
Centrifugal compressor/ driven by turbine 1.15
Reciprocating compressor/ driven by motor 1.29
Reciprocating compressor/ driven by gas engine 1.82
The number of pumps was determined considering a sparing philosophy of
one active pump and one spare pump (1+1). The cost of pumps was considered
4% of total CAPEX.
4. Results of economic evaluation of flowsheet alternatives
Economic analysis was applied to identify the most profitable process alternative
in the early design, for different unit structures of the olefin metathesis process.
Page 9
Conceptual design of propylene production by metathesis of 2-butene 55
Flowsheets with recycle
US1a: Typical Reactor – Separation - Recycle (A + B + I)
Sensitivity cases were performed for a fixed reactor temperature of 550°C
and a pressure 1 bar with a constant reactor diameter of 3 meters. A variable purge
fraction, denoted as P, was introduced to establish the optimum design with
respect to economic potential. Results show, that at given reactor length, higher
reactant conversion is obtained by increasing the purge fraction (Fig. 7). This can
be explained by the fact that the recycle (containing large amounts of inert)
decreases both the reactor residence time and reactant concentration.
Fig. 7. Conversion of 2-butene vs reactor length (D = 3 m), for different values of the
purge fraction P
As a result, bigger reactors are necessary to obtain a certain conversion,
with negative effect on capital expenditures (CAPEX) and operating expenditures
(OPEX). The results from Fig. 8 reveal that as purge fraction is increased the unit
is more profitable. Note that decision levels 3 and 4 lower the economic potential
by more than 200% of the initial EP1.
The optimum 2-butene conversion is XA= 90% for a reactor length of
LR = 9 m and a high value of the purge fraction (e.g. above 95%). Note that
considering the purge fraction of P=0.2, the profit decreases from an initial
EP1=4500 k$/year at the first level of decision to EP4=500 k$/year at the 4th
level. In other words, the process alternative went from an economical solution to
a barely-profitable design by recycling the reactants back to the reactor.
Page 10
56 Andrei Maxim Andrei, Costin Sorin Bîldea
Fig. 8. Economic potential plotted against conversion, at different purge fractions, for US1a
US1b: Reactor – Separation - Recycle (A+B) with inert separation downstream of
reactor
The second alternative considers the separation of the inert (n-butane)
from the reactants in a distillation column downstream of the reaction section.
Additional costs for OPEX and CAPEX are expected for this distillation column
because the volatilities of the key components are very close. Although the
n-butane separation is very difficult, the product with high purity can be the raw
material of an isomerization process producing isobutane, which can be used in
alkylation units for obtaining high gasoline additives with high octane number.
Results are presented in Fig. 9 (left).
Fig. 9. Economical potential vs. conversion of 2-butene for US1b (left) and US1c(right)
The sensitivity analysis reveals that the addition of another distillation
column requires higher costs and affects the final economic potential EP4. The
Page 11
Conceptual design of propylene production by metathesis of 2-butene 57
separation of inert (I) and recycling only A and B components does not have a
positive effect on overall plant cost, compared to the previous alternative US1a.
For reactor length of LR = 9 m and conversion of XR = 87% the maximum
economic potential is EP4 = 1773 k$/year.
US1c: Reactor – Separation – Recycle (A+B), with inert separation upstream of
reactor
Compared to the other two options presented above (with recycle streams),
this case is interesting because the initial separation of inert upstream of reactor
could have a positive effect, relieving the following equipment of useless
circulation of inert. However, it is also challenging because the separation n-
butane / 2-butene is very difficult due to their similar volatilities.
The economic potential was determined against the reactor conversion by
sensitivity cases in Aspen Plus. The results (Fig. 9 right) show that the structure
US1c returns a maximum economic potential (EP4) of only 273 k$/year.
Flowsheets without recycle
US2a: Reactor - Separation with inert removal upstream of reactor
For process alternative US2a, no major difference in the economic
optimum is seen compared to US1c. This happens because in US1c the optimum
design corresponds to a rather large value of the conversion, therefore a small
recycle which has a low impact on the revenue. The results for the decision levels
are presented below (Fig. 11 left) and are very similar with the process alternative
US1c. The economic potential for this process alternative is EP4 = 288 k$/year.
US2b: Reactor - Separation
For the once-through configuration without recycle, the economic
potential at different decision levels was plotted on a single graph to reveal the
economic impact to the unit. At the first level (Fig 11 right) the EP1 increases
with conversion, as the products value and raw materials costs are included.
Fig. 11. Economic potential vs conversion of 2-butene for US2a (left) and US2b (right)
Page 12
58 Andrei Maxim Andrei, Costin Sorin Bîldea
As the next layer of complexity is added, the economic potential EP2 is
slightly lower, mostly because the cost of reactor and catalyst has low impact on
fixed capital expenditures. The economic potential EP3 is dramatically modified,
by more than 100%, when the separation equipment is included. The decision
level 4 impacts the OPEX by further decreasing the economic potential EP4. The
summary with the optimum points from the economic analysis for the five
different flowsheet alternatives studied is presented in Table 8. Table 8
Results of the optimal flowsheet solutions for the olefin metathesis process
US1a US1b US1c US2a US2b
Optimal conversion XA 90% 87% 92% 96% 93%
Economic potential EP4 / [k$/year] 500 1773 273 288 2300
Return of Investment ROI 17% 26% 4% 4% 35%
The rate of return of investment (ROI) was calculated to express the
annual profit generated by the capital invested.
% 100% 100%Annual net profit EP4
ROIInvested capital CAPEX
(18)
Considering the highest %ROI, the flowsheet US2b was selected for
further investigation and detailed equipment sizing.
5. Details of the Reactor – Separation flowsheet
The simplified process flow diagram (Fig. 13) for the most economical
solution US2b reveals the major equipment considered in the process synthesis. A
preliminary sizing was performed for the main equipment considering process
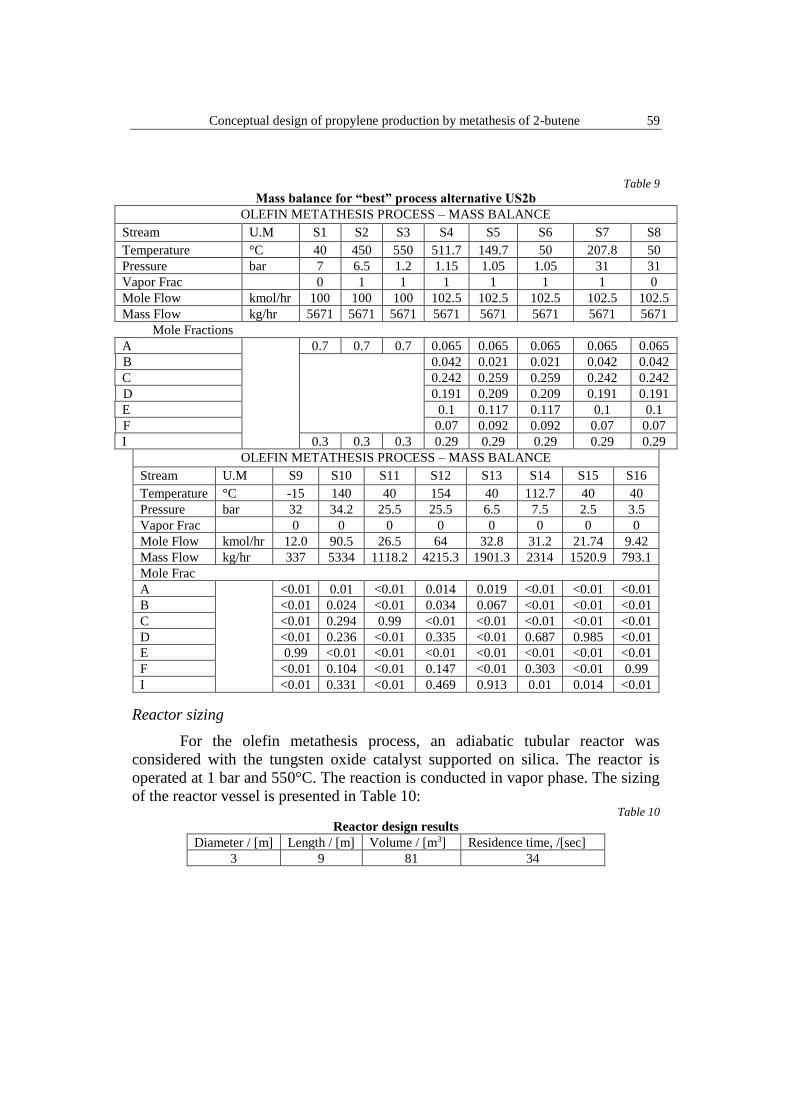
guidelines and technical literature. The unit mass balance is reported in Table 9.
Fig. 13. Simplified process flowsheet for US2b
Page 13
Conceptual design of propylene production by metathesis of 2-butene 59
Table 9
Mass balance for “best” process alternative US2b
OLEFIN METATHESIS PROCESS – MASS BALANCE
Stream U.M S1 S2 S3 S4 S5 S6 S7 S8
Temperature °C 40 450 550 511.7 149.7 50 207.8 50
Pressure bar 7 6.5 1.2 1.15 1.05 1.05 31 31
Vapor Frac 0 1 1 1 1 1 1 0
Mole Flow kmol/hr 100 100 100 102.5 102.5 102.5 102.5 102.5
Mass Flow kg/hr 5671 5671 5671 5671 5671 5671 5671 5671
Mole Fractions
A 0.7 0.7 0.7 0.065 0.065 0.065 0.065 0.065
B 0.042 0.021 0.021 0.042 0.042
C 0.242 0.259 0.259 0.242 0.242
D 0.191 0.209 0.209 0.191 0.191
E 0.1 0.117 0.117 0.1 0.1
F 0.07 0.092 0.092 0.07 0.07
I 0.3 0.3 0.3 0.29 0.29 0.29 0.29 0.29
OLEFIN METATHESIS PROCESS – MASS BALANCE
Stream U.M S9 S10 S11 S12 S13 S14 S15 S16
Temperature °C -15 140 40 154 40 112.7 40 40
Pressure bar 32 34.2 25.5 25.5 6.5 7.5 2.5 3.5
Vapor Frac 0 0 0 0 0 0 0 0
Mole Flow kmol/hr 12.0 90.5 26.5 64 32.8 31.2 21.74 9.42
Mass Flow kg/hr 337 5334 1118.2 4215.3 1901.3 2314 1520.9 793.1
Mole Frac
A <0.01 0.01 <0.01 0.014 0.019 <0.01 <0.01 <0.01
B <0.01 0.024 <0.01 0.034 0.067 <0.01 <0.01 <0.01
C <0.01 0.294 0.99 <0.01 <0.01 <0.01 <0.01 <0.01
D <0.01 0.236 <0.01 0.335 <0.01 0.687 0.985 <0.01
E 0.99 <0.01 <0.01 <0.01 <0.01 <0.01 <0.01 <0.01
F <0.01 0.104 <0.01 0.147 <0.01 0.303 <0.01 0.99
I <0.01 0.331 <0.01 0.469 0.913 0.01 0.014 <0.01
Reactor sizing
For the olefin metathesis process, an adiabatic tubular reactor was
considered with the tungsten oxide catalyst supported on silica. The reactor is
operated at 1 bar and 550°C. The reaction is conducted in vapor phase. The sizing
of the reactor vessel is presented in Table 10: Table 10
Reactor design results
Diameter / [m] Length / [m] Volume / [m3] Residence time, /[sec]
3 9 81 34
Page 14
60 Andrei Maxim Andrei, Costin Sorin Bîldea
Column sizing
The operating pressure for distillation columns was determined to allow
using cooling water in the condenser (except the de-ethanizer, where refrigerant is
used). For all columns, the recoveries of the key components were set to 99.9%.
The number of actual stages, feed tray and reflux ratio were determined by
using Winn-Underwood-Gilliland method. These were used as input data for
calculating the tray diameter with RADFRAC model from Aspen Plus, which uses
the flooding velocity to ensure proper pressure drop between trays and minimum
liquid entrainment. The equation that estimates the column diameter is Souder and
Brown equation which determines the maximum vapor velocity:
2 0.5( 0.171 0.27 0.047) [ ]l v
v
v s s
(19)
where v is the vapor velocity in m/s, s represents tray spacing in m; ρl and ρv
represents the liquid and vapor densities in kg/m3. Typical value of tray spacing is
s = 0.61 m with sieve tray type being the most common used in the industry. The
column diameter is calculated using the following relation:
4 mC
v
GD
v
(20)
where DC – column diameter / [m] and Gm – vapor mass flow rate / [kg/hr]
The results from the columns design are presented in Table 11 and Table
12. Column height was determined considering the number of actual stages
calculated with the 0.6 m as typical value of tray spacing and allowing enough
vapor disengaging at top of the column equal with 4 trays and sufficient residence
time in the bottom of the column equal with 3 trays. The vessels were sized based
on a residence time of minimum 5 minutes to reject process perturbation and to
ensure enough Net Positive Suction Head for reflux pump (Table 13).
Heat exchanger sizing
The heat exchanger sizing was determined considering a minimum
temperature approach of 15°C for shell and tube exchangers and a typical value of
200 W/m2/K for global heat transfer coefficient. The log mean temperature
difference (LMTD) was calculated and hence the heat transfer area (A).
The cost analysis performed for US2b is detailed in Table 14 for
illustrating the contribution of main equipment to the overall CAPEX. The cost
associated with distillation columns are the highest followed by catalyst and feed
preheat exchangers costs.
Page 15
Conceptual design of propylene production by metathesis of 2-butene 61
Table 11
Operating parameters for distillation columns from US2b
Column TAG COL-1 COL-2 COL-3 COL-4
Column description De-
ethanizer
De-
propanizer
De-
butanizer
De-
pentanizer
Top Pressure, bar 32 25.5 6.5 2.5
Top Temperature, °C -10.2 60.3 60.2 65.3
Bottom Temperature, °C 140 154.4 119.4 111.9
Reflux ratio 2.8 5.54 10.27 1.6
Distillate rate, kmol/hr 12 26.57 32.8 21.7
Component mole fraction C2
Product
C3
Product
C4
Product
C5 Product C6
Product
C2 0.99 - - -
C3 0.01 0.99 - -
INERT - 0.01 0.913 0.016
1-C4 - - 0.019 -
2-C4 - - 0.068 -
C5 - - - 0.984 0.01
C6 - - - - 0.99
Table 12
Results of column sizing
Column TAG COL-1 COL-2 COL-3 COL-4
Column description De-
ethanizer
De-propanizer De-butanizer De-pentanizer
Number of actual stages 47 45 44 48
Column diameter / [m] 0.58 0.520 0.51 0.43
Column height / [m] 31 29 29.5 32
Stage pressure drop / [bar] 0.01 0.01 0.01 0.01
Reboiler duty / [Gcal/hr] 0.4 0.38 0.29 0.24
Condenser duty / [Gcal/hr] -0.07 -0.42 -0.49 -0.28
Table 13
Results of vessel sizing
Equip. TAG V-1 V-2 V-3 V-4 V-5 V-6
Equip. description
Feed
vessel
Buffer
vessel
Reflux
drum COL-
1
Reflux
drum COL-
2
Reflux
drum COL-3
Reflux
drum COL-
4
Diameter / [m] 0.8 0.8 0.6 0.825 0.93 0.75
Length / [m] 3.1 3.1 1.5 1.65 1.85 1.5
Volume / [m3] 1.6 1.6 0.43 0.88 1.25 0.67
Residence time /
[min]
10 10 5 5 5 5
Table 14
Equipment cost and contribution to total fixed cost
Nr.crt Equipment Pcs Installed
Cost / [k$]
Percentage of
CAPEX / [%]
1 Reactor 1 548 9%
2 Catalyst 1 1017 16%
Page 16
62 Andrei Maxim Andrei, Costin Sorin Bîldea
3 Distillation columns 4 2309 37%
4 FEHE 1 689 11%
5 Furnace 1 141 2%
6 Compressor 1 635 10%
7 Vessels 2 133 2%
8 Pumps 8 266 4%
9 Contingency 534 9%
TOTAL 6272 100%
The operating expenses for each utility are illustrated in Table 15. Table 15
Utility cost and contribution to Operating Expenditures (OPEX)
Nr.crt Utility Cost /
[k$/year]
Percentage of OPEX / %
1 Gas 111 14.5 %
2 Steam 339 44 %
3 Cooling Water 31 4.1 %
4 Electricity 259 33.8 %
5 Refrigerant 26 3.6 %
TOTAL 766 100%
Steam used in reboilers has the largest contribution, followed by power
necessary to compress the reaction mixture before the ethylene separation.
6. Conclusions
The metathesis reaction of 2-butene over mesoporous tungsten catalyst is a
viable opportunity to produce more valuable olefins (such as propylene) from less
desired ones (as 2-butene). Sensitivity cases were performed for two
configurations, with and without recycle. The results revealed that recycling keeps
important amounts of inert (I) inside the unit, therefore increasing the CAPEX and
OPEX. Moreover, the separation of inert (I) from reactants A and B implies the
cost of additional expensive distillation column. The most economical solution is
US2b (Reactor – Separation, without recycle) with the highest profitability
EP4=2300 [k$/year]. For a feed rate consisting of 2-butene (70 %molar) and n-
butane (30 % molar), the investment and operating costs are 6272 k$ and 766
k$/year, respectively, giving a return of investment of ROI =35%
R E F E R E N C E S
[1]. I.B Tazul, A. Palani, M.H. Mohammad, N.A. Mohammad, M.A. Abdullah, H.A. Raed, S.A.
Sulaiman, “Kinetics Modelling of 2-butene Metathesis Over Tungsten Oxide Containing
Mesoporous Silica Catalyst”, in Can. J. Chem. Eng, vol. 92, July 2014, pp. 1271-1282.
[2]. A.C. Dimian, C.S. Bildea, A. Kiss, Integrated Design and Simulation of Chemical Processes, 2nd
edition, Elsevier, 2014.
[3]. J. Douglas, Conceptual Design of Chemical Processes, McGraw-Hill Science Engineering Math,
1988.
[4]. A.C. Dimian, C.S. Bildea, Chemical Process Design – Computer Aided Case Studies, Wiley, 2008.
[5]. K.M. Guthrie, "Capital Cost Estimating", in Chem. Eng., March 1969.


![Simulation and Performance Analysis of Propylene · PDF fileon-purpose propylene technology; propane dehydrogenation, olefin metathesis, and methanol to propylene [2]-[4]. However,](https://static.documents.pub/doc/80x56/5a9fa6de7f8b9a89178d0123/simulation-and-performance-analysis-of-propylene-propylene-technology-propane.jpg)


