Concrete damage plasticity model for modeling FRP-to-concrete bondbehavior
Tao, Y., & Chen, J. (2015). Concrete damage plasticity model for modeling FRP-to-concrete bond behavior.Journal of Composites for Construction, 19(1), [04014026]. DOI: 10.1061/(ASCE)CC.1943-5614.0000482
Published in:Journal of Composites for Construction
Document Version:Peer reviewed version
Queen's University Belfast - Research Portal:Link to publication record in Queen's University Belfast Research Portal
General rightsCopyright for the publications made accessible via the Queen's University Belfast Research Portal is retained by the author(s) and / or othercopyright owners and it is a condition of accessing these publications that users recognise and abide by the legal requirements associatedwith these rights.
Take down policyThe Research Portal is Queen's institutional repository that provides access to Queen's research output. Every effort has been made toensure that content in the Research Portal does not infringe any person's rights, or applicable UK laws. If you discover content in theResearch Portal that you believe breaches copyright or violates any law, please contact [email protected].
Concrete Damage Plasticity Model for Modeling FRP-to-
Concrete Bond Behavior
Y. Tao 1 and J.F. Chen 2
ABSTRACT: The technique of externally bonding fiber reinforced polymer (FRP)
composites has become very popular worldwide for retrofitting existing reinforced
concrete (RC) structures. Debonding of FRP from the concrete substrate is a typical
failure mode in such strengthened structures. The bond behavior between FRP and
concrete thus plays a crucial role in these structures. The FRP-to-concrete bond
behavior has been extensively investigated experimentally, commonly using the
single or double shear test of FRP-to-concrete bonded joint. Comparatively, much less
research has been concerned with the numerical simulation, chiefly due to difficulties
in the accurate modeling of the complex behavior of concrete. This paper presents a
simple but robust finite element (FE) model for simulating the bond behavior in the
entire debonding process for the single shear test. A concrete damage plasticity model
is proposed to capture the concrete-to-FRP bond behavior. Numerical results are in
close agreement with test data, validating the model. In addition to accuracy, the
model has two further advantages: it only requires the basic material parameters (i.e.
no arbitrary user defined parameter such as the shear retention factor is required) and
it can be directly implemented in the FE software ABAQUS.
KEYWORDS: Fiber reinforced polymer; Concrete; Bond; Finite element model;
Damage.
1 Associate Professor, School of Civil Engineering, Xi’an University of Architecture and Technology, China. 2 Professor of Civil and Structural Engineering, School of Planning, Architecture, and Civil Engineering, Queen’s University Belfast, UK. Email: [email protected].
INTRODUCTION
Externally bonding fiber reinforced polymer (FRP) has been widely used to strengthening and
retrofit existing concrete structures (Teng et al., 2002). One of the main failure modes of
flexurally and shear strengthened concrete structures is the debonding failure of the externally
bonded FRP (Chen and Teng, 2001; Teng et al., 2002). This has led to extensive research on
the bond behavior between FRP and concrete in the last two decades. This bond behavior is
typically investigated experimentally using the ‘shear’ test of FRP-to-concrete bonded joints
where a FRP plate is bonded to a concrete block and subjected to a tensile force (e.g. Ali-
Ahmad et al., 2006; Benzarti et al. 2011; Täljsten, 1996; Wu et al., 2001; Yao et al., 2005).
Typical debonding failure in the shear test occurs in the concrete a small distance, usually 2-5
mm, away from the adhesive-concrete interface. The bond behavior is thus usually controlled
by the behavior of the concrete. In addition to experimental studies, the bond characteristics
of the FRP-to-concrete interface have also been investigated in a number of analytical (e.g.
Chen et al., 2007; Yuan et al., 2004); and numerical (e.g. Chen and Pan, 2006; Coronado and
Lopez, 2007; Diab and Wu, 2007; Lu et al., 2005b; Lu et al., 2006; Pham and Al-Mahaidi,
2007; Benvenuti et al. 2012; Marfia et al. 2012;) studies. A brief review of existing finite
element (FE) modeling of the FRP-to-concrete bond behavior is presented as follows.
Existing FE studies on the FRP-to-concrete bonded joint are summarized in Table 1. They
may be classified into three approaches: a) direct modeling approach where the behavior of
concrete is accurately modeled in meso-scale with an appropriate constitutive model (e.g. Lu
et al., 2005b; 2006); b) interface modeling approach where the bond behavior is modeled
using a layer of interface elements (e.g. Diab and Wu, 2007); and c) crack band modeling
approach where the debonding failure is assumed to take place within a band in the concrete
adjacent to the FRP-concrete interface with a modified constitutive law for this band (e.g.
Coronado and Lopez, 2007; 2010). Note that this ‘crack band’ approach is fundamentally
different from Bažant and Oh’s (1983) ‘crack band theory’ which is discussed in more detail
in the next section.
In the direct modeling approach, a meso-scale FE mesh, with the smallest element size
commonly in the range of 0.5~2 mm, is adopted to model the detailed behavior of concrete
near the FRP-to-concrete bondline so that the bond-slip behavior can be obtained. Lu et al.
(2005b) adopted a fixed angle crack model and a shear retention model for the concrete. The
bond-slip model (Lu et al., 2005a) developed based on Lu et al. (2005b) has been very widely
accepted by the research community (e.g. Godat et al. 2007; Smith and Gravina 2007;
Obaidat et al. 2010; Chen et al., 2012;). Lu et al. (2006) later adopted a rotation angle crack
model in conjunction with a user-defined constitutive model for concrete. Both FE models
were implemented through a user-subroutine in MSC.MARC (2003). The predictions are also
sensitive to the choice of the shear retention model. Pham and Al-Mahaidi (2007) directly
adopted the concrete model in DIANA (2003). Their concrete mesh consisted of a transition
layer with element size varying from 2 to 10 mm and a coarse layer with 10 mm elements. It
appears that the effect of the thickness of the fine layer was unclear but it could be significant
as the predicted concrete cracks propagated into both layers. All these studies adopted the
smeared crack model of concrete. A number of studies (e.g. Camata et al., 2004; Pham et al.,
2006) have attempted to combine both the smeared and discrete crack models. However, this
approach usually requires to predefine the crack locations and an additional interface crack
model to define the discrete crack behavior, making it difficult to be predictive.
The interface model approach is most commonly adopted for modeling FRP strengthened
structures (e.g. Chen et al., 2011; Chen et al., 2012) or for modeling three-dimensional
behavior (Salomoni et al., 2011) because it is unrealistic to model the whole strengthened
structure in 3D using meso-scale elements due to heavy computational demands. The FRP-to-
concrete interface is usually represented by zero thickness interface elements (e.g. Diab and
Wu, 2007; Salomoni et al., 2011). A constitutive law for the interface elements is needed to
obtain from either the direct model approach or shear tests. This is thus not really a predictive
approach for the bond behavior (but for structural behavior).
The crack band approach assumes that debonding occurs within a thin band in the concrete
adjacent to the adhesive-to-concrete interface, and the properties of the concrete within this
band are different from the nearby plain concrete because of the ingression of adhesive
(Coronado and Lopez, 2007; 2008). Consequently, a modified concrete constitutive law is
required for this band (Coronado and Lopez, 2007; 2010), but its properties include fracture
energy, size effect fracture energy and tensile strength, need to be determined experimentally.
It is thus debatable whether the approach is predictive. Furthermore, the properties can be
significantly affected by the adopted adhesive, rendering the approach more complex for
practical applications. Also, if the band represents the thin layer of concrete with adhesive
ingression, it is debatable whether failure would still occur within this stronger layer because
the adhesion leads to a higher tensile strength of concrete.
Based on the above discussion, it may be concluded that the direct modeling approach is the
most appropriate for modeling the FRP-to-concrete bond behavior as a truly predictive model.
However, numerical studies on the bond behavior using this approach have been very limited
mainly because of challenges in the accurate modeling of concrete.
This paper presents a predictive FE model using the direct modeling approach. A new damage
model based on the plastic degradation theory is first proposed. It is then incorporated in the
concrete damage plasticity model in ABAQUS for FE simulation of the FRP-to-concrete
bonded joint test. Predictions of the proposed FE model are compared with test results and
predictions of existing concrete damage models.
MODELING OF CONCRETE
Modeling of concrete fracture
Two methods are commonly used in FE modeling of concrete cracking: the discrete crack
model and the smeared crack model (Rots, 1991). In the former, a crack is treated as a
geometrical identity so it is either pre-embedded in the FE mesh (Yang et al. 2009) or through
continuous re-meshing (Yang et al., 2003; Yang and Chen 2005). The latter keeps the
geometry (and thus the mesh) unchanged and the cracking is modeled through the concrete
constitutive law (Rots, 1991). The smeared crack approach is adopted in this study as it is
impossible to track numerous micro-cracks in the single shear test where failure occurs within
a few millimeters (usually 2~5 mm) in the concrete adjacent to the bondline.
One of the drawbacks of the smeared concrete model is that it involves the strain localization
phenomenon due to strain-softening, where the energy consumption approaches to zero
during crack propagation when the element size approaches to zero (Bažant and Jaime, 1998),
leading to results sensitive to the FE mesh. Bažant and Oh’s (1983) crack band theory is
adopted in this study to overcome the mesh sensitivity problem. The theory relates the crack
opening width w, the width of the crack band h and the crack strain εct through:
cthw (1)
The crack band width h represents the effective width of the fracture process zone over which
micro-cracks are assumed to be uniformly distributed. In the FE analysis, the cracking strain
is assumed to be uniformly distributed over h in an element which is referred as the
characteristic length of an element and is related to the element size, type and integration
scheme (Rots 1991).
Compressive and tensile behavior of concrete
In this paper, the concrete is modeled using the concrete damage plasticity model available in
ABAQUS (2007). The plasticity model adopts the yield function proposed by Lubliner et al.
(1989) and modified by Lee and Fenves (1998), and follows a non-associated flow rule. The
concrete under uniaxial compression is described by the following stress strain relationship
proposed by Saenz (1964):
2
0
0
21
p
c
p
c
p
p
cc
E
E
(2)
where σc and εc are respectively the compressive stress and strain, σp and εp are the
experimentally determined maximum stress and its corresponding strain which are taken to be
the cylinder strength fc’ (MPa) and 0.002 respectively in this study. The elastic modulus of the
concrete E0 is estimated from '47300 cfE (MPa) following ACI 318 (2002).
Under uniaxial tension, the problem involves tensile cracking. The fracture energy GF, that is
the energy required to create a unit area of stress free crack surface which is size independent,
instead of the descending branch of the stress-strain curve which is size dependent, is treated
as a material property of the concrete. In this paper, the stress-crack opening displacement
relationship proposed by Hordijk (1991) is adopted:
22
31
3
1 11 c
cr
tw
wc
cr
t
t
t ecw
we
w
wc
fcr
t
(3)
t
Fcr f
Gw 14.5 (4)
where wt is the crack opening displacement, wcr is the crack opening displacement at the
complete loss of tensile stress, σt is the tensile stress normal to the crack direction, ft is the
concrete uniaxial tensile strength, and c1=3.0 and c2 =6.93 are constants determined from
tensile tests of concrete. The CEB-FIB (1991) model is used in this paper to estimate ft and
GF:
3
2
10
8'4.1
c
t
ff , MPa (5)
7.0
2
10
'265.00469.0
c
aaF
fddG , N/mm (6)
where da is the maximum aggregate size of the concrete. In the present study, da is assumed to
be 20 mm if no test data is available. Once the stress-crack opening displacement relationship
is known, the stress-strain relationship can be determined for each element based on its size
through Eq. 1. The Poisson’s ratio ν=0.2 is assumed in this study.
CONCRETE DAMAGE MODELS
General
The nonlinear behavior of concrete is attributed to the process of damage and plasticity. The
process of damage can be attributed to micro-cracking, coalescence and decohesion etc. The
plasticity behavior can be characterized by several phenomena such as strain softening,
progressive deterioration and volumetric expansion etc. These lead to the reduction of the
strength and stiffness of concrete (Cicekli et al., 2007; Grassl and Jirásek, 2006; Lubliner et
al., 1989). Damage is usually characterized by the degradation of stiffness. An isotropic
scaled damage model from the continuum damage mechanics is introduced in ABAQUS
(2007) to describe the stiffness degradation, which can be represented by Eq. 7 under uniaxial
loading:
plEd 01 (7)
where σ, , and pl represent respectively the stress, total strain and plastic strain; E0 is the
initial (undamaged) elastic stiffness and d the damage factor, which characterizes the
degradation of the elastic stiffness and has values in the range between 0 (undamaged) to 1
(fully damaged). The current degraded stiffness E is defined as:
01 EdE (8)
If no damage is considered in the concrete (d=0), Eq. 7 is reduced to:
plE 0 (9)
in which the plastic stain (pl) is the same as that without stiffness degradation (p) (Fig. 1b).
Stiffness degradation models can be classified into two types according to the presence of
irreversible deformation/plastic strain: elastic degradation models and plastic degradation
models (Lubliner et al. 1989). The elastic degradation models are associated with the total
strain, implying that no plastic strain exists ( 0 pp , where p is the plastic strain with
stiffness degradation), so the unloading branch passes through the origin (Fig. 1). Eq. 7 in this
case can be rewritten as:
01 Ed (10)
where ε is the total strain. Lubiner et al. (1989) stressed that the concept of elastic degradation
is associated with the total deformation but without the necessity of a damage criterion. A
plastic degradation, in which the stiffness degradation is associated with the plastic
deformation instead of the total deformation, was introduced to overcome the weaknesses of
the elastic degradation model (Lubiner et al. 1989). It means that irreversible
deformation/plastic strain exists after damage has occurred (so the plastic strain with stiffness
degradation 0p ) (Fig. 1b). Eq. 7 in this case can be rewritten as:
pEd 01 (11)
Lubliner et al.’s (1989) damage model
Lubliner et al. (1989) proposed a simple damage model that plastic degradation occurs only in
the softening range and the stiffness is proportional to the cohesion of the material:
dc
c
E
E 1
max0
(12)
max
1c
cd (13)
where c is the cohesion in the yield criteria which is proportional to stress and cmax is
proportional to the strength of the concrete (Lubliner et al. 1989). Under uniaxial tension or
compression, Eq. 13 reduces to:
fd
1 (14)
in which f is either the tensile or compressive strength of concrete as appropriate. Based on
the geometry in Fig. 1b, p can be related to the damage factor d as:
01 Ed
dpp
(15)
Substituting Eq. 14 into Eq. 15 yields
000 E
f
E
f
Ep
(16)
in which 0Ef is the elastic strain at the peak stress. Therefore, it is observed in this study
that in Lubliner et al.’s (1989) damage model the elastic strain remains constant (f/E0) after
the peak stress.
Damage models used for simulating FRP strengthened concrete structures
Several concrete damage models have been used to simulate FRP strengthened concrete
structures. Chen et al. (2011) adopted the classical elastic damage model to describe the
tensile behavior of concrete in the modeling of FRP strengthened reinforced concrete (RC)
beams, assuming that there is no plastic strain ( 0p ) throughout the post-cracking range so
the unloading paths of the stress-strain curve always pass through the origin of the coordinate
system in Figs 1 and 2. Yu et al. (2010) assumed that the elastic strain is constant after the
peak stress in compression in the modeling of FRP confined concrete columns, which is
proved above the same as the damage model proposed by Lubliner et al. (1989). Chen et al.
(2012) used Rots’ (1988) shear retention model for the modeling of FRP shear-strengthened
RC beams:
n
ucr
cr
,
1 (17)
where εcr is the concrete crack strain corresponding to wt in Eq. 3, εcr,u is the concrete cracking
strain at the complete loss of stress corresponding to wcr in Eq. 3, and the power n controls the
rate of shear degradation.
A new damage model
Lubliner et al.’s (1989) and the other damage models summarized above were implemented to
simulate the bond behavior in the single shear test but they did not lead to reasonable
predictions in comparison with test data. A new model was thus proposed in this study.
Once the concrete enters into the softening range, the stiffness is degraded resulting in a
plastic strain degradation (so pp , see Fig. 1a). Instead of assuming that the stiffness is
proportional to the cohesion of the material as in Lubliner et al. (1989), it is assumed here that
the ratio of the plastic strain with stiffness degradation ( p ) to that without stiffness
degradation (p), k, is proportional to the ratio of cohesion to the maximum cohesion of the
material. The rational of this assumption is that the plastic strain with stiffness degradation
must be smaller than that without degradation, and the effect increases as degradation
increases. However, the total plastic strain shall not reduce as deformation increases.
In the case of uniaxial loading, this ratio can be expressed as:
0 subject to max
PP
P
fc
ck
(18)
Note that Eq. 18 is subject to the condition that the plastic strain rate is not negative ( 0P )
because within the entire cracking process, the plastic strain cannot decrease as crack widens.
Although this condition would theoretically break down at a certain point because Eq. 18
implies that 0P when = 0, it is actually satisfied in the entire range for all cases covered
in this study in tension. This is because ABAQUS does not allow the stress to reduce below
1% of the strength f in both tension and compression for numerical stability. In compression,
this condition is more likely violated at large strains, especially for high strength concrete.
Assuming that the condition is not satisfied (i.e. when the adoption of k leads to an decrease
of the plastic strain so )()1( iP
iP ) after deformation has developed to certain value, and
the elastic strain at the moment when the condition starts to be violated (at 0P ) is ecr ,
the damage factor is calculated thereafter by assuming that the elastic strain remains constant
at ecr . This is somewhat similar to Lubliner et al.’s (1989) model but note that the constant
elastic strain is different here. From Fig. 1b:
01 Ed
dPecr
P
(19)
So the damage factor
0
)(
)(
E
decr
P
ecr
P
(20)
Implementation of the proposed damage model in ABAQUS
In ABAQUS, the relationship between the plastic strain without stiffness degradation, p ,
and the damage factor d needs to be defined by the user as a constitutive law of concrete.
Therefore, the relationship between k in Eq. 18 and the damage factor d needs to be
established in order to implement the new damage model in ABAQUS. The plastic strain with
stiffness degradation p can be related to the damage factor d using Eq. 15. Substituting Eq.
18 into Eq. 15 and combining Eq. 20 gives
0 if
/)(
)(
0 if)1(
)1(
0
0
Pecr
P
ecr
P
PP
P
E
Ek
k
d
(21)
Figure 2 shows a typical stress-strain curve for concrete under uniaxial tension, where the
subscript t represents tension. The stress-crack strain curve for a given element can be
obtained from the stress-crack opening displacement curve (Eq. 3) depending on the element
type and size through Eq. 1. The relationship between the crack strain pt = wt/h and tension
damage factor dt can then be calculated from Eq. 21.
The compression damage is assumed to follow the same rule as in tension in this study. The
compression damage factor dc versus compressive plastic strain pc can be calculated from
Eq. 21. Note that the compressive plastic strain is calculated from 0Eccp
c . Damage is
assumed to occur only after the concrete enters softening in both tension and compression.
FE MODELING OF SINGLE SHEAR TEST OF FRP-TO-CONCRETE
BONDED JOINTS
Geometry
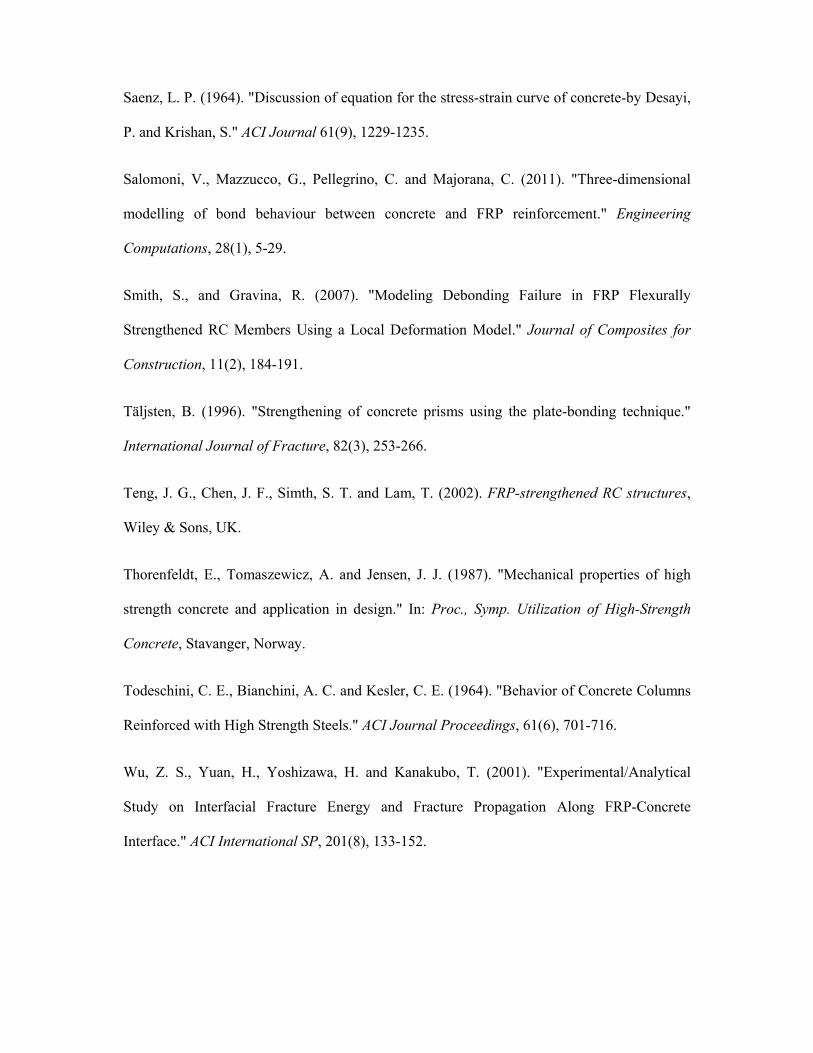
A 45 mm thick concrete prism as shown in Fig. 3 has been modeled as a plane stress problem
in the FE analysis. This thickness is smaller than most specimens in experiments but the rest
of the concrete should have little effect on the FE results as the test commonly fails by
debonding in concrete a few millimeters away from the FRP-to-concrete interface and only
this failure mode is concerned in this study. The geometry of the FE model is the same as that
adopted by Lu et al. (2005b; 2006). In the FE model, the specimen was restrained vertically
along the base and horizontally along part of the right edge hs (Fig. 3). For specimens with a
free height hc smaller than 30 mm, the actual hc value was used. For specimens with hc greater
than 30 mm, hc was set to 30 mm. The thickness of the FRP plate tp was set equal to 1 mm but
the modulus of elasticity of the plate Ep was modified so that the FRP plate had the actual
axial stiffness Eptp.
Constitutive models and FE mesh
As aforementioned, the concrete damage plasticity model was used to describe the concrete
behavior in this study. The plastic behavior of concrete was modeled following the
compressive and tensile behavior described earlier. The damage was modeled using the
damage model proposed in this study. The FRP was modeled as a linear elastic material.
The concrete was modeled using square elements with four integration points (CPS4) in this
study. All concrete elements had the same size. Rots’ (1988) recommendation was adopted
that the characteristic length for a square element with 4 integration points is e2 where e is
the element side length. The FRP was modeled using the same element with matching mesh.
Interpretation of numerical results
Because the test was modeled as a plane stress problem while the actual behavior is three
dimensional (Chen and Pan 2005), the predicted load, displacement, stress and strain in the
FRP plate were all adjusted following the width ratio factor βw proposed by Chen and Teng
(2001):
cf
cfw bb
bb
1
2 (22)
where bf and bc are the widths of the FRP plate and the concrete prism respectively.
Mesh convergence analysis
Specimen II-5 reported in Yao et al. (2005) was used as a reference case for conducting the
mesh convergence study. Four meshes with concrete element size equal to 5, 2, 1 and 0.5mm
were considered. Figures 4a and b show respectively the predicted load-slip curves and the
loading capacity from these meshes. The predicted ultimate load increases slightly as the
mesh size reduces. This is different from the normal smeared crack model where the loading
capacity is expected to reduce as mesh size reduces because the energy consumed by the
cracking elements reduces with element size, leading to mesh dependent results. The
difference in the loading capacity between the 0.5 mm mesh and the 1 mm mesh is 2.8% (Fig.
4b), showing that the mesh sensitivity problem is effectively eliminated by adopting the crack
band theory and mesh convergence is achieved. These four meshes and the predicted damage
contours at debonding are shown in Fig. 5. The 5 mm mesh is too coarse: it predicts a uniform
5 mm (one element) concrete damage (debonding) underneath the FRP along the length of the
FRP and a wedge failure of the concrete at the right. The other three meshes predicted the
same failure mode and almost the same concrete damage area, with small inclined concrete
cantilevers as in Lu et al. (2005b). On balance of accuracy and computational economy, the 1
mm mesh was adopted for all cases reported in the rest of the paper.
INFLUENCE OF CONCRETE DAMAGE MODEL
The proposed together with the other concrete damage models described early were used to
investigate their effects on the FE predictions. A model without considering any damage, i.e.
both dt = dc = 0, was also considered as a reference. Figures 6 and 7 show how the damage
factor varies respectively with the crack strain (in tension) or inelastic strain (in compression)
for these models, where a 1 mm square element and concrete properties for specimen II-5 in
Yao et al. (2005) were used.
Figures 8a and b show respectively the predicted load-slip curves for specimen II-5 in Yao et
al. (2005) and No. 1 in Ali-Ahmad et al. (2006) using the different damage models. It is seen
that different concrete damage models produce significantly different results. The predictions
from the present model are clearly in closer agreement with the test results than other models.
It may be noted that the damage model has almost no effect in the early stage (<2 kN in Fig.
8a and <4 kN in Fig. 8b). This is because at this stage the concrete is almost all elastic so little
damage has occurred anyway. The simulation using Chen et al.’s (2011) model was
terminated earlier for both specimens due to convergence difficulties. The results appear to
show that Lubliner et al.’s (1989) damage model as adopted by Yu et al. (2010) over-
estimates the bond strength if only tensile damage is considered, but under-estimates if the
damage model is applied in both tension and compression. The model without considering
any damage in both tension and compression under-estimates the loading capacity. These
results show that the inclusion of compression damage has a significant effect on the
prediction, which may be explained by Lu et al.’s (2005b) findings. The shear forces on the
inclined meso-cantilevers, which are caused by the formation of interfacial shallow cracks
near the bond interface, resulting in a combined compression and bending at the root of the
cantilevers leading to either crushing failure, or flexural failure at the root.
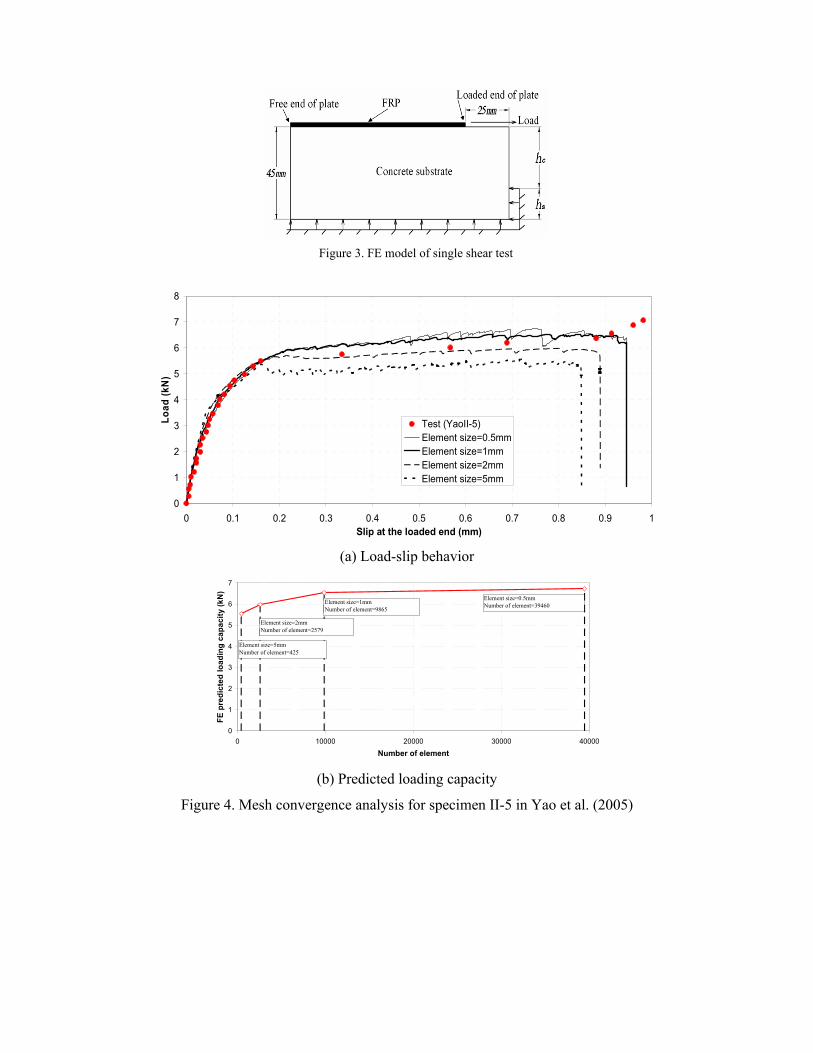
The damage model based on Rots (1988) shear retention model with n=5 also over-estimates
the loading capacity (Fig. 8). The effect of the value of n on the prediction is shown
respectively in Figs 9a and b for the two specimens: a smaller n value leads to smaller
predictions in both load and slip and the effect is very significant. It is seen that the
prediction with n=0.5 is close to the test results for specimen II-5 in Yao et al. (2005) but that
with n=1 is closer for specimen No. 1 in Ali-Ahmad et al. (2006). It is thus not possible to
choose a specific value for prediction purpose.
COMPARISON OF FE PREDICTIONS WITH TEST RESUTLTS
The proposed FE model has been used to simulate all the 56 single shear tests reported in Yao
et al. (2005) in which all the geometrical and material properties necessary for FE modeling
are available. It may be noted that Yao et al. (2005) reported a total of 72 tests but 16 of them
failed in other modes rather than debonding in concrete so they were excluded in this study.
The concrete cylinder strength for the specimens in Yao et al. (2005) varied from 19 to 27
MPa. To increase the range of concrete strength, specimen No. 1 from Ali-Ahmad et al.
(2006) and three specimens (S-CFS-400-25) from Wu et al. (2001) were further simulated.
The concrete cylinder strength was respectively 38 MPa for the former and 57.6 MPa for the
latter. Figure 10 shows that the FE predictions are overall in very close agreement with the 60
test data.
Three typical specimens with different concrete strength are chosen from the above database
for further comparison between the FE prediction, test data and analytical solution if
available. These are specimen II-5 in Yao et al. (2005), specimen No. 1 in Ali-Ahmad et al.
(2006) and specimen S-CFS-400-25 in Wu et al. (2001), which had concrete strength of 23,
38 and 57.6 MPa respectively. Figures 11 and 12 show that the predicted and measured load-
slip curves are in close agreement for the first two specimens (that for the third one is not
available). Yuan et al. (2004) analyzed the load-slip curve for specimen II-5 in Yao et al.
(2005) using their analytical solution. Their results are also shown in Fig. 11 for comparison.
Figure 13 shows the close agreement between the predicted and measured FRP strain
distribution for the third specimen. Table 2 compares the loading capacities from FE
prediction, test and Chen and Teng’s (2001) bond strength model. It shows that the loading
capacities from the present FE prediction are in close agreement with test and those predicted
from Chen and Teng’s (2001) model.
Figure 14 shows a comparison between the FE prediction, test and Yuan et al.’s (2004)
analytical solution of FRP axial stress at Point B, E and G as marked in Fig. 11. The axial
stress is used here because it was used in Yuan et al. (2004). The test axial stress was obtained
by multiplying the measured strain on the top surface by the Young’s modulus of the FRP.
There is a very close agreement between the three when the bonded joint is almost entirely
elastic at Point B with load P = 2.26 kN. At the initiation of debonding (at Point E with P =
5.53 kN), the FE prediction is in good agreement with the analytical solution. The test results
are in agreement with the other two in overall trend, but shows large fluctuations. This is
probably caused by local bending of the FRP (see Chen et al. 2001), in addition to probable
measurement errors. Point G (P = 5.74 kN) corresponds to a state when debonding has
propagated by 55 mm from the loaded end. The analytical strain is constant within this 55
mm. The strain from FE prediction is the largest at the loaded end and reduces gradually
within the debonded zone, although it is overall in agreement with the analytical solution. The
cause for this phenomenon will be discussed below. Again, the test strain shows large
fluctuations but is in agreement with the other two in trend.
Figure 15 shows the predicted load-slip curves for group VII specimens in Yao et al. (2005)
whose bond length varied but all other parameters remained the same. The effective bond
length, which is defined as the bond length beyond which the ultimate load does not increase
with an increase of the bond length, calculated by Chen and Teng’s (2001) model is 92 mm
for this group, implying that the ultimate load of this group should be constant because the
bond lengths were greater than the effective bond length for all specimens in the group.
Although the FE predicted ultimate load capacities are more or less the same (Fig. 15), they
do show a trend that the loading capacity increases slowly with the bond length. This
phenomenon is evident from test results as shown in the inert table in Fig. 15.
The above phenomenon is consistent with the phenomenon in Fig. 11 that the load continues
to increase slowly after the initiation of debonding (Point E), instead of a horizontal plateau as
predicted by Yuan et al.’s (2004) analytical solution. This is also consistent with the
phenomenon in Fig. 14 that the FE predicted FRP stress is not constant within the debonded
zone: it is the highest at the loaded end and reduces slowly within the zone towards the
debonding front. This phenomenon may be explained by the different material constitutive
models employed in the different analyses. Typically a bi-linear bond-slip model is assumed
in analytical analyses such as Yuan et al. (2004). The bi-linear bond-slip model assumes that
the interface does not resist any stress once the slip exceeds the critical value, leading to a
horizontal plateau when the bond length is sufficiently large. In the present FE analysis,
although the tensile and compressive stresses are also supposed to reduce to zero when the
strain reaches a critical value (Figs 1 and 2), ABAQUS (and many other FE packages) does
not allow the tensile stress to fall below 1% of ft to ensure numerical stability (similar in
compression). This means that concrete always has a small residual strength in both tension
and compression in the FE mode. Therefore, the difference between the analytical solution
and the FE prediction is most likely due to the differences in the assumptions adopted.
Although it may be argued that the slow increase of the FE predicted loading capacity with an
increase of the bond length is also due to the arbitrary numerical treatment, it is evident in the
test data as in Figs 11, 14 and 15 that the load increases slowly with deformation even at large
slips.
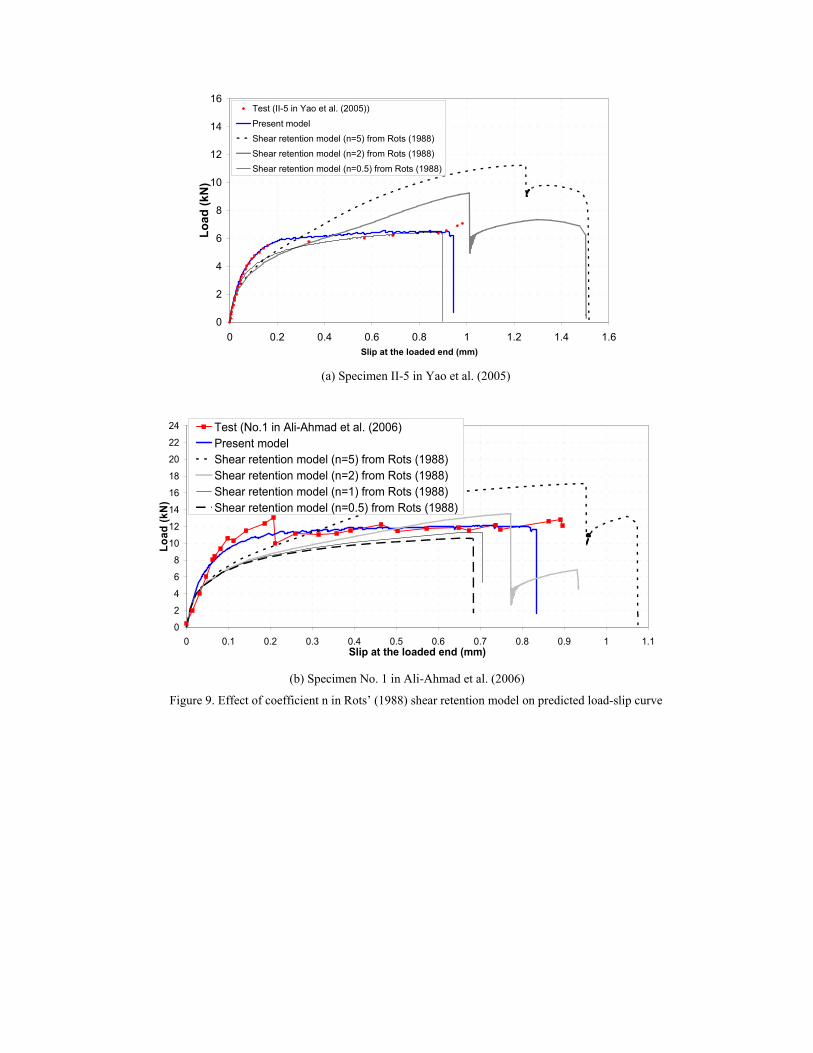
For specimen II-5 in Yao et al. (2005), a number of points on the FE load-slip curve (marked
Point A-I in Fig. 11) were chosen to investigate the debonding process. Figure 16 shows the
tensile damage contours in the concrete. It may be noted that the tensile damage is directly
related to the cracking strain so these contours represent closely the crack pattern in the
concrete, so the progressive development of damage in Fig. 16 also represents closely the
propagation of concrete crack/FRP debonding.
The concrete near the loaded end exhibits softening in a small zone directly under the FRP
when the load is about 30% of the ultimate load (Fig. 16b). The length of this small softening
zone has been about doubled and its depth significantly increased when the load increases to
about 60% (Fig. 16d). Micro-cracks start to form with an angel of about 45° to the horizontal.
A macro crack only appears when the load is about 90% of the ultimate load (Fig. 16f) and
debonding starts to propagate rapidly thereafter towards the free end of the FRP (Fig. 16g –
16i) leading to the total separation of the FRP plate from the concrete (Fig. 16j).
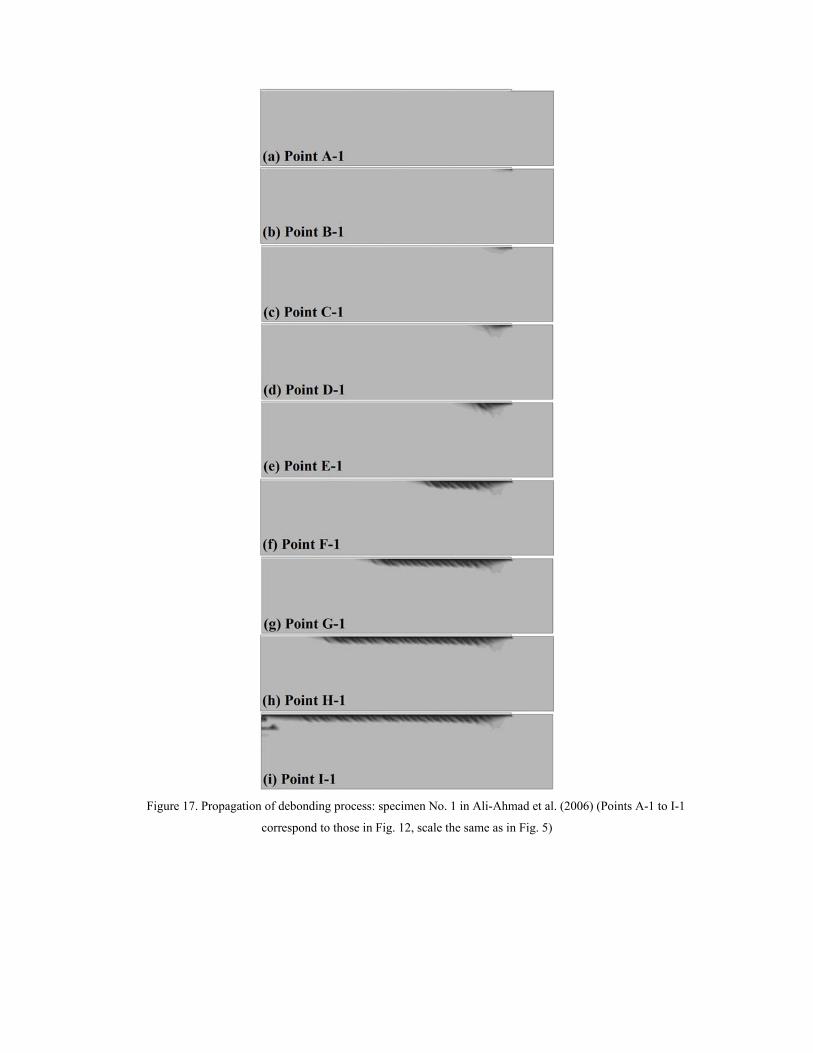
This debonding failure process is very similar for specimen No. 1 in Ali-Ahmad et al. (2006)
(Fig. 17).
CONCLUSIONS
A concrete damage model based on the plastic degradation theory has been proposed and
implemented into the concrete damage plasticity model in ABAQUS to simulate the FRP-to-
concrete bond behavior in this paper. The plastic degradation is used to describe the damage
of the concrete after it enters softening in both tension and compression. The damage effects
are modeled in terms of plastic strain rather than the stiffness degradation. The proposed
model has been implemented in ABAQUS to model the FRP-to-concrete bond behavior in the
single shear test. A number of other damage models have also been investigated and their
predictions as well as results from the proposed damage model have been compared with test
data. The results have shown that the proposed model can accurately predict the bond
behavior in the entire loading process and the numerical predictions are in closer agreement
with test data from the literature than other models. The FE model also predicts that an
increase of the bond length can lead to a small increase of the loading capacity even when the
FRP bond length is larger than the effective bond length, as observed in some experiments.
ACKNOWLEDGMENTS
The first author acknowledges financial support received from the Research Grants of Xi’an
University of Architecture and Technology (Project No: DB01153).
REFERENCES
ABAQUS (2007). ABAQUS Analysis user's manual, version 6.7.
ACI 318 (2002). "Building Code Requirements for Structural Concrete and Commentary ",
ACI Committee 318.
Ali-Ahmad, M., Subramaniam, K. and Ghosn, M. (2006). "Experimental Investigation and
Fracture Analysis of Debonding between Concrete and FRP Sheets." Journal of Engineering
Mechanics, 132(9), 914-923.
Bažant, Z. and Jaime, P. (1998). Fracture and Size Effect in Concrete and Other Quasibrittle
Materials CRC Press, Boca Raton, Florida.
Bažant, Z. and Oh, B. (1983). "Crack band theory for fracture of concrete." Materials and
Structures, 16(3), 155-177.
Benvenuti, E., Vitarelli, O. and Tralli, A. (2012). "Delamination of FRP-reinforced concrete
by means of an extended finite element formulation." Composites Part B: Engineering, 43(8),
3258-3269.
Benzarti, K., Freddi, F. and Frémond, M. (2011). "A damage model to predict the durability
of bonded assemblies. Part I: Debonding behavior of FRP strengthened concrete structures."
Construction and Building Materials, 25(2), 547-555.
Camata, G., Spacone, E., Al-Mahaidi, R. and Saouma, V. (2004). "Analysis of Test
Specimens for Cohesive Near-Bond Failure of Fiber-Reinforced Polymer-Plated Concrete."
Journal of Composites for Construction, 8(6), 528-538.
CEB-FIB (1991). "CEB-FIB MODEL CODE 1990." Thomas Telford.
Chen, G. M., Chen, J. F. and Teng, J. G. (2012). "On the finite element modelling of RC
beams shear-strengthened with FRP." Construction and Building Materials, 32, 13-26.
Chen, G. M., Teng, J. G. and Chen, J. F. (2011). "Finite-Element Modeling of Intermediate
Crack Debonding in FRP-Plated RC Beams." Journal of Composites for Construction, 15(3),
339-353.
Chen, J. F. and Pan, W. K. (2005). "Three dimensional stress distribution in FRP-to-concrete
bond test specimens." Construction and Building Materials, 20(1-2), 46-58.
Chen, J. F. and Teng, J. G. (2001). "Anchorage Strength Models for FRP and Steel Plates
Bonded to Concrete." Journal of Structural Engineering, 127(7), 784-791.
Chen, J. F., Yang, Z. J. and Holt, G. D. (2001). "FRP or steel plate-to-concrete bonded joints:
effect of test methods on experimental bond strength." Steel Compos Struct 1(2), 231-244.
Chen, J. F., Yuan, H. and Teng, J. G. (2007). "Debonding failure along a softening FRP-to-
concrete interface between two adjacent cracks in concrete members." Engineering Structures,
29(2), 259-270.
Cicekli, U., Voyiadjis, G. Z. and Abu Al-Rub, R. K. (2007). "A plasticity and anisotropic
damage model for plain concrete." International Journal of Plasticity, 23(10-11), 1874-1900.
Coronado, C. A. and Lopez, M. M. (2007). "Damage Approach for the Prediction of
Debonding Failure on Concrete Elements Strengthened with FRP." Journal of Composites for
Construction, 11(4), 391-400.
Coronado, C. A. and Lopez, M. M. (2008). "Experimental Characterization of Concrete-
Epoxy Interfaces." Journal of Materials in Civil Engineering, 20(4), 303-312.
Coronado, C. A. and Lopez, M. M. (2010). "Numerical Modeling of Concrete-FRP
Debonding Using a Crack Band Approach." Journal of Composites for Construction, 14(1),
11-21.
Diab, H. and Wu, Z. (2007). "Nonlinear constitutive model for time-dependent behavior of
FRP-concrete interface." Composites Science and Technology, 67(11-12), 2323-2333.
Figure 7. Compression damage models for 1 mm element size and concrete strength as of specimen II-5 in
Yao et al. (2005)
0
2
4
6
8
10
12
0 0.2 0.4 0.6 0.8 1 1.2 1.4 1.6
Slip at the loaded end (mm)
Lo
ad (
kN)
Test (II-5 in Yao et al. (2005))Present modelTensile damage model from Chen et al. (2011)Tensile damage model from Yu et al. (2010)Tensile and compressive damage model from Yu et al. (2010)Shear retention model (n=5) from Rots (1988)No tension and compressive damage model involved
Simulation using Chen et al. 's (2011)damage model terminated due toconvergence difficulties.
(a) Specimen II-5 in Yao et al. (2005)
0
2
4
6
8
10
12
14
16
18
20
22
24
26
28
0 0.1 0.2 0.3 0.4 0.5 0.6 0.7 0.8 0.9 1 1.1Slip at the loaded end (mm)
Lo
ad (
kN)
Test (Specimen No.1 in Ali-Ahmad et al. (2006))Present modelTensile damage model from Chen et al. (2011)Tensile damage model from Yu et al. (2010)Tensile and compressive damage model from Yu et al. (2010)Shear retention model (n=5) from Rots (1998)No tension and compressive damage model involved
Simulation using Chen et al. 's (2011)damage model terminated due toconvergence difficulties.
(b) Specimen No. 1 in Ali-Ahmad et al. (2006)
Figure 8. Effect of damage model on FE predicted load-slip curve
0
2
4
6
8
10
12
14
16
0 0.2 0.4 0.6 0.8 1 1.2 1.4 1.6Slip at the loaded end (mm)
Lo
ad (
kN)
Test (II-5 in Yao et al. (2005))
Present model
Shear retention model (n=5) from Rots (1988)
Shear retention model (n=2) from Rots (1988)
Shear retention model (n=0.5) from Rots (1988)
(a) Specimen II-5 in Yao et al. (2005)
0
2
4
6
8
10
12
14
16
18
20
22
24
0 0.1 0.2 0.3 0.4 0.5 0.6 0.7 0.8 0.9 1 1.1Slip at the loaded end (mm)
Lo
ad (
kN)
Test (No.1 in Ali-Ahmad et al. (2006)Present modelShear retention model (n=5) from Rots (1988)Shear retention model (n=2) from Rots (1988)Shear retention model (n=1) from Rots (1988)Shear retention model (n=0.5) from Rots (1988)
(b) Specimen No. 1 in Ali-Ahmad et al. (2006)
Figure 9. Effect of coefficient n in Rots’ (1988) shear retention model on predicted load-slip curve
y = 0.991xR2 = 0.964
0
2
4
6
8
10
12
14
16
18
20
0 2 4 6 8 10 12 14 16 18 20
FE prediction (kN)
Tes
t (k
N)
Test dataLinear regression
Figure 10. Comparison of FE prediction with test results
0
1
2
3
4
5
6
7
8
0 0.1 0.2 0.3 0.4 0.5 0.6 0.7 0.8 0.9 1Slip at the loaded end (mm)
Lo
ad (
kN
)
Test
FE
Analytical result from Yuan et al. (2004)Point A
Point B
Point C
Point D
Point E
Point F Point GPoint H Point I Point J
Figure 11. Comparison of FE prediction with test and analytical solution from Yuan et al. (2004): specimen
II-5 in Yao et al. (2005)
0123456789
1011121314
0 0.1 0.2 0.3 0.4 0.5 0.6 0.7 0.8 0.9
Slip at the loaded end (mm)
Lo
ad
(k
N)
TestFE
Point A-1
Point B-1
Point C-1
Point D-1
Point E-1 Point F-1 Point G-1 Point H-1 Point I-1
Figure 12. Comparison of FE prediction with test: specimen No. 1 in Ali-Ahmad et al. (2006)
0
1000
2000
3000
4000
5000
6000
7000
8000
0 25 50 75 100 125 150 175 200 225 250
Distance from the loaded end (mm)
Str
ain
in
FR
P (
mic
rost
rain
)
Test, P/Pu=1
FE, P/Pu=1
Test, P/Pu=0.79
FE, P/Pu=0.79
Test, P/Pu=0.51
FE, P/Pu=0.51
Test, P/Pu=0.28
FE, P/Pu=0.28
Figure 13. FE prediction and test FRP stain for specimen S-CFS-400-25 in Wu et al. (2001)
0
200
400
600
800
1000
1200
1400
1600
1800
2000
2200
0 20 40 60 80 100 120 140 160 180 200
Distance from loaded end (mm)
Axi
al s
tres
s in
FR
P (
MP
a)
Test (Point B, 2.26 kN)Analytical result from Yuan et al. (2004) (2.26 kN)Present model (2.26 kN)Test (Point E, 5.53 kN)Analytical result from Yuan et al. (2004) (5.53 kN)Present model (5.53 kN)Test (Point G, 5.74 kN)Analytical result from Yuan et al. (2004) (5.74 kN)Present model (5.74 kN)
Figure 14. FE prediction, test and analytical solution of FRP axial stresses for specimen II-5 in Yao et al. (2005)
corresponding to Points B, E and G on the load-slip curve in Fig. 11


![USE OF FINITE ELEMENT METHOD FOR SIMULATION …zbornik/doc/NS2017.024.pdf · Abaqus with the name Concrete Damaged Plasticity (CDP) [5]. This model is a continuum, plasticity-based,](https://static.documents.pub/doc/80x56/5ab705c57f8b9ab47e8e812e/use-of-finite-element-method-for-simulation-zbornikdocns2017024pdfabaqus.jpg)


