1 CONDITION MONITORING OF HELICAL GEARS USING AUTOMATED SELECTION OF FEATURES AND SENSORS H. Alkhadafe 1 , A. Al-Habaibeh 2 and A. Lotfi 1 1 School of Science and Technology, Nottingham Trent University, Nottingham, UK [email protected], [email protected]2 Innovative and Sustainable Built Environment Technologies (iSBET), Product Design, Nottingham Trent University, Nottingham, UK [email protected]ABSTRACT The selection of most sensitive sensors and signal processing methods is essential process for the design of condition monitoring and intelligent fault diagnosis and prognostic systems. Normally, sensory data includes high level of noise and irrelevant or redundant information which makes the selection of the most sensitive sensor and signal processing method a difficult task. This paper introduces a new application of the Automated Sensor and Signal Processing Approach (ASPS), for the design of condition monitoring systems for developing an effective monitoring system for gearbox fault diagnosis. The approach is based on using Taguchi's orthogonal arrays, combined with automated selection of sensory characteristic features, to provide economically effective and optimal selection of sensors and signal processing methods with reduced experimental work. Multi- sensory signals such as acoustic emission, vibration, speed and torque are collected from the gearbox test rig under different health and operating conditions. Time and frequency domain signal processing methods are utilised to assess the suggested approach. The experiments investigate a single stage gearbox system with three level of damage in a helical gear to evaluate the proposed approach. Two different classification models are employed using neural networks to evaluate the methodology. The results have shown that the suggested approach can be applied to the design of condition monitoring systems of gearbox monitoring without the need for implementing pattern recognition tools during the design phase; where the pattern recognition can be implemented as part of decision making for diagnostics. The suggested system has a wide range of applications including industrial machinery as well as wind turbines for renewable energy applications. Keywords: Condition monitoring; Gearbox; ASPS; Taguchi’s method; Acoustic emission; Vibration analysis; Wavelet; Wind energy. 1 INTRODUCTION: This paper introduces a novel application of the Automated Sensor and Signal Processing Approach (ASPS) [1], for the design of condition monitoring systems for developing an effective monitoring system for gearbox fault diagnosis. A gearbox system is one of the most significant components in rotating machinery and has been widely used in many industrial applications to transfer speed and power to other parts of the power train in high efficiency, this includes industrial machinery as well as wind turbines for renewable energy applications. A gearbox system is subject to many influencing factors that have negative impact on its performance such as improper installation, lack of lubrication, material fatigue and damage caused by wear and catastrophic breakage. These negative factors could lead to progressive deteriorations of the health condition of rotating machines and increase in energy consumption, causing an unexpected machine down time which may lead to substantial economic losses [2]. The industrial community aspires to get effective and reliable sensing tools to monitor the health conditions of machinery and capture structural defects at their initial stages to provide suitable diagnostics and prognostics. Sensors, such as vibration and sound, are usually used to provide the
Transcript
1
CONDITION MONITORING OF HELICAL GEARS USING AUTOMATED SELECTION OF FEATURES AND SENSORS
The selection of most sensitive sensors and signal processing methods is essential process for the design of condition monitoring and intelligent fault diagnosis and prognostic systems. Normally, sensory data includes high level of noise and irrelevant or redundant information which makes the selection of the most sensitive sensor and signal processing method a difficult task. This paper introduces a new application of the Automated Sensor and Signal Processing Approach (ASPS), for the design of condition monitoring systems for developing an effective monitoring system for gearbox fault diagnosis. The approach is based on using Taguchi's orthogonal arrays, combined with automated selection of sensory characteristic features, to provide economically effective and optimal selection of sensors and signal processing methods with reduced experimental work. Multi- sensory signals such as acoustic emission, vibration, speed and torque are collected from the gearbox test rig under different health and operating conditions. Time and frequency domain signal processing methods are utilised to assess the suggested approach. The experiments investigate a single stage gearbox system with three level of damage in a helical gear to evaluate the proposed approach. Two different classification models are employed using neural networks to evaluate the methodology. The results have shown that the suggested approach can be applied to the design of condition monitoring systems of gearbox monitoring without the need for implementing pattern recognition tools during the design phase; where the pattern recognition can be implemented as part of decision making for diagnostics. The suggested system has a wide range of applications including industrial machinery as well as wind turbines for renewable energy applications.
This paper introduces a novel application of the Automated Sensor and Signal Processing Approach (ASPS) [1], for the design of condition monitoring systems for developing an effective monitoring system for gearbox fault diagnosis. A gearbox system is one of the most significant components in rotating machinery and has been widely used in many industrial applications to transfer speed and power to other parts of the power train in high efficiency, this includes industrial machinery as well as wind turbines for renewable energy applications. A gearbox system is subject to many influencing factors that have negative impact on its performance such as improper installation, lack of lubrication, material fatigue and damage caused by wear and catastrophic breakage. These negative factors could lead to progressive deteriorations of the health condition of rotating machines and increase in energy consumption, causing an unexpected machine down time which may lead to substantial economic losses [2]. The industrial community aspires to get effective and reliable sensing tools to monitor the health conditions of machinery and capture structural defects at their initial stages to provide suitable diagnostics and prognostics. Sensors, such as vibration and sound, are usually used to provide the
2
information needed which is directly associated with the operational conditions of the gearbox. Vibration and acoustic emission signals based analysis are the most commonly used techniques to monitoring the condition of gearbox systems. Even though these signals could offer useful inputs to a condition monitoring and diagnostic system, they usually are submerged with large amount of noise. Therefore, the raw signals are often inappropriate for monitoring purposes. In order to extract valuable information from sensory signals, several stages of signal processing and data analysis are normally required to reveal particular patterns from the machining signals, which may be linked to a specific physical phenomena or fault condition [3].
By applying suitable data analysis methods, it could detect abnormal changes in signals generated by fault components that may lead to making effective decisions about the gearbox health status. However, sensory data sometimes contains high proportion of irrelevant and redundant information which may have greatly impact on the performance of fault classification model. Therefore, feature selection (i.e. processed information from a sensor(s) using a specific signal processing method(s)) becomes very necessary for machine learning tasks when facing high dimensional data. Feature extraction and selection techniques can be considered as the most significant step for intelligent fault diagnosis systems. Feature extraction is a process of transforming sensory data from the measured signal space to the feature space. Representative features associated with the conditions of machinery components should be extracted by using appropriate signal processing approaches [4].
Various signal processing techniques including time and frequency domains such as Fast Fourier Transform (FFT), envelope spectrum analysis, wavelet analysis, empirical mode decomposition (EMD) have been employed in literature to process multi-sensory signals [5]. Normally, based on these signal processing techniques, statistic calculation methods such as autoregressive model (AR) [6], S transform[7], singular value decomposition (SVD) [8], principal component analysis (PCA) [9] and independent component analysis (ICA) [10] are employed to extract reliable features [11].
Although several techniques have been proposed in literature for feature extraction, not all these feature extraction techniques always produce efficient features necessary to detect health conditions of the gearbox. In reality, efficiency of features extraction methods is highly dependent on the problem itself. Which means, features extracted by one method may conduct extremely well for some problems, but may not perform well for others. Faults of rotating machinery, particularly in gearbox systems, are complex [12]. Therefore, the designers tend to select the most sensitive features and sensors manually and individually. It is still remaining a challenge to implement an automated design process for a condition monitoring and fault diagnostic system in industry due to the complexity of rotating machinery structures and operating conditions. An automated design system for condition monitoring should provide automatically the following tasks [1, 13] :
1. Selecting the appropriate number and type of sensors in every individual case;
2. Selecting effective signal processing and feature selection methods;
3. The design of an effective fusion model (i.e., the combination of sensors and signal processing methods which gives an improved performance);
4. Cutting the cost of condition monitoring of gearbox systems while maintaining the reliability and performance of the system;
5. Reducing the experimental or the time needed to achieve this.
This paper attempts to investigate this problem by applying several signal processing and features selection techniques to find the most sensitive features (and sensors) for fault diagnosis for the gearbox system under consideration. A novel implementation and modification of the ASPS approach ( automated sensor and signal processing selection) [1, 13] is investigated to resolve these issues using an automated approach to select effective sensors and related signal processing methods for gearbox system. The ASPS is also aiming to cut down the number of the practical experiments with rapid improvement and economical design of condition monitoring systems for gearbox. This paper
3
investigates whether the ASPS approach, with the required modification, can provide a suitable solution to the design of gearbox monitoring. The key question here is if the suggested approach can provide a simple, automated, systematic and generalised, methodology to design an adaptive condition monitoring system for rotating machinery. This study will provide an extensive assessment of the ASPS approach for gearbox fault diagnosis. The progression of a helical gear tooth damage is investigated by testing three levels of damage. Raw sensory signals are processed and analysed using various signal processing techniques in the time and frequency domains. Combinations of mathematical and statistical features extraction techniques are applied. The ASPS approach is investigated in its capability for the selection of the most sensitive features and sensors to gearbox faults; and it is used to ignore irrelevant and redundant information. The optimal features are examined and evaluated by supervised and unsupervised neural networks.
2 THEORETICAL BACKGROUND OF THE ASPS APPROACH AND TAGUCHI'S METHOD
2.1 The ASPS approach
The purpose of the ASPS algorithm is to design a condition monitoring system using an automated simple procedure to identify from simplification of the sensory signals, the most sensitive Sensory Characteristic Features (SCFs) which are most sensitive or have high dependency on the abnormal condition variable such as the faults in the gearbox system. And at the same time the SCFs should have less dependency on other machine parameters such as torque or speed. The SCFs provide essential information for classification or detection of machine and process faults.
The introduced approach applies the “black box'' [1, 13], concept, see Figure 1, where the condition monitoring system is constructed based on the input and output parameters of the process instead of its mechanics. This concept, has been argued that it can be applied for diversity of condition monitoring systems regardless of the physical characteristics. In this way, it is only required to relate some information in the signals (i.e., SCFs) to the identified faults or conditions. Figure 1 presents the main idea of the ASPS approach and its implementation in gearbox system. The key aspect here is to search for sensory characteristic features (SCFs) that are dependent on the health states of the process and less dependent on the operating conditions.
Figure 2 presents a simplified block diagram of the ASPS approach using Taguchi method for gear monitoring. It has been argued by [1, 13] that the ASPS approach in general should have the capability to transfer the design of condition monitoring problem from being a specific problem for a specific application to a more general problem that can be described in generic terms and the solution might be provided for different groups of processes that have specific criteria in common. This theory will be put to the test in this research work for gear monitoring. If the sensitivity of each SCF can be calculated using an appropriate method, a sensitivity matrix, named the Association Matrix (ASM), can be used to indicate the sensitivity of each SCF (i.e. each sensor and signal processing method) to the fault under consideration. One of the methods to calculate the sensitivity of SCFs and reduce the required experimental work is Taguchi’s method. The ASPS approach starts by extracting SCFs from a wide range of sensors using a wide range of signal processing methods. The SCFs are then arranged in a 3D matrix, namely SFM (Sensory Feature Matrix). Then Taguchi’s method can be used to extract the dependency of each feature on the health conditions of the gearbox. SCFs are arranged based on their dependency (i.e. sensitivity) and high dependency features are then selected to design the condition monitoring system. The less significant SCFs are discarded from the designed condition monitoring system, keeping the sensitive SCFs to the fault under consideration. Then, cost reduction phase could be implemented to exclude the sensors that are less utilised in order to reduce the cost of the monitoring system whereas maintaining the system's performance within its reasonable range. As shown in Figure 2, neural networks will then be used to test the hypothesis that high dependency indicates high sensitivity to health conditions based on the performance of the neural network.
4
For years, Taguchi's method of Orthogonal Arrays (OAs) has been applied to design a short test for quality control applications. This has been done, either on or off-line, to reduce the number of experimental work required. Similar to quality variables, the ASPS approach uses the SCFs as variables and their dependency value of Taguchi's OAs are used as measurement for sensitivity of the SCFs to detect process or machine faults. This is in order to discover the most sensitive SCFs to the faults under investigation. The condition monitoring system is designed based on a number of SCFs in order to select the most sensitive group of SCFs, which represent high dependency on the observed faults. For example, as will be discussed later, this research work has shown that the damage on helical gear tooth will result in a steady increase in the root mean square (RMS) values of the vibration signal. Therefore, RMS of the vibration signal can be used a Sensory Characteristic Feature (SCF) for the design of the condition monitoring system.
Figure 1: “The block box” concept and the method it can be applied to diagnose the fault in gearbox system
Figure 2: A simlified block diagram of the ASPS appraoch using Taguchi method for gear monitoring.
2.2 Taguchi's OAs
Taguchi's theory based on OAs is usually applied to reduce the number of experiments in order to optimise the quality of the process [14]. The main concept behind Taguchi's method is to utilise the least possible number of experiments rather than the whole full factorial technique to calculate the individual
5
contribution of each dependent variable in the experiment reference to the impendent variables or parameters. In Taguchi’s method the dependency means that the proportion of contribution values gained by analysing the variance. The dependency of a dependent variable on a factor (i.e. an independent variable) reflects the portion of the total variation observed in an experiment attributed to that factor. Taguchi's method using the ASPS approach based on the SCFs obtained from the sensory data captured from gearbox system to calculate their dependencies (sensitivities) on the investigated machine faults. SCFs with high dependency on the machinery faults, rather than the machinery parameters, are potential candidates for use in the monitoring system.
The percentage contribution (P) of a factor (F) can be expressed as follows [13]:
PSS V v
SSFF e F
T
100 (1)
Where FSS is the sum of squares and TSS is the relative percent to total sum of square, mathematically can be expressed as:
M
T
n
FSS
FK
i Fi
iF
2
1
2
and M
TySS
N
iiT
2
1
2
(2, 3)
Ve is the variance due to the error and is given by
V
SS SS
M ve
T FF
FF
1 (4)
where:
y : observation (i.e. sensory characteristic feature (SCF) value)
T: sum of all observations (i.e. sum of all sensory characteristic feature (SCF) values)
F: factor (i.e. gears health conditions, gear box shaft speed, and shaft torque)
KF : number of levels for factor F (i.e. KF =3 in this research)
M : total number of observations (i.e. M=9 in this research)
vF : is number of degrees of freedom associated with factor F; vF = KF -1
Fi : sum of observations under the ith level of factor F.
nFi : number of observations y under level I of factor F.
6
In order for the approach to be useful for gear monitoring, two main assumptions need to be tested, i.e.:
1. Partial number of runs using Taguchi’s method is sufficient to design the monitoring system for the gearbox running with full factorial parameters.
2. SCFs with high dependency values to a gear fault have high sensitivity to that fault.
3 THE EXPERIMENTAL DETAILS
3.1 The experimental set-up
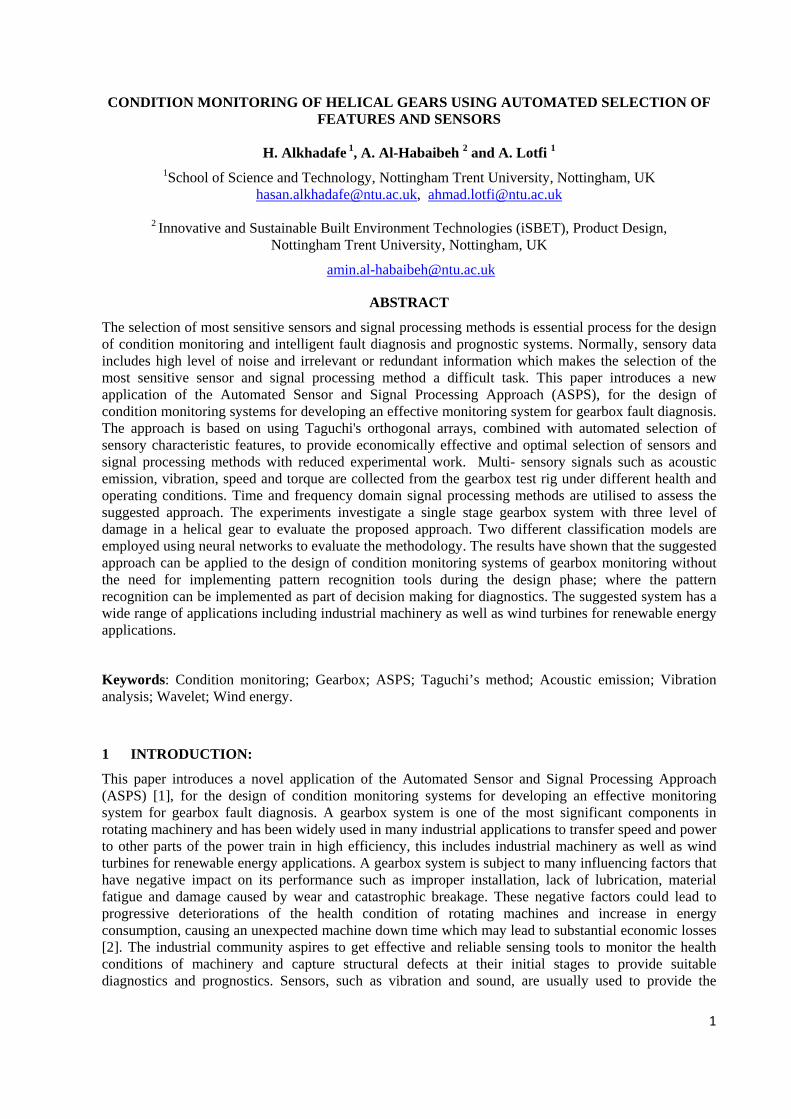
The gearbox test rig, shown in Figures 3 and 4, is utilised to collect the sensory signals namely vibration (VIB1, VIB2, VIB3), acoustic emission (AE1, AE2), speed and torque (SP1, SP2, TORQ1, TORQ2). The signals are collected under different gear health conditions for an attempt to develop a reliable condition monitoring system for gearbox conditions. The gearbox test rig includes a three phase AC drive motor which is used to drive the gearbox which in turn is used to lead the DC motor generator to create the necessary load. The load is applied through the DC motor generator. Two speed and torque transducers are attached between the input/output shafts of the gearbox and the AC-motor/DC-generator shafts. The gearbox system contains bearing, shaft and two types of gears, bevel gear and helical gear but the research will focus on the helical gear. The axes of the shaft and gears are supported by two ball bearings. All components are placed in an oil basin in order to ensure proper lubrication. The vibration signals are recorded by three accelerometers (Kistler 8704B500) which are mounted at three different locations on the housing of the gearbox system which are connected to 4-channel-couplers (Kistler 5134). AE sensor (Kistler 8152A) is installed on the case shell of the gearbox which is connected to the AE-Piezotron coupler type (Kistler 5125). The AE sensor produces two signals: a raw signal and an RMS signal. The speed and torque sensors are type M420 rotary torque transducer from Datum Electronics and each sensor produces speed and torque signals. Therefore, the total number of physical sensors are 6, producing 9 sensory signals (3 vibration, 2 acoustic emission, 2 speed and 2 torque signals). Output signals of the sensors are sent to a data acquisition card (National Instrument USB DAQ6259) which is connected to a computer. This device can capture both analogue and digital signals. It has 32 analogue inputs (16-bit) with maximum sampling rate of 1.25 MS/s. The gearbox is made and provided by Chemineer Ltd.
Figure 3: A schematic diagram of the mechanical system and the condition monitoring system.
7
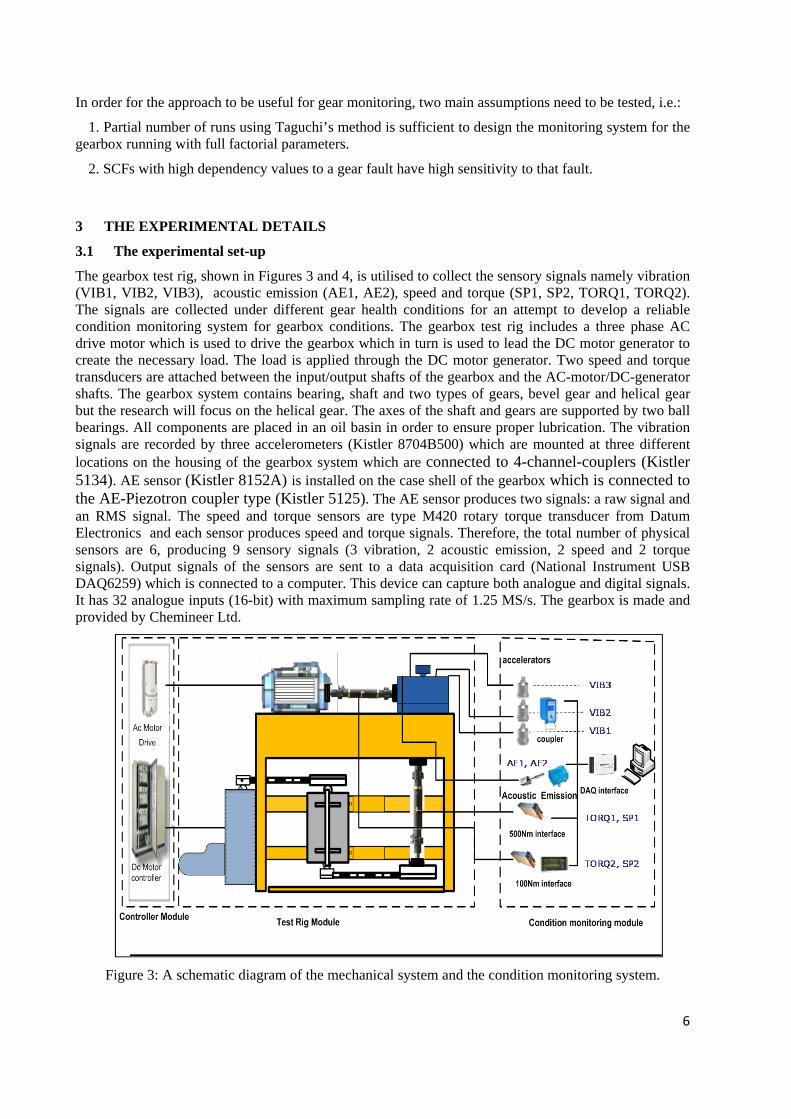
Figure 4: An image of the complete mechanical system and data acquisition system
3.2 The experimental methodology and conditions
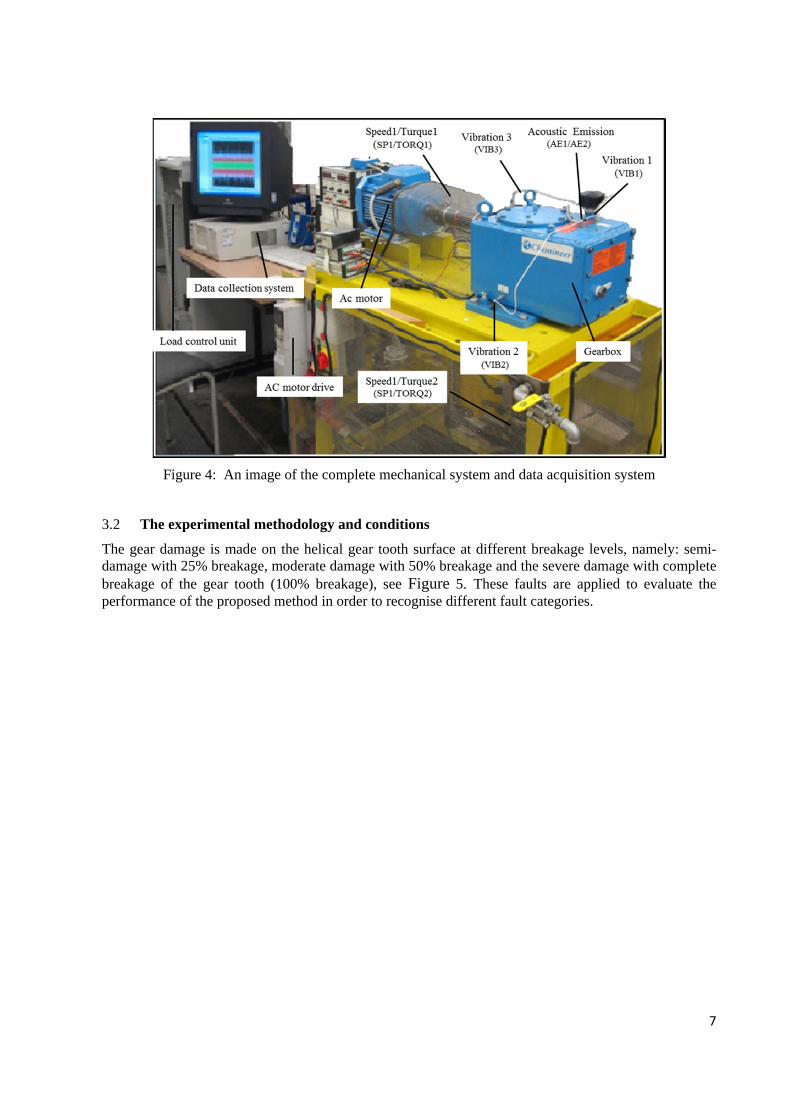
The gear damage is made on the helical gear tooth surface at different breakage levels, namely: semi-damage with 25% breakage, moderate damage with 50% breakage and the severe damage with complete breakage of the gear tooth (100% breakage), see Figure 5. These faults are applied to evaluate the performance of the proposed method in order to recognise different fault categories.
8
Figure 5: Helical gear with different levels of damage.
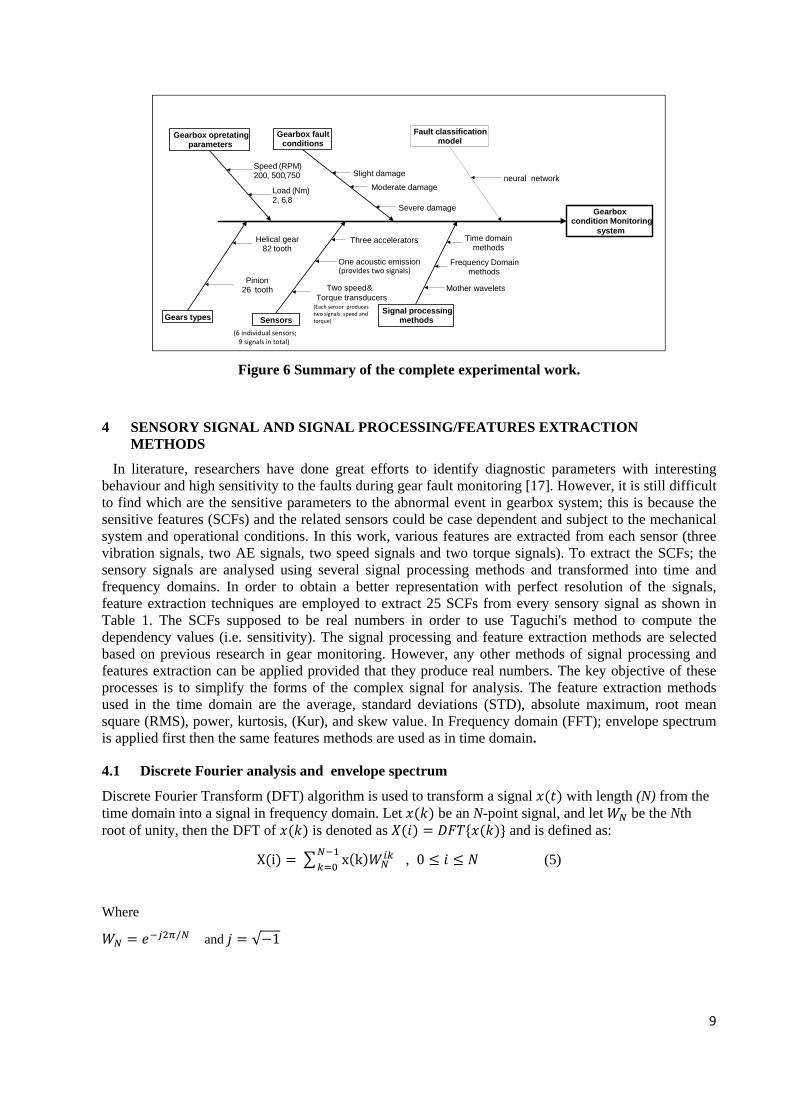
Figure 6 shows the summary of the complete study. Signals have been collected from all the sensors with a sampling frequency up to 500 KHz. The work done with three speed conditions of the driving motor (i.e. 200, 500 and 750 RPM) and adjusting load conditions with three levels applied by the load motor as displayed by the torque sensor. The applied load at the output shaft of the gearboxes is 2, 6 and 8 Nm. A full factorial test of the parameters requires 27 runs for every gearbox condition. However, the proposed application of Taguchi's method can reduce the number of runs to 9 runs using the L9 table [15]. For the three conditions of the helical gear, the experimental programme involved 9 runs based on OAs (L9) and a further 27 full factorial runs to the test the theory, see Appendix 1. The experimental 9 test is used for the design process as well as training the neural networks. The full factorial test is used to test the capability of two neural networks to recognise the gear conditions. Fours different sets of data are tested to check for consistency.
In other previous studies, see for example [16], various crack propagation scenarios in gears were investigated using vibration signal analysis. In this study, the authors take into consideration such studies by examining three levels of damage to simplify the design to select the most suitable sensors. In real industrial environment, gears with different levels of faults could be rapidly tested to evaluate the most sensitive sensor and signal processing methods and design the condition monitoring system for long term performance.
9
Figure 6 Summary of the complete experimental work.
4 SENSORY SIGNAL AND SIGNAL PROCESSING/FEATURES EXTRACTION METHODS
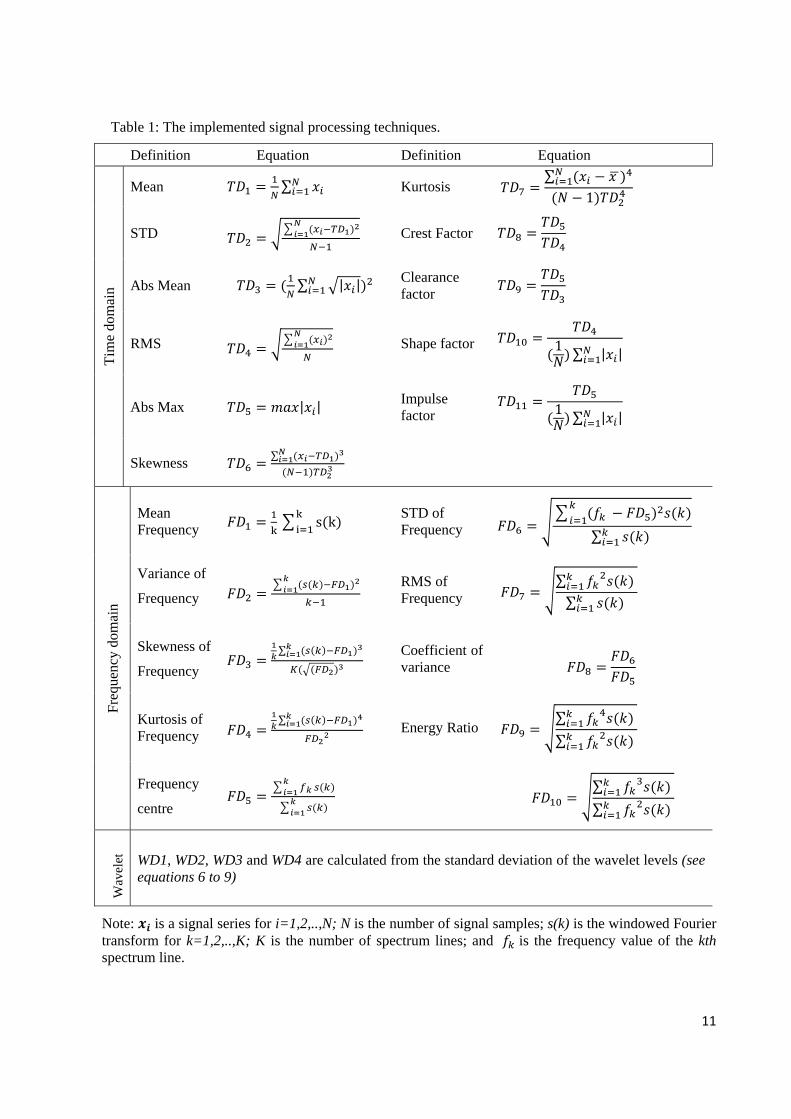
In literature, researchers have done great efforts to identify diagnostic parameters with interesting behaviour and high sensitivity to the faults during gear fault monitoring [17]. However, it is still difficult to find which are the sensitive parameters to the abnormal event in gearbox system; this is because the sensitive features (SCFs) and the related sensors could be case dependent and subject to the mechanical system and operational conditions. In this work, various features are extracted from each sensor (three vibration signals, two AE signals, two speed signals and two torque signals). To extract the SCFs; the sensory signals are analysed using several signal processing methods and transformed into time and frequency domains. In order to obtain a better representation with perfect resolution of the signals, feature extraction techniques are employed to extract 25 SCFs from every sensory signal as shown in Table 1. The SCFs supposed to be real numbers in order to use Taguchi's method to compute the dependency values (i.e. sensitivity). The signal processing and feature extraction methods are selected based on previous research in gear monitoring. However, any other methods of signal processing and features extraction can be applied provided that they produce real numbers. The key objective of these processes is to simplify the forms of the complex signal for analysis. The feature extraction methods used in the time domain are the average, standard deviations (STD), absolute maximum, root mean square (RMS), power, kurtosis, (Kur), and skew value. In Frequency domain (FFT); envelope spectrum is applied first then the same features methods are used as in time domain.
4.1 Discrete Fourier analysis and envelope spectrum
Discrete Fourier Transform (DFT) algorithm is used to transform a signal with length (N) from the time domain into a signal in frequency domain. Let be an N-point signal, and let be the Nth root of unity, then the DFT of is denoted as and is defined as:
X i x k , 0 (5)
Where
/ and √ 1
(provides two signals)
(Each sensor produces two signals: speed and torque)
(6 individual sensors; 9 signals in total)
Gearboxcondition Monitoring
system
Gearbox opretating parameters
Sensors
Gearbox fault conditions
Signal processing methods Gears types
Speed (RPM)200, 500,750
Load (Nm)2, 6,8
Helical gear 82 tooth
Pinion26 tooth
Three accelerators
One acoustic emission
Two speed &Torque transducers
Time domainmethods
Frequency Domainmethods
Mother wavelets
Slight damage
Moderate damage
Severe damage
Fault classification model
neural network
10
Envelope spectrum is defined as a curve which envelopes the frequency-amplitude plane, obtained from Fourier magnitude spectrum. This curve could carry useful information about faults. Envelope spectrum analysis can be used for diagnostics and investigation of machinery where faults have an amplitude modulating effect on the characteristic frequencies of the machinery such faults in gearboxes [18][19]. In order to automate the selection process of the sensitive frequencies to the fault under investigation, the envelope spectrum is used as sensory feature for the system. The values of the envelop spectrum are normalised with respect to frequency amplitude. These features calculated using statistical methods as shown in Table 1.
4.2 Wavelet analysis
Wavelets are functions used to localise waves, which instead of oscillating forever similar to harmonic waves, they drop to zero rather quickly. Fourier analysis splits a signal into sine and cosine signals to many frequency components; while wavelet concept is to divide the main signal into number of versions by shifting and scaling the mother signal or wavelet. There are two types of wavelet transform which is discrete wavelet transform (DWT) and continuous wavelet transform (CWT) [20, 21]. In this research, the standard deviations of 4 level decomposition of wavelets are used as SCFs for the proposed monitoring system. For each level, the number of wavelet signals used to construct the signal equals to 2 where i is the level number. The dilation equation is used to define the basic scaling function φ x from which the D4 discrete wavelet original signal is calculated as following:
∑ 2 (6)
Where c(j) represents the wavelet coefficient and j the index. The primary wavelet signal is computed from the scaling function which is expressed as following:
∑ 1 1 2 (7)
The four coefficients for D4 wavelets are as follows:
0 1 √3 1 3 √3
2 3 √3 3 √3 1 (8)
For discrete D4 wavelets transformation the original function can be reconstructed form the equation:
∑ 1 ∑ ∑ , 2 1 9
The standard deviations (STD) are calculated from the wavelet levels (D4) and used as Features (SCFs) for the proposed monitoring system. The 4 wavelet SCFs are denoted as WD1–WD4.
11
Table 1: The implemented signal processing techniques.
Definition Equation Definition Equation
Tim
e do
mai
n
Mean ∑ Kurtosis ∑
1
STD Crest Factor
Abs Mean ∑ | | Clearance factor
RMS Shape factor 1 ∑ | |
Abs Max | | Impulse factor 1 ∑ | |
Skewness ∑
Fre
quen
cy d
omai
n
Mean Frequency s k
STD of Frequency
∑
Variance of
Frequency RMS of Frequency
∑ ∑
Skewness of
Frequency
∑
Coefficient of variance
Kurtosis of Frequency
∑ Energy Ratio
∑
∑
Frequency
centre
∑
∑
Wav
elet
WD1, WD2, WD3 and WD4 are calculated from the standard deviation of the wavelet levels (see equations 6 to 9)
Note: is a signal series for i=1,2,..,N; N is the number of signal samples; s(k) is the windowed Fourier transform for k=1,2,..,K; K is the number of spectrum lines; and is the frequency value of the kth spectrum line.
12
4.3 The verification of the ASPS approach for gear monitoring
Figure 7 presents the block diagram of the proposed method for diagnosing gear tooth surface damage using the ASPS approach. Firstly, information in the sensory signals are captured using 25 features (SCFs) described in Table 1 for the nine sensory signals. Secondly, the SCFs from all the sensors are combined, making the total number of features to be 225 (i.e. 25 × 9) for each gear condition. Thirdly, feature selection is conducted using the feature selection method described above using Taguchi’s method dependency values. Finally, the selected features are divided into subgroups (monitoring systems) and tested using neural networks for the relationship between average dependency and the diagnostic error from the neural networks.
Figure 7: The relationship between sensitivity value of SCFs and the classification error of the neural networks.
5 THE EXPERIMENTAL RESULTS
Sampled signals in time domain are difficult to be used directly as inputs to the condition monitoring system due to the complexity of the signals and the inclusion of significant noise levels. Therefore, SCFs have to be extracted before classification. Figures 8 and 9 present examples of the raw and FFT signals of the three conditions on helical gear for one of the vibration sensors. Notice the complexity of the raw signals and the need for a suitable signal processing method to improve and clarify its dependency on gear conditions.
13
Figure 8: Examples of the raw signals of vibration data for the four conditions of the gear.
Figure 9: Examples of FFT of vibration signals for the three conditions of the damaged gear
14
5.1 The ASPS analysis of the experimental work
The calculated Sensory Feature Matrix (SFM) for this test has dimensions of (9 x 25 x 9) thus presenting 9 sensory signals, signal processing methods and 9 runs of experiments is the L9 OA, see Appendix 1. For every feature located in the SFM matrix, the dependency on helical gear damage conditions is calculated and placed in the association matrix (ASM). Consequently, the ASM matrix for helical gear damage conditions has a size of 9 x 25, making a total of 225 SCFs. The dependency coefficients of the ASM are used as an indicator of the sensitivity of the features to gear conditions. The 225 SCFs are divided into 7 different groups/systems where each system contains 30 features. The features are arranged in a descending order so that system number 1 contains the SCFs of maximum dependencies while system number 7 groups contains the features of minimum dependency. The suggested number of 30 SCFs in every system is based empirically on the authors’ previous experience with condition monitoring and neural networks. Normally, such a range of inputs provides good identification and relatively fast training time. However, other values might also be used depending on the application and the neural networks topology. The monitoring systems with each consisting of 30 SCFs, includes SCFs from different sensors using different signal processing methods.
Figure 10 presents the Association Matrix (ASM) of the conducted analysis, which represents all SCFs obtained from the implemented sensors and signal processing methods. The colour map indicates clearly the dependency (i.e. sensitivity) of each individual SCF where the light colour indicates high sensitivity and dark colour represent low sensitivity. Each column is associated with a sensory signal and each row is associated with a signal processing method. The colour-map of the ASM can provide a clear indication of the most appropriate sensors and signal processing methods to monitor the fault under consideration.
A SCF can be presented as SCF(s, sp) where s is the sensor and sp is the signal processing method. It can be observed that among the SCFs, as shown in Figure 10, some are more sensitive than others. For example, from the general visual observation the SCF with high sensitivity to the gear damage is SCF(SP2, TD10); while SCF(VIB2, TD4) is not considered sensitive to the fault. Therefore, it can be assumed that ASPS based Taguchi method could help in finding the sensitivity of the sensory features for developing a reliable condition monitoring system with low cost and reduced time.
15
Figure 10: The Association Matrix (ASM) of the ASPS approach which indicates the sensitive sensors and signal processing methods in detecting gear faults using Taguchi’s dependency value as a sensitivity measure.
Each row and column of the ASM of Figure 10, could also indicate the average sensitivity of each implemented sensor and signal processing method. Figure 11 presents the SCFs arranged based on their dependency to 7 systems (groups of SCFs) of 30 features each, see Figure 12. Figures 13 and 14 represent the average sensitivity (dependency) values for the implemented sensors and signal processing methods respectively. The results show that, on average, sensors vibration 1 (VIB1), vibration 3 (VIB3), acoustic emission1 (AE1) and speed 2 (SP2) are the most reliable dominant sensors while TD10, TD5, FD9 and FD10 are the most dominant signal processing methods.
16
Figure 11: Based on the Association Matrix (ASM) of the ASPS, the features are ranked based on their dependency (sensitivity).
Figure 12: The average dependency of each system.
17
Figure 13: The average dependency of the implemented sensors.
Figure 14: The average dependency of the signal processing methods.
5.2 Neural networks classification
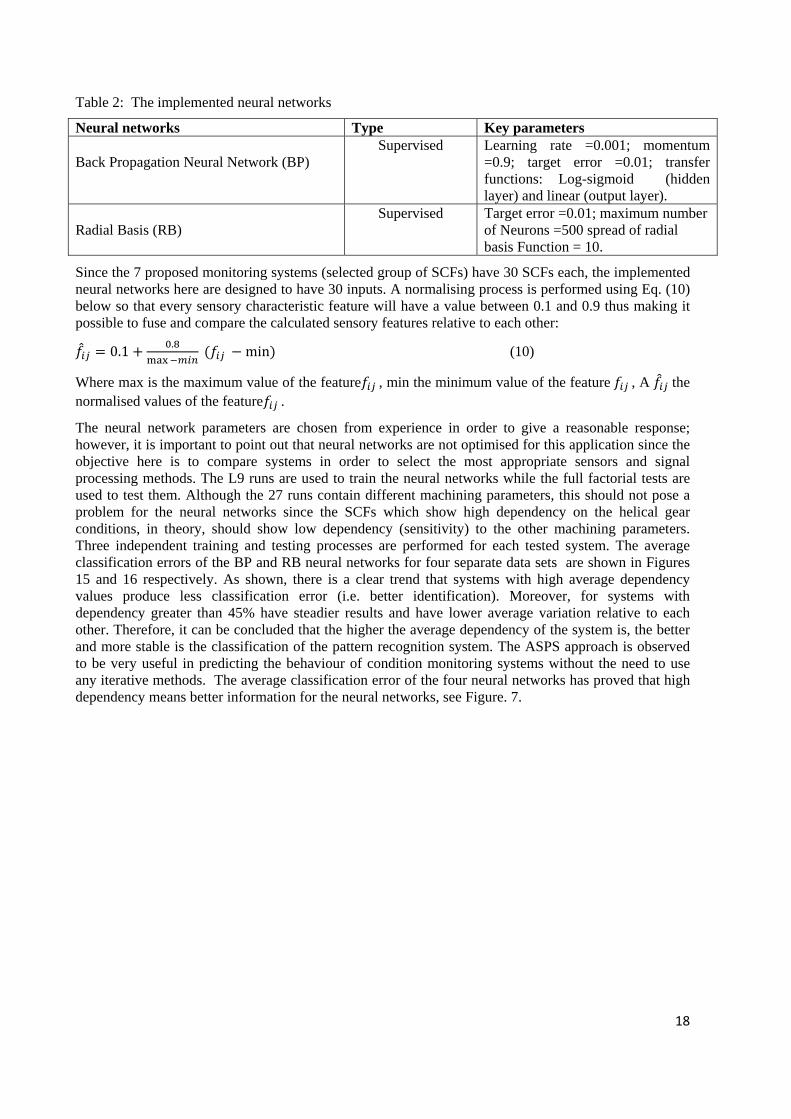
Two types of neural networks models are utilised to prove if the SCFs with high dependency can actually offer a greater sensitivity that should consequently result in better identification of abnormal patterns (see Figure 7). The implemented neural networks are two supervised neural networks, Back propagation [23] and radial basis (RB) [24], see Table 2 for details. Other neural networks such as competitive neural network (ELM) [25] and learning vector quantisation (LVQ) [26, 27] could also be used if necessary.
AE1 AE2 VIB 1 VIB 2 VIB 3 TORQ 1 SP 1 TORQ 2 SP 2
0
0.1
0.2
0.3
0.4
0.5
0.6
Sensory Signal
Average
of the norm
alised
sensitivity data
0
0.05
0.1
0.15
0.2
0.25
0.3
0.35
0.4
0.45
0.5
Signal Processing Method
Ave
rag
e o
f no
rma
lise
dse
nsi
tivity
dat
a
TD1
TD2
TD3
TD4
TD5
TD6
TD7
TD8
TD9
TD10
TD11
FD1
FD2
FD3
FD4
FD5
FD6
FD7
FD8
FD9
FD10
WD1
WD2
WD3
WD4
18
Table 2: The implemented neural networks
Neural networks Type Key parameters Back Propagation Neural Network (BP)
Supervised Learning rate =0.001; momentum =0.9; target error =0.01; transfer functions: Log-sigmoid (hidden layer) and linear (output layer).
Radial Basis (RB)
Supervised Target error =0.01; maximum number of Neurons =500 spread of radial basis Function = 10.
Since the 7 proposed monitoring systems (selected group of SCFs) have 30 SCFs each, the implemented neural networks here are designed to have 30 inputs. A normalising process is performed using Eq. (10) below so that every sensory characteristic feature will have a value between 0.1 and 0.9 thus making it possible to fuse and compare the calculated sensory features relative to each other:
0.1.
min (10)
Where max is the maximum value of the feature , min the minimum value of the feature , A the normalised values of the feature .
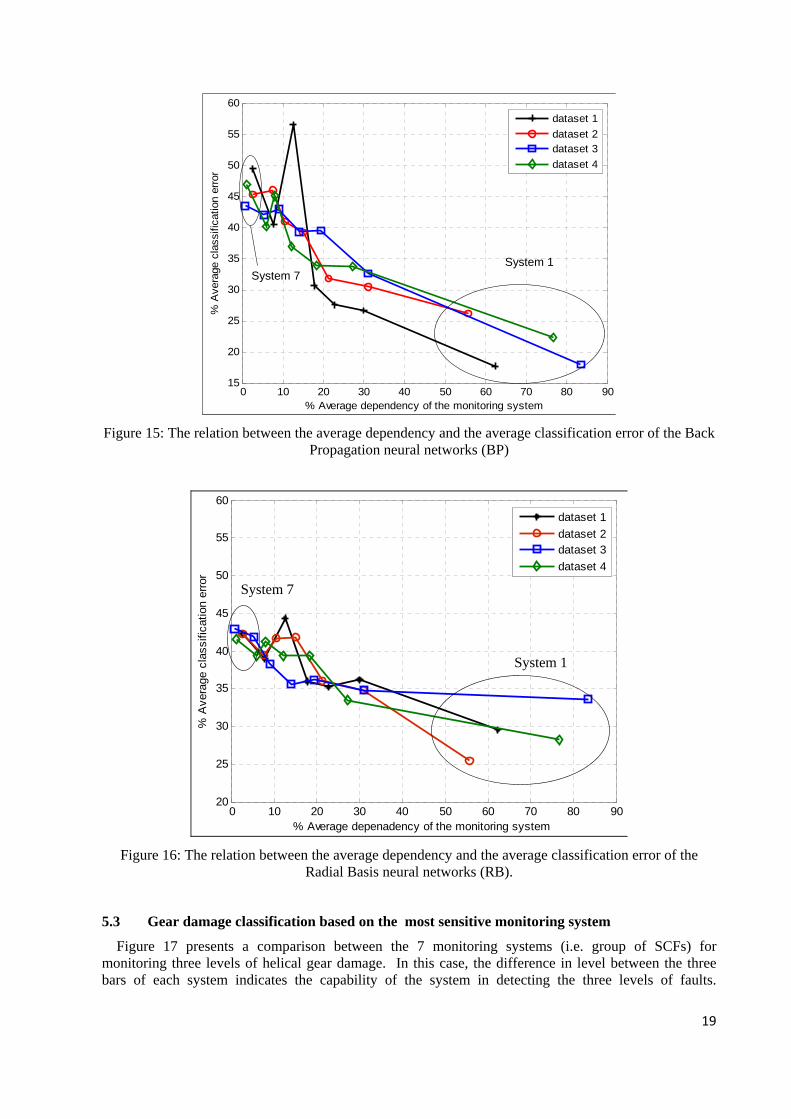
The neural network parameters are chosen from experience in order to give a reasonable response; however, it is important to point out that neural networks are not optimised for this application since the objective here is to compare systems in order to select the most appropriate sensors and signal processing methods. The L9 runs are used to train the neural networks while the full factorial tests are used to test them. Although the 27 runs contain different machining parameters, this should not pose a problem for the neural networks since the SCFs which show high dependency on the helical gear conditions, in theory, should show low dependency (sensitivity) to the other machining parameters. Three independent training and testing processes are performed for each tested system. The average classification errors of the BP and RB neural networks for four separate data sets are shown in Figures 15 and 16 respectively. As shown, there is a clear trend that systems with high average dependency values produce less classification error (i.e. better identification). Moreover, for systems with dependency greater than 45% have steadier results and have lower average variation relative to each other. Therefore, it can be concluded that the higher the average dependency of the system is, the better and more stable is the classification of the pattern recognition system. The ASPS approach is observed to be very useful in predicting the behaviour of condition monitoring systems without the need to use any iterative methods. The average classification error of the four neural networks has proved that high dependency means better information for the neural networks, see Figure. 7.
19
Figure 15: The relation between the average dependency and the average classification error of the Back Propagation neural networks (BP)
Figure 16: The relation between the average dependency and the average classification error of the Radial Basis neural networks (RB).
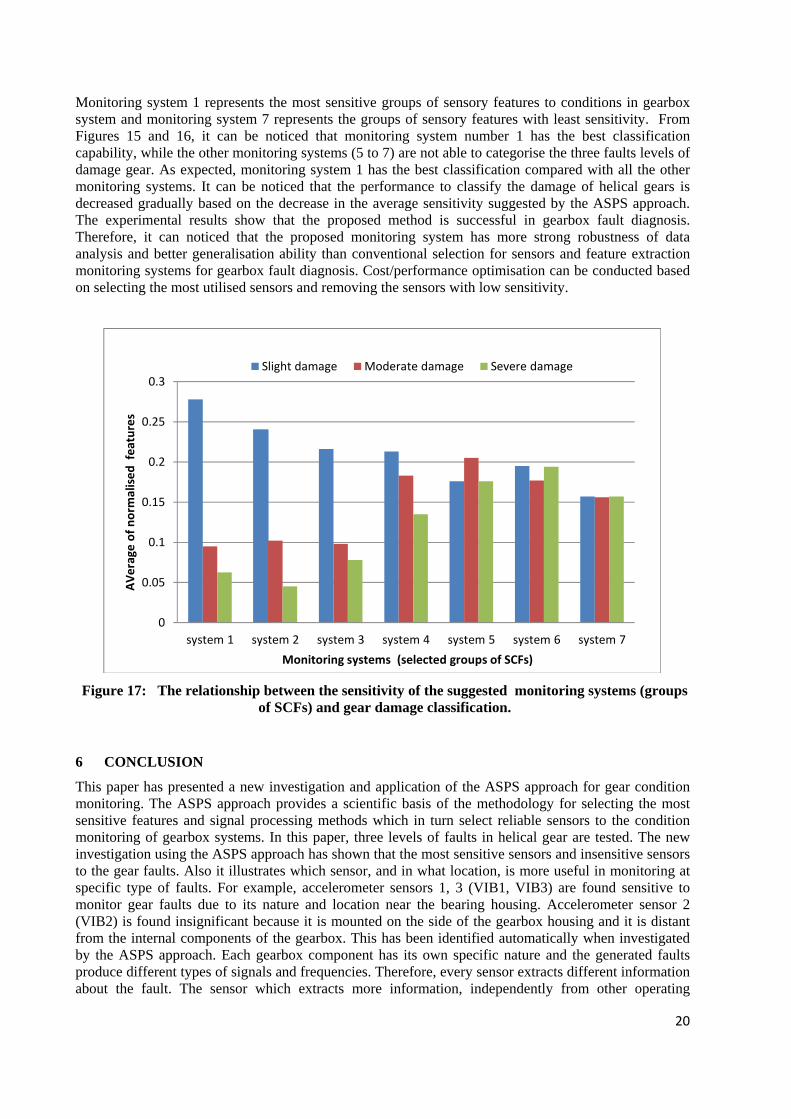
5.3 Gear damage classification based on the most sensitive monitoring system
Figure 17 presents a comparison between the 7 monitoring systems (i.e. group of SCFs) for monitoring three levels of helical gear damage. In this case, the difference in level between the three bars of each system indicates the capability of the system in detecting the three levels of faults.
0 10 20 30 40 50 60 70 80 9015
20
25
30
35
40
45
50
55
60
% Average dependency of the monitoring system
% A
vera
ge c
lass
ifica
tion
erro
r
dataset 1
dataset 2dataset 3
dataset 4
System 1System 7
0 10 20 30 40 50 60 70 80 9020
25
30
35
40
45
50
55
60
% A
vera
ge c
lass
ifica
tion
erro
r
% Average depenadency of the monitoring system
dataset 1
dataset 2dataset 3
dataset 4
System 1
System 7
20
Monitoring system 1 represents the most sensitive groups of sensory features to conditions in gearbox system and monitoring system 7 represents the groups of sensory features with least sensitivity. From Figures 15 and 16, it can be noticed that monitoring system number 1 has the best classification capability, while the other monitoring systems (5 to 7) are not able to categorise the three faults levels of damage gear. As expected, monitoring system 1 has the best classification compared with all the other monitoring systems. It can be noticed that the performance to classify the damage of helical gears is decreased gradually based on the decrease in the average sensitivity suggested by the ASPS approach. The experimental results show that the proposed method is successful in gearbox fault diagnosis. Therefore, it can noticed that the proposed monitoring system has more strong robustness of data analysis and better generalisation ability than conventional selection for sensors and feature extraction monitoring systems for gearbox fault diagnosis. Cost/performance optimisation can be conducted based on selecting the most utilised sensors and removing the sensors with low sensitivity.
Figure 17: The relationship between the sensitivity of the suggested monitoring systems (groups of SCFs) and gear damage classification.
6 CONCLUSION
This paper has presented a new investigation and application of the ASPS approach for gear condition monitoring. The ASPS approach provides a scientific basis of the methodology for selecting the most sensitive features and signal processing methods which in turn select reliable sensors to the condition monitoring of gearbox systems. In this paper, three levels of faults in helical gear are tested. The new investigation using the ASPS approach has shown that the most sensitive sensors and insensitive sensors to the gear faults. Also it illustrates which sensor, and in what location, is more useful in monitoring at specific type of faults. For example, accelerometer sensors 1, 3 (VIB1, VIB3) are found sensitive to monitor gear faults due to its nature and location near the bearing housing. Accelerometer sensor 2 (VIB2) is found insignificant because it is mounted on the side of the gearbox housing and it is distant from the internal components of the gearbox. This has been identified automatically when investigated by the ASPS approach. Each gearbox component has its own specific nature and the generated faults produce different types of signals and frequencies. Therefore, every sensor extracts different information about the fault. The sensor which extracts more information, independently from other operating
system 1 system 2 system 3 system 4 system 5 system 6 system 7
0
0.05
0.1
0.15
0.2
0.25
0.3
Monitoring systems (selected groups of SCFs)
AVerage
of norm
alised features
Slight damage Moderate damage Severe damage
21
conditions, is more likely to provide the sensitive SCFs for the monitoring system. The results confirm that only a partial number of the experimental tests are required in order to predict the machining condition for the full combinations of machining parameters and machining faults, without the need to fully investigate the physical phenomena of damage. This new investigation has proven that the ASPS approach [1, 13] can be implemented for gear monitoring reducing implementation time and selecting the most sensitive sensors and signal processing methods.
This paper has built on Taguchi’s statistical methods and the ASPS approach [1,13]. The paper does not claim to provide the ‘absolute optimum’ and general solution, but it is used to find the most sensitive features in every specific case based on Taguchi statistical methods and the relationship between variables and factors. Hence if a sensor or mechanical system is changed, the design process would need to be repeated. This approach is simply about finding the most sensitive features based on a particular situation with a particular sensors, signal processing methods and sensor locations. Other sensors and signal processing methods and techniques might be more or less sensitive than the selected ones in this study. However, such techniques, if there were to be integrated in the ASPS approach, the system should detect their sensitivity and rank them as suitable. Hence other signal processing and sensors could be integrated and their sensitivities to be tested in different scenarios; providing a rich algorithm for researchers.
7 REFERENCES
[1] A. Al-Habaibeh and N. Gindy, "A new approach for systematic design of condition monitoring systems for milling processes," J. Mater. Process. Technol., vol. 107, pp. 243-251, 11/22, 2000.
[2] T. H. Loutas, D. Roulias, E. Pauly and V. Kostopoulos, "The combined use of vibration, acoustic emission and oil debris on-line monitoring towards a more effective condition monitoring of rotating machinery," Mechanical Systems and Signal Processing, vol. 25, pp. 1339-1352, 5, 2011.
[3] T. H. Loutas, G. Sotiriades, I. Kalaitzoglou and V. Kostopoulos, "Condition monitoring of a single-stage gearbox with artificially induced gear cracks utilizing on-line vibration and acoustic emission measurements," Appl. Acoust., vol. 70, pp. 1148-1159, 9, 2009.
[4] B. Li, P. Zhang, H. Tian, S. Mi, D. Liu and G. Ren, "A new feature extraction and selection scheme for hybrid fault diagnosis of gearbox," Expert Syst. Appl., vol. 38, pp. 10000-10009, 8, 2011.
[5] H. Li and H. Zheng, "Bearing fault detection using envelope spectrum based on EMD and TKEO," in 2008 Fifth International Conference on Fuzzy Systems and Knowledge Discovery (FSKD), 2008, pp. 142-6.
[6] X. Wang and V. Makis, "Autoregressive model-based gear shaft fault diagnosis using the Kolmogorov–Smirnov test," J. Sound Vibrat., vol. 327, pp. 413-423, 11/13, 2009.
[7] B. Li, P. Zhang, H. Tian, S. Mi, D. Liu and G. Ren, "A new feature extraction and selection scheme for hybrid fault diagnosis of gearbox," Expert Syst. Appl., vol. 38, pp. 10000-10009, 8, 2011.
22
[8] Y. Jiang, B. Tang, Y. Qin and W. Liu, "Feature extraction method of wind turbine based on adaptive Morlet wavelet and SVD," Renewable Energy, vol. 36, pp. 2146-2153, 8, 2011.
[9] Q. He, F. Kong and R. Yan, "Subspace-based gearbox condition monitoring by kernel principal component analysis," Mechanical Systems and Signal Processing, vol. 21, pp. 1755-1772, 5, 2007.
[10] M. J. Zuo, J. Lin and X. Fan, "Feature separation using ICA for a one-dimensional time series and its application in fault detection," J. Sound Vibrat., vol. 287, pp. 614-624, 10/22, 2005.
[11] Jiao Weidong, "Fault diagnosis of gearbox by FastICA and residual mutual information based feature extraction," in Information and Automation, 2009. ICIA '09. International Conference on, 2009, pp. 928-932.
[12] G. Liao, T. Shi and L. Nie, "Feature extraction for gear failure detection based on nonlinear mapping," Key Eng Mat, vol. 324-325, pp. 547-50, 2006.
[13] A. Al-Habaibeh, F. Zorriassatine and N. Gindy, "Comprehensive experimental evaluation of a systematic approach for cost effective and rapid design of condition monitoring systems using Taguchi’s method," J. Mater. Process. Technol., vol. 124, pp. 372-383, 6/20, 2002.
[14] S. Gunes, E. Manay, E. Senyigit and V. Ozceyhan, "A Taguchi approach for optimization of design parameters in a tube with coiled wire inserts," Appl. Therm. Eng., vol. 31, pp. 2568-2577, 10, 2011.
[15] A. K. LAKSHMINARAYANAN and V. BALASUBRAMANIAN, "Process parameters optimization for friction stir welding of RDE-40 aluminium alloy using Taguchi technique," Transactions of Nonferrous Metals Society of China, vol. 18, pp. 548-554, 6, 2008.
[16] Omar D. Mohammed, Matti Rantatalo, Jan-Olov Aidanpää, Uday Kumar, Vibration signal analysis for gear fault diagnosis with various crack progression scenarios, Mechanical Systems and Signal Processing, Volume 41, Issues 1–2, December 2013, Pages 176-195, ISSN 0888-3270.
[17] A. Hajnayeb, A. Ghasemloonia, S. E. Khadem and M. H. Moradi, "Application and comparison of an ANN-based feature selection method and the genetic algorithm in gearbox fault diagnosis," Expert Syst. Appl., vol. 38, pp. 10205-10209, 8, 2011.
[18] Hui Li, Lihui Fu and Zhenjiang Shi, "Research on the gear fault diagnosis using order envelope spectrum," in Measuring Technology and Mechatronics Automation, 2009. ICMTMA '09. International Conference on, 2009, pp. 711-714.
[19] L. Guo, J. Chen and X. Li, "Rolling Bearing Fault Classification Based on Envelope Spectrum and Support Vector Machine," J. Vibrat. Control, vol. 15, pp. 1349-1363, 2009.
[20] X. Zhao, M. J. Zuo, Z. Liu and M. R. Hoseini, "Diagnosis of artificially created surface damage levels of planet gear teeth using ordinal ranking," Measurement, vol. 46, pp. 132-144, 1, 2013.
[21] N. Saravanan and K. I. Ramachandran, "Incipient gear box fault diagnosis using discrete wavelet transform (DWT) for feature extraction and classification using artificial neural network (ANN)," Expert Syst. Appl., vol. 37, pp. 4168-4181, 6, 2010.
[22] L. Lin and J. Hongbing, "Signal feature extraction based on an improved EMD method," Measurement, vol. 42, pp. 796-803, 6, 2009.
23
[23] H. Xu and B. Yu, "Automatic thesaurus construction for spam filtering using revised back propagation neural network," Expert Syst. Appl., vol. 37, pp. 18-23, 1, 2010.
[24] M. Catelani and A. Fort, "Fault diagnosis of electronic analog circuits using a radial basis function network classifier," Measurement, vol. 28, pp. 147-158, 10, 2000.
[25] J. Zhao, X. Zhu, W. Wang and Y. Liu, "Extended Kalman filter-based Elman networks for industrial time series prediction with GPU acceleration," Neurocomputing, vol. 118, pp. 215-224, 10/22, 2013.
[26] W. H. Sneed and R. L. Smith, "On-board real-time railroad bearing defect detection and monitoring," in Railroad Conference, 1998. Proceedings of the 1998 ASME/IEEE Joint, 1998, pp. 149-153.
[27] J. Liu, B. Zuo, X. Zeng, P. Vroman and B. Rabenasolo, "Nonwoven uniformity identification using wavelet texture analysis and LVQ neural network," Expert Syst. Appl., vol. 37, pp. 2241-2246, 3/15, 2010.
24
Appendix 1
Table A1: 27 Full factorial tests (3 factors and 3 levels)