Conditional-Spectrum-based ground motion selection. Part II:Intensity-based assessments and evaluation of
alternative target spectra
Ting Lin1;�,� , Curt B. Haselton2 and Jack W. Baker1
1Department of Civil and Environmental Engineering, Stanford University, Stanford, CA 94305-4020, U.S.A.2Department of Civil Engineering, California State University, Chico, Chico, CA 95929-0930, U.S.A.
Ground motion selection provides important seismic input to nonlinear dynamic analysis that is usedto predict structural performance typically on the basis of structural response parameters that are ofmost interest. The uncertainty in ground motion input typically accounts for a significant portion ofthe uncertainty in structural response output. To determine what ground motions would be appropriatefor nonlinear dynamic analysis, we need to be clear about the structural analysis objective as well asthe target response spectrum for which ground motions are selected and scaled to match. Nonlineardynamic analysis can be carried out with the objectives of intensity-based (which estimates structuralresponse given ground motions with a specified intensity level) [1] and risk-based (which estimates themean annual rate of exceeding a specified structural response amplitude) assessments on the structural
�Correspondence to: Ting Lin, Department of Civil and Environmental Engineering, Stanford University, Stanford,CA 94305-4020, U.S.A.�E-mail: [email protected]
response of interest (which may include peak story drift ratio (PSDR), peak floor acceleration (PFA),single-story engineering demand parameter (EDP), member forces, or any other EDP of interest).Target response spectra may include most commonly the uniform hazard spectrum (UHS) that corre-sponds to spectral accelerations (Sa) with equal probabilities of exceedance at all periods, and morerecently the conditional mean spectrum (CMS) or the conditional spectrum (CS) that accounts for thecorrelations between Sa values across periods. Depending on the structural analysis objective and thetarget response spectrum, conclusions regarding structural performance may differ, and it is importantto investigate such impacts to provide ground motion selection insights for future nonlinear dynamicanalysis.
The companion paper [2] outlines the ground motion selection procedures for risk-based assess-ments using the CS with a range of conditioning periods and highlights the importance of hazardconsistency in the selected ground motions. While risk-based assessments of structural responsedirectly account for the uncertainty in ground motion hazard by considering different intensity lev-els and their corresponding occurrence rates, intensity-based assessments are used in practice as asimpler option to fulfill building code requirements [e.g., 3,4], which are mainly concerned with struc-tural response at a specified intensity level, for example, Sa associated with 2% in 50 years or 10%in 50 years probabilities of exceedance. In this paper, we focus on the structural analysis objectiveof intensity-based assessments, with ground motions selected using the CS at various conditioningperiods, to examine the impact of conditioning period on intensity-based assessments.
The CS was used as the target response spectrum for which ground motions were selected and scaledto match in the companion paper [2]. The CS accounts for both the mean and the variability of theground motion spectra and is proposed as an appropriate target for risk-based assessments [5, 6]. Inpractice, the UHS is more commonly used, especially through building codes [e.g., 3, 4, 7]. However,shortcomings of the UHS include a lack of hazard consistency as it assumes the occurrence of highspectral values at all periods [e.g., 8–12]. Alternatively, the CMS is used to better capture the hazardinformation [e.g., 12–16]. However, the CMS does not account for the variability of the ground motionspectra. In this paper, the UHS and CMS are used as target spectra to select ground motions, and theircorresponding structural analysis results are compared with those using the CS, to examine the impactof target spectrum on structural response estimates.
The same 20-story reinforced concrete perimeter frame structure [17, 18] located in Palo Alto,California as used in the companion paper [2] is used for illustration. In Section 2, structural analy-ses are carried out with the objectives of intensity-based in addition to risk-based assessments on thestructural response of interest (which include PSDR and PFA). Such nonlinear dynamic analyses arerepeated for the CS at various conditioning periods to examine the impact of conditioning period inSection 3, and additionally for the UHS and the CMS to examine the impact of target spectrum inSection 4. To verify the observations earlier, more generally, one additional four-story structure wasanalyzed using the same procedure with ground motions selected to match CS in Section 5. Finally,implications of the choice of conditioning period and target spectrum for building-code-type check andperformance-based earthquake engineering are discussed in Section 6.
2. ANALYSIS OBJECTIVES
Ground motions represent an important source of uncertainty in nonlinear dynamic analysis. Beforeanalyzing structural response results or even selecting ground motions, it is important to ask thequestion: ‘What is the objective of the structural analysis?’ Changing the question we ask (intensity-based or risk-based assessments) would essentially change the ground motion inputs we need and thestructural response answers we get.
2.1. Risk-based assessments
Risk-based assessments using CS as a target spectrum with varying conditioning periods were intro-duced in the companion paper [2]. Detailed procedures and results were presented for risk-basedassessments on the basis of PSDR as an EDP, followed by brief illustrations with alternative EDPs that
include PFA, single-story story drift ratio, and single-story floor acceleration. If an exact CS (whichincorporates multiple earthquake sources and multiple ground motion prediction models) is used, risk-based assessment results are relatively insensitive to the choice of conditioning period, and the same setof ground motions can be used to assess any structural response of interest. In practice, however, if weuse an approximate CS, we may need to adjust the target spectrum to account for spectral variabilityfurther away from the conditioning period to ensure the correct distribution for the period most impor-tant to each EDP. This is because an exact CS already correctly accounts for the spectral variability atall periods of interest and thereby covers EDPs of interest without any further adjustments.
When the structural analysis objective is changed to an intensity-based assessment, which is onlyconcerned with structural response at a given ground motion intensity level without considerationof ground motion occurrence rates, the choice of conditioning period in the CS may matter as weessentially change the question being asked. Here, the focus is on the intensity-based assessment, andits difference from the risk-based assessment is highlighted, together with how it is impacted by thechoice of conditioning period through ground motions selected and scaled using the CS at variousconditioning periods.
2.2. Intensity-based assessments
An intensity-based assessment differs from a risk-based assessment in its analysis goal, and its pro-cedures are in fact covered by the risk-based assessment. An intensity-based assessment is basicallythe first part of a risk-based assessment that looks at structural response at a given intensity level,without integration with seismic hazard curves. From structural analysis at a given intensity level, struc-tural response parameters of interest (e.g., PSDR or PFA) are obtained, and their logarithmic mean,�lnEDP , and logarithmic standard deviation (also referred to as dispersion), �lnEDP , are estimated,along with probability of collapse, P.C/. A lognormal distribution can be used to fit the structuralresponse parameters at each intensity level [e.g., 19–24]. The empirical probability of collapse at eachintensity level can be computed by counting the number of collapses and dividing by the total numberof analyses.
Here is another way to look at the difference based on the output. A risk-based assessment yieldsone number regarding the ‘risk’ for each EDP level, that is, the rate of exceedance, �.EDP > y/
(by considering various intensity levels and EDP distribution at each intensity level). The results fromrisk-based assessments are found to be relatively insensitive to the choice of conditioning period, asillustrated by Table I in the companion paper [2]. Conversely, an intensity-based assessment yieldsinformation about EDP estimates (e.g., median and dispersion of EDP) at each intensity level (withoutconsiderations of multiple intensity levels and their occurrence rates). The results from intensity-basedassessments will be presented later in Section 3.
The target spectrum in building codes [e.g., 3, 4, 7] is often on the basis of the UHS at one intensitylevel over a range of periods, for example, 0:2�1:5T1, that covers the first-mode period of the structureas well as higher modes and lengthened periods because of nonlinear behavior. The UHS assumes equalprobability of exceedance of Sa at all periods. This differs from the CS that accounts for correlationsbetween Sa pairs at different periods, and essentially represents the distribution of Sa at all periodsgiven Sa at one period, that is, the conditioning period. If the CS is used instead of the UHS, it isnot obvious which period to choose as the conditioning period if structural response is examined atonly one intensity level. To examine the effect of conditioning period on intensity-based assessments,a range of conditioning periods are used at multiple intensity levels.
3. IMPACT OF CONDITIONING PERIOD ON INTENSITY-BASED ASSESSMENTS USINGTHE CONDITIONAL SPECTRUM
To illustrate, sets of 40 ground motions are selected for the 20-story perimeter frame at 10 intensitylevels, using the CS at four conditioning periods. The conditioning periods, T �, cover the structure’sfirst three modal periods (T1 D 2:6 s, T2 D 0:85 s, and T3 D 0:45 s) and up to approximately twice thefirst-mode period (2T1 D 5 s). Each set of 40 ground motions correspond to one intensity level and one
Figure 1. Statistics of structural responses from intensity-based assessments of the 20-story perimeter frame(Building No.1020) using the CS (a) median PSDR, (b) logarithmic standard deviation of PSDR, (c) median
PFA, (d) logarithmic standard deviation of PFA, and (e) probability of collapse.
conditioning period. In the companion paper [2], Figures 7(a) and (b) show the distribution of PSDRand probability of collapse respectively at 10 intensity levels for the conditioning period T � D 2:6 s.On the basis of fitting a lognormal distribution to the empirical PSDR results, the logarithmic meanand standard deviation of PSDR are shown as a function of Sa.T �/ in Figure 7(a). Alternatively, thelogarithmic mean and standard deviation of EDPs can be plotted as a function of ground motion inten-sity level for various conditioning periods, to investigate the effect of different conditioning periodson intensity-based assessments. Figure 7(b) shows the observed fractions of collapse at each Sa.T �/level, and a lognormal collapse fragility obtained on the basis of the maximum-likelihood method[e.g., 21, 25, 26]. Similarly, probability of collapse can be plotted as a function of intensity level whenmultiple conditioning periods are considered.
Intensity-based calculations for PSDR, PFA, and probability of collapse given 10 spectral ampli-tudes (corresponding to 10 specified exceedance rates) for ground motions selected to match the CS atvarious conditioning periods are shown in Figure 1 and Table I. As Sa associated with each exceedancerate vary among conditioning periods, all structural response results are plotted against return period,which is fixed for each intensity level regardless of its corresponding Sa. Figures 1(a) and (b) show
the median PSDR and logarithmic standard deviation of non-collapse PSDR until the exceedancerate corresponding to an Sa.T �/ level results in 50% collapse. Here, the solid line (T � D 2:6s )in Figure 1(a) is equivalent to connecting the median values of PSDR at various intensity levels inFigure 7(a) in the companion paper [2], except that the x-axis is return period in years instead ofSa.T �/ in g. Also shown in Figure 1(a) are median PSDR results from analyses using CS with threeother conditioning periods for comparison. Similarly, the solid line (T � D 2:6 s) in Figure 1(b) isequivalent to connecting the logarithmic standard deviation values of non-collapse PSDR at variousintensity levels (up to 50% collapse) in Figure 7(a) in the companion paper [2], superimposed withresults from three other conditioning periods. At the Sa.T �/ levels corresponding to greater than 50%probability of collapse, the median PSDR is governed by the collapse PSDR, and therefore, is notillustrated here. Similarly, the logarithmic standard deviation of non-collapse PSDR is not informa-tive at high probability of collapse, and therefore, is cut off when 50% or more of the analyses causecollapse. Figures 1(c) and (d) show the median and logarithmic standard deviation of PFA. In thecase of collapse (except for collapse mechanisms that cause partial collapse in the upper floors), PFAis substituted by the peak ground acceleration (PGA) of individual ground motion (correspondingto the ground floor acceleration) [23]. Figure 1(e) shows the probabilities of collapse obtained fromthese analyses.
As is evident from Figure 1 and Table I, the structural responses at each intensity level are gener-ally different among various conditioning periods, with differences of a factor of four or more beingobserved between results from varying conditioning periods. For instance, at shorter return periods(lower spectral amplitudes), the median PSDR shows a slight discrepancy among the conditioningperiods (e.g., about 50% difference between 0.008 and 0.012 for Sa.T �/ associated with 10% in50 years probability of exceedance); at longer return periods (higher spectral amplitudes), the discrep-ancy becomes larger, with results corresponding to T � D T1 and 2T1 showing higher median PSDRthan T2 and T3 (e.g., about 400% difference between 0.048 and 0.012 for Sa.T �/ associated with2% in 50 years probability of exceedance, see Figure 1(a)). At shorter return periods, the median PFAshows a slight discrepancy among all the conditioning periods; at longer return periods, the discrep-ancy becomes larger, with 2T1 and T1 showing lower median PFA than T2 and T3 (e.g., 0.404 vs 0.731for Sa.T �/ associated with 2% in 50 years probability of exceedance, see Figure 1(c)). The proba-bility of collapse also differs more at longer return periods, with 2T1 and T1 showing much higherprobability of collapse than T2 and T3 (e.g., 0.4 vs 0.15 for Sa.T �/ associated with 2% in 50 yearsprobability of exceedance, see Figure 1(e)). Similar collapse probability results as a function of returnperiod are shown in Figure 5 of [27]. As illustrated in Figure 2(a) in the companion paper [2], thespectral shape of the CMS becomes more peaked at higher intensity levels (longer return periods). Inaddition, as illustrated in Figure 2(b) in the companion paper [2], the spectral shape of the CMS peaksat the respective conditioning period for a given intensity level. Because an � value of 0 will result inthe same spectral shape for the CMS at all conditioning periods but � values increase as intensity lev-els increase, it is expected that the spectral shapes of the CMS for various conditioning periods differmore at higher intensity levels, driving a larger discrepancy among structural response obtained usingthe CS at various conditioning periods.
Over the range of return periods, T1 gives the highest median PSDR (Figure 1(a)) and the lowestlogarithmic standard deviation of PSDR (Figure 1(b)), whereas T3 seems to give the highest medianPFA (Figure 1(c)) and the lowest logarithmic standard deviation of PFA (Figure 1(d)). If we comparethe PSDR response (Figure 1(a)) with the target CS at the 2% in 50 years intensity level (or a returnperiod of 2475 years) from Figure 2(b) in the companion paper [1], it is apparent that the analysisusing the CS with T � D 2:6 s produces the largest responses, followed by those using the CS withT � D 5 s, T � D 0:85 s, and T � D 0:45 s, which is comparable with the order of the spectral valueswith the CS near 2.6 s (highest spectral values for 2.6 s followed by 5, 0.85, and 0.45 s). Similarly, ifwe compare the PFA response with the target CS at the 2% in 50 years intensity level (Figure 2(b) inthe companion paper [2]), the highest responses are produced by the T � D 0:45 s spectrum followedby the spectra with T � of 0.85, 2.6, and 5 s, which is comparable with the order of the spectral valueswith the CS near 0.45 s. The logarithmic standard deviations for PFA (Figure 1(d)) follow the reverseorder (compared with median PFA responses) of 5, 2.6, 0.85, and 0.45 s. For this structure, Sa(0.45 s)seems to be most highly correlated with PFA responses and thus a relatively good predictor of PFA.
Taghavi and Miranda [28] show that PFA is strongly dominated by higher modes and that in many casesPGA was strongly correlated with PFA. On the contrary, PSDR responses seem to be most correlatedwith Sa at periods near 2.6 s (between 2.6 and 5 s). The order of structural response values withrespect to various conditioning periods is reversed for PSDR and PFA, illustrating different importantperiods for different EDPs. For probability of collapse predictions (Figure 1(e)), results conditionedon T � D 5 s show the lowest dispersion in the collapse fragility curve, followed by 2.6, 0.85, and0.45 s, demonstrating that Sa(5 s) is most correlated with collapse prediction. This is consistent withprevious observations [e.g., 28–30] that collapse is most closely related to a lengthened period for longreturn-period ground motions that induce nonlinear behavior in the structure, whereas PSDR is oftencorrelated with first-mode response even when the response is nonlinear.
As seen from the results of the median and logarithmic standard deviation of PSDR and PFA and theprobability of collapse, intensity-based assessments depend on the choice of the conditioning period fora given return period. Longer periods can be important for PSDR and collapse, whereas higher-modeperiods can be important for PFA.
4. ALTERNATIVE TARGET SPECTRA
To determine what ground motions would be appropriate for structural analysis, we first need tospecify the target response spectrum in the context of this work. In this section, in addition to thepreviously considered CS, we consider the UHS that is defined as having Sa with an equal probabil-ity of exceedance at all periods and the CMS. Depending on the choice of target spectrum, groundmotions would be selected and scaled differently, therefore impacting conclusions regarding structuralperformance.
4.1. Uniform hazard spectrum and conditional mean spectrum
The UHS can be obtained directly from seismic hazard curves at various periods, whereas the computa-tion of the CMS involves computing the mean of the CS (without the variance) as presented in Equation2 of the companion paper [2]. With the target spectrum identified and computed, ground motions canthen be selected from a ground motion database and scaled to match the target spectrum. Individualground motions are selected via [31] such that the sum of squared errors between their response spec-tra and the target spectrum mean and variance (while setting the variance of the target spectrum to bezero) is minimized.
To illustrate, let us revisit the 2% in 50 year intensity level associated with Sa(2.6 s). Sets of 40ground motions are selected to match the UHS, the CMS, and the CS in Figures 2(a)–(c), respectively.The ground motions selected to match the UHS generally result in higher spectral values on average asthe UHS is an envelope of CMS at multiple conditioning periods. The ground motions in Figures 2(a)and (b) show a lower standard deviation than those in Figure 2(c) where the distribution of the tar-get spectrum (both mean and variance) is matched. The same procedure is repeated to select groundmotions for other intensity levels and periods.
4.2. Impact of target spectra on intensity-based assessments
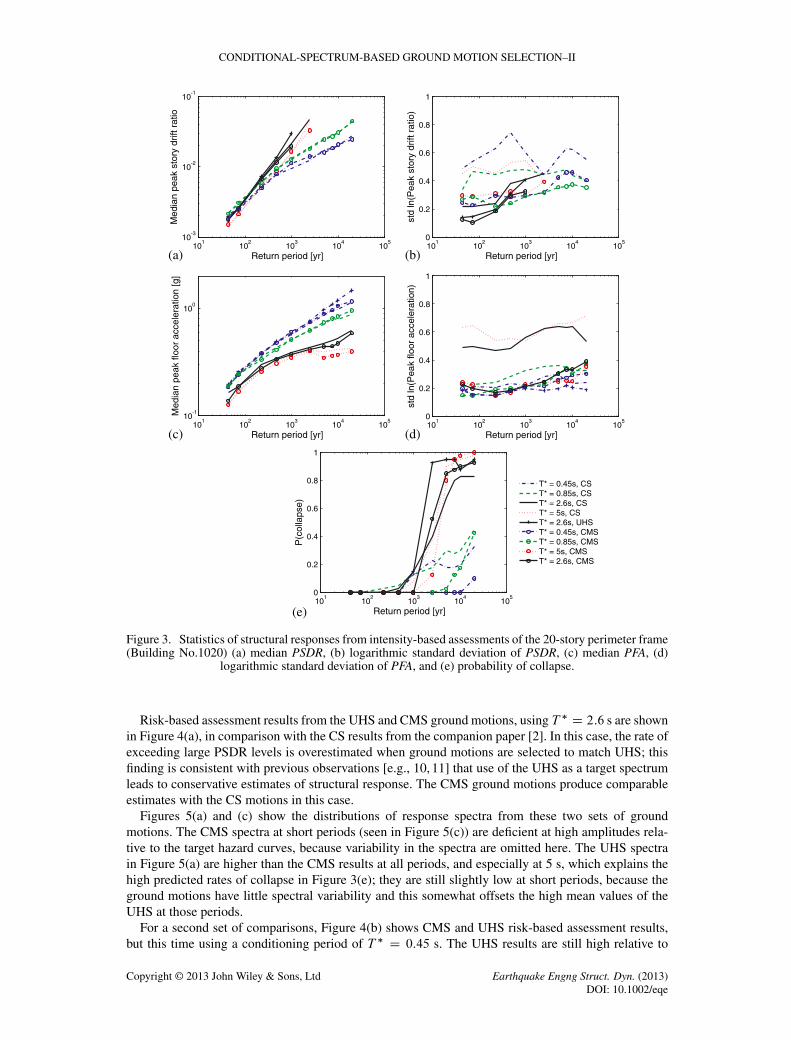
To evaluate the impact of target spectra on intensity-based and risk-based assessments, additionalstructural analyses can be performed using ground motions selected to match the UHS and CMS.Intensity-based calculations for PSDR, PFA, and probability of collapse performed using the CS inthe previous section are now repeated here for the other two target spectra, and results are shown inFigure 3. Figures 3(a) and (b) show the median PSDR and logarithmic standard deviation of non-collapse PSDR for cases with less than 50% collapse, respectively; Figures 3(c) and (d) show themedian and logarithmic standard deviation of PFA, respectively; Figure 3(e) shows the probability ofcollapse. Several observations can be made from Figure 3 and Table II. First, as expected, the UHS-matched ground motions almost always produce larger median responses than the CS-matched andCMS-matched ground motions with an equivalent return period. The differences are sometimes not
Conditional mean spectrumConditional mean +/- conditional Individual record spectra
Uniform hazard spectrum (target)
(a)0.1 0.2 0.5 1 2 5 10
0.01
0.05
0.1
0.5
1
5
Period [s]
Spe
ctra
l Acc
eler
atio
n [g
]
Conditional mean spectrum (target)Conditional mean +/- conditional Individual record spectra
(b)
0.1 0.2 0.5 1 2 5 100.01
0.05
0.1
0.5
1
5
Period [s]
Spe
ctra
l Acc
eler
atio
n [g
]
Selected record spectra meanSelected record spectra mean +/- Conditional mean spectrum (target)Conditional mean +/- conditional (target)Individual record spectra
(c)
Figure 2. Response spectra of selected ground motions with (a) UHS, (b) CMS, and (c) CS as target spectrafor Sa(2.6 s) associated with 2% in 50 years probability of exceedance for the 20-story perimeter frame
(Building No.1020).
large relative to the CMS ground motions at a specific conditioning period. Second, however, the CMSconditioning period associated with the largest median response is not constant over all cases consid-ered. For the PSDR results in Figure 3(a), conditioning on Sa at the first-mode period produces thelargest medians at a given return period, consistent with intuition that PSDR would be dominated byfirst-mode elastic response and thus a spectrum that has the largest Sa amplitude at the first-modeperiod would produce the largest PSDR. For the PFA results in Figure 3(c), the conditioning periodsassociated with large responses are much shorter. The third-mode elastic period produces the highestmedian values, with the second-mode period producing nearly as large of values and the longer peri-ods producing much lower values; this is consistent with PFA being a higher-mode driven responseparameter.
As seen from these results, intensity-based assessments depend on the choice of the conditioningperiod for the CS and the CMS. For all intensity levels at various conditioning periods, the CMSproduce median PSDR and PFA that are similar to the CS, whereas the UHS produces median PSDRand PFA that are higher than the CS; both the CMS and the UHS result in lower logarithmic standarddeviation of PSDR and PFA than the CS. This is explained by the fact that the CMS and the CS sharethe same median (logarithmic mean) Sa, and that ground motions selected to match the CS additionallyaccount for the spectral variability unlike those selected to match the UHS and CMS (Figure 2).
4.3. Impact of target spectra on risk-based assessments
For comparison with the Conditional-Spectrum-based results presented in the companion paper [2], therisk-based assessment procedure is repeated using additional sets of ground motions selected to matchthe CMS and the UHS at each Sa.T �/ level. For both of these target spectra, ground motions wereselected to match the target spectra at each amplitude, nonlinear dynamic analyses were performed, andthe results were used to compute P.PSDR > yjSa.T �/ D x/ and repeat the risk-based calculationto obtain �.PSDR > y/ (via Equations 5 and 6 in the companion paper [2]).
Figure 3. Statistics of structural responses from intensity-based assessments of the 20-story perimeter frame(Building No.1020) (a) median PSDR, (b) logarithmic standard deviation of PSDR, (c) median PFA, (d)
logarithmic standard deviation of PFA, and (e) probability of collapse.
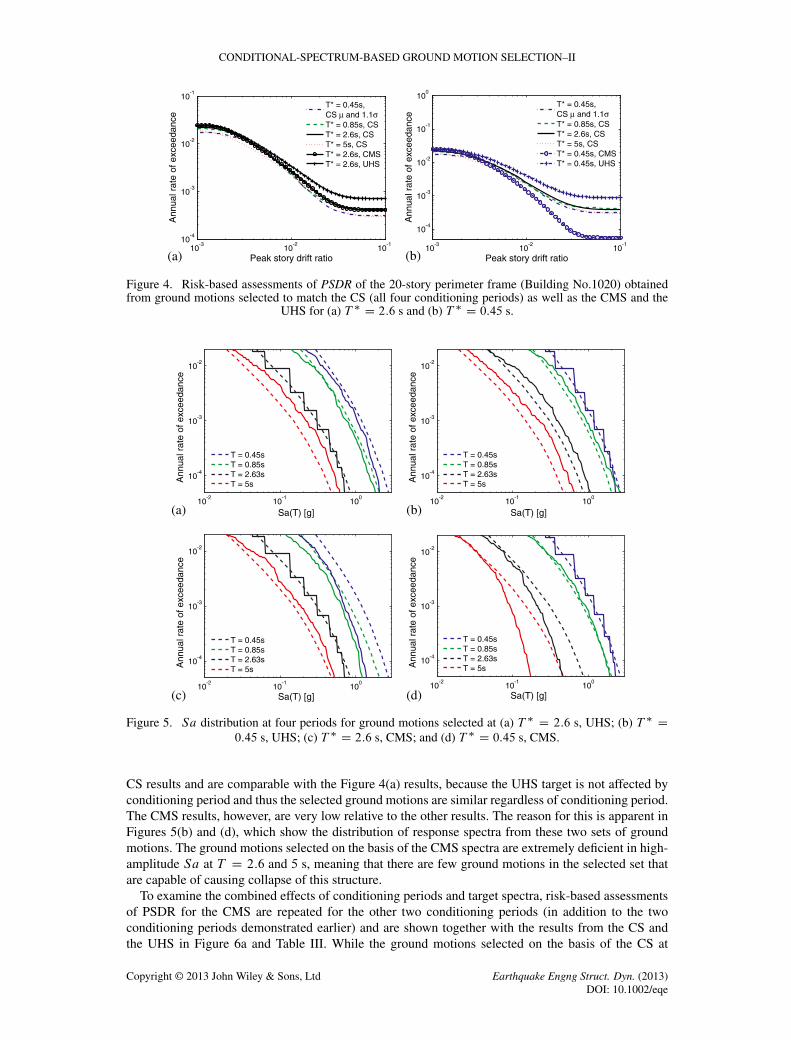
Risk-based assessment results from the UHS and CMS ground motions, using T � D 2:6 s are shownin Figure 4(a), in comparison with the CS results from the companion paper [2]. In this case, the rate ofexceeding large PSDR levels is overestimated when ground motions are selected to match UHS; thisfinding is consistent with previous observations [e.g., 10, 11] that use of the UHS as a target spectrumleads to conservative estimates of structural response. The CMS ground motions produce comparableestimates with the CS motions in this case.
Figures 5(a) and (c) show the distributions of response spectra from these two sets of groundmotions. The CMS spectra at short periods (seen in Figure 5(c)) are deficient at high amplitudes rela-tive to the target hazard curves, because variability in the spectra are omitted here. The UHS spectrain Figure 5(a) are higher than the CMS results at all periods, and especially at 5 s, which explains thehigh predicted rates of collapse in Figure 3(e); they are still slightly low at short periods, because theground motions have little spectral variability and this somewhat offsets the high mean values of theUHS at those periods.
For a second set of comparisons, Figure 4(b) shows CMS and UHS risk-based assessment results,but this time using a conditioning period of T � D 0:45 s. The UHS results are still high relative to
Figure 4. Risk-based assessments of PSDR of the 20-story perimeter frame (Building No.1020) obtainedfrom ground motions selected to match the CS (all four conditioning periods) as well as the CMS and the
UHS for (a) T � D 2:6 s and (b) T � D 0:45 s.
10-2
10-1
100
10-4
10-3
10-2
Sa(T) [g]
Ann
ual r
ate
of e
xcee
danc
e
T = 0.45sT = 0.85sT = 2.63sT = 5s
10-2
10-1
100
10-4
10-3
10-2
Sa(T) [g]
Ann
ual r
ate
of e
xcee
danc
e
T = 0.45sT = 0.85sT = 2.63sT = 5s
10-2
10-1
100
10-4
10-3
10-2
Sa(T) [g]
Ann
ual r
ate
of e
xcee
danc
e
T = 0.45sT = 0.85sT = 2.63sT = 5s
10-2
10-1
100
10-4
10-3
10-2
Sa(T) [g]
Ann
ual r
ate
of e
xcee
danc
e
T = 0.45sT = 0.85sT = 2.63sT = 5s
(b)(a)
(d)(c)
Figure 5. Sa distribution at four periods for ground motions selected at (a) T � D 2:6 s, UHS; (b) T � D0:45 s, UHS; (c) T � D 2:6 s, CMS; and (d) T � D 0:45 s, CMS.
CS results and are comparable with the Figure 4(a) results, because the UHS target is not affected byconditioning period and thus the selected ground motions are similar regardless of conditioning period.The CMS results, however, are very low relative to the other results. The reason for this is apparent inFigures 5(b) and (d), which show the distribution of response spectra from these two sets of groundmotions. The ground motions selected on the basis of the CMS spectra are extremely deficient in high-amplitude Sa at T D 2:6 and 5 s, meaning that there are few ground motions in the selected set thatare capable of causing collapse of this structure.
To examine the combined effects of conditioning periods and target spectra, risk-based assessmentsof PSDR for the CMS are repeated for the other two conditioning periods (in addition to the twoconditioning periods demonstrated earlier) and are shown together with the results from the CS andthe UHS in Figure 6a and Table III. While the ground motions selected on the basis of the CS at
Figure 6. Risk-based assessments of (a) PSDR and (b) PFA of the 20-story perimeter frame (BuildingNo.1020) obtained from ground motions selected to match the CS, the CMS, and the UHS.
Table III. Summary of selected structural response results from intensity-based assessments usingground motions selected to match the CS, the CMS, and the UHS.
10% in 50 yrs EDPs Median PSDR 0.012 0.012 0.011 0.009 0.015Median PFA 0.521 0.333 0.529 0.521 0.566
all four conditioning periods show similar PSDR hazard results (e.g., CS results in an annual rate ofPSDR > 2% in the range of 6:46� 10�4 to 9:42� 10�4), the ground motions selected on the basis ofthe CMS at the four conditioning periods show differing PSDR hazard results, with the results basedon T � D 2:6 s showing the highest values (e.g., CMS based on T � D 2:6 s results in an annual rateof PSDR > 2% D 8:55 � 10�4, which is within 10% of CS results based on T � D 2:6 s) and theresults based on T � D 5 s showing the second highest values but the results based on T � D 0:85 sand T � D 0:45 s showing values that are much lower than those from the CS (e.g., CMS based onT � D 0:45 s results in an annual rate of PSDR > 2% D 2:35 � 10�4, which is 301% lower than thatof CS results based on T � D 2:6 s). This illustrates the difference between the CS results and the CMSresults and shows that the CMS results will deviate most from the CS results while using a conditioningperiod that is not a good predictor for the structural response of interest. The ground motions selectedon the basis of the UHS, however, results in higher PSDR hazard (e.g., UHS results in an annual rateof PSDR > 2% D 1:29 � 10�3, which is 37% higher than that of CS results based on T � D 2:6 s)than those from the CS and the CMS.
Similarly, risk-based assessments of PFA for the CS in the companion paper [2] are now repeatedfor the CMS and the UHS and are shown in Figure 6(b) and Table III. Again, while the ground motionsselected on the basis of the CS at all four conditioning periods show similar PFA hazard results, theground motions selected on the basis of the CMS at the four conditioning periods show differingPFA hazard results, with the results based on T � D 0:45 s showing the highest values (which arecomparable with CS results) and the results based on T � D 0:85 showing the second highest valuesbut the results based on T � D 2:6 s and T � D 5 s showing values that are much lower than those fromthe CS. The ground motions selected on the basis of the UHS results in higher PFA hazard than thosefrom the CS and the CMS.
As seen from the PSDR hazard and PFA hazard calculations, risk-based assessments are relativelyinsensitive to the choice of the conditioning period for the CS, but sensitive to the choice of the
conditioning period for the CMS. Compared with the CS, the CMS typically underestimate structuralresponse hazard (although the unconservatism may not be significant if Sa at the conditioning period isa good predictor of the EDP of interest), whereas the UHS overestimates structural response hazard forboth PSDR and PFA hazards. The underestimation in the CMS results is a result of omission of spec-tral variability at periods away from the conditioning period. The overestimation in the UHS results isbecause of the higher spectral values in the UHS at periods other than the conditioning period.
5. ADDITIONAL STRUCTURES
To verify the observations earlier more generally, 11 additional structures were analyzed using thesame procedure with ground motions selected to match CS. Perimeter frame and space frame structureswith heights from 1 to 20 stories, all originally designed as part of the FEMA P695 project [17],were considered. PSDR and PFA predictions were considered, for both risk-based and intensity-basedassessments in all structures. Alternative target spectra were also considered for one of the additionalstructures, a four-story perimeter frame. All structures were located at the same Palo Alto site usedearlier, and Sa with the same exceedance probabilities were considered.
Conditioning periods for CS were T1, T2, T3, and 2T1 (except in the case of the very short struc-tures, where T2 and T3 were not considered in some cases). For each conditioning period and spectralamplitude, 40 recorded ground motions were selected and scaled such that their spectra matched tar-get CS. Additional sets of ground motions were selected in some cases to match a CS with an inflatedconditional standard deviation, as was performed with the T � D 0:45 s (higher modes) case for PSDRand with the T � D 2:6 and 5 s (longer periods) cases for PFA in the 20-story perimeter frame structureillustrated in the companion paper [2].
Let us look at another example structure, a four-story perimeter frame, denoted Building 1008 in therecent FEMA P695 project [17]. The first three elastic modal periods are 0.91, 0.29 and 0.17 s. Resultsrelated to ground motions selected using CS are shown in Figures 7 and 8 for this structure. Conditionalstandard deviation inflation significantly improved the agreements for the PSDR hazard among all fourconditioning periods (Figures 7(a) versus (b)). This again demonstrates the relative insensitivity of risk-based assessments to the choice of conditioning period when ground motions are carefully selected toensure hazard consistency. However, the choice of conditioning period, again, can substantially impactstructural response estimates, as illustrated in Figure 8. For the four-story perimeter frame, PFA seemsto be most dominated by the second-mode period, T2 (compared with the third-mode period, T3 forthe 20-story perimeter frame and other 8-story and 12-story frames not presented here), as indicatedin Figures 8(c) and (d). The first-mode period, T1 continues to be important for PSDR (Figures 8(a)and (b)), and the lengthened period, 2T1, continues to be important for collapse (Figure 8(e)). Thedifference in logarithmic standard deviation of PSDR is now quite significant between the shorter andlonger periods (Figure 8(b)).
10-3
10-2
10-1
10-5
10-4
10-3
10-2
10-1
Peak story drift ratio
Ann
ual r
ate
of e
xcee
danc
e
T* = 0.17sT* = 0.29sT* = 0.91sT* = 1.8s
10-3
10-2
10-1
10-4
10-3
10-2
10-1
Peak story drift ratio
Ann
ual r
ate
of e
xcee
danc
e
T* = 0.17s,CS μ and 1.3σT* = 0.29s,CS μ and 1.2σT* = 0.91sT* = 1.8s
(b)(a)
Figure 7. Risk-based assessments of PSDR of the four-story perimeter frame (Building No.1008) obtainedfrom ground motions with (a) approximate CS with approximate conditional standard deviations and (b)
refined CS with inflated conditional standard deviations.
Figure 8. Statistics of structural responses from intensity-based assessments of the four-story perimeterframe (Building No.1008) using the CS (a) median PSDR, (b) logarithmic standard deviation of PSDR, (c)
median PFA, (d) logarithmic standard deviation of PFA, and (e) probability of collapse.
In all analysis cases, consistency of risk-based assessment results across conditioning periods wasagain observed, whereas intensity-based assessment results varied as the conditioning period varied, fora given structure. These results thus provide further empirical confirmation of the findings described indetail earlier. The large set of results supporting these statements is omitted from this paper for brevitybut is documented in Appendix A of [32].
6. IMPLICATIONS FOR BUILDING CODES AND PERFORMANCE-BASEDEARTHQUAKE ENGINEERING
Both risk-based and intensity-based assessments are investigated, along with evaluations of such tar-get spectra as the CS, the CMS, and the UHS. The findings here have important implications on thechoice of conditioning period and target spectrum for building-code-type check and performance-basedearthquake engineering, as discussed later.
For risk-based assessments (typically used in performance-based earthquake engineering), the CS(including variability) is a recommended target spectrum. Results are relatively insensitive to the choiceof conditioning period, T �, but the choice of an efficient T � (closely related to the structural responseof interest) may reduce the number of required structural analyses. If the CMS is used, the structuralresponse hazard is typically underestimated, especially for conditioning periods that are further awayfrom the period closely related to the structural response of interest. In contrast, if the UHS is used, thestructural response hazard estimate is usually conservative.
6.2. Intensity-based assessments
For intensity-based building-code-type checks, the CMS and the CS are both defensible target spectra.The choice of CS or CMS depends on the goal of the analyses. If the median structural response isof interest, either spectrum can be used—the CMS can be an efficient choice for this purpose. If thefull distribution of structural response is of interest, the CS should be used to capture the variabilityin structural response. Results will fully depend on the conditioning period, T �, because different T �
implies a different question being asked. If the conditioning period, T �, most closely relates to thestructural response parameter of interest is known, that T � alone may be sufficient to evaluate thespecified structural response. Such conditioning period is often associated with the lowest dispersionestimate and the highest median estimate of structural response.
6.3. Selection of target spectrum
In the absence of more complete guidance on ‘what the right question is’, a tentative recommendationfor building-code-type checks is to use a conditioning period, T �, that results in the highest response.Multiple T � and conditional spectra or conditional mean spectra may be needed if multiple responsesare of interest. For instance, if the objective is to limit first-mode sensitive response parameters (e.g.,PSDR), a single spectrum conditioned at T1 may be sufficient; if the goal is to additionally ensurethat higher-mode-sensitive response parameters (e.g., PFA or member forces) are limited, a secondhigher-mode spectrum may be needed.
Unless conservatism is intentional, use of the UHS is not recommended, because ground motionsassociated with a UHS are typically not consistent with the ground motion hazard for which they areselected. If future building codes allow use of conditional spectra or conditional mean spectra in placeof a UHS, the average values of responses computed in those checks may be reduced even if the targetreturn period of the ground motion is unchanged because of the eliminated conservatism of the UHStarget. The level of reduction depends upon the extent to which the response parameter of interest isassociated with spectral values at multiple periods; structures that behave like elastic single-degree-of-freedom oscillators are sensitive only to Sa at a single period and thus the responses from CS-matchedor UHS-matched motions conditioned on that period will be identical. Conversely, structural responseparameters sensitive to multiple modes of excitation or to significant nonlinearity (such as collapse,where the structure’s effective period lengthens) may experience reduced responses from CS-matchedmotions relative to UHS-matched motions with the same intensity at the conditioning period.
6.4. Linking performance goals and design checks
Risk-based assessments are often used in performance-based earthquake engineering, whereasintensity-based assessments often resemble those from the building-code type design checks. Thereis a recent shift in building codes towards risk-based assessments (e.g., the collapse risk performancegoal in ASCE/SEI 7–10 [4]), but the design checks are still primarily intensity-based (i.e., assessingstructural response at a single intensity level). In the case of ASCE/SEI 7–10, the stated objective ofthe design requirements is to achieve building designs that have less than a 1% probability of collapsein 50 years, and the intensity-based assessment (and corresponding acceptance criteria) is implicitlyintended to measure whether this objective is being achieved.
The findings here imply a missing link between the implicit performance goals and the explicitdesign checks that needs to be reconciled. A detailed study to determine whether the current intensity-based design checks are optimal for and consistent with the risk-based performance goals would bevaluable. Such a study is needed to better determine the appropriate intensity-based question that ASCE7 should be asking (to be consistent with its fundamental goal of acceptable collapse risk).
6.5. Implications for analysis of 3-D structural models
The results earlier are obtained by analyzing 2-D structural models subjected to a single component ofground motion, and so some thought is needed to translate these observations into conclusions for 3-D structural models subjected to multicomponent ground motions. The findings earlier provide somereassurance that risk-based assessments can be robustly performed for 3-D structural models as longas hazard-consistent ground motions are used for the analysis. For the 3-D case, hazard consistencyrequires that ground motions have Sa distributions consistent with hazard curves at all periods andorientations of interest. This should be the case regardless of the choice of response spectra defini-tion (i.e., arbitrary component, geometric mean, or maximum component). This hypothesis followsfrom the earlier results showing consistent risk-based results if ground motions have hazard consistentspectra at multiple periods and extending it to spectra at multiple orientations. This thinking is alsoconsistent with earlier research on this topic [33]. Further work to empirically verify this hypothesis,and to develop appropriate intensity-based assessment rules, would be valuable.
7. CONCLUSIONS
This paper has presented a study on the sensitivity of intensity-based assessment (which esti-mates structural response given ground motions whose intensity measure amplitudes have a specificexceedance probability) results to the choice of conditioning period when the CS is used as a target forground motion selection and scaling. This paper has also presented a study of the sensitivity of bothrisk-based and intensity-based assessments to the choice of target spectrum, including evaluation ofthe UHS and the CMS. The primary structure studied was a 20-story concrete frame structure assumedto be located in Palo Alto, California, using a structural model with strength and stiffness deteriora-tion that is believed to reasonably capture the responses up to the point of collapse because of dynamicinstability.
The study showed that the choice of conditioning period for the CS can substantially impactstructural response estimates for an intensity-based assessment, but that risk-based assessments arerelatively insensitive to the choice of conditioning period in the CS (given that the ground motionsare carefully selected to ensure hazard consistency). For intensity-based assessments, use of the CMS,instead of the CS, does not significantly affect the median response estimates but does decrease boththe dispersion of the response and the probability of collapse distribution. For risk-based assessments,use of the CMS, instead of the CS, typically results in underestimation of structural response haz-ard because of the omission of spectral variability in the selected ground motions, whereas use of theUHS results in overestimation in the structural response hazard. These findings have potentially impor-tant implications for seismic assessments using the CS in future building code and performance-basedearthquake engineering applications.
An important issue regarding conditioning period arises when an intensity-based assessment is beingused, and the purpose is to compute the mean or median response associated with an Sa.T �/ having aspecified probability of exceedance (e.g., for a building-code-type check). In this extremely commoncase, the response prediction will always change depending upon the choice of conditioning period.This comes from the fact that the choice of conditioning period is an inherent part of the problemstatement, and so in this case changing the conditioning period changes the question that is beingasked. For example, computing the median drift response for a building subjected to a 2% in 50 yearexceedance Sa(1 s) is not the same as computing the median drift response for a building subjected toa 2% in to 50 year exceedance Sa(2 s); these are two different questions. Resolution of this issue is not
obvious, but likely lies in identifying a conditioning period and performance check that, when passed,confirms satisfactory reliability of the structural system.
Additional evaluations were completed for 11 other structures. Although not reported in this paper,they are available in Appendix A of [32]; these additional analyses confirm the generality of the conclu-sions made in this paper and collectively provide a more complete picture of the relationship betweencareful ground motion selection and robust structural response results.
ACKNOWLEDGEMENTS
The authors thank Brendon Bradley, Eduardo Miranda, Gregory Deierlein, and an anonymous reviewer fortheir helpful reviews of the manuscript. The authors also acknowledge the contributions of Jared DeBockand Fortunato Enriquez in conducting the structural analyses used in this study. This work was part of alarger project on ground motion selection [6]. It was supported in part by the NEHRP Consultants JointVenture (a partnership of the Consortium of Universities for Research in Earthquake Engineering andApplied Technology Council), under Contract SB134107CQ0019, Earthquake Structural and EngineeringResearch, issued by the National Institute of Standards and Technology, for project ATC-82. Any opinions,findings, and conclusions or recommendations expressed in this material are those of the authors and do notnecessarily reflect those of the NEHRP Consultants Joint Venture.
REFERENCES
1. ATC. Guidelines for seismic performance assessment of buildings, ATC-58 100% draft. Technical Report , AppliedTechnology Council: Redwood City, California, 2011.
3. ICC. International building code 2003. International Code Council, 2003.4. ASCE. Minimum Design Loads for Buildings and Other Structures, ASCE 7-10, American Society of Civil
Engineers/Structural Engineering Institute: Reston, VA, 2010.5. Baker JW. Conditional mean spectrum: tool for ground motion selection, Journal of Structural Engineering 2011;
137(3):322–331.6. NIST. Selecting and scaling earthquake ground motions for performing response-history analyses, NIST GCR
11-917-15. Technical Report , prepared by the NEHRP Consultants Joint Venture for the National Institute ofStandards and Technology: Gaithersburg, Maryland, 2011.
7. CEN. Eurocode 8: design of structures for earthquake Resistance—Part 1: general rules, seismic actions and rules forbuildings. European Standard NF EN 1998-1:2004, Comité Européen de Normalisation: Brussels, Belgium, 2004.
8. Reiter L. Earthquake Hazard Analysis: Issues and Insights, Columbia University Press: New York, 1990.9. McGuire RK. Probabilistic seismic hazard analysis and design earthquakes: closing the loop, Bulletin of the
Seismological Society of America 1995; 85(5):1275–1284.10. Naeim F, Lew M. On the use of design spectrum compatible time histories, Earthquake Spectra 1995; 11(1):
111–127.11. Bommer JJ, Scott S, Sarma S. Hazard-consistent earthquake scenarios, Soil Dynamics and Earthquake Engineering
2000; 19:219–231.12. Baker JW, Cornell CA. Spectral shape, epsilon and record selection, Earthquake Engineering & Structural
Dynamics 2006; 35(9):1077–1095, DOI 10.1002/eqe.571.13. Somerville PG, Hamburger RO. Development of ground motion time histories for design, Seismic Mitigation for
Museum Collection: Papers from the J. Paul Getty Museum - National Museum of Western Art (Tokyo) JointlySponsored Symposium: Tokyo, Japan, 2009; 7 pp.
14. Abrahamson NA, Al Atik L. Scenario spectra for design ground motions and risk calculation, 9th US National and10th Canadian Conference on Earthquake Engineering: Toronto, Canada, 2010; Paper Number 1896, 12 pp.
16. Somerville PG, Thio HK. Development of ground motion time histories for seismic design, Proceedings of the NinthPacific Conference on Earthquake Engineering: Auckland, New Zealand, 2011; Paper Number 208, 8 pp.
17. ATC. Quantification of building seismic performance factors, FEMA P695. Technical Report , Applied TechnologyCouncil: Redwood City, California, 2009.
18. Haselton CB, Deierlein GG. Assessing seismic collapse safety of modern reinforced concrete moment framebuildings. Technical Report 2007/08, Pacific Earthquake Engineering Research Center: Berkeley, CA, 2007.
19. Shome N, Cornell CA. Probabilistic seismic demand analysis of nonlinear structures. Technical Report RMS-35,RMS Program: Stanford CA, 1999.
20. Song J, Ellingwood BR. Seismic reliability of special moment steel frames with welded connections: I, Journal ofStructural Engineering 1999; 125(4):357–371.
30(4):320–336.27. Bradley BA, Dhakal RP, MacRae GA, Cubrinovski M. Prediction of spatially distributed seismic demands in
specific structures: structural response to loss estimation, Earthquake Engineering & Structural Dynamics 2010;39(6):591–613, DOI 10.1002/eqe.955.
28. Taghavi S, Miranda E. Response assessment of nonstructural building elements. Technical Report 2003/05, PacificEarthquake Engineering Research Center: Berkeley, CA, 2003.
29. Haselton CB, Baker JW. Ground motion intensity measures for collapse capacity prediction: choice of optimalspectral period and effect of spectral shape, 8th National Conference on Earthquake Engineering: San Francisco,California, 2006; 10 pp.
30. Bradley BA, Dhakal RP, MacRae GA, Cubrinovski M. Prediction of spatially distributed seismic demands inspecific structures: ground motion and structural response, Earthquake Engineering & Structural Dynamics 2010;39(5):501–520, DOI 10.1002/eqe.954.
31. Jayaram N, Lin T, Baker JW. A computationally efficient ground-motion selection algorithm for matching a targetresponse spectrum mean and variance, Earthquake Spectra 2011; 27(3):797–815, DOI 10.1193/1.3608002.
32. Lin T. Advancement of hazard-consistent ground motion selection methodology. Ph.D. Thesis, Stanford University,2012.
33. Baker JW, Cornell CA. Which spectral acceleration are you using? Earthquake Spectra 2006; 22(2):293–312.