ICEUBI2019 International Congress on Engineering — Engineering for Evolution Volume 2020 Conference Paper Inertial Dynamometer for Shell Eco-marathon Engine: Validation Daniel Filipe da Silva Cardoso, João Manuel Figueira Neves Amaro, and Paulo Manuel Oliveira Fael Universidade da Beira Interior Abstract This paper aims to validate the construction of an inertia dynamometer. These types of dynamometers allow easy characterization of internal combustion engines. To validate the dynamometer, tests were carried out with the same engine (Honda GX 160) installed in the UBIAN car and kart, which after calculating the inertia and measuring engine acceleration in each test performed, allows to create the torque characteristic curve from the engine. Keywords: Inertia, Dynamometer, Torque, Flywheel, UBIAN 1. Introduction This work was performed at the University of Beira Interior in order to study the engine currently used at UBIAN car. This is a car build by a team that participate in Shell Ecomarathon. The engine used is Honda GX 160 [1]. This article intends to focus on demonstrating and validating a simple system of engine characterization. To make this validation three types of tests will be performed: the first one coupling the engine on inertia dynamometer; the second one is done using the whole vehicle; a third test, performed on a go kart, will be used as a control test. 2. Dynamometers For the study and development of internal combustion engines, it is important to know their performance characteristics. It is only possible to know if there has been an improvement in engine performance if it is possible to make comparisons with the modifications and adjustments made. The fastest way to quickly characterize an engine is by using dynamometers These can be divided in two groups: brake dynamometers and inertia dynamometers. Within these, we can also distinguish between those intended for testing engines (engine How to cite this article: Daniel Filipe da Silva Cardoso, João Manuel Figueira Neves Amaro, and Paulo Manuel Oliveira Fael, (2020), “Inertial Dynamometer for Shell Eco-marathon Engine: Validation” in International Congress on Engineering — Engineering for Evolution, KnE Engineering, pages 704–715. DOI 10.18502/keg.v5i6.7091 Page 704 Corresponding Author: Daniel Filipe da Silva Cardoso [email protected]Received: 26 November 2019 Accepted: 13 May 2020 Published: 2 June 2020 Publishing services provided by Knowledge E Daniel Filipe da Silva Cardoso et al. This article is distributed under the terms of the Creative Commons Attribution License, which permits unrestricted use and redistribution provided that the original author and source are credited. Selection and Peer-review under the responsibility of the ICEUBI2019 Conference Committee.
Transcript
ICEUBI2019International Congress on Engineering — Engineering for EvolutionVolume 2020
Conference Paper
Inertial Dynamometer for Shell Eco-marathonEngine: ValidationDaniel Filipe da Silva Cardoso, JoãoManuel Figueira Neves Amaro, and PauloManuel Oliveira FaelUniversidade da Beira Interior
AbstractThis paper aims to validate the construction of an inertia dynamometer. These types ofdynamometers allow easy characterization of internal combustion engines. To validatethe dynamometer, tests were carried out with the same engine (Honda GX 160)installed in the UBIAN car and kart, which after calculating the inertia and measuringengine acceleration in each test performed, allows to create the torque characteristiccurve from the engine.
This work was performed at the University of Beira Interior in order to study the enginecurrently used at UBIAN car. This is a car build by a team that participate in ShellEcomarathon. The engine used is Honda GX 160 [1].
This article intends to focus on demonstrating and validating a simple system ofengine characterization. To make this validation three types of tests will be performed:the first one coupling the engine on inertia dynamometer; the second one is done usingthe whole vehicle; a third test, performed on a go kart, will be used as a control test.
2. Dynamometers
For the study and development of internal combustion engines, it is important to knowtheir performance characteristics. It is only possible to know if there has been animprovement in engine performance if it is possible to make comparisons with themodifications and adjustments made.
The fastest way to quickly characterize an engine is by using dynamometers Thesecan be divided in two groups: brake dynamometers and inertia dynamometers. Withinthese, we can also distinguish between those intended for testing engines (engine
How to cite this article: Daniel Filipe da Silva Cardoso, João Manuel Figueira Neves Amaro, and Paulo Manuel Oliveira Fael, (2020), “InertialDynamometer for Shell Eco-marathon Engine: Validation” in International Congress on Engineering — Engineering for Evolution, KnE Engineering,pages 704–715. DOI 10.18502/keg.v5i6.7091
dynamometers, where the engine is directly coupled to the dynamometer) and thosefor testing vehicles (chassis dynamometers) [2].
2.1. Inertial dynamometer
Inertia dynamometers that was used in this work consist of a flywheel with a specificmass which is connected to the engine by a mechanical transmission. The inertiaflywheel is a steel disc that, when put in rotation around an axis perpendicular to itsplane and positioned in his own centre, it is applies a force counteracting the designatedmovement, inertia [3].
2.2. On Car tests
The car in question, the UBIAN, was built at UBI to participate in the Shell Eco-marathonin 2019.
UBIAN car and go-kart tests use car inertia as a load applied to the engine; Thisinertia produces a driving force that opposes the linear motion of the vehicle and itsacceleration, characterizing this acceleration, we can also characterize the torque onthe drive wheel and vehicle engine.
These tests are performed on a zero-slope track so that the inclination does notinfluence the tests.
3. Data Acquisition
Data acquisition is done directly to the engine in the dynamometer test and in the carby the control unit, which we implemented in the engine in question.
An EMU Black from Ecumaster was used.
To ensure high noise immunity the USB connection has galvanic isolation allowing a25Hz data frequency.
In addition to the USB connection, the EMU Black has a CAN and serial connectionmodule that can be used for data logging, from where we get the engine speed as afunction of time. By obtaining this data the engine torque is then calculated.
The kart data acquisition is done differently: a GPS application is used which givesus the linear velocity as a function of time.
DOI 10.18502/keg.v5i6.7091 Page 705
ICEUBI2019
This method is very practical and easy to use; however, it has clear disadvantagesas it is a very low frequency data acquisition in the order of 1 Hz which makes it difficultto obtain reliable results.
4. Inertial Dynamometer, UBIAN Car, Go Kart and EngineCaracterization
4.1. Inertial dynamometer
In order to calculate the torque, it is first necessary to estimate the inertia of the flywheel.Flywheel moment of inertia was estimated based on its dimensions andmaterial density,being a steel with a density of 7841 kg/m3. Its inertia is the product of half the mass ofthe disk by the radius squared, obtaining the value of 0.0744827 Kg.m2.
𝐼𝑣 = 12∗𝑀∗𝑅2 (1)
𝐼𝑣 = Flywheel inertia (kg.m2)
𝑀 = Total disk mass (kg)
𝑅 = Flywheel radius (m)
The transmission between the engine and the flywheel is made by a centrifugalclutch followed by a chain drive (standard Honda GX160 gearbox). The gearbox has areduction of 2:1 and is connected to the flywheel using a toothed belt for transmissionwith a ratio of 4:1 higher than the input speed, ie the flywheel speed is twice the engine.
Therefore, the final gear ratio will be twice the engine speed, as can be seen inFigure 1, which is the comparison between the speed of the engine and the flywheelsimultaneously in one of the tests performed. Is possible to see the engine idle speedwhich is approximately at 1200 rpm; after setting the throttle to 100% the engine speedbegins to increase and stabilizing at approximately 2000 rpm and reaching the clutchbalance point between engine and flywheel speed, which is increasing almost linearlyfrom 0 rpm to 4000 rpm. It is from 13 seconds that the engine starts to acceleratetogether with the flywheel, so between 13 and 26 seconds describe very similar curves,which is the range of values to consider for direct engine characterization. At 26 secondsthe throttle is set to 0% where deceleration occurs and the end of the test.
DOI 10.18502/keg.v5i6.7091 Page 706
ICEUBI2019
0
2000
4000
6000
8000
10000
0 5 10 15 20 25 30 35rp
mTime [s]
Flywheel Engine
Figure 1: Engine and flywheel acceleration.
Figure 2: Engine on the inertial dynamometer.
4.2. UBIAN Car
As explained earlier all vehicles have an associated inertia. There are several ways tocalculate the inertia of a car [4]. Calculation forms are based on vehicle characteristics,such as vehicle mass and wheel radius.
So, to get the UBIAN inertia we went to measure the total mass including the driver,which is 243 kg, the wheel radius is 0.28 m and the gear ratio from engine to wheel is10:1. So, the body equivalent inertia is the wheel radius squared multiplied by the massdivided by the gear ratio also squared, where:
𝐼𝑐 = 𝑅2 ∗𝑀𝑖2 (2)
𝐼𝑐 = Body inertia (kg.m2)
𝑅 = Wheel radius including tire height (m) M= Total body mass (kg)
𝐼 = Engine to wheel drive ratio
DOI 10.18502/keg.v5i6.7091 Page 707
ICEUBI2019
0
1000
2000
3000
4000
5000
0 5 10 15 20 25 30
rpm
Time [s]
Dynamometer UBIAN_car
Figure 3: Comparison between the acceleration of the engine on the dynamometer and on the car.
The imposed gear ratio of 10 times lower car wheel speed compared to engine speedallowed limiting the car speed to 40 km/h, being the maximum allowed for UBIAN. Butas we can see from the graph in Figure 3, there has been a decrease in accelerationtime compared to the dynamometer test, these decrease in acceleration time, causesa reduction in the points acquired by the datalogger but due to the datalogger’s 25 Hzacquisition rate allows us to acquire enough points to characterize this acceleration.
Figure 4: UBIAN during the Shell Eco Marathon London 2019.
4.3. Go kart
Go kart inertia is calculated as previously done in the car. The mass of the vehicle is190.5 kg including the driver, the final drive is 5.231 and the wheel radius is 0.139 m. The
DOI 10.18502/keg.v5i6.7091 Page 708
ICEUBI2019
inertia is calculated as done in the car by applying equation 2, and a value of 0.13451kg/m2 is obtained.
4.4. Engine Inertia
All internal combustion engines have a certain associated inertia due to moving partsinside such as the flywheel, clutch and crankshaft. Often this is not mentioned becausethey are engines of high power, so it becomes less relevant [5]. With everything in lowpower engines, we have concluded that we should consider it having a significant valueand that it will be added to the inertia of both the flywheel and the vehicles.
Compared to the flywheel, an engine inertia corresponds to 19% of the flywheelinertia, making a difference of approximately 5% in the calculation of torque. An internalengine inertia is then estimated by measuring the acceleration time from the engine toits maximum speed of 5000 rpm, where you get a maximum acceleration of 398.879rad/s2 at 3256 rpm.
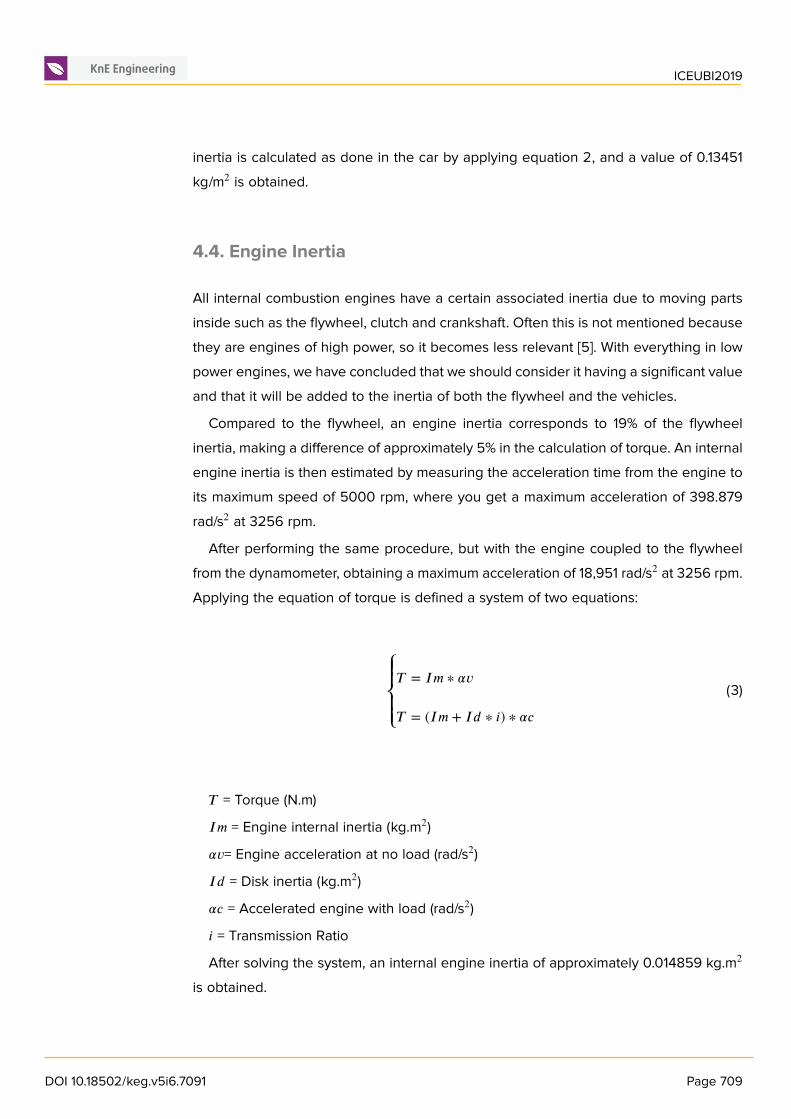
After performing the same procedure, but with the engine coupled to the flywheelfrom the dynamometer, obtaining a maximum acceleration of 18,951 rad/s2 at 3256 rpm.Applying the equation of torque is defined a system of two equations:
⎧⎪⎪⎨⎪⎪⎩
𝑇 = 𝐼𝑚 ∗ 𝛼𝑣
𝑇 = (𝐼𝑚 + 𝐼𝑑 ∗ 𝑖) ∗ 𝛼𝑐(3)
𝑇 = Torque (N.m)
𝐼𝑚 = Engine internal inertia (kg.m2)
𝛼𝑣= Engine acceleration at no load (rad/s2)
𝐼𝑑 = Disk inertia (kg.m2)
𝛼𝑐 = Accelerated engine with load (rad/s2)
𝑖 = Transmission Ratio
After solving the system, an internal engine inertia of approximately 0.014859 kg.m2
is obtained.
DOI 10.18502/keg.v5i6.7091 Page 709
ICEUBI2019
5. Obtained Results
Several tests were performed on the dynamometer, on the car and on the go kart, fromthese tests we make an average that allowed us to reduce the external interferenceslike eventual malfunctions or variations of the engine parameters in results.
The tests were performed with accelerations from 1000 rpm where the engine wasidling to the maximum speed reached by the engine at 5000 rpm, but the useful enginespeed range for calculating engine torque is only between 2500 and 3500 rpm. It isfrom 2500 rpm that, as we can see in Figure 5, the engine starts to stabilize the rotationspeed these means de that the centrifugal clutch stops slipping, and the engine is underfull load; at 3500 rpm, the torque of this engine abruptly drops, and it is not efficient touse it in after this rotation.
The results for the different executes tests between the 2500 and 3500 rpm areshown below.
0
500
1000
1500
2000
2500
3000
0 0.1 0.2 0.3 0.4 0.5 0.6
rpm
Time [s]
Clutch_slip
Figure 5: Characterization of the clutch slipping.
5.1. Torque calculation
After obtaining the engine speed (rpm) values as a function of the time (s) given to usby the control unit data logger, we can do the calculations to get the engine torquevalues.
The first step is convert rpm to rad/s with the following equation:
𝜔 = 𝑁 ∗ 𝜋30 (4)
𝑁 = Engine speed (rpm)
𝜔 = Angular engine speed (rad/s)
The second step is to create an angular velocity plot as a function of time, so thata trend curve with these values can be plotted, obtaining a 3rd degree polynomialequation.
DOI 10.18502/keg.v5i6.7091 Page 710
ICEUBI2019
The third step is to obtain the angular acceleration (rad/s2) being the first derivativeof the equation in order to time obtained previously and then the acceleration value foreach time value is calculated.
Finally, the engine torque is calculated with the following equation:
𝑇 = 𝛼𝑚 ∗ (𝐼 + 𝐼𝑚) (5)
𝑇 = Engine torque (N.m)
𝛼𝑚 = Angular acceleration of the engine (rad/s2)
𝐼 = Inertia (kg.m2)
𝐼𝑚 = Internal engine inertia (kg.m2)
𝑖 = Transmission Ratio
5.2. Inertial Dynamometer
The average torque obtained from the tests on the inertial dynamometer is 5.6 N.m andhave reach a maximum torque at 2950 rpm with 6.5 N.m on the test shown on Figure6.
On Figure 7 it is possible to see the average from tests performed on the inertialdynamometer and the trend line that is used to characterize the torque produced bythe engine. The trend line is a polynomial of second degree that achieve a 0.994coefficient of determination.
01234567
2300 2500 2700 2900 3100 3300 3500 3700
Torq
ue [
Nm
]
rpm
T[Nm]
Figure 6: Test with the maximum torque performed on the inertial dynamometer.
5.3. UBIAN car
The average torque obtained from tests on the car is 6.0 N.m and have reach amaximumtorque at 2918 rpm with 6.4 N.m on the test shown on Figure 8.
DOI 10.18502/keg.v5i6.7091 Page 711
ICEUBI2019
y = -4.01E-06x2 + 2.30E-02x - 26.8R² = 0.994
01234567
2300 2500 2700 2900 3100 3300 3500 3700Torq
ue [
Nm
]rpm
T[Nm] Polinomial (T[Nm])
Figure 7: Average torque from the tests performed on the inertial dynamometer.
On Figure 9 is possible to see the average from tests performed on the UBIAN car andthe trend line that is used to characterize the torque produced by the engine. The trendline is a polynomial of second degree that achieve a 0.974 coefficient of determination.
01234567
2300 2500 2700 2900 3100 3300 3500 3700
Torq
ue [
Nm
]
rpm
T[Nm]
Figure 8: Test with the maximum torque performed on the UBIAN car.
y = -1.79E-06x2 + 1.04E-02x - 8.99E+00R² = 9.74E-01
01234567
2300 2500 2700 2900 3100 3300 3500 3700
Torq
ue [
Nm
]
rpm
T[Nm] Polinomial (T[Nm])
Figure 9: Average torque from the tests performed on UBIAN car.
5.4. Go kart
The torque calculation on the go kart test is very similar to what was done in previoustests, the difference now is the way the data acquisition was done. These were collectedby a GPS application allowing us to know the linear velocity versus time and not theangular velocity of the engine.
DOI 10.18502/keg.v5i6.7091 Page 712
ICEUBI2019
After obtaining the linear velocity we calculated the kart acceleration by calculatingthe trend time velocity vs timeline, as in previous tests.
In this case, the torque, is also calculated with equation 5, being the angular acceler-ation of the engine equal to the linear acceleration, multiplied by the transmission ratiodivided by the wheel radius. So, the equation is as follows:
𝑇 = 𝑎𝑅 ∗ 𝑖 ∗ (𝐼𝑘 + 𝐼𝑚) (6)
𝑇 = Engine torque (Nm)
𝑎 = Linear acceleration (m/s2)
𝐼𝑘 = Inertia of the kart (kg.m2)
𝐼𝑚 = Internal engine Inertia (kg.m2)
𝑖 = Transmission Ratio
𝑅 = Wheel radius (m)
The average torque obtained from the tests on the go kart is 5.9 N.m and have reacha maximum torque at 2500 rpm with 6.7 N.m on the test shown on Figure 10.
On Figure 11 is possible to see the average from tests performed on the go kart andthe trend line that is used to characterize the torque produced by the engine. The trendline is a polynomial of second degree that achieve a 1 coefficient of determination.
01234567
2300 2500 2700 2900 3100 3300 3500 3700
Torq
ue [
Nm
]
rpm
T[Nm]
Figure 10: Test with the maximum torque performed on the go kart.
y = -8.33E-08x2 - 6.55E-04x + 8.77R² = 1
01234567
2300 2500 2700 2900 3100 3300 3500 3700
Torq
ue [
Nm
]
rpm
T[Nm] Polinomial (T[Nm])
Figure 11: Average torque from the tests performed on go kart.
DOI 10.18502/keg.v5i6.7091 Page 713
ICEUBI2019
6. Results Discussion
As we can see in the different tests practically all graphs have torque values between5 Nm and 6.5 Nm, so was we can observe on Figure 12 these three methods match theobtained results and give similar torque characteristic curves.
The go kart tests served to validate the values we thought were too low for the HondaGX 160, according to the manufacturer, who says the engine torque is 10 Nm [6]. In carand dynamometer tests we use the same engine and in go kart tests we use a secondengine although the same model. Torque values were obtained in the same order ofmagnitude as previous tests, we can therefore say that the maximum useful torque ofthe motor is 6 Nm.
0
1
2
3
4
5
6
7
2300 2500 2700 2900 3100 3300 3500 3700
Torq
ue [
Nm
]
rpmT[Nm]_UBIAN_car T[Nm]_Dynamometer
T[Nm]_Go_Kart T[Nm]_Average
Figure 12: Comparison between the tests performed on UBIAN car, dynamometer, go kart and the averagefrom these three tests.
7. Conclusions
We can then conclude that the objective of the work was achieved, we can see thegraph of Figure 12 that all as torque curves in the different tests almost overlap andthe obtained curves from the tests performed on UBIAN and dynamometer are typi-cally characteristic curves from internal combustion engines, the characteristic torqueobtained from the test performed on go kart differs slightly from the others becausethe GPS acquisition rate used is only 1 Hz, but in terms of magnitude this curve givescorroborative results from the other curves.
The use of the inertia dynamometer is then valid, allowing the quantification ofmodifications and tunings in the Honda GX 160.
DOI 10.18502/keg.v5i6.7091 Page 714
ICEUBI2019
Acknowledgment
This work has been supported by the project Centro-01-0145-FEDER-000017 - EMaDeS- Energy, Materials and Sustainable Development, co-financed by the Portugal 2020Program (PT 2020), within the Regional Operational Program of the Center (CENTRO2020) and the European Union through the European Regional Development Fund(ERDF). The authors wish to thank the opportunity and financial support that permittedto carry on this project. And C-MAST/ Centre for Mechanical and Aerospace Science andTechnologies. project UID / EMS / 00151/2013 C-MAST, POCI-01-0145-FEDER-007718.
References
[1] Honda-engines-eu.com. (2019). Engine model details - Honda
Engines. [online] Available at: http://www.honda-engines-eu.com/engine-model-details?p_p_id=enginedetail_WAR_enginedetail&p_p_lifecycle=0&p_p_state=normal&p_p_mode=view&p_p_col_id=column4&p_p_col_count=1&_enginedetail_WAR_enginedetail_display=specifications&e=14 [Accessed 11 Nov.2019].
[2] M. Plint, Dynamometers and the measurement of torque. Oxford: Butterworth –Heinemann, 1997.
[3] J. C. B. Pereira, Estudo de uma bancada para ensaio de motores diesel. Panambi:DeTec- Engenharia Mecânica Campus, 2011.
[4] S. Piotr Fundowicz, Estimation of Mass Moments of Inertia of Automobile. IEEE, 2018.
[5] N. L. M. Predrag, D. Mrdja, A method for quick estimation of engine moment ofinertia based on an experimental analysis of transient working process. Belgrade:University of Belgrade, 2018.
[6] A. C. R. T. Marian Poloni, Parameters optimization of minimotor. Bratislava: SlovakUniversity of Technology, 2015.