Unsolicited PPEA Proposal for P25 Radio System Middlesex County, Virginia December 1, 2014 Confidential Information Page i Confidential Information Table Harris Corporation, acting through its RF Communications Division, complies with all federal, state and local laws regarding disclosure of information in its proposals. However, Harris Corporation must protect and must prevent the disclosure of its trade secret and certain other information that is exempt from disclosure under the Virginia Freedom of Information Act. Pursuant to Code of Virginia Section 2.2-4342(F), trade secrets and proprietary information submitted by a bidder, offeror or contractor in connection with a procurement transaction shall not be subject to the Virginia Freedom of Information Act (§2.2-3700 et seq.) provided the bidder, offeror or contractor: (i) invokes the protections of this section prior to or upon submission of the data or other materials, (ii) identifies the data or other materials to be protected, and (iii) states the reasons why protection is necessary. As identified in the Confidential Information Table below, the Harris Proposal submitted as part of the County’s procurement process includes certain trade secret information which falls under the identified trade secret exemptions and is exempt from disclosure for the reasons set forth below. In addition, Harris has provided certain information about its personnel that is exempt from disclosure pursuant to the exemption set forth in Code of Virginia Section 2.2-3705.1. Harris has provided to the County a copy of its Proposal with its trade secret and personnel information redacted that the County can use to respond to Virginia Freedom of Information Act requests asking for a copy of the Harris Proposal. Document Confidential Material Rationale Unsolicited PPEA Proposal Unsolicited PPEA Proposal for P25 Radio System Partial Redaction The redacted information is exempt from disclosure pursuant to the Code of Virginia Sections cited below. Annual Report None Conceptual System Description Partial Redaction The redacted information is exempt from disclosure pursuant to Virginia Code Sections 2.2-4342(F) and 2.2-3705.6 (10) Sample Resumes Full Redaction The redacted information is exempt from disclosure pursuant to Virginia Code Section 2.2-4342(F) and 2.2-3705.6 (10) and also Section 2.2-3705.1(1) Pricing None Equipment Specifications None As a general overview of the trade secret information of the Harris Corporation, please note that there are only a few companies in the United States that offer for sale land mobile radio system products and services. There are also just a relatively few number of opportunities each year to sell these products and services. The Harris Corporation trade secret information has economic value by not being generally known to or readily ascertainable by its competitors and other third parties and Harris diligently works to maintain and protest the secrecy of this information. Divulging this trade secret information will injure Harris in future sales opportunities.
Transcript
Unsolicited PPEA Proposal for P25 Radio System Middlesex County, Virginia
December 1, 2014
Confidential Information
Page i
Confidential Information Table
Harris Corporation, acting through its RF Communications Division, complies with all federal, state and local laws regarding disclosure of information in its proposals. However, Harris Corporation must protect and must prevent the disclosure of its trade secret and certain other information that is exempt from disclosure under the Virginia Freedom of Information Act. Pursuant to Code of Virginia Section 2.2-4342(F), trade secrets and proprietary information submitted by a bidder, offeror or contractor in connection with a procurement transaction shall not be subject to the Virginia Freedom of Information Act (§2.2-3700 et seq.) provided the bidder, offeror or contractor: (i) invokes the protections of this section prior to or upon submission of the data or other materials, (ii) identifies the data or other materials to be protected, and (iii) states the reasons why protection is necessary. As identified in the Confidential Information Table below, the Harris Proposal submitted as part of the County’s procurement process includes certain trade secret information which falls under the identified trade secret exemptions and is exempt from disclosure for the reasons set forth below. In addition, Harris has provided certain information about its personnel that is exempt from disclosure pursuant to the exemption set forth in Code of Virginia Section 2.2-3705.1. Harris has provided to the County a copy of its Proposal with its trade secret and personnel information redacted that the County can use to respond to Virginia Freedom of Information Act requests asking for a copy of the Harris Proposal.
Document Confidential Material Rationale
Unsolicited PPEA Proposal
Unsolicited PPEA Proposal for P25 Radio System
Partial Redaction The redacted information is exempt from disclosure pursuant to the Code of Virginia Sections cited below.
Annual Report
None
Conceptual System Description
Partial Redaction The redacted information is exempt from disclosure pursuant to Virginia Code Sections 2.2-4342(F) and 2.2-3705.6 (10)
Sample Resumes
Full Redaction The redacted information is exempt from disclosure pursuant to Virginia Code Section 2.2-4342(F) and 2.2-3705.6 (10) and also Section 2.2-3705.1(1)
Pricing
None
Equipment Specifications
None
As a general overview of the trade secret information of the Harris Corporation, please note that there are only a few companies in the United States that offer for sale land mobile radio system products and services. There are also just a relatively few number of opportunities each year to sell these products and services. The Harris Corporation trade secret information has economic value by not being generally known to or readily ascertainable by its competitors and other third parties and Harris diligently works to maintain and protest the secrecy of this information. Divulging this trade secret information will injure Harris in future sales opportunities.
November 26, 2014 Mr. Matthew L. Walker County Administrator County of Middlesex P. O. Box 428 Saluda, Virginia 23149 Subject: Unsolicited ROM Proposal for the Middlesex County Public Safety Radio System Dear Mr. Walker: Thank you for the opportunity to provide a solution for Middlesex County’s mission critical communication needs. Our Harris team is providing a cost effective solution for a UHF P25 Phase 2 public safety radio communications network in response to your adoption of the Public-Private Education Facilities and Infrastructure act of 2002, Va. Code Sections 56-575.1, et seq., (the "PPEA") and the Public-Private Transportation Act of 1995, Va. Code Section 56-556 (the "PPTA"). Thank you for the opportunity to share your vision on such an important community project. Our public safety professionals risk their lives every day to improve our quality of life and deserve a world class radio network. As a former law enforcement professional, I am personally committed to ensuring they receive the best solution possible, as I know firsthand how critical it is to have assured communications.
Furthermore, we are committed to ensuring you receive the best possible value. Our conceptual design
concentrates on providing optimal coverage, superior reliability, direct operability with neighboring jurisdictions, and
local service delivered by Harris. The following are some of the benefits the Middlesex County Public Safety
Communication users will experience by selecting Harris.
Harris’ Experience Since 1958, Harris PSPC has called Central Virginia home. We have implemented
over 500 trunked communication networks including many in Virginia, the counties
of Bedford, Amherst, Rockingham, Pittsylvania, Spotsylvania and the Cities of
Lynchburg and Harrisonburg.
Local Service Our world class global service and parts depot is located in Bedford County. This
provides for the most optimal response to meet all of your needs whether replacing
a small part or requesting the deployment of our Emergency Response Radio
Cache to assist in a crisis. Superior Technology Our proposal includes our “Award Winning” IP Based VIDA® solution that provides
superior redundancy with our distributed control point technology with virtualized services. This means Middlesex County will have optimal coverage, direct operability with your neighbors and future ready technology today.
Best Value Our P25 Phase 2 linear simulcast solution maximizes countywide coverage and
delivers peak performance with budget consciousness. With our proposed offering, Middlesex County will have affordable assured communications today and a lower cost of ownership over the life of your system.
Harris is your local company uniquely qualified with the experience to assure a successful project for Middlesex County. As requested in the Virginia Code, a processing fee of $5,000 is included for this conceptual design phase. If the County or the County’s agent(s) anticipates any additional review costs will be necessary, Harris wishes to be contacted prior to these costs being incurred. We look forward to the opportunity to earn your business and develop a long term relationship. If you have any questions or need any additional information, please do not hesitate to contact me at your convenience. Harris would like the opportunity to review our conceptual proposal with you and your project team as soon as your team is available. Thank you in advance for your time and consideration of our offering.
Sincerely,
William C. Spruill Account Manager
Unsolicited PPEA Proposal for P25 Radio System Middlesex County, Virginia
November 2014
Table of Contents
Page 1
Table of Contents
Unsolicited PPEA Proposal for P25 Radio System
Annual Report
Conceptual System Description
Sample Resumes
Pricing
Equipment Specifications
Unsolicited PPEA Proposal for P25 Radio System Middlesex County, Virginia
November 2014
Page 1
Unsolicited PPEA Proposal for P25 Radio System
Qualifications and Experience 1. Identify the legal structure of the entity or consortium of entities making the proposal. Identify the
organizational structure for the project, the management approach and how each entity in the
structure fits into the overall team.
Harris Corporation is a publicly traded company (NYSE: HRS).
Harris is an international communications and information technology company
serving government and commercial markets in more than 125 countries.
Headquartered in Melbourne, Florida, the company has approximately $5 billion of
annual revenue and about 14,000 employees — including 6,000 engineers and
scientists.
Harris RF Communications Division’s, Public Safety and Professional
Communications (PSPC) business unit is providing this response to Middlesex
County. The following provides a description of the typical organizational structure
for the project and our management approach.
The organization chart shows the Harris team assigned to the project. It also
reflects the various support and management functions that will provide critical
program and technical assistance throughout the course of the project.
Unsolicited PPEA Proposal for P25 Radio System Middlesex County, Virginia
November 2014
Page 2
Management Escalation Procedures
Project Management Overview
Harris uses disciplined management processes and procedures and shared
responsibilities defined within the Program Management Institute Body of
Knowledge (PMBOK) framework. The methodology will ensure the project’s
technical and programmatic success.
Balanced implementation of management methodologies ensures that the
project needs are met through effective planning, monitoring, and control
of all project activities. Harris balances those priorities with the need to
collaborate effectively with the City and the user agency community to
ensure project success.
Clear definition of shared responsibilities provides well-defined guidelines
Project management is one of Harris’ key strengths in the deployment of complex LMR communications systems. Through effective system implementation, close collaboration among all stake holders, and a cohesive project management team, Harris will successfully execute City of The City’s radio system
implementation project on time and within budget.
Unsolicited PPEA Proposal for P25 Radio System Middlesex County, Virginia
November 2014
Confidential, Proprietary & Competition Sensitive
Page 3
for optimal engagement of all parties in a highly collaborative, open
relationship focused on radio system project success.
Management methodologies tied to the project success ensures that
management priorities remain firmly grounded in the ultimate need to
deliver a system that works and supports the mission objectives of public
service and public safety agencies.
Harris has assigned experienced program management, engineering, field services,
and other professional support staff to implement the project. In addition, the
Project Management Office and other support staff in the Lynchburg, Virginia,
headquarters will support this team.
Harris Implementation Team Support Harris has implemented over 500 large-scale radio communications systems
throughout the world. These systems include many of the largest networks for
public-safety, utility, and transit customers in the industry. Given this decades long
success, Harris has a reputation for building strong, cohesive project teams.
Standing with the project implementation team, the Harris management and
support resources are immediately available to Middlesex County to ensure
implementation challenges are addressed in a timely and effective manner – before
they impact the project budget, schedule or system performance.
Harris Management Escalation The following chart shows the Harris management escalation path, beginning with
the assigned project implementation team, through their region functional
managers, and up to the Harris South Region Program Manager. It also reflects the
various support and management functions that continue to provide critical
program and technical assistance throughout the course of the project.
The Harris project manager, , is Middlesex County’s primary point of
contact for resolving issues that may arise during implementation of the County’s
new Public Safety Radio System. Greg and his implementation team use their
collective experience, skills and resources to anticipate and resolve project
challenges before they become problems. Harris project implementation planning
integrates the business systems and support organizations within Harris’ Public
Safety and Professional Communications and uses proven standardized processes
and industry best practices to ensure a successful project implementation.
However, when a situation occurs that the County believes requires direct
communication with, and involvement by, technical subject matter experts or
senior management staff - those resources are only a phone call away.
Unsolicited PPEA Proposal for P25 Radio System Middlesex County, Virginia
November 2014
Confidential, Proprietary & Competition Sensitive
Page 4
Unsolicited PPEA Proposal for P25 Radio System Middlesex County, Virginia
November 2014
Confidential, Proprietary & Competition Sensitive
Page 5
2. Describe the experience of the entity or consortium of entities making the proposal, the key
principals and project managers involved in the proposed project, including experience with
projects of comparable size and complexity, including prior experience bringing similar projects
to completion on budget and in compliance with design, land use, service and other standards.
Describe the length of time in business, business experience, public sector experience and
other engagements of the entity or consortium of entities. Include the identity of any entities
that will provide design, construction and completion guarantees and warranties and a
description of such guarantees and warranties.
Harris is an international communications and information technology company
serving government and commercial markets in more than 125 countries.
Headquartered in Melbourne, Florida, the company has approximately $5 billion of
annual revenue and about 14,000 employees — including 6,000 engineers and
scientists. Harris is dedicated to developing best-in-class assured
communications® products, systems and services. Harris is organized into three
operating divisions:
Integrated Network Solutions: Consists of Harris IT Services, Harris
CapRock Communications, and Healthcare Solutions business units.
Government Communications Systems: Consists of the Civil Programs,
Defense Programs, and National Intelligence Programs business units.
RF Communications: Consists of the Public Safety and Professional
Communications (PSPC) business unit and the Tactical Radios and
Defense Communications business units.
The Public Safety and Professional Communications (PSPC) is the business unit
providing this response to Middlesex County. The following provides a description
of the organizational structure for the project and our management approach.
Harris PSPC has over 80 years of communications experience.
As a business unit within RF Communications, PSPC designs and delivers assured,
interoperable voice and data communication systems and products for public
safety, military, utility, transportation and commercial organizations. PSPC
supplies both advanced Internet Protocol (IP)-based communication networks and
traditional wireless communications systems and products and the industry leading
Unity multi-band portable radio. The VIDA technology platform uses the power of
IP network technology to provide state-of-the-art functionality and interoperability
among legacy analog LMR systems and new public and private digital LMR voice
and data technologies.
Harris provides a wide variety of RF and IT/IP solutions to industry, federal, state
and local government agencies in the U.S. and around the world. With several
decades of focus in mission critical systems for first responders, Harris was the first
manufacturer to deploy fully end-to-end IP-based P25 systems.
Over 500 trunked radio systems including implementation of digital trunked
statewide multi-agency systems for the State of Florida, the Commonwealth of
Pennsylvania, and the State of Nevada have been successfully deployed. Large,
Unsolicited PPEA Proposal for P25 Radio System Middlesex County, Virginia
November 2014
Confidential, Proprietary & Competition Sensitive
Page 6
wide-area and multi-state land mobile radio (LMR) systems have also been
deployed for some of the nation’s largest utility companies. In addition, the U.S.
Department of Defense Joint-National Capitol Region network in the Washington
D.C. area has deployed a wide area, IP-based P25 network. The network provides
the U.S. Army, Navy, Air Force and Marine Corps with wireless communication
on base and throughout the National Capitol Region. This IP-based P25 network
links nearly 20 military bases and allows interoperability with local public safety
agencies to provide one integrated regional network. The delivered product
provides the highest levels of critical radio communications interoperability. Over
100 P25 systems have now been delivered by Harris to our customers in North
America. Whether a large or smaller system, the approach remains the same, to
deliver the solution that meets customer expectations, conforms to technical
requirements and implements an on-time, on-budget project.
New statewide customers are choosing the benefits that Harris P25 products,
services, and technology has to offer. With new state and province-wide contracts
for the Province of Alberta, State of Oregon, State of Maine, State of Delaware,
and State of Vermont, customers are recognizing that Harris’ VIDA network
architecture is a powerful tool that can carry them forward to support beyond just
today’s needs.
Experience and System Highlights
Harris: The proven choice for your communications Harris is the right choice. Experience and proven performance in advanced, wide-
area voice and data radio networks guarantee a smooth and timely project
implementation.
Demonstrated Wide-Area System Experience. With an extensive list of accepted
systems, Harris understands what is required to deploy complex radio projects.
frequency band or some combination, public safety, public service or private
sector, it has been successfully deployed by Harris. An example of public safety
systems deployments is presented in the following figure:
Sample of Harris Large Public Safety Radio Systems
Public Safety Customer
Country Status Comments
Commonwealth of Pennsylvania
USA System Accepted, adding broadband and other agencies
Largest system in North America
State of Florida USA System Accepted, continue to add
agencies
Proven performance in extreme weather
State of Nevada USA System Accepted Extreme terrain and weather conditions
Unsolicited PPEA Proposal for P25 Radio System Middlesex County, Virginia
November 2014
Page 7
Government of Saskatchewan
Canada System Accepted Extreme weather
E-COMM Vancouver Public Safety
Canada System Accepted Large urban system simulcast
State of Tasmania Australia System Accepted Statewide system
National Capitol Region
USA System Accepted Interoperability with 60+ Federal, state and local
agencies
Miami-Dade County USA System Accepted High system traffic, simulcast
Metro Denver systems
USA System Accepted High system traffic, simulcast
York County, Pennsylvania
USA System Accepted High system traffic, simulcast
Harris utility systems such as the one deployed for AEP span large regions of the
country. With an East and West region, the AEP system actually spans over 11
states and 250,000 miles.
Sample of Harris Large Utility Customer
Utility Customer
American Electric Power (AEP)
Texas Utility (TU) Electric
Ameren
Consumers Energy
Florida Power & Light
Our experience in design, manufacturing, installation, training and maintenance are
at work every day in many of the world’s largest, most advanced wireless systems.
This assurance provides the customer confidence needed to team with Harris on
critical projects.
Harris provides a standard warranty with our systems and equipment. Additional
detail on our standard warranty and ongoing maintenance support can be provided
during future phases of this project.
3. Provide the names, prior experience, addresses, telephone numbers and e-mail addresses of
persons within the entity or consortium of entities who will be d irectly i nvolved in the project
or who may be contacted for further information.
Sample resumes of project team members are included as an attachment to this
response.
Unsolicited PPEA Proposal for P25 Radio System Middlesex County, Virginia
November 2014
Page 8
4. Provide a current or most recently audited financial statement of the entity or entities and each
partner with an equity interest of ten percent (10%) or greater, and/or each entity or partner
that has performed work of aggregate value exceeding Two Hundred and Fifty Thousand
Dollars ($250,000.00) in Middlesex County in the past ten (10) years.
Refer to Harris’ annual report which is included with this response.
5. Identify any persons known to the proposer who would be obligated to disqualify themselves
from participation in any transaction arising from or in connection to the project pursuant to
The Virginia State and Local Government Conflict of Interest Act, Chapter 31 (Section 2.2-
3100 et seq.) of Title 2.2.
Harris has not identified any persons who would be obligated to disqualify
themselves from participation in any transaction arising from or in connection with
this project
6. For each entity, major subcontractor, key principal, and/or project manager that will be
utilized or involved in the project, provide a statement, listing the prior projects and clients of
each for the past five (5) years and contact i n f o r m a t i o n for same (name, address,
telephone number, e-mail address). If an entity has worked on more than ten (10) projects during
this period, it may limit its prior project list to ten (10), but shall first include all projects similar
in scope and size to the proposed project and, second, it shall include as many of its most recent
projects as possible. Each shall be required to submit all performance evaluation reports or other
documents, which are in its possession evaluating performance during the preceding five (5)
years in terms of cost, quality, schedule maintenance, safety and other matters relevant to the
successful project development, operation and completion.
Harris PSPC has over 80 years of communications experience.
As a business unit within RF Communications, PSPC designs and delivers assured,
interoperable voice and data communication systems and products for public
safety, military, utility, transportation and commercial organizations. PSPC
supplies both advanced Internet Protocol (IP)-based communication networks and
traditional wireless communications systems and products and the industry leading
Unity multi-band portable radio. The VIDA technology platform uses the power of
IP network technology to provide state-of-the-art functionality and interoperability
among legacy analog LMR systems and new public and private digital LMR voice
and data technologies.
Harris provides a wide variety of RF and IT/IP solutions to industry, federal, state
and local government agencies in the U.S. and around the world. With several
decades of focus in mission critical systems for first responders, Harris was the first
manufacturer to deploy fully end-to-end IP-based P25 systems.
Harris has provided a sample of projects that are similar in nature to that which is
provided in our conceptual design to the County.
Unsolicited PPEA Proposal for P25 Radio System Middlesex County, Virginia
November 2014
Page 9
Harris References
Virginia’s Region 2000, Multijurisdictional Shared Communications, 800 MHz P25IP Simulcast System
Pittsylvania County, Virginia
Harrisonburg-Rockingham Emergency Communications Radio System (HREC )
Unsolicited PPEA Proposal for P25 Radio System Middlesex County, Virginia
November 2014
Page 10
Harris References
Macon-Bibb County, Georgia
St. Mary’s County, Maryland
Unsolicited PPEA Proposal for P25 Radio System Middlesex County, Virginia
November 2014
Page 11
Project Characteristics 1. Provide a description of the project, including the conceptual design.
Describe the proposed project in sufficient detail so that type and intent of the project, the
location, and the communities that may be affected are clearly identified.
Refer to the attached conceptual design description.
2. Identify and fully describe any work to be performed by the County or any other public entity.
As an industry leader in the design, installation and deployment of Mission Critical
radio systems around the world, Harris plans to engage Middlesex County on noted
key areas of design, testing and implementation of the proposed P25 Phase 2
trunked radio system.
As partners for a successful solution, Harris does plan for Middlesex County, at a
minimum, to review system designs, coverage test plans, final acceptance test
plans. Once installed, Harris also requests that the county attend the final coverage
and acceptance testing of the deployed system.
3. Include a list of all federal, state and local permits and approvals required for the project and
a schedule for obtaining such permits and approvals.
Based on the final scope of work, Harris will obtain required permits and
approvals.
4. Identify any anticipated adverse social, economic, environmental and transportation i mpacts of
the project measured against the jurisdiction 's comprehensive land use plan and applicable
ordinances and design standards. Specify the strategies or actions to mitigate known impacts
of the project.
Harris has reviewed the Middlesex Comprehensive Land Use Plan and does not
anticipate any impacts. We will review the final Statement of Work with the
County relative to the Land Use Plan.
5. Identify the projected positive social, economic, environmental and transportation i mpacts of
the project measured against the jurisdiction 's comprehensive land use plan and applicable
ordinances and design standards.
Harris anticipates overall very positive social, economic, environmental and
transportation impact for the project as a whole in regards to the county’s
comprehensive land use plan and applicable ordinances and design standards due
to a significantly more efficient and effective use of the county’s public safety
resources with the choice of the Harris solution, state of the art technology at an
overall lower cost of ownership over the life of the network.
Unsolicited PPEA Proposal for P25 Radio System Middlesex County, Virginia
November 2014
Page 12
6. Identify the proposed schedule for the work on the project, including sufficient time for the
County’s review and the estimated time for completion.
A preliminary schedule for the project is as follows:
Preliminary Project Plan Tasks Number of Days (3 site)
CDR Preparation 60
Manufacturing & Staging 95
Infrastructure Installation 35
System Optimization 20
Dispatch Console Installation 10
Functional and Coverage Testing 30
Reliability Testing 30
Cutover Planning and Cutover 45
Migration and Training 20
System Acceptance
(months from contract award)
14 months
7. Proposed allocation of risk and liability, and assurances for timely completion of the project.
The project manager is responsible for risk management. Risk refers to future
conditions or circumstances that may adversely affect the project outcome.
The key to risk management is to be proactive and resolve the potential problem
before it occurs. The project manager will regularly perform risk assessment with
the team to identify varying levels of potential risk throughout the project. High-
level risks demand more focus than lesser risks. The team formulates a risk
management plan to mitigate potential impacts to the project deliverables.
All project team members are responsible for identifying and reporting project
risks. Team members often recognize risks while conducting project tasks and
report them to the project manager during reviews. Identified risks are recorded
and assessed. Then risk mitigation plans are developed and put into place as
appropriate. The project manager will review risks as identified and discuss with
(Informal Customer Name) during the project reviews. The compilation of
identified risks and developed solutions constitutes the risk action plan.
Unsolicited PPEA Proposal for P25 Radio System Middlesex County, Virginia
November 2014
Page 13
Risk Management Plan
8. State assumptions related to ownership, legal liability, law enforcement and operation of the
project and the existence of any restrictions on the County’s use of the project.
Harris assumes Middlesex County will provide the structure and form of the legal
entity that will perform the services needed.
9. Provide information relative to phased openings of the proposed project.
N/A
Unsolicited PPEA Proposal for P25 Radio System Middlesex County, Virginia
November 2014
Page 14
Project Financing
1. Provide a preliminary estimate and estimating methodology of the cost of the work by phase,
segment, or both.
Refer to the attached conceptual pricing.
2. Submit a plan for the development, financing and operation of the project showing the
anticipated schedule on which funds will be required. Describe the anticipated costs of and
proposed sources and uses for such funds, including any anticipated debt service costs. The
operational plan should include appropriate staffing levels and associated costs based upon
the County’s adopted operational standards.
Harris will propose a system implementation plan and a program management plan
along with an operational plan as required. Harris has over 80 years of LMR
system implementation experience with over 500 systems implemented.
Systems are paid per milestone payment plans over the implementation period.
Our standard payment terms are as follow:
Contract Execution 20%
Critical Design Review 10%
Equipment Staging @ Factory 20%
Infra Equipment Shipment 25%
Services ( Monthly) 18months 10%
Installation 10%
Final Acceptance 5%
Harris will work with Middlesex County to reach agreed upon payment terms.
If the County chooses to finance the system procurement, Harris has financial
partners willing to provide Municipal Tax Exempt Leases for terms up to 15 years,
pending credit review.
3. Include a list and discussion of assumptions underlying all major elements of the plan.
Please refer to the Conceptual Design Description for assumptions.
4. Identify the proposed risk factors and methods for dealing with these factors. Describe methods
and remedies associated with any financial default.
Harris experienced program management staff will manage the program and assess
any risk and address the risk through our proven problem resolution process.
Harris’ solution, in conjunction with our team members, will assume continuity
and completion of the program and address any financial default as needed. Our
Unsolicited PPEA Proposal for P25 Radio System Middlesex County, Virginia
November 2014
Page 15
team members are reviewed and chosen as to performance and financial viability in
order to qualify as a Harris contractor.
Harris’ risk management procedures are described above.
5. Identify any local, state or federal resources that the proposer contemplates requesting
for the project along with an anticipated schedule of resource requirements. Describe the total
commitment, if any, expected from governmental sources and the timing of any anticipated
commitment, both one-time and on-going.
Harris will work with the County to develop a comprehensive responsibility matrix
should the County chose to accept the Harris proposal for conceptual-phase
consideration.
6. Identify the need, if any, for the County to provide either its general obligation or moral
obligation backing. The underlying assumptions should address this need and/or state that the
credit would be via a "Service Agreement", for example. Any debt issuance should be
expected to receive an investment grade rating from a nationally recognized statistical rating
agency. If the natural rating is not investment grade, the County may require the use of credit
enhancements.
Harris does not expect any additional obligation other than the agreed upon
contract resulting from successful negotiations between the two parties. Harris will
support the County if there is a need for debt issuance or if the County chooses to
enter into an agreement with a financing partner.
7. Outline what impact, if any, a drop in interest rates would have on the ultimate annual project
cost. Indicate if there is a method to refinance for cost savings or does the firm only receive
benefit of this potential.
The Harris final proposal and contract will be firm fixed price and as such any
interest rate impact would not affect the project costs.
8. Outline the financial penalties, if any, that would result should the County wish to terminate a
project early or restructure the cash flows for some reason of its own choosing. The firm should
be specific on this point.
The Harris contract includes a termination clause that would make the County
liable for work completed and in process. The final contract terms and conditions
will outline the termination clause.
Unsolicited PPEA Proposal for P25 Radio System Middlesex County, Virginia
November 2014
Page 16
9. Provide a breakout of the fees to any underwriting firm(s) and the type of obligation the
firm(s) is (are) using with a financing component. Be specific as to tax-exempt, taxable,
floating rate, fixed rate, etc.
If the County chooses to enter into an agreement with one of our financing partners
for a Municipal Tax Exempt Lease, it will be based on the County’s credit rating
and credit review.
The County, as a lessee, will be responsible for a documentation fee, any
insurance, taxes and Tax Opinion. Harris will work with the County to address the
fees as we define the solution and financing approach.
Unsolicited PPEA Proposal for P25 Radio System Middlesex County, Virginia
November 2014
Page 17
Project Benefit and Compatibility
1. Identify who will benefit from the project, how they will benefit and how the project will
benefit the County and the overall community.
The County and the overall community will benefit from a state of the art, best
valued P25 Phase 2 “Assured Communications” network that first responders count
on to perform when and where needed. The county will have a fully redundant
public safety communications network with the most desired features and advanced
technology in public safety communications today, Middlesex first responders will
have improved coverage throughout the county and more effective interoperability
with their neighbors in the region.
2. Identify any anticipated public support or opposition, as well as any anticipated government
support or opposition (including that in any affected jurisdiction), for the project.
Harris anticipates public and government support for an improved public safety
communications network for a best value, state of the art technology solution at an
overall lower cost of ownership to be in the best interest of the County and the
citizens of Middlesex County. Harris does not anticipate any public or
governmental opposition to a thoughtful and deliberate procurement of a much
need public safety asset.
3. Explain the strategy and plans, including the anticipated timeline that will be carried out to
involve and inform the general public, business community, and governmental agencies in areas
affected by the project.
Harris will partner in support the County in its effort and timeline to inform or
educate the general public, business community and governmental agencies in
areas affected by the project as appropriate and consistent with our business
standards.
4. Describe any anticipated significant benefits to the community and the County, i ncluding
anticipated benefits to the economic, social, environmental, transportation, etc., condition of
the County and whether the project is critical to attracting or maintaining competitive industries
and businesses to the County.
Harris anticipates that the County and the overall community will benefit from the
thoughtful procurement of a state of the art, best valued P25 Phase 2 “Assured
Communications” network that the Counties first responders can count on. The
County will have a fully redundant public safety communications network that is
future ready with the most desired features and advanced technology in public
safety communications today. Middlesex first responders will have improved
coverage throughout the County and more efficient interoperability with their
neighbors in the region. With effective and efficiently operating public safety
elements in the county, the county and its governmental agencies will be able to
deliver the desired services and respond to the needs of its citizens not only today
Unsolicited PPEA Proposal for P25 Radio System Middlesex County, Virginia
November 2014
Page 18
but well into the future. This gives Middlesex County a competitive advantage to
other localities that have yet to address this critical public safety and governmental
responsibility and makes Middlesex County a more desirable place to live and/or
do business.
.
5. Describe compatibility with the County’s and/or affected jurisdiction's local comprehensive
plan (including related environmental, land use and facility standards ordi nances, where
applicable), infrastructure development plans, transportation plans, the capital improvements
plan and capital budget or other government spending plan.
Harris anticipates that its offering and any subsequently negotiated contract for a
public safety radio network will be compatible with the County’s capital
improvements plan and capital budget or other governmental spending plan.
6. Any additional information as the County may request
N/A
HARRIS CORPORATION 2014 ANNUAL REPORT
HARRIS CORPORATION 2014 ANNUAL REPORT
REvENUE DOLLARS IN BILLIONS
2012 $5.5
2013 $5.1
2014 $5.0
NON-gAAP EARNiNgs PER shARE*IN DOLLARS
$5.00 2014
$4.90 2013 $5.20 2012
dividENds PAid PER cOmmON shAREIN DOLLARS
$1.682014
$1.48 2013 $1.22 2012
2012 $619
2013 $655
2014 $648
FREE cAsh FLOW* DOLLARS IN MILLIONS
Revenue
GAAP Income from Continuing Operations
Non-GAAP Income from Continuing Operations*
GAAP Income Per Diluted Share from Continuing Operations
Non-GAAP Income Per Diluted Share form Continuing Operations*
GAAP Return on Invested Capital
Diluted Weighted Average Common Shares Outstanding (Millions)
Worldwide Employment
$5,111.7
$466.4
$549.4
$4.16
$4.90
17.1%
111.2
14,000
$5,012.0
$539.8
$539.8
$5.00
$5.00
20.4%
107.3
14,000
$5,451.3
$558.7
$605.0
$4.80
$5.20
15.8%
114.8
15,200
DOLLARS IN MILLIONS,ExCEPT PER SHARE AMOUNTS
2013JUNE 28
2012JUNE 29
2014JUNE 27
FISCAL yEARS ENDED
Harris is an international communications and information technology company serving government and commercial markets in more than 125 countries. Headquartered in Melbourne, Florida, the company has approximately $5 billion of annual revenue
and about 14,000 employees—including 6,000 engineers and scientists. Harris is dedicated to developing best-in-class assured communications®
products, systems and services. Additional information about Harris Corporation is available at harris.com.
HARRISc O R P O R A T i O N
NySE:HRS
*Amounts used in this Annual Report that are considered non-GAAP financial measures are defined and reconciled to the most directly comparable GAAP financial measures on page 4 of this Annual Report. GAAP refers to U.S. generally accepted accounting principles.
HIGHLIGHTSFiNANciAL
HARRIS CORPORATION 2014 ANNUAL REPORT
DESIGN: MTN ADVERTISING, INC.
PRINTING: RR DONNELLEy—ORLANDO PLANT
HARRISc O R P O R A T i O N
NySE:HRS
CORPORATE HEADQUARTERSHarris Corporation1025 West NASA BoulevardMelbourne, Florida 32919-00011-321-727-9100harris.com
STOCK ExCHANGEHarris common stock is listed and traded on the New york Stock Exchange. Ticker Symbol: HRS
TRANSFER AGENT AND REGISTRARComputershare211 Quality Circle, Suite 210College Station, Tx 778451-888-261-6777 | Outside the U.S., please dial 1-201-680-6578www.computershare.com/investor
SHAREHOLDER SERVICESComputershare maintains the records for our registered shareholders and can assist you with a variety of shareholder-related services at no charge. The Computershare automated telephone voice response system, at 1-888-261-6777, is available 24 hours a day, 7 days a week, to conduct a wide variety of secure transactions.
Electronic access to your financial statements and shareholder communications is available 24 hours a day, 7 days a week, via Computershare’s website, computershare.com/investor. Visit this website to view and print Investment Plan Statements, Investor Activity Reports, 1099 tax documents, notification of ACH transmissions, transaction activities, annual meeting materials and other selected correspondence.
you also can send mail to Computershare at:
Computershare P.O. Box 30170 College Station, Tx 77842-3170(U.S. mail only)
ANNUAL MEETINGThe 2014 annual meeting of shareholders will be held on October 24 at the Customer Briefing Center on the Harris Corporate Headquarters campus, Melbourne, Florida, starting at 1:00 p.m. Eastern Time. The meeting will be webcast and can be accessed from a link on the Investor Relations page on the Harris website: harris.com.
INDEPENDENT ACCOUNTANTSErnst & young LLP | Orlando, Florida
Share your Annual Report feedback:harris.com/annual_report
FORWARD-LOOKING STATEMENTSThis report, including the letter to shareholders, contains forward-looking statements that are based on the views of management regarding future events at the time of publication of this report. These forward-looking statements, which include, but are not limited to: our plans, strategies, and objectives for future operations; new products, services, or developments; future economic conditions; outlook; the value of contract and program awards; the effect of our acquisitions on our business; our growth potential; and the potential of the industries and markets we serve, are subject to known and unknown risks, uncertainties, and other factors that may cause our actual results to be materially different from those expressed in or implied by each forward-looking statement. These risks, uncertainties, and other factors are discussed in our Form l0-K for the fiscal year ended June 27, 2014.
ANNUAL CERTIFICATIONSThe most recent certifications by our Chief Executive Officer and Chief Financial Officer pursuant to sections 302 and 906 of the Sarbanes-Oxley Act of 2002 were filed as exhibits to our Form l0-K for the fiscal year ended June 27, 2014. Our most recent annual CEO certification regarding Harris compliance with corporate governance listing standards was submitted to the New york Stock Exchange on October 30, 2013.
SHAREHOLDERSiNFORmATiON FOR
HARRIS CORPORATION 2014 ANNUAL REPORT
shareholdersletter to
In the 1960s, satellite manufacturers struggled to create lightweight antennas that could be tucked away for launch, but also unfurl in space to provide the full reflection needed to transmit back to earth. after dozens of trials and errors, harris engineers discovered a flexible mesh material—similar to pantyhose—that fit all those parameters when encased in a thin layer of gold. This novel solution resulted in a line of antennas that still provide vital communications that millions of people depend upon every day.
This example highlights two core principles that have driven the company’s success since its founding in 1895—excellence and innovation. They are part of the company’s fabric, our dNa, and have provided harris the resilience not only to weather the many challenges we have faced during the past 119 years, but to prosper.
In 2014 these same principles enabled us to adapt to U.s. government budget constraints as we continued our focus on improving operational efficiency and increasing our r&d investment to speed the introduction of new solutions. This strategy is already generating results for our customers and shareholders and—more importantly—positions us for long-term success.
Financials
Fiscal 2014 was another year of solid overall financial results for harris. despite a challenging market, we continued to invest in our future while delivering shareholder value.
Financial highlights include:
• Revenue of $5 billion—with 30 percent coming from international markets
• GAAP income from continuing operations of $540 million
• GAAP EPS of $5.00 per diluted share
• Free cash flow of $648 million—120 percent of income from continuing operations
We also continued our balanced capital deployment strategy, using $300 million to repurchase shares and increasing our dividend by 14 percent. over the past three years, our dividend has increased at a 19 percent compound annual growth rate.
1
excellence
We continued to expand the scope and scale of our harris Business excellence (hBX) program—the core operating system for our companywide commitment to excellence. The program provides the framework and tools that empower every employee to drive continuous improvement in business performance and customer satisfaction.
one tool we’re widely deploying is Value engineering to reduce cost and improve quality and performance for products already in production. For example, we currently use die cast aluminum for many key mechanical parts inside our highly successful Falcon III® radios. While die cast aluminum offers significant cost savings over traditional machined parts, we’re investigating an even more cost effective solution with injection-molded magnesium technology. We expect to cut over to this new process in fiscal 2015.
We’re also rigorously applying Value stream Mapping (VsM) throughout the company. In our space structures business, we used VsM to eliminate downtime and coordinate production builds to reduce the cost of a complex boom-and-hinge mechanical assembly. leveraging ideas from internal and external sources, we altered the project work flow and parts delivery schedule to drive a 35 percent cost reduction and more than 20 percent improvement in part lead time—illustrating how good ideas can emanate from collaboration across the value stream.
Under hBX, we’re actively addressing every area of spend across the company—challenging our cost assumptions, removing waste and driving improvements using every lever available. and we have increased our focus on areas traditionally considered largely un-addressable. savings from these and other hBX initiatives enable us to increase our investments in company-funded r&d to spur further innovation and growth.
Innovation
research and development represents the foundation of our technical innovation. In fiscal 2014 we increased our r&d invest- ment by 12 percent to $264 million—representing a significant 5.3 percent of company revenue.* our investments are focused on adding new features to existing products, tailoring offerings for international markets, and creating totally new-to-the-world solutions to address our customers’ toughest communications challenges.
significant product introductions this past year included multiple additions to our popular Falcon® family of tactical radios, such as the new aN/VrC-118 Mid-Tier Networking Vehicular radio, the rF-330E Wideband Rifleman Team Radio, the RF-340 Multi-channel Manpack, and the rF-7850a airborne Networking Mission radio.
But while we’re investing more, we also are working to ensure we’re investing wisely. We have adopted a portfolio management approach to optimize investment at the enterprise rather than the business unit level, and we have introduced standardized processes and common metrics across the company to track progress and gauge success. Importantly, we have also established Core Technology Centers to fully leverage cross-company capabilities.
however, innovation at harris isn’t just limited to the lab. Many of our most successful “inventions” involve introducing new business models to the marketplace. For example:
• Harris reshaped the tactical communications industry with a “commercial” approach to product development, investing our own r&d funds to speed the introduction of new features and functions to our existing line of Falcon radios, giving warfighters the mission-critical communications they need at a faster rate and a lower cost than the traditional program-of- record approach.
• We partnered with the FAA to introduce a fully-managed service to replace a proprietary network for the Faa’s nationwide air traffic management communications backbone. The Faa Telecommunications Infrastructure (FTI) network leverages commercial telecommunications networks and harris’ mission-critical network capabilities to connect controllers and pilots across more than 4,000 nodes, resulting in significantly higher bandwidth and uptime at half the cost of the traditional approach.
• And we’re at the forefront of a whole new approach to space accessibility, leveraging hosted payloads—with customers “piggybacking” applications on other satellites—to speed time-to-mission and lower cost. The space industry and U.s. government have embraced the approach, with harris already building more than 100 hosted payloads for global aircraft tracking, space environment monitoring and other applications.
Value-added services represent another possible market-changing opportunity for harris, and we’re researching potential new applications in markets such as weather and geospatial information where we have well-established technology and domain expertise. These applications—from ship tracking to crop planting to 3D mapping—are evolving rapidly and are less susceptible to the ebb and flow of government funding.
outlook
With the U.s. government budget environment under pressure and the threat of sequestration remaining on the horizon, our strategy continues to be to focus on the things we control—providing affordable, innovative solutions to customers, improving operational excellence, and maximizing free cash flow.
our company has a strong leadership team in place dedicated to upholding our core values and the highest ethical standards. We remain committed to being a responsible employer and good corporate citizen, providing a safe workplace, implementing sustainability initiatives and supporting educational, charitable, military and first-responder assistance efforts.
I am proud of what we accomplished this past year. our solid performance is due to the talent, dedication and hard work of our 14,000 harris employees—and I want to thank them for their continued commitment to excellence and innovation. I also want to thank our customers for the confidence they have in harris. We remain dedicated to providing them high quality, innovative and affordable solutions.
Finally, I want to recognize and thank steve Kaufman who retires from the Board of directors at the end of his current term after more than 14 years of service to the company.
as I look ahead to 2015, I believe that our solid strategy and progress in excellence and innovation will continue to increase our global competitiveness and position us well for long-term growth.
Thank you for your continued confidence in our company.
William M. Brown Chairman, President and Chief Executive Officer AUGUST 25, 2014
2
76952 Harris_Narrative R3.indd 2 8/27/14 11:57 AM
HARRIS CORPORATION 2014 ANNUAL REPORT4
INCOME FROM CONTINUING OPERATIONS AND INCOME FROM CONTINUING OPERATIONS PER DILUTED SHARE
FREE CASH FLOW
(a) Adjustments for fiscal 2013 included a $126.7 million ($83.0 million after-tax, or $.74 per diluted share) charge for Company-wide restructuring and other actions, including prepayment of long-term debt, asset impairments, a write-off of capitalized software, facility consolidation, workforce reductions and other associated costs.
(b) Adjustments for fiscal 2012 included a $58.2 million ($46.3 million after-tax, or $.40 per diluted share) charge for integration and other costs in our Integrated Network Solutions segment associated with our acquisitions of CapRock Communications, the Global Connectivity Services business of the schlumberger group and Carefx Corporation.
(c) Net capital expenditures reflects additions of property, plant and equipment, net of proceeds from the sale of property, plant and equipment.
(d) adjustment for write-off of capitalized software in our Integrated Network solutions segment as a result of a change in accounting estimate.
To supplement our condensed consolidated financial statements presented in accordance with U.S. generally accepted accounting principles (GAAP), we provide additional measures of income from continuing operations, income from continuing operations per diluted common share, cash flow, and research and development costs, adjusted to exclude or deduct certain costs, charges, expenses and losses. harris management believes that these non-GAAP financial measures, when considered together with the GAAP financial measures, provide information that is useful to investors in understanding period-over-period operating results separate and apart from items that may, or could, have a disproportionately positive or negative impact on results in any particular period. Harris management also believes that these non-GAAP financial measures enhance the ability of investors to analyze Harris’ business trends and to understand Harris’ performance. In addition, Harris may utilize non-GAAP financial measures as a guide in its forecasting, budgeting, and long-term planning process and to measure operating performance for some management compensation purposes. any analysis of non-GAAP financial measures should be used only in conjunction with results presented in accordance with GAAP. A reconciliation of these non-GAAP financial measures with the most directly comparable financial measures calculated in accordance with GAAP follows:
DOLLARS IN MILLIONS, EXCEPT PER SHARE AMOUNTS
INCOME FROM CONTINUING OPERATIONS
PER DILUTED
SHARE
Fiscal 2013 GAAP $466.4 $4.16
adjustments 83.0(a) .74(a)
Fiscal 2013 non-GAAP $549.4 $4.90
Fiscal 2012 GAAP $558.7 $4.80
adjustments 46.3(b) .40(b)
Fiscal 2012 non-GAAP $605.0 $5.20
FISCAL YEAR ENDED
DOLLARS IN MILLIONS JUNE 29, 2012 JUNE 28, 2013 JUNE 27, 2014
Net cash provided by operating activities $852.9 $833.0 $849.2
less net capital expenditures(c) (233.8) (178.2) (201.3)
Free cash flow $619.1 $654.8 $647.9
Fiscal 2014 free cash flow as a percentage of fiscal 2014 GAAP income from continuing operations of $539.8 million
120%
RECONCILIATION OF NON-GAAP FINANCIAL MEASURES AND REGULATION G DISCLOSURE
RESEARCH AND DEVELOPMENT COSTSFISCAL YEAR ENDED
DOLLARS IN MILLIONS JUNE 28, 2013 JUNE 27, 2014
GAAP $254.1 $264.1
adjustment(d) (17.8)
Non-GAAP $236.3 $264.1
% increase from fiscal 2013 non-GAAP research and development costs 12%
76952 Harris_Narrative R2.indd 4 8/25/14 7:34 PM
UNITED STATESSECURITIES AND EXCHANGE COMMISSION
WASHINGTON, D.C. 20549FORM 10-K
(Mark One)Í ANNUAL REPORT PURSUANT TO SECTION 13 OR 15(d) OF THE SECURITIES
EXCHANGE ACT OF 1934
For the fiscal year ended June 27, 2014OR
‘ TRANSITION REPORT PURSUANT TO SECTION 13 OR 15(d) OF THE SECURITIESEXCHANGE ACT OF 1934For the transition period from to
Commission File Number 1-3863
HARRIS CORPORATION(Exact name of registrant as specified in its charter)
Delaware 34-0276860(State or other jurisdiction of incorporation or organization) (I.R.S. Employer Identification No.)
1025 West NASA BoulevardMelbourne, Florida 32919
(Address of principal executive offices) (Zip Code)
Registrant’s telephone number, including area code: (321) 727-9100Securities Registered Pursuant to Section 12(b) of the Act:
Title of each class Name of each exchange on which registered
Common Stock, par value $1.00 per share New York Stock ExchangeSecurities Registered Pursuant to Section 12(g) of the Act: None
Indicate by check mark if the registrant is a well-known seasoned issuer, as defined in Rule 405 of the SecuritiesAct. Yes Í No ‘
Indicate by check mark if the registrant is not required to file reports pursuant to Section 13 or Section 15(d) of theAct. Yes ‘ No Í
Indicate by check mark whether the registrant (1) has filed all reports required to be filed by Section 13 or 15(d) of theSecurities Exchange Act of 1934 during the preceding 12 months (or for such shorter period that the registrant was requiredto file such reports), and (2) has been subject to such filing requirements for the past 90 days. Yes Í No ‘
Indicate by check mark whether the registrant has submitted electronically and posted on its corporate Web site, if any,every Interactive Data File required to be submitted and posted pursuant to Rule 405 of Regulation S-T during the preceding12 months (or for such shorter period that the registrant was required to submit and post such files). Yes Í No ‘
Indicate by check mark if disclosure of delinquent filers pursuant to Item 405 of Regulation S-K is not contained herein,and will not be contained, to the best of registrant’s knowledge, in definitive proxy or information statements incorporated byreference in Part III of this Form 10-K or any amendment to this Form 10-K. Í
Indicate by check mark whether the registrant is a large accelerated filer, an accelerated filer, a non-accelerated filer, or asmaller reporting company. See the definitions of “large accelerated filer,” “accelerated filer” and “smaller reportingcompany” in Rule 12b-2 of the Exchange Act.Large accelerated filer Í Accelerated filer ‘
Non-accelerated filer ‘ (Do not check if a smaller reporting company) Smaller reporting company ‘
Indicate by check mark whether the registrant is a shell company (as defined in Rule 12b-2 of the ExchangeAct). Yes ‘ No Í
The aggregate market value of the voting common equity held by non-affiliates of the registrant was $7,473,837,008(based upon the quoted closing sale price per share of the stock on the New York Stock Exchange) on the last business day ofthe registrant’s most recently completed second fiscal quarter (December 27, 2013). For purposes of this calculation, theregistrant has assumed that its directors and executive officers as of December 27, 2013 are affiliates.
The number of shares outstanding of the registrant’s common stock as of August 22, 2014 was 104,769,240.Documents Incorporated by Reference:
Portions of the registrant’s definitive Proxy Statement for the 2014 Annual Meeting of Shareholders scheduled to beheld on October 24, 2014, which will be filed with the Securities and Exchange Commission within 120 days after the end ofthe registrant’s fiscal year ended June 27, 2014, are incorporated by reference into Part III of this Annual Report onForm 10-K to the extent described therein.
HARRIS CORPORATION
ANNUAL REPORT ON FORM 10-K FOR THE FISCAL YEAR ENDED JUNE 27, 2014
ExhibitsThis Annual Report on Form 10-K contains trademarks, service marks and registered marks of Harris Corporation
and its subsidiaries. Bluetooth® is a registered trademark of Bluetooth SIG, Inc. All other trademarks are the propertyof their respective owners.
Cautionary Statement Regarding Forward-Looking StatementsThis Annual Report on Form 10-K (this “Report”), including “Item 7. Management’s Discussion and Analysis of
Financial Condition and Results of Operations,” contains forward-looking statements that involve risks anduncertainties, as well as assumptions that, if they do not materialize or prove correct, could cause our results to differmaterially from those expressed in or implied by such forward-looking statements. All statements other than statementsof historical fact are statements that could be deemed forward-looking statements, including, but not limited to,statements concerning: our plans, strategies and objectives for future operations; new products, systems, technologies,services or developments; future economic conditions, performance or outlook; the outcome of contingencies; thepotential level of share repurchases or dividends; the value of our contract awards and programs; expected cash flowsor capital expenditures; our beliefs or expectations; activities, events or developments that we intend, expect, project,believe or anticipate will or may occur in the future; and assumptions underlying any of the foregoing. Forward-looking statements may be identified by their use of forward-looking terminology, such as “believes,” “expects,”“may,” “should,” “would,” “will,” “intends,” “plans,” “estimates,” “anticipates,” “projects” and similar words orexpressions. You should not place undue reliance on these forward-looking statements, which reflect ourmanagement’s opinions only as of the date of the filing of this Report and are not guarantees of future performance oractual results. Factors that might cause our results to differ materially from those expressed in or implied by theseforward-looking statements, from our current expectations or projections or from our historical results include, but arenot limited to, those discussed in “Item 1A. Risk Factors” of this Report. All forward-looking statements are qualifiedby, and should be read in conjunction with, those risk factors. Forward-looking statements are made in reliance on thesafe harbor provisions of Section 27A of the Securities Act of 1933, as amended (the “Securities Act”), andSection 21E of the Securities Exchange Act of 1934, as amended (the “Exchange Act”), and are made as of the date offiling of this Report, and we disclaim any intention or obligation, other than imposed by law, to update or revise anyforward-looking statements, whether as a result of new information, future events or developments or otherwise, afterthe date of filing of this Report or, in the case of any document incorporated by reference, the date of that document.
PART I
ITEM 1. BUSINESS.
HARRISHarris Corporation, together with its subsidiaries, is an international communications and information technology
company serving government and commercial markets in more than 125 countries. We are dedicated to developingbest-in-class assured communications® products, systems and services for global markets, including RFcommunications, integrated network solutions and government communications systems.
Harris Corporation was incorporated in Delaware in 1926 as the successor to three companies founded in the1890s. Our principal executive offices are located at 1025 West NASA Boulevard, Melbourne, Florida 32919, and ourtelephone number is (321) 727-9100. Our common stock is listed on the New York Stock Exchange under the symbol“HRS.” On June 27, 2014, we had approximately 14,000 employees. Unless the context otherwise requires, the terms“we,” “our,” “us,” “Company” and “Harris” as used in this Report refer to Harris Corporation and its subsidiaries.
GeneralWe structure our operations primarily around the products and services we sell and the markets we serve, and we
report the financial results of our operations in the following three business segments:
‰ RF Communications, serving (i) U.S. Department of Defense and International Tactical Communications and(ii) Public Safety and Professional Communications markets;
‰ Integrated Network Solutions, serving (i) IT Services, (ii) Managed Satellite and Terrestrial CommunicationsSolutions and (iii) Commercial Healthcare Solutions markets; and
‰ Government Communications Systems, serving (i) Civil, (ii) National Intelligence and (iii) Defense markets.
In the third quarter of fiscal 2012, our Board of Directors approved a plan to exit our cyber integrated solutionsoperation (“CIS”), which provided remote cloud hosting, and to dispose of the related assets, and we completed the sale ofthe remaining assets of CIS in the first quarter of fiscal 2014. In the fourth quarter of fiscal 2012, our Board of Directorsapproved a plan to divest our broadcast communications operation (“Broadcast Communications”), which provided digitalmedia management solutions in support of broadcast customers, and we completed the sale of Broadcast Communicationsin the third quarter of fiscal 2013. Both CIS and Broadcast Communications were formerly part of our Integrated NetworkSolutions segment. For additional information regarding discontinued operations, see Note 3: Discontinued Operations in
1
the Notes to Consolidated Financial Statements in this Report (the “Notes”). Except for disclosures related to our cashflows, or unless otherwise specified, disclosures in this Report relate solely to our continuing operations.
At the beginning of the first quarter of fiscal 2014, to leverage the breadth of our information technology (“IT”)enterprise network and information assurance capabilities for the IT services market, we began managing our cybersecurity network testing operation as part of our Integrated Network Solutions segment rather than our GovernmentCommunications Systems segment. As a result, we reassigned $2.4 million of goodwill (determined on a relative fairvalue basis) to our Integrated Network Solutions segment from our Government Communications Systems segment. Thehistorical results, discussion and presentation of our business segments as set forth in this Report have been adjusted toreflect the impact of this change to our business segment reporting structure for all periods presented in this Report.
Financial information with respect to all of our other activities, including corporate costs not allocated to ourbusiness segments or discontinued operations, is reported as part of the “Unallocated corporate expense” or “Non-operating income (loss)” line items in our Consolidated Financial Statements and accompanying Notes.
Financial Information About Our Business SegmentsFinancial information with respect to our business segments, including revenue, operating income or loss and total
assets, and with respect to our operations outside the United States, is contained in Note 23: Business Segments in theNotes and is incorporated herein by reference.
Description of Business by Segment
RF CommunicationsRF Communications is a global supplier of secure tactical radio communications and high-grade encryption
solutions for military, government and commercial customers and also of secure communications systems andequipment for public safety, utility and transportation customers. RF Communications serves (i) U.S. Department ofDefense and International Tactical Communications and (ii) Public Safety and Professional Communications markets.
U.S. Department of Defense and International Tactical Communications Market: We design, develop andmanufacture a comprehensive line of secure radio communications products and systems for manpack, handheld,vehicular, airborne, strategic fixed-site and shipboard installations that span the communications architecture fromHigh Capacity Line of Site, backbone radios to small soldier personal radios and tablet computers. The radios operatein various radio frequency bands, including high-frequency (“HF”), very high-frequency (“VHF”), ultra high-frequency (“UHF”) and L-band, with higher frequencies supported for some of our network backbone products. Ourradio systems are highly flexible, interoperable and capable of supporting diverse mission requirements. Our Falcon®
families of tactical radios are built on software-defined radio platforms that are reprogrammable to add features orsoftware upgrades. Our Falcon radios also have the highest grade embedded encryption and provide highly mobile,secure and reliable network communications capability without relying on a fixed infrastructure. This capability allowswarfighters, for example, to remain connected with each other and their command structures and support organizations.It also provides them the ability to communicate information and maintain situational awareness of both friendly andopposing forces, which are critical to both the safety and success of their missions. Our radio systems have been widelydeployed throughout all branches of the U.S. Department of Defense (“DoD”) and, in the international market, havebeen sold to more than 100 countries through our international distribution channels consisting of regional sales officesand a broad dealer network and have become the standard in many of those countries.
Unlike many of our competitors operating on a government-funded programs-driven business model, we operate inthis market on a “commercial” customer-driven business model. This means that we anticipate market needs, invest ourinternal research and development resources, build to our internal forecast and provide ready-to-ship, commercial off-the-shelf (“COTS”) products to customers, enabling us to bring products to market faster and adapt to changing customerrequirements. We believe the U.S. market is transitioning from operational tempo to a modernization cycle driven bywideband technology and that demand in the international market is being driven not only by the transition to widebandcapability, but also by the need for network system solutions. Our extensive line of radios is designed to operate andinterface well together and support a variety of tactical requirements, which we believe gives us a competitive advantagein the international market, where fully integrated solutions for command, control and communications are often required.We believe our unique commercial business model that drives speed and innovation, coupled with the scale provided byour extensive international presence, will continue to make us competitive in the global market.
Our Falcon III® family of radios is the next generation of multiband, multi-mission tactical radios supportingU.S. and international network-centric operations worldwide. Our Falcon III radios address the full range of currentmission and interoperability requirements and are fully upgradeable to address changing technical standards andmission requirements of the future. Advances in our Falcon III radios include the support of wideband networking
2
waveforms, extended frequency range and significant reductions in weight and size compared with previous generations.Our Falcon III radios are used in a wide variety of ground, vehicular and airborne applications and include the following:
‰ Our multiband manpack radio, the AN/PRC-117G (“117G”), which provides wideband networking capability,enabling enhanced situational awareness through high-bandwidth applications such as streaming video,simultaneous voice and data feeds, collaborative chat and connectivity to secure networks, and which isNational Security Agency (“NSA”) Type-1-certified for narrowband communications, as well as for widebandcommunications using our Harris-developed Adaptive Networking Wideband Waveform (“ANW2”) for highbandwidth data operation and the U.S. military Joint Tactical Radio System (“JTRS”) Soldier Radio Waveform(“SRW”);
‰ Our 2-channel vehicular radio system, the AN/VRC-118 (“118”), which uses the DoD-developed WidebandNetworking Waveform (“WNW”) over L-band, and which we began shipping in fiscal 2014 under the U.S.Army JTRS Mid-Tier Networking Vehicular Radio (“MNVR”) program;
‰ Our multiband handheld radios, the AN/PRC-152 (“152”), which is the world’s most widely fielded JTRS-approved software-defined handheld radio and offers a wide range of capabilities, and the AN/PRC-152A(“152A”), which builds on our 152 by adding wideband, networked communications capability and is the firstradio of its kind to support both a full range of narrowband legacy waveforms and wideband networkingwaveforms in a handheld platform; and
‰ Our multi-channel manpack radio, the RF-340M (“340M”), which is the first and only commercially developed,NSA Type-1-certified radio offering two channels integrated into the same chassis, and our wideband riflemanteam radio, the RF-330E (“330E”), which is the commercially developed U.S. variant of our widely fieldedinternational soldier personal radio.
In fiscal 2014, we continued to invest to position ourselves for tactical radio modernization opportunities, forexample, in developing our 340M and 330E and in incorporating the powerful Mobile User Objective System(“MUOS”) waveform into our products. Our 340M and 330E are our next-generation solutions for the U.S. ArmyJTRS Handheld, Manpack and Small Form Factor tactical radio (“HMS”) program, for which the U.S. Army hasofficially changed its procurement strategy to full and open competition and a multi-vendor award, allowing us anopportunity to compete. We received the first order for our 340M from a DoD customer in fiscal 2014, and our receiptof NSA certification was a significant milestone needed for deliveries to begin. MUOS is the DoD’s next-generationmilitary satellite communications (“SATCOM”) system that will deliver cellular-based service through tactical radios.We are embedding MUOS capability in our 340M, as well as offering it as a separate simple and fast software upgradefor widely fielded 117Gs, creating an opportunity for the DoD to transition its 117G inventory to MUOS-capableradios and quickly maximize the use of the satellite infrastructure.
Examples of significant awards for us in fiscal 2014 included the following:
‰ 5-year multi-vendor, Indefinite Delivery Indefinite Quantity (“IDIQ”) contracts from the U.S. Army for SRWvehicular appliqué systems, with a potential total value of $988 million;
‰ A 2-year, $141 million sole-source, IDIQ contract from the U.S. Army for the MNVR program, with an initialorder of $8 million for up to 232 radio systems;
‰ An $847 million increase in the ceiling value of our sole-source, IDIQ contract with the U.S. ArmyCommunications-Electronics Command (“CECOM”), which supports international sales of tactical radiosystems under the U.S. Government’s Foreign Military Sales program; and
‰ A number of significant international orders, many of which are a part of multi-year programs or largeropportunities, across a broad customer base, including a $100 million follow-on order from Australia; orders of$82 million and $49 million from two countries in Asia, $78 million from a country in Central Asia and $14million from the Philippines; orders of $49 million and $15 million from two countries in the Middle East;orders of $36 million and $21 million from two NATO countries; and a $28 million order from a country inLatin America.
Public Safety and Professional Communications Market: We supply assured communications® systems andequipment for public safety, Federal, utility, commercial and transportation organizations.
We design, build, distribute, maintain and supply wireless communications systems. Our Voice, Interoperability,Data and Access (“VIDA”) network platform is a unified Internet Protocol (“IP’) based voice and data communicationssystem that provides network-level interoperable communications among public safety agencies by supporting a full lineof communications systems, including OpenSky®, NetworkFirst, P25IP and Enhanced Digital Access CommunicationSystem (“EDACS”). Our VIDA® network solutions currently serve as the backbone in some of the largest and mostadvanced statewide and regional communications networks in North America. We also are investing in next-generation,secure public safety-grade Long Term Evolution (“LTE”) solutions for voice, video and data applications.
3
We also offer a full range of single-band land mobile radio terminals, as well as our UnityTM family of multibandradios, including a handheld radio and a full-spectrum mobile radio for vehicles. Our Unity multiband radios cover allpublic safety frequency bands in a single radio; operate on Association of Public Safety Communications Officials —International (“APCO”) P25 conventional and trunked systems; are backwards compatible with analog FM systems;and include advanced capabilities, such as an internal Global Positioning System (“GPS”) receiver for situationalawareness, internal secure Bluetooth® wireless technology and background noise suppression features. They alsoinclude true software-defined radio architecture that allows flexibility for future growth, including a software-onlyupgrade to APCO P25 Phase 2, the next-generation standard for mission-critical communications. Our Unity radios’multiband, multi-mode capabilities enable a single radio to communicate with multiple organizations, jurisdictions andagencies operating on different frequencies and systems, providing a significant improvement over many current radiosystems for U.S. public safety, which are not interoperable and thus require users to carry multiple radios or routetransmissions through ad-hoc network bridges, often configured at the time of an emergency, and resulting in instanceswhere agencies responding to a common incident cannot talk to each other.
Other examples of our Public Safety and Professional Communications solutions and services include thefollowing:
‰ We are designing and building the Alberta First Responders Radio Communications System that will providepublic safety communications within the 256,000 square-mile Province of Alberta, Canada;
‰ We are deploying a communications network for the San Francisco Municipal Transportation Authority toincrease operational efficiencies, improve safety and provide interoperability with public safety agencies;
‰ We are deploying an APCO P25 system for the U.S. Marine Corps Installations East region that also willprovide interoperability with civilian agencies; and
‰ We are designing and deploying a VIDA network system for the Trinidad and Tobago Ministry of NationalSecurity that will improve voice and data communication and provide interoperability among first respondersand the Ministry’s agencies.
Revenue, Operating Income and Backlog: Revenue for our RF Communications segment decreased 1.1 percentto $1,828 million in fiscal 2014 compared with $1,849 million in fiscal 2013, and was $2,144 million in fiscal 2012.Segment operating income decreased 2.7 percent to $561.5 million in fiscal 2014 compared with $576.9 million infiscal 2013, and was $703.7 million in fiscal 2012. The percentage of our revenue contributed by this segment was36 percent in fiscal 2014 compared with 36 percent in fiscal 2013 and 39 percent in fiscal 2012. The percentage of thissegment’s revenue that was derived outside of the U.S. was approximately 54 percent in fiscal 2014 compared withapproximately 44 percent in fiscal 2013 and 40 percent in fiscal 2012. The percentage of this segment’s revenue thatwas derived from sales to U.S. Government customers, including the DoD and intelligence and civilian agencies, aswell as foreign military sales funded through the U.S. Government, whether directly or through prime contractors wasapproximately 46 percent in fiscal 2014 compared with approximately 43 percent in fiscal 2013 and 46 percent in fiscal2012. For a general description of our U.S. Government contracts and subcontracts, including a discussion of revenuegenerated thereunder and of cost-reimbursable versus fixed-price contracts, see “Item 1. Business — PrincipalCustomers; Government Contracts” of this Report.
In general, this segment’s domestic products are sold and serviced directly to customers through its salesorganization and through established distribution channels. Internationally, this segment markets and sells its productsand services through regional sales offices and established distribution channels. For a general description of ourinternational business, see “Item 1. Business — International Business” of this Report.
The funded backlog for this segment was $1,134 million at the end of fiscal 2014 compared with $1,341 million atthe end of fiscal 2013 and $1,300 million at the end of fiscal 2012. Additional information regarding funded backlog isprovided under “Item 1. Business — Funded and Unfunded Backlog” of this Report. For a discussion of certain risksaffecting this segment, including risks relating to our U.S. Government contracts and subcontracts, see “Item 1.Business — Principal Customers; Government Contracts,” “Item 1A. Risk Factors” and “Item 3. Legal Proceedings” ofthis Report.
Integrated Network SolutionsIntegrated Network Solutions provides integrated communications and information technology (“IT”) and
services, including a variety of trusted networking capabilities, to support government, energy, maritime and healthcarecustomers. Integrated Network Solutions serves (i) IT Services, (ii) Managed Satellite and Terrestrial CommunicationsSolutions and (iii) Commercial Healthcare Solutions markets.
IT Services Market: We are a leading systems and network integrator and prime contractor providing mission-critical end-to-end IT services for defense, intelligence, homeland security and civilian government customers. Wehave positions as a prime contractor on many key U.S. Government IDIQ contract vehicles related to IT services.
4
Examples of our work in designing, integrating, deploying, operating and supporting secure communicationssystems and information networks for complex, mission-critical applications include the following:
‰ We are providing operations and maintenance support at locations around the world for the communicationsfunctions for the U.S. Air Force 50th Space Wing’s Satellite Control Network, a global, continuouslyoperational network of ground stations, operational control nodes and communications links that support launchand command and control (“C2”) of various space programs managed by the DoD and other national securityspace organizations, under the Network and Space Operations and Maintenance (“NSOM”) program, and we area leader in satellite mission C2 systems, which feature COTS design and high levels of flexibility, are designedfor government and commercial applications, and support single-satellite missions as well as some of the largestand most complex satellite fleets deployed;
‰ We are providing the Government of Canada with engineering and logistics services to support the avionicssystems on the CF-18 Hornet fighter aircraft under the CF-18 Avionics Optimized Weapon System Supportprogram;
‰ We are providing IT integration of installation, training, help desk, passport and configuration managementservices for the U.S. Department of State under the Consular Affairs Support Services Contract in support ofmore than 240 U.S. embassies and consulates around the world;
‰ We are providing comprehensive operational and system maintenance support and engineering and technologyenhancements for the Defense Information Systems Agency Crisis Management System;
‰ We are providing enterprise IT support services to the North American Air Defense Command and the U.S.Northern Command; and
‰ We are (i) providing electronic health record interoperability to enhance continuity of care between the DoD andthe Department of Veterans Affairs (“VA”), (ii) designing and installing a wireless network for VA medicalcenters and (iii) improving electronic data interoperability for claims processing, as one of eight companies inthe large business category awarded the 5-year Transformation Twenty-One Total Technology (“T4”) IDIQcontract vehicle from the VA designed to upgrade the VA’s IT system and covering services to streamline andmodernize VA operations, including patient care delivery at more than 150 VA hospitals.
Managed Satellite and Terrestrial Communications Solutions Market: Harris CapRock Communications is aglobal provider of end-to-end fully-managed hybrid communications network solutions to critical operations in remoteand harsh locations for energy, maritime and government customers. We own and operate a robust global infrastructurethat includes teleports on six continents; network operations centers running 24 hours per day, seven days per week;local presence in 23 countries; and over 275 global field service personnel supporting customer locations in more than80 countries across North America, Central and South America, Europe, Africa and Asia-Pacific. Our customersinclude major land-based and offshore energy, mining and engineering and construction companies; leading transoceanshipping and cruise line companies; and government and military customers with defense and intelligence missions.We combine satellite, terrestrial and wireless technologies to provide comprehensive communications solutions thatconnect customers’ remote sites with each other and with distant headquarters. Our solutions focus on voice, data andnetworking solutions for remote sites and are supported by a global managed satellite network.
Examples of our end-to-end fully-managed hybrid communications network solutions include the following:
‰ We are providing complete turnkey managed satellite communications services, including all shipboardequipment, onboard IT system integration and satellite bandwidth, under multi-year agreements covering 150vessels operating worldwide for one energy customer and over 100 vessels operating worldwide for anotherenergy customer;
‰ We are providing data, voice and internet service to drilling ships operating in offshore Brazil and satellitecommunications to drilling ships operating in offshore Norway;
‰ We are delivering turnkey managed satellite communications to a fleet of 53 offshore supply vessels operatingin the North Sea, Brazil, Australia and Indian Pacific regions and managed communication services on over 300commercial shipping and service vessels;
‰ We are providing dual-band satellite voice, data and internet services for a major cruise line across its fleet of103 ships and providing global communications services onboard 34 cruise ships for another major cruise line toimprove overall communications performance and enhance guest and crew experiences; and
‰ We are providing managed service networks leveraging 2 GHz of C-, Ku-, UHF- and X-band commercial spacesegment capacity for monitoring and control, teleport services, terrestrial communications, operations andmaintenance to DoD agency customers operating around the world and to classified customers, supporting arange of missions, including airborne intelligence, surveillance and reconnaissance (“ISR”), tactical field-deployed communications and continuity of operations.
5
Commercial Healthcare Solutions Market: We offer commercial and international healthcare providers a fullrange of interoperability and business intelligence solutions. Our interoperability solutions include FusionFX®, ournew vendor-neutral integrated suite of software tools that advances our previous interoperability platform byincorporating a new service-oriented architecture foundation and that integrates with leading electronic health recordand other legacy systems to securely bring together patient information from across the continuum of care and makes itavailable to clinical teams for value-based, accountable and coordinated care. We released FusionFX in fiscal 2014 andhave been increasing the numbers of live hospital deployments and system users.
Revenue, Operating Income and Backlog: Revenue for our Integrated Network Solutions segment decreased7.2 percent to $1,463 million in fiscal 2014 compared with $1,576 million in fiscal 2013, and was $1,610 million infiscal 2012. Segment operating income increased 45.9 percent to $116.4 million in fiscal 2014 compared with$79.8 million in fiscal 2013, and was $72.4 million in fiscal 2012. The percentage of our revenue contributed by thissegment was 29 percent in fiscal 2014 compared with 31 percent in fiscal 2013 and 30 percent in fiscal 2012. Thepercentages of this segment’s revenue under contracts directly with end customers and under contracts with primecontractors were approximately 77 percent and 23 percent, respectively, in fiscal 2014 compared with approximately78 percent and 22 percent, respectively, in fiscal 2013 and 80 percent and 20 percent, respectively, in fiscal 2012. Thepercentage of this segment’s revenue that was derived outside of the U.S. was approximately 33 percent in fiscal 2014compared with approximately 30 percent in fiscal 2013 and 27 percent in fiscal 2012. The percentages of thissegment’s revenue in a particular fiscal year represented by this segment’s largest U.S. Government program byrevenue in such fiscal year and five largest U.S. Government programs by revenue in such fiscal year wereapproximately 9 percent and 28 percent, respectively, in fiscal 2014 compared with approximately 9 percent and29 percent, respectively, in fiscal 2013 and 9 percent and 30 percent, respectively, in fiscal 2012. The percentage ofthis segment’s revenue that was derived from sales to U.S. Government customers, including the DoD and intelligenceand civilian agencies, as well as foreign military sales funded through the U.S. Government, whether directly orthrough prime contractors, was approximately 60 percent in fiscal 2014 compared with approximately 62 percent infiscal 2013 and 66 percent in fiscal 2012. For a general description of our U.S. Government contracts and subcontracts,including a discussion of revenue generated thereunder and of cost-reimbursable versus fixed-price contracts, see“Item 1. Business — Principal Customers; Government Contracts” of this Report.
In general, this segment’s domestic products are sold and serviced directly to customers through its salesorganization and through established distribution channels. Internationally, this segment markets and sells its productsand services through regional sales offices and established distribution channels. For a general description of ourinternational business, see “Item 1. Business — International Business” of this Report.
The funded backlog for this segment was $973 million at the end of fiscal 2014 compared with $934 million at theend of fiscal 2013 and $964 million at the end of fiscal 2012. Unfunded backlog for this segment was $921 million atthe end of fiscal 2014 compared with $1,118 million at the end of fiscal 2013 and $1,242 million at the end of fiscal2012. Additional information regarding funded and unfunded backlog is provided under “Item 1. Business — Fundedand Unfunded Backlog” of this Report. For a discussion of certain risks affecting this segment, including risks relatingto our U.S. Government contracts and subcontracts, see “Item 1. Business — Principal Customers; GovernmentContracts,” “Item 1A. Risk Factors” and “Item 3. Legal Proceedings” of this Report.
Government Communications SystemsGovernment Communications Systems conducts advanced research and develops, produces, integrates and
supports advanced communications and information systems that solve the mission-critical challenges of our civilian,intelligence and defense government customers worldwide, primarily the U.S. Government. GovernmentCommunication Systems serves (i) Civil, (ii) National Intelligence and (iii) Defense markets.
Civil Market: We provide highly reliable, mission-critical communications and information processing systemsthat meet the most demanding needs of civilian U.S. Government agencies, including the Federal AviationAdministration (“FAA”) and the National Oceanic and Atmospheric Administration (“NOAA”). We use our ability toimplement and manage large, complex programs that integrate secure, advanced communications and informationprocessing technologies in order to improve productivity and to achieve cost savings for our customers. Our networksand information systems for large-scale, geographically dispersed enterprises offer advanced capabilities for collecting,processing, analyzing, interpreting, displaying, distributing, storing and retrieving data. We are a leader in satelliteground data processing, in which our systems consisting of complex suites of hardware and software receive sensordata from satellites and turn it into useable information.
As an example of our capabilities, we are the prime contractor and system architect under a 20-year contractawarded in July 2002, with a potential value of $5 billion, for the FAA Telecommunications Infrastructure (“FTI”)
6
program to integrate, modernize, operate and maintain the communications infrastructure for the U.S. air traffic controlsystem. We designed and deployed, and are currently operating and maintaining, the FTI network, which is a fullyoperational, modern, secure and efficient network providing voice, data and video communications deployed at morethan 4,500 FAA sites across the U.S.
We recently have been awarded multiple contracts for essential elements of the FAA’s multi-billion dollar NextGeneration Air Transportation System (“NextGen”) initiative to transform the U.S. air traffic control system to meetfuture requirements, including:
‰ 7-year contracts, with an aggregate contract value of $481 million, for the Data Communications IntegratedServices (“Datacomm”) program (including the Data Communications Network Service component) totransform voice-based air traffic control to automated air traffic management;
‰ A 15-year, $291 million NextGen National Airspace System (“NAS”) Voice System (“NVS”) contract to createa modern Voice Over Internet Protocol (“VoIP”) network for communications among air traffic controllers,pilots and ground personnel; and
‰ A 5-year, $63 million NAS Enterprise Messaging Service (“NEMS”) IDIQ contract that provides the SystemsWide Information Management (“SWIM”) program with enterprise-wide data sharing for a variety of criticalinformation such as flight planning, traffic flow, surface radar and weather.
We also have developed a number of other solutions under FAA programs, including a voice switching andcontrol system providing the critical air-to-ground communications links between en-route aircraft and air trafficcontrollers throughout the continental U.S.; an integrated weather briefing and flight planning system for Alaska’sgeneral aviation community; a meteorological data processing system that generates radar mosaic data for air trafficcontroller displays and delivers weather data to critical subsystems within the NAS; and a satellite-based Alaskan NASinterfacility communications system linking the Alaskan Air Route Traffic Control Center in Anchorage with FAAfacilities throughout the region.
Another example of our capabilities relates to the NOAA Geostationary Operational Environmental Satellite— Series R (“GOES-R”) Ground and Antenna Segment weather programs. Under two 10-year contracts, with anaggregate potential value of approximately $1 billion (including change orders), we are providing a complete, end-to-end solution to design, develop, deploy and operate the ground segment system that will receive and process satellitedata and generate and distribute weather data to more than 10,000 direct users, as well as providing the command andcontrol of operational satellites. We also are supplying antennas and control systems that will provide communicationslinks for command, telemetry and sensor data, as well as the communications link to direct data users. The newantennas will operate with next-generation GOES-R satellites and will be compatible with existing GOES-N throughGOES-P satellites. In fiscal 2013, the GOES-R weather program transitioned from the design and development phaseto the integration, test and deployment phase.
We also are modernizing the ground segment of the Tracking and Data Relay Satellite System (“TDRSS”)network under a 5-year contract, potentially worth $140 million, for the Space Network Ground Segment Sustainment(“SGSS”) program for the National Aeronautics and Space Administration (“NASA”). The TDRSS network is used bysatellites and spacecraft in low-Earth orbit to relay data continuously to ground stations in White Sands, New Mexicoand in Guam. The modernization will improve situational awareness for TDRSS network operators, upgradecomputing and signal processing equipment, enhance reliability and maintainability, improve efficiency and reduceoperations and sustainment costs.
National Intelligence Market: A significant portion of this market involves classified programs. Althoughclassified programs generally are not discussed in this Report, the operating results relating to classified programs areincluded in our Consolidated Financial Statements. We believe that the business risks associated with those programsdo not differ materially from the business risks of other U.S. Government programs.
We are a major developer, supplier and integrator of communications and information processing products, systemsand networks for a diverse base of U.S. Intelligence Community programs, and we support the ongoing transformation ofthe Intelligence Community into a more collaborative enterprise. Serving primarily national intelligence and securityagency customers, including NSA, the National Reconnaissance Office (“NRO”) and the National Geospatial-IntelligenceAgency (“NGA”), we provide integrated ISR solutions that improve situational awareness, data collection accuracy andproduct analysis by correlating near real-time mission data and intelligence reference data for display and analysis bystrategic and tactical planners and decision makers. Our ISR systems help to integrate information across the analystworkflow, accelerating the movement of information that has been collected and processed.
For example, our image processing capabilities extend from algorithm development through delivery ofoperations systems, and we are providing advanced image exploitation and dissemination solutions for ISRapplications by advancing image processing, image data fusion, display technologies and digital product generation
7
techniques. Applicable technologies range from new techniques for merging and displaying imagery to automatedtechniques for image screening, cueing and remote visualization. Also, our mapping and visualization capabilitiesprovide complete, accurate and timely knowledge about the threat, the terrain, the status and the location of single ormultiple opposing and friendly forces and their support by utilizing data, pictures, voice and video drawn from vaststorage banks or from real-time input which can be transmitted around the world in fractions of a second. In addition,we have industry-leading capabilities in the architecture, design and development of highly specialized satelliteantennas, structures, phased arrays and on-board processors, which are used to enable next-generation satellite systemsto provide the U.S. military and intelligence communities with strategic and tactical advantages. We are also a leader inthe design and development of antenna and reflector technologies for commercial space telecommunicationsapplications. With more than 50 reflectors in orbit, we are the leading supplier of large reflector apertures anddeployable mesh antenna systems for government and commercial applications.
In fiscal 2014, we were awarded a number of new contracts and follow-on contracts under classified programs. Inaddition, we were awarded two 5-year, single-award IDIQ contracts, with an aggregate contract value of $773 million,by the NGA for the Foundation GEOINT Content Management (“FGCM”) program to provide imagery products fortwo of three regions - $365 million for Region A for the U.S. Pacific Command and U.S. Northern Command and $408million for Region C for the U.S. Africa Command and U.S. Southern Command (the Region C award, however, iscurrently under protest).
We also are leveraging our core capabilities to address adjacencies and create new opportunities. For example, weare supplying Aireon, LLC with 81 automatic dependent surveillance-broadcast (“ADS-B”) receiver payloads that willbe part of a satellite-based aircraft tracking system to enhance global air traffic control. The payloads will be hosted onthe Iridium NEXT satellite constellation but provide a capability separate from the main mission of the constellation,and we are adding other customers and increasing the number of payloads. In fiscal 2014, we received a $63 millionorder for a new payload program on the Iridium NEXT satellite constellation, and in the first quarter of fiscal 2015, wewere awarded a $495 million multi-vendor IDIQ contract from the U.S. Air Force for the Hosted Payload Solutions(“HoPS”) program for commercial hosting capabilities for U.S. Government payloads, which provides us a contractvehicle to pursue additional opportunities.
Defense Market: We develop, supply and integrate communications and information processing products,systems and networks for a diverse base of aerospace, terrestrial and maritime applications supporting DoD missions,and we are committed to delivering leading-edge technologies that support the ongoing transformations of militarycommunications for U.S. and international customers. Our technologies are providing advanced mobile widebandnetworking capabilities to assure timely and secure network-centric capabilities across strategic, operational andtactical boundaries in support of the DoD’s full spectrum of warfighting, intelligence and logistics missions. Our majortechnology capabilities include advanced ground control systems and SATCOM terminals for transportable ground,fixed-site and shipboard applications; flat-panel, phased-array and single-mission antennas; advanced aviationelectronics for military jets, including digital maps, processors, sensors, data buses, fiber optics and microelectronics;and high-speed data links and data networks for wireless communications. We also develop and supply state-of-the-artwireless voice and data products and solutions.
Examples of ongoing programs for us in this market include the following:
‰ The U.S. Army Modernization of Enterprise Terminals (“MET”) program, for which we are developing, under aten-year contract awarded in fiscal 2009 with a potential value of $600 million, next-generation large satelliteearth stations to provide the worldwide backbone for high-priority military communications and missile defensesystems and to support IP and Dedicated Circuit Connectivity within the Global Information Grid, providingcritical reach-back capability for the warfighter (and which has started full-rate production); and
‰ The F-35 Joint Strike Fighter (“F-35”) and F/A-18E/F Super Hornet (“F/A-18E/F”) aircraft platform programs,for which we provide high-performance, advanced avionics such as high-speed fiber optic networking andswitching, intra-flight data links, image processing, digital map software and other electronic components,including Multifunction Advanced Data Link communications subsystems primarily intended for stealthplatform air-to-air communications and which allow F-35s to communicate in a stealth fashion with othernetwork nodes without revealing their positions.
In fiscal 2014, we were awarded an 8-year, single-award IDIQ follow-on contract for $133 million for the U.S.Navy’s Commercial Broadband Satellite program, bringing total potential program value to more than $250 million;and a 5-year multi-vendor Communication Transmission Systems IDIQ contract from the U.S. Army to provideupgrades and maintenance of its terrestrial communications networks worldwide.
8
Revenue, Operating Income and Backlog: Revenue for our Government Communications Systems segmentincreased 1.0 percent to $1,801 million in fiscal 2014 compared with $1,784 million in fiscal 2013, and was$1,786 million in fiscal 2012. Segment operating income increased 9.9 percent to $276.9 million in fiscal 2014 comparedwith $252.0 million in fiscal 2013, and was $253.3 million in fiscal 2012. The percentage of our revenue contributed bythis segment was 36 percent in fiscal 2014 compared with 35 percent in fiscal 2013 and 33 percent in fiscal 2012. Thepercentages of this segment’s revenue under contracts directly with end customers and under contracts with primecontractors were approximately 74 percent and 26 percent, respectively, in fiscal 2014 compared with approximately73 percent and 27 percent, respectively, in fiscal 2013 and 69 percent and 31 percent, respectively, in fiscal 2012. In fiscal2014, this segment had a diverse portfolio of over 200 programs. Some of this segment’s more significant programs infiscal 2014 included FTI, GOES-R, F-35, MET, wireless products, SGSS, Datacomm, hosted payloads and variousclassified programs. The percentages of this segment’s revenue in a particular fiscal year represented by this segment’slargest program by revenue in such fiscal year and ten largest programs by revenue in such fiscal year were approximately14 percent and 53 percent, respectively, in fiscal 2014 compared with approximately 13 percent and 49 percent,respectively, in fiscal 2013 and 13 percent and 48 percent, respectively, in fiscal 2012. The percentage of this segment’srevenue that was derived from sales to U.S. Government customers, including the DoD and intelligence and civilianagencies, as well as foreign military sales funded through the U.S. Government, whether directly or through primecontractors, was approximately 93 percent in fiscal 2014 compared with approximately 93 percent in fiscal 2013 and 97percent in fiscal 2012. For a general description of our U.S. Government contracts and subcontracts, including adiscussion of revenue generated thereunder and of cost-reimbursable versus fixed-price contracts, see “Item 1.Business — Principal Customers; Government Contracts” of this Report.
The funded backlog for this segment was $918 million at the end of fiscal 2014 compared with $948 million at theend of fiscal 2013 and $842 million at the end of fiscal 2012. Unfunded backlog for this segment was $3,263 million atthe end of fiscal 2014 compared with $2,492 million at the end of fiscal 2013 and $2,695 million at the end of fiscal2012. Additional information regarding funded and unfunded backlog is provided under “Item 1. Business — Fundedand Unfunded Backlog” of this Report. For a discussion of certain risks affecting this segment, including risks relatingto our U.S. Government contracts and subcontracts, see “Item 1. Business — Principal Customers; GovernmentContracts,” “Item 1A. Risk Factors” and “Item 3. Legal Proceedings” of this Report.
International BusinessRevenue from products and services exported from the U.S. (including foreign military sales) or manufactured or
rendered abroad was $1,482 million (30 percent of our revenue) in fiscal 2014 compared with $1,313 million (26percent of our revenue) in fiscal 2013 and $1,330 million (24 percent of our revenue) in fiscal 2012. Essentially all ofour international sales are derived from our RF Communications and Integrated Network Solutions segments. Directexport sales are primarily denominated in U.S. Dollars, whereas sales from foreign subsidiaries are generallydenominated in the local currency of the subsidiary. Financial information regarding our domestic and internationaloperations is contained in Note 23: Business Segments in the Notes and is incorporated herein by reference.
The majority of our international marketing activities are conducted through subsidiaries which operate in Canada,Europe, the Middle East, Central and South America, Africa and Asia. We have also established internationalmarketing organizations and several regional sales offices. For further information regarding our internationalsubsidiaries, see Exhibit 21 of this Report.
We utilize indirect sales channels, including dealers, distributors and sales representatives, in the marketing andsale of some lines of products and equipment, both domestically and internationally. These independent representativesmay buy for resale or, in some cases, solicit orders from commercial or governmental customers for direct sales by us.Prices to the ultimate customer in many instances may be recommended or established by the independentrepresentative and may be above or below our list prices. Our dealers and distributors generally receive a discount fromour list prices and may mark up those prices in setting the final sales prices paid by the customer. The percentages ofour total revenue and of our international revenue represented by revenue from indirect sales channels wereapproximately 13 percent and 40 percent, respectively, in fiscal 2014 compared with approximately 10 percent and33 percent, respectively, in fiscal 2013 and 12 percent and 48 percent, respectively, in fiscal 2012.
Fiscal 2014 international revenue came from a large number of countries, and no such single country accountedfor more than 3 percent of our total revenue. Some of our exports are paid for by letters of credit, with the balancecarried either on an open account or installment note basis. Advance payments, progress payments or other similarpayments received prior to or upon shipment often cover most of the related costs incurred. Significant foreigngovernment contracts generally require us to provide performance guarantees. In order to stay competitive ininternational markets, we also sometimes enter into offset agreements or recourse or vendor financing arrangements tofacilitate sales to certain customers.
9
The particular economic, social and political conditions for business conducted outside the U.S. differ from thoseencountered by domestic businesses. Our management believes that the overall business risk for our internationalbusiness as a whole is somewhat greater than that faced by our domestic businesses as a whole. A description of thetypes of risks to which we are subject in our international business is contained in “Item 1A. Risk Factors” of thisReport. Nevertheless, in the opinion of our management, these risks are partially mitigated by the diversification of ourinternational business and the protection provided by letters of credit and advance payments.
CompetitionWe operate in highly competitive markets that are sensitive to technological advances. Many of our competitors in
each of our markets are larger than we are and can maintain higher levels of expenditures for research anddevelopment. In each of our markets, we concentrate on the opportunities that our management believes are compatiblewith our resources, overall technological capabilities and objectives. Principal competitive factors in these markets areproduct quality and reliability; technological capabilities; service; past performance; ability to develop and implementcomplex, integrated solutions; ability to meet delivery schedules; the effectiveness of third-party sales channels ininternational markets; and cost-effectiveness.
In the RF Communications segment, principal competitors include Airbus DS Communications (formerlyCassidian Communications, an Airbus Group company), Aselsan A.S., Bharat Electronics Limited, Elbit Systems Ltd.,Exelis Inc., General Dynamics Corporation, JVC Kenwood Corporation, Motorola Solutions, Inc., Rockwell Collins,Inc., the Rohde & Schwarz Group, Selex ES (a Finmeccanica Group company), Tait Ltd. and Thales Group.
In the Integrated Network Solutions segment, principal competitors include Astrium Services Government, Inc.(an Airbus Group company), Computer Sciences Corporation, Engility Holdings, Inc., Exelis Inc., General DynamicsCorporation, Leidos Holdings, Inc., Lockheed Martin Corporation, MTN, Northrop Grumman Corporation, RaytheonCompany and RigNet, Inc.
In the Government Communications Systems segment, principal competitors include BAE Systems plc, TheBoeing Company, Exelis Inc., General Dynamics Corporation, L-3 Communications Holdings, Inc., Lockheed MartinCorporation, Northrop Grumman Corporation, Raytheon Company, and Rockwell Collins, Inc. We frequently“partner” or are involved in subcontracting and teaming relationships with companies that are, from time to time,competitors on other programs.
Principal Customers; Government ContractsThe percentage of our revenue that was derived from sales to U.S. Government customers, including the DoD and
intelligence and civilian agencies, as well as foreign military sales funded through the U.S. Government, whetherdirectly or through prime contractors, was approximately 67 percent in fiscal 2014 compared with approximately67 percent in fiscal 2013 and 70 percent in fiscal 2012. No other customer accounted for more than 4 percent of ourrevenue in fiscal 2014. Additional information regarding customers for each of our segments is provided under “Item 1.Business — Description of Business by Segment” of this Report. Our U.S. Government sales are predominantlyderived from contracts with agencies of, and prime contractors to, the U.S. Government. Most of the sales in ourGovernment Communications Systems segment and with respect to U.S. Government programs in our IntegratedNetwork Solutions segment are made directly or indirectly to the U.S. Government under contracts or subcontractscontaining standard government contract clauses providing for redetermination of profits, if applicable, and fortermination for the convenience of the U.S. Government or for default based on performance.
Our U.S. Government contracts and subcontracts include both cost-reimbursable and fixed-price contracts.Government-wide Acquisition Contracts (“GWACs”) and multi-vendor IDIQ contracts, which can include task ordersfor each contract type, require us to compete both for the initial contract and then for individual task or delivery ordersunder such contracts.
Our U.S. Government cost-reimbursable contracts provide for the reimbursement of allowable costs plus paymentof a fee and fall into three basic types: (i) cost-plus fixed-fee contracts, which provide for payment of a fixed feeirrespective of the final cost of performance; (ii) cost-plus incentive-fee contracts, which provide for payment of a feethat may increase or decrease, within specified limits, based on actual results compared with contractual targets relatingto factors such as cost, performance and delivery schedule; and (iii) cost-plus award-fee contracts, which provide forpayment of an award fee determined at the customer’s discretion based on our performance against pre-establishedperformance criteria. Under our U.S. Government cost-reimbursable contracts, we are reimbursed periodically forallowable costs and are paid a portion of the fee based on contract progress. Some overhead costs have been madepartially or wholly unallowable for reimbursement by statute or regulation. Examples are certain merger andacquisition costs, lobbying costs, charitable contributions and certain litigation defense costs.
10
Our U.S. Government fixed-price contracts are either firm fixed-price contracts or fixed-price incentive contracts.Under our U.S. Government firm fixed-price contracts, we agree to perform a specific scope of work for a fixed priceand, as a result, benefit from cost savings and carry the burden of cost overruns. Under our U.S. Government fixed-price incentive contracts, we share with the U.S. Government both savings accrued for performance at less than targetcost as well as costs incurred in excess of target cost up to a negotiated ceiling price (which is higher than the targetcost), but carry the entire burden of costs exceeding the negotiated ceiling price. Accordingly, under such incentivecontracts, profit may also be adjusted up or down depending on whether specified performance objectives are met.Under our U.S. Government firm fixed-price and fixed-price incentive contracts, we usually receive either milestonepayments equaling 100 percent of the contract price or monthly progress payments from the U.S. Government inamounts equaling 80 percent of costs incurred under the contract. The remaining amounts, including profits orincentive fees, are billed upon delivery and final acceptance of end items and deliverables under the contract. Ourproduction contracts are mainly fixed-price contracts, and development contracts are generally cost-reimbursablecontracts.
As stated above, U.S. Government contracts are terminable for the convenience of the U.S. Government, as wellas for default based on performance. Companies supplying goods and services to the U.S. Government are dependenton Congressional appropriations and administrative allotment of funds and may be affected by changes inU.S. Government policies resulting from various military, political, economic and international developments. Long-term U.S. Government contracts and related orders are subject to cancellation if appropriations for subsequentperformance periods become unavailable. Under contracts terminable for the convenience of the U.S. Government, acontractor is entitled to receive payments for its allowable costs and, in general, the proportionate share of fees orearnings for the work done. Contracts that are terminable for default generally provide that the U.S. Government paysonly for the work it has accepted and may require the contractor to pay for the incremental cost of re-procurement andmay hold the contractor liable for damages. In many cases, there is also uncertainty relating to the complexity ofdesigns, necessity for design improvements and difficulty in forecasting costs and schedules when bidding ondevelopmental and highly sophisticated technical work. Under many U.S. Government contracts, we are required tomaintain facility and personnel security clearances complying with DoD and other Federal agency requirements. Forfurther discussion of risks relating to U.S. Government contracts, see “Item 1A. Risk Factors” and “Item 3. LegalProceedings” of this Report.
Funded and Unfunded BacklogOur total Company-wide funded and unfunded backlog was approximately $7,202 million at the end of fiscal
2014 compared with approximately $6,789 million at the end of fiscal 2013 and $6,993 million at the end of fiscal2012. The funded portion of this backlog was approximately $3,018 million at the end of fiscal 2014 compared withapproximately $3,179 million at the end of fiscal 2013 and $3,056 million at the end of fiscal 2012. The determinationof backlog involves substantial estimating, particularly with respect to customer requirements contracts anddevelopment and production contracts of a cost-reimbursable or incentive nature.
We define funded backlog as unfilled firm orders for products and services for which funding has been authorizedand, in the case of U.S. Government agencies, appropriated. We define unfunded backlog as primarily unfilled firmcontract value for which funding has not yet been authorized or, in the case of U.S. Government agencies,appropriated, including the value of contract options in cases of material contracts that have options we believe areprobable of being exercised, as well as the most probable value of material sole-source IDIQ contracts awarded for aspecific limited purpose. In fiscal 2015, we expect to fill approximately 59 percent of our total funded backlog as ofJune 27, 2014. However, we can give no assurance of such fulfillment or that our funded backlog will become revenuein any particular period, if at all. Backlog is subject to delivery delays and program cancellations, which are beyond ourcontrol. Additional information with regard to the backlog of each of our segments is provided under “Item 1.Business — Description of Business by Segment” of this Report.
Research and DevelopmentResearch and development expenditures totaled approximately $865 million in fiscal 2014, $900 million in fiscal
2013 and $838 million in fiscal 2012. Company-sponsored research and development costs, which included researchand development for commercial products and services and independent research and development related togovernment products and services, as well as concept formulation studies and technology development that occurs onbid and proposal efforts, were approximately $264 million in fiscal 2014, $254 million in fiscal 2013 (including anapproximately $18 million write-off of capitalized software in our Integrated Network Solutions segment) and$219 million in fiscal 2012. A portion of our independent research and development costs are allocated amongcontracts and programs in process under U.S. Government contractual arrangements. Company-sponsored research anddevelopment costs not otherwise allocable are charged to expense when incurred. The portion of total research and
11
development expenditures that was not Company-sponsored — principally funded by the U.S. Government andincluded in our revenue and cost of product sales and services — was $601 million in fiscal 2014, $646 million infiscal 2013 and $619 million in fiscal 2012. Company-sponsored research is directed to the development of newproducts and services and to building technological capability in selected communications and electronic systemsmarkets. U.S. Government-funded research helps strengthen and broaden our technical capabilities. As of June 27,2014, we employed approximately 6,000 engineers and scientists and are continuing efforts to make the technologiesdeveloped in any of our business segments available for all other business segments.
Patents and Other Intellectual PropertyWe consider our patents and other intellectual property, in the aggregate, to constitute an important asset. We own
a large and valuable portfolio of patents, trade secrets, know-how, confidential information, trademarks, copyrights andother intellectual property, and we routinely apply for new patents, trademarks and copyrights. We also licenseintellectual property to and from third parties. As of June 27, 2014, we held approximately 1,100 U.S. patents and1,070 foreign patents, and had approximately 340 U.S. patent applications pending (and 640 foreign patent applicationspending). Unpatented research, development and engineering skills also make an important contribution to ourbusiness. Although our intellectual property rights in the aggregate are important to our business and the operations ofour business segments, we do not consider our business or any business segment to be materially dependent on anysingle patent, license or other intellectual property right, or any group of related patents, licenses or other intellectualproperty rights. We are engaged in a proactive patent licensing program and have entered into a number of licenses andcross-license agreements, some of which generate royalty income. Although existing license agreements havegenerated income in past years and may do so in the future, there can be no assurances we will enter into additionalincome-producing license agreements. From time to time we engage in litigation to protect our patents and otherintellectual property. Any of our patents, trade secrets, trademarks, copyrights and other proprietary rights could bechallenged, invalidated or circumvented, or may not provide competitive advantages. For further discussion of risksrelating to intellectual property, see “Item 1A. Risk Factors” of this Report. With regard to certain patents relating toour Government Communications Systems and RF Communications segments, the U.S. Government has anirrevocable, non-exclusive, royalty-free license, pursuant to which the U.S. Government may use or authorize others touse the inventions covered by such patents. Pursuant to similar arrangements, the U.S. Government may consent to ouruse of inventions covered by patents owned by other persons. Numerous trademarks used on or in connection with ourproducts are also considered to be a valuable asset.
Environmental and Other RegulationsOur facilities and operations are subject to numerous domestic and international laws and regulations designed to
protect the environment, particularly with regard to wastes and emissions. The applicable environmental laws andregulations are common within the industries and markets in which we operate and serve. We believe that we havecomplied with these requirements and that such compliance has not had a material adverse effect on our financialcondition, results of operations or cash flows. Based on currently available information, we do not expect expendituresover the next several years to protect the environment and to comply with current environmental laws and regulations, aswell as to comply with current and pending climate control legislation, regulation, treaties and accords, to have a materialimpact on our competitive position or financial condition, but we can give no assurance that such expenditures will notexceed current expectations. If future treaties, laws and regulations contain more stringent requirements than presentlyanticipated, actual expenditures may be higher than our present estimates of those expenditures. We have installed wastetreatment facilities and pollution control equipment to satisfy legal requirements and to achieve our waste minimizationand prevention goals. We did not spend material amounts on environmental capital projects in fiscal 2014, fiscal 2013 orfiscal 2012. A portion of our environmental expenditures relates to historic discontinued operations (other than CIS andBroadcast Communications) for which we have retained certain environmental liabilities. We currently expect thatamounts to be spent for environmental-related capital projects will not be material in fiscal 2015. These amounts mayincrease in future years. Additional information regarding environmental and regulatory matters is set forth in “Item 3.Legal Proceedings” of this Report and in Note 1: Significant Accounting Policies in the Notes.
Electronic products are subject to governmental environmental regulation in a number of jurisdictions, such asdomestic and international requirements requiring end-of-life management and/or restricting materials in productsdelivered to customers, including the European Union’s Directive 2002/96/EC on Waste Electrical and ElectronicEquipment and Directive 2002/95/EC on the Restriction of the use of certain Hazardous Substances in Electrical andElectronic Equipment (“RoHS”), as amended. Other jurisdictions have adopted similar legislation. Such requirementstypically are not applicable to most equipment produced by our Government Communications Systems and RFCommunications segments. We believe that we have complied with such rules and regulations, where applicable, withrespect to our existing products sold into such jurisdictions. We intend to comply with such rules and regulations withrespect to our future products.
12
Wireless communications (whether radio, satellite or telecommunications) are also subject to governmentalregulation. Equipment produced in our RF Communications and Integrated Network Solutions segments, in particular,is subject to domestic and international requirements to avoid interference among users of radio and televisionfrequencies and to permit interconnection of telecommunications equipment. Additionally, we hold licenses for ourmanaged satellite and terrestrial communications solutions market for very small aperture terminals and satellite earthstations, which authorize operation of networks and teleports. We are also required to comply with technical operatingand licensing requirements that pertain to our wireless licenses and operations. We believe that we have complied withsuch rules and regulations and licenses with respect to our existing products and services, and we intend to complywith such rules and regulations and licenses with respect to our future products and services. Governmentalreallocation of the frequency spectrum also could impact our business, financial condition and results of operations.
Raw Materials and SuppliesBecause of the diversity of our products and services, as well as the wide geographic dispersion of our facilities,
we use numerous sources for the wide array of raw materials (such as electronic components, printed circuit boards,metals and plastics) needed for our operations and for our products. We are dependent on suppliers and subcontractorsfor a large number of components and subsystems and the ability of our suppliers and subcontractors to adhere tocustomer or regulatory materials restrictions and to meet performance and quality specifications and deliveryschedules. In some instances, we are dependent on one or a few sources, either because of the specialized nature of aparticular item or because of local content preference requirements pursuant to which we operate on a given project.Although we have been affected by financial and performance issues of some of our suppliers and subcontractors, wehave not been materially adversely affected by the inability to obtain raw materials or products. On occasion, we haveexperienced component shortages from vendors as a result of natural disasters, or the RoHS environmental regulationsin the European Union or similar regulations in other jurisdictions. These events or regulations may cause a spike indemand for certain electronic components (such as lead-free components), resulting in industry-wide supply chainshortages. To date, these component shortages have not had a material adverse effect on our business. For furtherdiscussion of risks relating to subcontractors and suppliers, see “Item 1A. Risk Factors” of this Report.
SeasonalityWe do not consider any material portion of our business to be seasonal. Various factors can affect the distribution
of our revenue between accounting periods, including the timing of contract awards and the timing and availability ofU.S. Government funding, as well as the timing of product deliveries and customer acceptance.
EmployeesWe had approximately 14,000 employees at the end of fiscal 2014. Approximately 91 percent of our employees as
of the end of fiscal 2014 were located in the U.S. A significant number of our employees possess a U.S. Governmentsecurity clearance. We also utilize a number of independent contractors. None of our employees in the U.S. isrepresented by a labor union. In certain international subsidiaries, our employees are represented by workers’ councilsor statutory labor unions. In general, we believe that our relations with our employees are good.
Website Access to Harris Reports; Available InformationGeneral. We maintain an Internet website at http://harris.com. Our annual reports on Form 10-K, quarterly
reports on Form 10-Q, current reports on Form 8-K and amendments to such reports, filed or furnished pursuant toSection 13(a) or 15(d) of the Exchange Act, are available free of charge on our website as soon as reasonablypracticable after these reports are electronically filed with or furnished to the Securities and Exchange Commission (the“SEC”). We also will provide the reports in electronic or paper form free of charge upon request. We also makeavailable free of charge on our website our annual report to shareholders and proxy statement. Our website and theinformation posted thereon are not incorporated into this Report or any current or other periodic report that we file withor furnish to the SEC. All reports we file with or furnish to the SEC also are available free of charge via the SEC’selectronic data gathering and retrieval, or EDGAR, system available through the SEC’s website at http://www.sec.gov.
Additional information relating to our business, including our business segments, is set forth in “Item 7.Management’s Discussion and Analysis of Financial Condition and Results of Operations” of this Report.
Corporate Governance Guidelines and Committee Charters. We previously adopted Corporate GovernanceGuidelines, which are available on the Corporate Governance section of our website athttp://harris.com/corporate_governance/. In addition, the charters of each of the standing committees of our Board,namely, the Audit Committee, Business Conduct and Corporate Responsibility Committee, Corporate GovernanceCommittee, Finance Committee and Management Development and Compensation Committee, are also available onthe Corporate Governance section of our website. A copy of the charters is also available free of charge upon writtenrequest to our Secretary at Harris Corporation, 1025 West NASA Boulevard, Melbourne, Florida 32919.
13
Certifications. We have filed with the SEC the certifications required by Section 302 of the Sarbanes-Oxley Actof 2002 as exhibits to this Report. In addition, an annual CEO certification was submitted by our Chief ExecutiveOfficer to the New York Stock Exchange (“NYSE”) in October 2013 in accordance with the NYSE’s listing standards,which included a certification that he was not aware of any violation by Harris of the NYSE’s corporate governancelisting standards.
ITEM 1A. RISK FACTORS.
We have described many of the trends and other factors that we believe could impact our business and futureresults in “Item 7. Management’s Discussion and Analysis of Financial Condition and Results of Operations” of thisReport. In addition, our business, financial condition, results of operations and cash flows are subject to, and could bematerially adversely affected by, various risks and uncertainties, including, without limitation, those set forth below,any one of which could cause our actual results to vary materially from recent results or our anticipated future results.
We depend on U.S. Government customers for a significant portion of our revenue, and the loss of theserelationships, a reduction in U.S. Government funding or a change in U.S. Government spending priorities couldhave an adverse impact on our business, financial condition, results of operations and cash flows.
We are highly dependent on sales to U.S. Government customers. The percentage of our revenue that was derivedfrom sales to U.S. Government customers, including the DoD and intelligence and civilian agencies, as well as foreignmilitary sales funded through the U.S. Government, whether directly or through prime contractors, was approximately67 percent in fiscal 2014, 67 percent in fiscal 2013 and 70 percent in fiscal 2012. Therefore, any significant disruptionor deterioration of our relationship with the U.S. Government would significantly reduce our revenue. Our competitorscontinuously engage in efforts to expand their business relationships with the U.S. Government and will continue theseefforts in the future, and the U.S. Government may choose to use other contractors. We expect that a majority of thebusiness that we seek will be awarded through competitive bidding. The U.S. Government has increasingly relied oncertain types of contracts that are subject to multiple competitive bidding processes, including multi-vendor IDIQ,GWAC, General Services Administration Schedule and other multi-award contracts, which has resulted in greatercompetition and increased pricing pressure. We operate in highly competitive markets and our competitors may havemore extensive or more specialized engineering, manufacturing and marketing capabilities than we do in some areas,and we may not be able to continue to win competitively awarded contracts or to obtain task orders under multi-awardcontracts. Further, the competitive bidding process involves significant cost and managerial time to prepare bids andproposals for contracts that may not be awarded to us, as well as the risk that we may fail to accurately estimate theresources and costs required to fulfill any contract awarded to us. Following any contract award, we may experiencesignificant expense or delay, contract modification or contract rescission as a result of our competitors protesting orchallenging contracts awarded to us in competitive bidding. Our U.S. Government programs must compete withprograms managed by other government contractors and with other policy imperatives for consideration for limitedresources and for uncertain levels of funding during the budget and appropriation process. Budget and appropriationsdecisions made by the U.S. Government are outside of our control and have long-term consequences for our business.U.S. Government spending priorities and levels remain uncertain and difficult to predict and are affected by numerousfactors, including sequestration (automatic, across-the-board U.S. Government budgetary spending cuts) and whether itwill be superseded by alternate arrangements. A change in U.S. Government spending priorities or an increase in non-procurement spending at the expense of our programs, or a reduction in total U.S. Government spending, could havematerial adverse consequences on our future business. For more information regarding sequestration, see “Item 7.Management’s Discussion and Analysis of Financial Condition and Results of Operations — BusinessConsiderations — Industry-Wide Opportunities, Challenges and Risks” of this Report.
We depend significantly on U.S. Government contracts, which often are only partially funded, subject to immediatetermination, and heavily regulated and audited. The termination or failure to fund, or negative audit findings for,one or more of these contracts could have an adverse impact on our business, financial condition, results ofoperations and cash flows.
Over its lifetime, a U.S. Government program may be implemented by the award of many different individualcontracts and subcontracts. The funding of U.S. Government programs is subject to Congressional appropriations.Although multi-year contracts may be authorized and appropriated in connection with major procurements, Congressgenerally appropriates funds on a fiscal year basis. Procurement funds are typically made available for obligation over thecourse of one to three years. Consequently, programs often receive only partial funding initially, and additional funds areobligated only as Congress authorizes further appropriations. The termination of funding for a U.S. Government programwould result in a loss of anticipated future revenue attributable to that program, which could have an adverse impact onour operations. In addition, the termination of a program or the failure to commit additional funds to a program thatalready has been started could result in lost revenue and increase our overall costs of doing business.
14
Generally, U.S. Government contracts are subject to oversight audits by U.S. Government representatives. Suchaudits could result in adjustments to our contract costs. Any costs found to be improperly allocated to a specific contractwill not be reimbursed, and such costs already reimbursed must be refunded. We have recorded contract revenues basedon costs we expect to realize upon final audit. However, we do not know the outcome of any future audits andadjustments, and we may be required to materially reduce our revenues or profits upon completion and final negotiation ofaudits. Negative audit findings could also result in termination of a contract, forfeiture of profits, suspension of payments,fines and suspension or debarment from U.S. Government contracting or subcontracting for a period of time.
In addition, U.S. Government contracts generally contain provisions permitting termination, in whole or in part,without prior notice at the U.S. Government’s convenience upon the payment only for work done and commitmentsmade at the time of termination. We can give no assurance that one or more of our U.S. Government contracts will notbe terminated under these circumstances. Also, we can give no assurance that we would be able to procure newcontracts to offset the revenue or backlog lost as a result of any termination of our U.S. Government contracts. Becausea significant portion of our revenue is dependent on our performance and payment under our U.S. Governmentcontracts, the loss of one or more large contracts could have a material adverse impact on our business, financialcondition, results of operations and cash flows.
Our government business also is subject to specific procurement regulations and a variety of socio-economic andother requirements. These requirements, although customary in U.S. Government contracts, increase our performanceand compliance costs. These costs might increase in the future, thereby reducing our margins, which could have anadverse effect on our business, financial condition, results of operations and cash flows. Failure to comply with theseregulations and requirements could lead to fines, penalties, repayments, or compensatory or treble damages, orsuspension or debarment from U.S. Government contracting or subcontracting for a period of time. Among the causesfor debarment are violations of various laws, including those related to procurement integrity, export control,U.S. Government security regulations, employment practices, protection of the environment, accuracy of records,proper recording of costs and foreign corruption. The termination of a U.S. Government contract or relationship as aresult of any of these acts would have an adverse impact on our operations and could have an adverse effect on ourstanding and eligibility for future U.S. Government contracts.
We could be negatively impacted by a security breach, through cyber attack, cyber intrusion or otherwise, or othersignificant disruption of our IT networks and related systems or of those we operate for certain of our customers.
We face the risk, as does any company, of a security breach, whether through cyber attack or cyber intrusion overthe Internet, malware, computer viruses, attachments to e-mails, persons inside our organization or persons with accessto systems inside our organization, or other significant disruption of our IT networks and related systems. We face anadded risk of a security breach or other significant disruption of the IT networks and related systems that we develop,install, operate and maintain for certain of our customers, which may involve managing and protecting informationrelating to national security and other sensitive government functions or personally identifiable or protected healthinformation. The risk of a security breach or disruption, particularly through cyber attack or cyber intrusion, includingby computer hackers, foreign governments and cyber terrorists, has increased as the number, intensity andsophistication of attempted attacks and intrusions from around the world have increased. As a communications and ITcompany, and particularly as a government contractor, we face a heightened risk of a security breach or disruptionfrom threats to gain unauthorized access to our and our customers’ proprietary or classified information on our ITnetworks and related systems and to the IT networks and related systems that we operate and maintain for certain ofour customers. These types of information and IT networks and related systems are critical to the operation of ourbusiness and essential to our ability to perform day-to-day operations, and, in some cases, are critical to the operationsof certain of our customers. Although we make significant efforts to maintain the security and integrity of these typesof information and IT networks and related systems, and we have implemented various measures to manage the risk ofa security breach or disruption, there can be no assurance that our security efforts and measures will be effective or thatattempted security breaches or disruptions would not be successful or damaging. Even the most well protectedinformation, networks, systems and facilities remain potentially vulnerable because attempted security breaches,particularly cyber attacks and intrusions, or disruptions will occur in the future, and because the techniques used insuch attempts are constantly evolving and generally are not recognized until launched against a target, and in somecases are designed not be detected and, in fact, may not be detected. In some cases, the resources of foreigngovernments may be behind such attacks. Accordingly, we may be unable to anticipate these techniques or toimplement adequate security barriers or other preventative measures, and thus it is virtually impossible for us toentirely mitigate this risk. A security breach or other significant disruption involving these types of information and ITnetworks and related systems could:
‰ Disrupt the proper functioning of these networks and systems and therefore our operations and/or those ofcertain of our customers;
15
‰ Result in the unauthorized access to, and destruction, loss, theft, misappropriation or release of, proprietary,confidential, sensitive or otherwise valuable information of ours or our customers, including trade secrets, whichothers could use to compete against us or for disruptive, destructive or otherwise harmful purposes andoutcomes;
‰ Compromise national security and other sensitive government functions;‰ Require significant management attention and resources to remedy the damages that result;‰ Subject us to claims for contract breach, damages, credits, penalties or termination; and‰ Damage our reputation with our customers (particularly agencies of the U.S. Government) and the public
generally.
Any or all of the foregoing could have a negative impact on our business, financial conditions, results ofoperations and cash flows.
We enter into fixed-price contracts that could subject us to losses in the event of cost overruns or a significantincrease in inflation.
We have a number of fixed-price contracts, which allow us to benefit from cost savings, but subject us to the risk ofpotential cost overruns, particularly for firm fixed-price contracts because we assume all of the cost burden. If our initialestimates are incorrect, we can lose money on these contracts. U.S. Government contracts can expose us to potentiallylarge losses because the U.S. Government can hold us responsible for completing a project or, in certain circumstances,paying the entire cost of its replacement by another provider regardless of the size or foreseeability of any cost overrunsthat occur over the life of the contract. Because many of these contracts involve new technologies and applications andcan last for years, unforeseen events, such as technological difficulties, fluctuations in the price of raw materials, problemswith our suppliers and cost overruns, can result in the contractual price becoming less favorable or even unprofitable to usover time. The U.S. and other countries also may experience a significant increase in inflation. A significant increase ininflation rates could have a significant adverse impact on the profitability of these contracts. Furthermore, if we do notmeet contract deadlines or specifications, we may need to renegotiate contracts on less favorable terms, be forced to paypenalties or liquidated damages or suffer major losses if the customer exercises its right to terminate. In addition, some ofour contracts have provisions relating to cost controls and audit rights, and if we fail to meet the terms specified in thosecontracts we may not realize their full benefits. Our results of operations are dependent on our ability to maximize ourearnings from our contracts. Cost overruns could have an adverse impact on our financial results. The potential impact ofsuch risk on our financial results would increase if the mix of our contracts and programs shifted toward a greaterpercentage of fixed-price contracts, particularly firm fixed-price contracts.
We derive a significant portion of our revenue from international operations and are subject to the risks of doingbusiness internationally, including fluctuations in currency exchange rates.
We are dependent on sales to customers outside the U.S. The percentage of our total revenue represented byrevenue from products and services exported from the U.S. (including foreign military sales) or manufactured orrendered abroad was 30 percent in fiscal 2014, 26 percent in fiscal 2013 and 24 percent in fiscal 2012. Approximately28 percent of our international business in fiscal 2014 was transacted in local currency. Losses resulting from currencyrate fluctuations can adversely affect our results. We expect that international revenue will continue to account for asignificant portion of our total revenue. Also, a significant portion of our international revenue is from, and anincreasing portion of our business activity is being conducted in, less-developed countries. We are subject to risks ofdoing business internationally, including:
‰ Currency exchange controls, fluctuations of currency and currency revaluations;‰ The laws, regulations and policies of foreign governments relating to investments and operations, as well as
U.S. laws affecting the activities of U.S. companies abroad, including the Foreign Corrupt Practices Act (“FCPA”);‰ Changes in regulatory requirements, including business or operating license requirements, imposition of tariffs
or embargoes, export controls and other trade restrictions;‰ Uncertainties and restrictions concerning the availability of funding, credit or guarantees;‰ The complexity and necessity of using, and disruptions involving our, international dealers, distributors, sales
representatives and consultants;‰ The difficulties of managing a geographically dispersed organization and culturally diverse workforces,
including compliance with local laws and practices;‰ Difficulties associated with repatriating cash generated or held abroad in a tax-efficient manner and changes in
tax laws;‰ Import and export licensing requirements and regulations, as well as unforeseen changes in export regulations;‰ Uncertainties as to local laws and enforcement of contract and intellectual property rights and occasional
requirements for onerous contract clauses; and
16
‰ Rapid changes in government, economic and political policies, political or civil unrest, acts of terrorism or thethreat of international boycotts or U.S. anti-boycott legislation.
Our reputation and ability to do business may be impacted by the improper conduct of our employees, agents orbusiness partners.
We have implemented compliance controls, policies and procedures designed to prevent reckless or criminal actsfrom being committed by our employees, agents or business partners that would violate the laws of the jurisdictions inwhich we operate, including laws governing payments to government officials (such as the FCPA), and to detect anysuch reckless or criminal acts committed. We cannot ensure, however, that our controls, policies and procedures willprevent or detect all such reckless or criminal acts. If not prevented, such reckless or criminal acts could subject us tocivil or criminal investigations and monetary and non-monetary penalties and could have a material adverse effect onour ability to conduct business, our results of operations and our reputation.
We may not be successful in obtaining the necessary export licenses to conduct certain operations abroad, andCongress may prevent proposed sales to certain foreign governments.
We must first obtain export and other licenses and authorizations from various U.S. Government agencies beforewe are permitted to sell certain products and technologies outside of the U.S. For example, the U.S. Department ofState must notify Congress at least 15 to 60 days, depending on the size and location of the proposed sale, prior toauthorizing certain sales of defense equipment and services to foreign governments. During that time, Congress maytake action to block the proposed sale. We can give no assurance that we will continue to be successful in obtaining thenecessary licenses or authorizations or that Congress will not prevent or delay certain sales. Any significantimpairment of our ability to sell products or technologies outside of the U.S. could negatively impact our business,financial condition, results of operations and cash flows.
The continued effects of the general weakness in the global economy and the U.S. Government’s budget deficits andnational debt and sequestration could have an adverse impact on our business, financial condition, results ofoperations and cash flows.
The economies of the U.S. and many foreign countries in which we do business continue to show weakness orlimited improvement. We are unable to predict the impact, severity and duration of these economic events. Thecontinued effects of these economic events and the U.S. Government’s budget deficits and national debt andsequestration could have an adverse impact on our business, financial condition, results of operations and cash flows ina number of ways. Possible effects of these economic conditions include the following:
‰ The U.S. Government could reduce or delay its spending on, or reprioritize its spending away from, thegovernment programs in which we participate;
‰ The U.S. Government may be unable to complete its budget process before the end of its fiscal year onSeptember 30 and thus would be required either to shut down or be funded pursuant to a “continuing resolution”that authorizes agencies of the U.S. Government to continue operations but does not authorize new spendinginitiatives, either of which could result in reduced or delayed orders or payments for products and services weprovide. If the U.S. Government budget process results in a shutdown or prolonged operation under a continuingresolution, it may decrease our revenue, profitability or cash flows or otherwise have a material adverse effecton our business, financial condition and results of operations;
‰ U.S. Government spending could be impacted by sequestration or alternate arrangements, which increases theuncertainty as to, and the difficulty in predicting, U.S. Government spending priorities and levels;
‰ We may experience declines in revenue, profitability and cash flows as a result of reduced or delayed orders orpayments or other factors caused by the economic problems of our customers and prospective customers(including U.S. Federal, state and local governments);
‰ We may experience supply chain delays, disruptions or other problems associated with financial constraintsfaced by our suppliers and subcontractors; and
‰ We may incur increased costs or experience difficulty with future borrowings under our commercial paperprogram or credit facilities or in the debt markets, or otherwise with financing our operating, investing(including any future acquisitions) or financing activities.
Our future success will depend on our ability to develop new products, systems, services and technologies thatachieve market acceptance in our current and future markets.
Both our commercial and government businesses are characterized by rapidly changing technologies and evolvingindustry standards. Accordingly, our performance depends on a number of factors, including our ability to:
‰ Identify emerging technological trends in our current and target markets;
17
‰ Develop and maintain competitive products, systems, services and technologies;‰ Enhance our offerings by adding innovative hardware, software or other features that differentiate our products,
systems, services and technologies from those of our competitors; and‰ Develop, manufacture and bring to market cost-effective offerings quickly.
We believe that, in order to remain competitive in the future, we will need to continue to develop new products,systems, services and technologies, requiring the investment of significant financial resources. The need to make theseexpenditures could divert our attention and resources from other projects, and we cannot be sure that theseexpenditures ultimately will lead to the timely development of new products, systems, services or technologies. Due tothe design complexity of some of our products, systems, services and technologies, we may experience delays incompleting development and introducing new products, systems, services or technologies in the future. Any delayscould result in increased costs of development or redirect resources from other projects. In addition, we cannot provideassurances that the markets for our products, systems, services or technologies will develop as we currently anticipate.The failure of our products, systems, services or technologies to gain market acceptance could significantly reduce ourrevenue and harm our business. Furthermore, we cannot be sure that our competitors will not develop competingproducts, systems, services or technologies that gain market acceptance in advance of our products, systems, servicesor technologies, or that our competitors will not develop new products, systems, services or technologies that cause ourexisting products, systems, services or technologies to become non-competitive or obsolete, which could adverselyaffect our results of operations. The future direction of the domestic and global economies, including its impact oncustomer demand, also will have a significant impact on our overall performance.
We participate in markets that are often subject to uncertain economic conditions, which makes it difficult toestimate growth in our markets and, as a result, future income and expenditures.
We participate in U.S. and international markets that are subject to uncertain economic conditions. In particular,U.S. Government spending priorities and levels remain uncertain and difficult to predict and are affected by numerousfactors, including sequestration and whether it will be superseded by alternate arrangements. As a result, it is difficultto estimate the level of growth in the markets in which we participate. Because all components of our budgeting andforecasting are dependent on estimates of growth in the markets we serve, the uncertainty renders estimates of orguidance relating to future revenue, income and expenditures even more difficult. As a result, we may make significantinvestments and expenditures but never realize the anticipated benefits.
We cannot predict the consequences of future geo-political events, but they may adversely affect the markets inwhich we operate, our ability to insure against risks, our operations or our profitability.
Ongoing instability and current conflicts in global markets, including in the Middle East and Asia, and thepotential for other conflicts and future terrorist activities and other recent geo-political events throughout the worldhave created economic and political uncertainties that could have a material adverse effect on our business, operationsand profitability. These matters cause uncertainty in the world’s financial and insurance markets and may significantlyincrease the political, economic and social instability in the geographic areas in which we operate. These matters alsomay cause our insurance coverages and performance bonds to increase in cost, or in some cases, to be unavailablealtogether.
We have made, and may continue to make, strategic acquisitions and divestitures that involve significant risks anduncertainties.
Strategic acquisitions and divestitures that we have made in the past, and may continue to make, presentsignificant risks and uncertainties, which include:
‰ Difficulty in identifying and evaluating potential acquisitions, including the risk that our due diligence does notidentify or fully assess valuation issues, potential liabilities or other acquisition risks;
‰ Difficulty in integrating newly acquired businesses and operations, including combining product and serviceofferings, and in entering into new markets in which we are not experienced, in an efficient and cost-effectivemanner while maintaining adequate standards, controls and procedures, and the risk that we encountersignificant unanticipated costs or other problems associated with integration;
‰ Difficulty in consolidating and rationalizing IT infrastructure, which may include multiple legacy systems fromvarious acquisitions and integrating software code;
‰ Challenges in achieving strategic objectives, cost savings and other benefits expected from acquisitions;‰ Risk that our markets do not evolve as anticipated and that the strategic acquisitions and divestitures do not
prove to be those needed to be successful in those markets;‰ Risk that we assume significant liabilities that exceed the limitations of any applicable indemnification
provisions or the financial resources of any indemnifying parties;‰ Potential loss of key employees or customers of the businesses acquired or to be divested;
18
‰ Risk that we are not able to complete strategic divestitures on satisfactory terms and conditions or withinexpected timeframes; and
‰ Risk of diverting the attention of senior management from our existing operations.
Disputes with our subcontractors and the inability of our subcontractors to perform, or our key suppliers to timelydeliver our components, parts or services, could cause our products or services to be produced or delivered in anuntimely or unsatisfactory manner.
We engage subcontractors on many of our contracts. We may have disputes with our subcontractors, includingregarding the quality and timeliness of work performed by the subcontractor, customer concerns about the subcontract,our failure to extend existing task orders or issue new task orders under a subcontract, our hiring of the personnel of asubcontractor or vice versa or the subcontractor’s failure to comply with applicable law. In addition, there are certainparts, components and services for many of our products and services which we source from other manufacturers orvendors. Some of our suppliers, from time to time, experience financial and operational difficulties, which may impacttheir ability to supply the materials, components, subsystems and services that we require. Our supply chain could alsobe disrupted by external events, such as natural disasters or other significant disruptions (including extreme weatherconditions, medical epidemics, acts of terrorism, cyber attacks and labor disputes), governmental actions andlegislative or regulatory changes (including product certification or stewardship requirements, sourcing restrictions,product authenticity and climate change or greenhouse gas emission standards). Any inability to develop alternativesources of supply on a cost-effective and timely basis could materially impair our ability to manufacture and deliverproducts and services to our customers. We can give no assurances that we will be free from disputes with oursubcontractors, material supply problems or component, subsystems or services problems in the future. Also, oursubcontractors and other suppliers may not be able to acquire or maintain the quality of the materials, components,subsystems and services they supply, which might result in greater product returns, service problems and warrantyclaims and could harm our business, financial condition, results of operations and cash flows.
Third parties have claimed in the past and may claim in the future that we are infringing directly or indirectly upontheir intellectual property rights, and third parties may infringe upon our intellectual property rights.
Many of the markets we serve are characterized by vigorous protection and pursuit of intellectual property rights,which often has resulted in protracted and expensive litigation. Third parties have claimed in the past and may claim inthe future that we are infringing directly or indirectly upon their intellectual property rights, and we may be found to beinfringing or to have infringed directly or indirectly upon those intellectual property rights. Claims of intellectualproperty infringement might also require us to enter into costly royalty or license agreements. Moreover, we may notbe able to obtain royalty or license agreements on terms acceptable to us, or at all. We also may be subject tosignificant damages or injunctions against development and sale of certain of our products, services and solutions. Oursuccess depends in large part on our proprietary technology. We rely on a combination of patents, copyrights,trademarks, trade secrets, know-how, confidentiality provisions and licensing arrangements to establish and protect ourintellectual property rights. If we fail to successfully protect and enforce these rights, our competitive position couldsuffer. Our pending patent and trademark registration applications may not be allowed, or competitors may challengethe validity or scope of our patents or trademark registrations. In addition, our patents may not provide us a significantcompetitive advantage. We may be required to spend significant resources to monitor and police our intellectualproperty rights. We may not be able to detect infringement and our competitive position may be harmed before we doso. In addition, competitors may design around our technology or develop competing technologies.
The outcome of litigation or arbitration in which we are involved is unpredictable and an adverse decision in anysuch matter could have a material adverse effect on our financial condition, results of operations and cash flows.
From time to time, we are defendants in a number of litigation matters and are involved in a number ofarbitrations. These actions may divert financial and management resources that would otherwise be used to benefit ouroperations. No assurances can be given that the results of these or new matters will be favorable to us. An adverseresolution of lawsuits or arbitrations could have a material adverse effect on our financial condition, results ofoperations and cash flows.
We face certain significant risk exposures and potential liabilities that may not be covered adequately by insuranceor indemnity.
We are exposed to liabilities that are unique to the products and services we provide. A significant portion of ourbusiness relates to designing, developing and manufacturing advanced defense, technology and communicationssystems and products. New technologies associated with these systems and products may be untested or unproven.Components of certain of the defense systems and products we develop are inherently dangerous. Failures of satellites,missile systems, air traffic control systems, homeland security applications and aircraft have the potential to cause lossof life and extensive property damage. In most circumstances, we may receive indemnification from the
19
U.S. Government. While we maintain insurance for certain risks, the amount of our insurance coverage may not beadequate to cover all claims or liabilities, and we may be forced to bear substantial costs from an accident or incident.It also is not possible for us to obtain insurance to protect against all operational risks and liabilities. Substantial claimsresulting from an incident in excess of U.S. Government indemnity and our insurance coverage would harm ourfinancial condition, results of operations and cash flows. Moreover, any accident or incident for which we are liable,even if fully insured, could negatively affect our standing with our customers and the public, thereby making it moredifficult for us to compete effectively, and could significantly impact the cost and availability of adequate insurance inthe future.
Changes in our effective tax rate may have an adverse effect on our results of operations.Our future effective tax rate may be adversely affected by a number of factors including:
‰ The jurisdictions in which profits are determined to be earned and taxed;‰ Adjustments to estimated taxes upon finalization of various tax returns;‰ Increases in expenses not fully deductible for tax purposes, including write-offs of acquired in-process research
and development and impairment of goodwill or other long-term assets in connection with acquisitions;‰ Changes in available tax credits;‰ Changes in share-based compensation expense;‰ Changes in the valuation of our deferred tax assets and liabilities;‰ Changes in domestic or international tax laws or the interpretation of such tax laws; and‰ The resolution of issues arising from tax audits with various tax authorities.
Any significant increase in our future effective tax rates could adversely impact our results of operations for futureperiods.
We have significant operations in locations that could be materially and adversely impacted in the event of a naturaldisaster or other significant disruption.
Our corporate headquarters and significant operations of our Government Communications Systems segment arelocated in Florida and significant operations of our Integrated Network Solutions segment are located in Houston,Texas, which areas are subject to the risk of major hurricanes. Our worldwide operations and operations of oursuppliers could be subject to natural disasters or other significant disruptions, including hurricanes, typhoons, tsunamis,floods, earthquakes, fires, water shortages, other extreme weather conditions, medical epidemics, acts of terrorism,power shortages and blackouts, telecommunications failures, cyber attacks and other natural and manmade disasters ordisruptions. In the event of such a natural disaster or other disruption, we could experience disruptions or interruptionsto our operations or the operations of our suppliers, subcontractors, distributors, resellers or customers; destruction offacilities; and/or loss of life, all of which could materially increase our costs and expenses and materially adverselyaffect our business, financial condition, results of operations and cash flows.
Changes in the regulatory framework under which our managed satellite and terrestrial communications solutionsoperations are operated could adversely affect our business, financial condition, results of operations and cashflows.
Our domestic satellite and terrestrial communications solutions are currently provided on a private carrier basisand are therefore subject to a lesser degree of regulation by the Federal Communications Commission and otherFederal, state and local agencies than if provided on a common carrier basis. Our international satellite and terrestrialcommunications solutions operations are regulated by governments of various countries other than the U.S. and byother international authorities. The regulatory regimes applicable to our international satellite and terrestrialcommunications solutions operations frequently require that we obtain and maintain licenses for our operations andconduct our operations in accordance with prescribed standards. Compliance with such requirements may inhibit ourability to quickly expand our operations into new countries, including in circumstances in which such expansion isrequired in order to provide uninterrupted service to existing customers with mobile operations as they move to newlocations on short notice. Failure to comply with such regulatory requirements could subject us to various penalties orsanctions. The adoption of new laws or regulations, changes to the existing domestic or international regulatoryframework, new interpretations of the laws that apply to our operations, or the loss of, or a material limitation on, anyof our material licenses could materially harm our business, financial condition, results of operations and cash flows.
We rely on third parties to provide satellite bandwidth for our managed satellite and terrestrial communicationssolutions, and any bandwidth constraints could harm our business, financial condition, results of operations andcash flows.
In our managed satellite and terrestrial communications solutions operations, we compete for satellite bandwidthwith other commercial entities, such as other satellite communications services providers and broadcasting companies,and with governmental entities, such as the military. In certain markets and at certain times, satellite bandwidth may be
20
limited and/or pricing of satellite bandwidth could be subject to competitive pressure. In such cases, we may be unableto secure sufficient bandwidth needed to provide our managed satellite communications services, either at favorablerates or at all. This inability could harm our business, financial condition, results of operations and cash flows.
Changes in future business or other market conditions could cause business investments and/or recorded goodwillor other long-term assets to become impaired, resulting in substantial losses and write-downs that would adverselyaffect our results of operations.
As part of our overall strategy, we will, from time to time, acquire a minority or majority interest in a business.These investments are made upon careful analysis and due diligence procedures designed to achieve a desired return orstrategic objective. These procedures often involve certain assumptions and judgment in determining acquisition price.After acquisition, unforeseen issues could arise which adversely affect the anticipated returns or which are otherwisenot recoverable as an adjustment to the purchase price. Even after careful integration efforts, actual operating resultsmay vary significantly from initial estimates. Goodwill accounted for approximately 35 percent of our recorded totalassets as of June 27, 2014. We evaluate the recoverability of recorded goodwill annually, as well as when we changereportable segments and when events or circumstances indicate there may be an impairment. The annual impairmenttest is based on several factors requiring judgment. Principally, a decrease in expected reportable segment cash flowsor changes in market conditions may indicate potential impairment of recorded goodwill. For additional information onaccounting policies we have in place for impairment of goodwill, see our discussion under “Critical AccountingPolicies and Estimates” in “Item 7. Management’s Discussion and Analysis of Financial Condition and Results ofOperations” of this Report and Note 1: Significant Accounting Policies and Note 3: Discontinued Operations in theNotes.
We must attract and retain key employees, and failure to do so could seriously harm us.Our business has a continuing need to attract and retain significant numbers of skilled personnel, including
personnel holding security clearances, to support our growth and to replace individuals whose employment hasterminated due to retirement or for other reasons. To the extent that the demand for qualified personnel exceeds supply,as has been the case from time to time in recent years, we could experience higher labor, recruiting or training costs inorder to attract and retain such employees, or could experience difficulties in performing under our contracts if ourneeds for such employees were unmet.
ITEM 1B. UNRESOLVED STAFF COMMENTS.
We have no unresolved comments from the SEC.
ITEM 2. PROPERTIES.
Our principal executive offices are located at owned facilities in Melbourne, Florida. As of June 27, 2014, weoperated approximately 150 locations in the U.S., Canada, Europe, the Middle East, Central and South America, Africaand Asia, consisting of about 6.9 million square feet of manufacturing, administrative, research and development,warehousing, engineering and office space, of which we owned approximately 4.5 million square feet and leasedapproximately 2.4 million square feet. There are no material encumbrances on any of our owned facilities. Our leasedfacilities are, for the most part, occupied under leases for remaining terms ranging from one month to 11 years, amajority of which can be terminated or renewed at no longer than 5-year intervals at our option. As of June 27, 2014,we had major operations at the following locations:
RF Communications — Rochester, New York; Lynchburg, Virginia; Chelmsford, Massachusetts; Queensland,Australia; and Columbia, Maryland.
Integrated Network Solutions — Houston, Texas; Herndon and Alexandria, Virginia; Macae, Rio de Janeiro,Brazil; Melbourne, Florida; Aberdeen, United Kingdom; Forrestfield, Australia; Singapore; Colorado Springs,Colorado; Calgary, Canada; and Bellevue, Nebraska.
Government Communications Systems — Palm Bay, Melbourne and Malabar, Florida; Chantilly, Virginia;Annapolis Junction and Seabrook, Maryland; and Washington, D.C.
Corporate — Melbourne, Florida.
21
The following is a summary of the approximate floor space of our offices and facilities in productive use, bysegment, at June 27, 2014:
In the opinion of management, our facilities, whether owned or leased, are suitable and adequate for their intendedpurposes and have capacities adequate for current and projected needs. Although we have some unused or under-utilized facilities, they are not considered significant. We frequently review our anticipated requirements for facilitiesand will, from time to time, acquire additional facilities, expand existing facilities and dispose of existing facilities orparts thereof, as management deems necessary. For more information about our lease obligations, see Note 18: LeaseCommitments in the Notes. Our facilities and other properties are generally maintained in good operating condition.
ITEM 3. LEGAL PROCEEDINGS.
General. From time to time, as a normal incident of the nature and kind of business in which we are, and were,engaged, various claims or charges are asserted and litigation or arbitration is commenced by or against us arising fromor related to matters, including but not limited to: product liability; personal injury; patents, trademarks, trade secrets orother intellectual property; labor and employee disputes; commercial or contractual disputes; strategic acquisitions ordivestitures; the prior sale or use of former products allegedly containing asbestos or other restricted materials; breachof warranty; or environmental matters. Claimed amounts against us may be substantial but may not bear any reasonablerelationship to the merits of the claim or the extent of any real risk of court or arbitral awards. We record accruals forlosses related to those matters against us that we consider to be probable and that can be reasonably estimated. Gaincontingencies, if any, are recognized when they are realized and legal costs generally are expensed when incurred.Although it is not feasible to predict the outcome of these matters with certainty, it is reasonably possible that somelawsuits, claims or proceedings may be disposed of or decided unfavorably to us and in excess of the amounts currentlyaccrued. Based on available information, in the opinion of management, settlements, arbitration awards and finaljudgments, if any, which are considered probable of being rendered against us in litigation or arbitration in existence atJune 27, 2014 are reserved against or would not have a material adverse effect on our financial condition, results ofoperations or cash flows.
Tax Audits. Our tax filings are subject to audit by taxing authorities in jurisdictions where we conduct business.These audits may result in assessments of additional taxes that are subsequently resolved with the authorities orultimately through established legal proceedings. We believe we have adequately accrued for any ultimate amountsthat are likely to result from these audits; however, final assessments, if any, could be different from the amountsrecorded in our Consolidated Financial Statements. See Note 21: Income Taxes in the Notes for additional informationregarding audits and examinations by taxing authorities of our tax filings.
U.S. Government Business. As a U.S. Government contractor, we are engaged in supplying goods and servicesto the U.S. Government and its various agencies. We are therefore dependent on Congressional appropriations andadministrative allotment of funds and may be affected by changes in U.S. Government policies. U.S. Governmentcontracts typically involve long lead times for design and development, are subject to significant changes in contractscheduling and may be unilaterally modified or cancelled by the U.S. Government. Often these contracts call forsuccessful design and production of complex and technologically advanced products or systems. We may participate insupplying goods and services to the U.S. Government as either a prime contractor or as a subcontractor to a primecontractor. Disputes may arise between the prime contractor and the U.S. Government and the prime contractor and itssubcontractors and may result in litigation or arbitration between the contracting parties.
Generally, U.S. Government contracts are subject to procurement laws and regulations, including the FederalAcquisition Regulation (“FAR”), which outline uniform policies and procedures for acquiring goods and services bythe U.S. Government, and specific agency acquisition regulations that implement or supplement the FAR, such as theDefense Federal Acquisition Regulation Supplement. As a U.S. Government contractor, our contract costs are auditedand reviewed on a continuing basis by the Defense Contract Audit Agency (“DCAA”). The DCAA also reviews theadequacy of, and a U.S. Government contractor’s compliance with, the contractor’s internal control systems and
22
policies, including the contractor’s accounting, purchasing, property, estimating, compensation and managementinformation systems. In addition to these routine audits, from time to time, we may, either individually or inconjunction with other U.S. Government contractors, be the subject of audits and investigations by other agencies ofthe U.S. Government. These audits and investigations are conducted to determine if our performance andadministration of our U.S. Government contracts are compliant with applicable contractual requirements andprocurement and other applicable Federal laws and regulations. These investigations may be conducted without ourknowledge. We are unable to predict the outcome of such investigations or to estimate the amounts of resulting claimsor other actions that could be instituted against us or our officers or employees. Under present U.S. Governmentprocurement laws and regulations, if indicted or adjudged in violation of procurement or other Federal laws, acontractor, such as us, or one or more of our operating divisions or subdivisions, could be subject to fines, penalties,repayments, or compensatory or treble damages. U.S. Government regulations also provide that certain findings againsta contractor may lead to suspension or debarment from eligibility for awards of new U.S. Government contracts for upto three years. Suspension or debarment would have a material adverse effect on us because of our reliance onU.S. Government contracts. In addition, our export privileges could be suspended or revoked, which also would have amaterial adverse effect on us. For further discussion of risks relating to U.S. Government contracts, see “Item 1A. RiskFactors” of this Report.
International. As an international company, we are, from time to time, the subject of investigations relating toour international operations, including under U.S. export control laws and the FCPA and other similar U.S. andinternational laws. As discussed below in “Item 7. Management’s Discussion and Analysis of Financial Condition andResults of Operations” of this Report, on April 4, 2011, we completed the acquisition of Carefx Corporation (“Carefx”)and thereby also acquired its subsidiaries, including in China (“Carefx China”). Following the closing, we becameaware that certain entertainment, travel and other expenses in connection with the Carefx China operations may havebeen incurred or recorded improperly. In response, we initiated an internal investigation and learned that certainemployees of the Carefx China operations had provided pre-paid gift cards and other gifts and payments to certaincustomers, potential customers, consultants and government regulators, after which we took certain remedial actions.The results of the investigation have been disclosed to our Audit Committee, Board of Directors and auditors, andvoluntarily to the U.S. Department of Justice (“DOJ”) and the SEC. The SEC and DOJ have initiated investigationswith respect to this matter and we are fully cooperating with such investigations. We cannot predict at this time theduration or scope of, developments in, results of, or any regulatory action or other potential consequences from, suchinvestigations or otherwise in connection with this matter. However, based on the information available to date, we donot believe that this matter will have a material adverse effect on our financial condition, results of operations or cashflows.
Environmental. We are subject to numerous U.S. Federal, state and international environmental laws andregulatory requirements and are involved from time to time in investigations or litigation of various potentialenvironmental issues concerning activities at our facilities or former facilities or remediation as a result of pastactivities (including past activities of companies we have acquired). From time to time, we receive notices from theU.S. Environmental Protection Agency or equivalent state or international environmental agencies that we are apotentially responsible party under the Comprehensive Environmental Response, Compensation and Liability Act(commonly known as the “Superfund Act”) and/or equivalent laws. Such notices assert potential liability for cleanupcosts at various sites, which include sites owned by us, sites we previously owned and treatment or disposal sites notowned by us, allegedly containing hazardous substances attributable to us from past operations. We own, previouslyowned or are currently named as a potentially responsible party at 14 such sites, excluding sites as to which our recordsdisclose no involvement or as to which our liability has been finally determined. While it is not feasible to predict theoutcome of many of these proceedings, in the opinion of our management, any payments we may be required to makeas a result of such claims in existence at June 27, 2014 will not have a material adverse effect on our financialcondition, results of operations or cash flows. Additional information regarding environmental matters is set forth inNote 1: Significant Accounting Policies in the Notes under the caption “Environmental Expenditures”, whichinformation is incorporated herein by reference, and in “Item 1. Business — Environmental and Other Regulations” ofthis Report.
ITEM 4. MINE SAFETY DISCLOSURES.
Not Applicable.
23
EXECUTIVE OFFICERS OF THE REGISTRANT
The name, age, position held with us, and principal occupation and employment during at least the past 5 years foreach of our executive officers as of August 22, 2014, were as follows:
Name and Age Position Currently Held and Past Business Experience
William M. Brown, 51 . . . . . Chairman, President and Chief Executive Officer since April 2014. President and ChiefExecutive Officer from November 2011 to April 2014. Formerly with United TechnologiesCorporation (“UTC”), as Senior Vice President, Corporate Strategy and Development fromApril 2011 to October 2011; as President of UTC’s Fire & Security division from 2006 to2011; and in U.S. and international roles at UTC’s Carrier Corporation from 2000 to 2006,including President of the Carrier Asia Pacific Operations; and as Director, CorporateStrategy and Business Development from 1997 to 2000. Before joining UTC in 1997,Mr. Brown worked for McKinsey & Company as a senior engagement manager, and priorto that, at Air Products and Chemicals, Inc. as a project engineer.
Robert L. Duffy, 47 . . . . . . . . Senior Vice President, Human Resources and Administration since July 2012.Formerly with UTC, as Vice President, Human Resources for UTC’s Sikorsky aircraftoperation from 2010 to 2011; and in similar roles within UTC’s Fire & Security,Carrier, Hamilton Sundstrand and Pratt & Whitney operations from 1998 to 2009.Before joining UTC in 1998, Mr. Duffy held human resource management positionswith Royal Dutch Shell and James River Corporation.
Sheldon J. Fox, 55 . . . . . . . . . Group President, Government Communications Systems since June 2010. President,National Intelligence Programs, Government Communications Systems fromDecember 2007 to May 2010. President, Defense Programs, GovernmentCommunications Systems from May 2007 to December 2007. Vice President andGeneral Manager, Department of Defense Programs, Government CommunicationsSystems Division from July 2006 to April 2007. Vice President of Programs,Department of Defense Communications Systems, Government CommunicationsSystems Division from July 2005 to June 2006. Mr. Fox joined Harris in 1984.
Miguel A. Lopez, 55 . . . . . . . Senior Vice President and Chief Financial Officer since February 2014. Formerly withAricent Group, as Chief Financial Officer from October 2011 to November 2013; withCisco Systems, as Vice President of Finance and Operations from 2007 to 2011; withTyco International, as Vice President, Business Development of the Fire and Securitydivision from 2005 to 2007 and as Chief Financial Officer for ADT Security SystemsNorth America from 2003 to 2004. Mr. Lopez began his career as an auditor at KPMG,and thereafter was at IBM, where he was Chief Financial Officer for IBM Brazil andfor Latin America Personal Computers, managed Latin America merger andacquisition activity and held various other positions related to pricing and channelstrategy, financial planning and analysis, credit and treasury.
Dana A. Mehnert, 52 . . . . . . . Group President, RF Communications since May 2009. President, RF Communicationsfrom July 2006 to May 2009. Vice President and General Manager — GovernmentProducts Business, RF Communications from July 2005 to July 2006. Vice President andGeneral Manager — Business Development and Operations, RF Communications fromJanuary 2005 to July 2005. Vice President — Defense Operations, RF Communicationsfrom January 2004 to January 2005. Vice President — International Operations, RFCommunications from November 2001 to January 2004. Vice President/ManagingDirector — International Government Sales Operations for Harris’ regional salesorganization from September 1999 to November 2001. Vice President — Marketing andInternational Sales, RF Communications from August 1997 to September 1999. VicePresident — Worldwide Marketing, RF Communications from July 1996 to July 1997.Vice President — International Sales, RF Communications from November 1995 to June1996. Mr. Mehnert joined Harris in 1984.
Scott T. Mikuen, 52 . . . . . . . Senior Vice President, General Counsel and Secretary since February 2013. VicePresident, General Counsel and Secretary from October 2010 to February 2013. VicePresident, Associate General Counsel and Secretary from October 2004 to October2010. Vice President — Counsel, Corporate and Commercial Operations and AssistantSecretary from November 2000 to October 2004. Mr. Mikuen joined Harris in 1996 asFinance Counsel.
24
Name and Age Position Currently Held and Past Business Experience
James D. Morris, 49 . . . . . . . Group President, Integrated Network Solutions since January 2013. Formerly withWestern Digital Corporation (“WDC”), as Executive Vice President and GeneralManager for four of WDC’s commercial product businesses from October 2010 toJanuary 2013; and in domestic and international leadership roles within WDC from2001 to 2010. Before joining WDC in 2001, Mr. Morris worked for McKinsey &Company as senior engagement manager, and, prior to that, he served as anintelligence officer with the U.S. Army.
Lewis A. Schwartz, 51 . . . . . Vice President, Principal Accounting Officer since October 2006. PrincipalAccounting Officer from October 2005 to October 2006. Assistant Controller fromOctober 2003 to October 2005. Director, Corporate Accounting from August 1999 toOctober 2003. Director, Corporate Planning from January 1997 to August 1999.Mr. Schwartz joined Harris in 1992. Formerly, Mr. Schwartz was with Ernst & YoungLLP from 1986 to 1992.
There is no family relationship between any of our executive officers or directors. There are no arrangements orunderstandings between any of our executive officers or directors and any other person pursuant to which any of themwas appointed or elected as an officer or director, other than arrangements or understandings with our directors orofficers acting solely in their capacities as such. All of our executive officers are elected annually and serve at thepleasure of our Board of Directors.
25
PART II
ITEM 5. MARKET FOR REGISTRANT’S COMMON EQUITY, RELATED STOCKHOLDER MATTERSAND ISSUER PURCHASES OF EQUITY SECURITIES.
Market Information and Price Range of Common StockOur common stock, par value $1.00 per share, is listed and traded on the NYSE, under the ticker symbol “HRS.”
According to the records of our transfer agent, as of August 22, 2014, there were approximately 4,969 holders of recordof our common stock. The high and low sales prices of our common stock as reported on the NYSE consolidatedtransactions reporting system and the dividends paid on our common stock for each quarterly period in our last twofiscal years are reported below:
On August 22, 2014, the last sale price of our common stock as reported in the NYSE consolidated transactionsreporting system was $71.02 per share.
DividendsThe cash dividends paid on our common stock for each quarter in our last two fiscal years are set forth in the
tables above. On August 23, 2014, our Board of Directors increased the quarterly cash dividend rate on our commonstock from $.42 per share to $.47 per share, for an annualized cash dividend rate of $1.88 per share, which was ourthirteenth consecutive annual increase in our quarterly cash dividend rate. Our annualized cash dividend rate was $1.68per share in fiscal 2014. Our annualized cash dividend rate was $1.48 per share in fiscal 2013. Our annualized cashdividend rate was $1.32 per share for the last two quarters of fiscal 2012 and $1.12 per share for the first two quartersof fiscal 2012. Quarterly cash dividends are typically paid in March, June, September and December. We currentlyexpect that cash dividends will continue to be paid in the near future, but we can give no assurances concerningpayment of future dividends. The declaration of dividends and the amount thereof will depend on a number of factors,including our financial condition, capital requirements, cash flows, results of operations, future business prospects andother factors that our Board of Directors may deem relevant.
Harris Stock Performance GraphThe following performance graph and table do not constitute soliciting material and the performance graph and
table should not be deemed filed or incorporated by reference into any other previous or future filings by us under theSecurities Act or the Exchange Act, except to the extent that we specifically incorporate the performance graph andtable by reference therein.
The performance graph and table below compare the 5-year cumulative total return of our common stock with thecomparable 5-year cumulative total returns of the Standard & Poor’s 500 Composite Stock Index (“S&P 500”) and theStandard & Poor’s 500 Aerospace & Defense Index (“S&P 500 Aerospace & Defense”). The figures in theperformance graph and table below assume an initial investment of $100 at the close of business on July 3, 2009 inHarris, the S&P 500 and the S&P 500 Aerospace & Defense and the reinvestment of all dividends.
26
COMPARISON OF FIVE-YEAR CUMULATIVE TOTAL RETURN AMONGHARRIS, S&P 500 AND S&P 500 AEROSPACE & DEFENSE
$50
$150
$100
$350
$300
$250
$200
201120102009 201420132012
S&P 500Harris S&P 500 Aerospace & Defense
HARRIS FISCAL YEAR END
Harris $100
2009
$100
$100
$147
2010
$116
$126
$166
2011
$156
$171
$157
2012
$162
$164
$191
2013
$195
$218
$301
2014
$243
$285
S&P 500
S&P 500 Aerospace & Defense
Sales of Unregistered SecuritiesDuring fiscal 2014, we did not issue or sell any unregistered securities.
Issuer Purchases of Equity SecuritiesDuring fiscal 2014, we repurchased 4,560,802 shares of our common stock under our repurchase programs at an
average price per share of $65.76, excluding commissions. During fiscal 2013, we repurchased 8,287,130 shares of ourcommon stock under our repurchase program at an average price per share of $48.25, excluding commissions. Thelevel of our repurchases depends on a number of factors, including our financial condition, capital requirements, cashflows, results of operations, future business prospects and other factors our Board of Directors may deem relevant. Thetiming, volume and nature of repurchases are subject to market conditions, applicable securities laws and other factorsand are at our discretion and may be suspended or discontinued at any time. Shares repurchased by us are cancelled andretired.
27
The following table sets forth information with respect to repurchases by us of our common stock during the fiscalquarter ended June 27, 2014:
(1) On August 26, 2013, we announced that on August 23, 2013, our Board of Directors approved a new share repurchase program (our “2013Repurchase Program”) authorizing us to repurchase up to $1 billion in shares of our common stock through open-market transactions, privatetransactions, transactions structured through investment banking institutions or any combination thereof. Our 2013 Repurchase Program was inaddition to our prior share repurchase program approved in 2011 (our “2011 Repurchase Program”). Our repurchases during the quarter endedDecember 27, 2013 used the remaining authorization under our 2011 Repurchase Program. As of June 27, 2014, $833,501,670 (as reflected inthe table above) was the approximate dollar amount of our common stock that may yet be purchased under our 2013 Repurchase Program, whichdoes not have a stated expiration date. Our repurchase programs have resulted, and our 2013 Repurchase Program is expected to continue toresult, in repurchases in excess of the dilutive effect of shares issued under our share-based incentive plans. However, the level of ourrepurchases depends on a number of factors, including our financial condition, capital requirements, cash flows, results of operations, futurebusiness prospects and other factors our Board of Directors may deem relevant. The timing, volume and nature of repurchases are subject tomarket conditions, applicable securities laws and other factors and are at our discretion and may be suspended or discontinued at any time.
(2) Represents a combination of (a) shares of our common stock delivered to us in satisfaction of the exercise price and/or tax withholding obligationby holders of employee stock options who exercised stock options, (b) shares of our common stock delivered to us in satisfaction of the taxwithholding obligation of holders of performance shares, performance share units or restricted shares that vested during the quarter,(c) performance shares, performance share units, restricted shares or restricted stock units returned to us upon retirement or employmenttermination of employees or (d) shares of our common stock purchased by, or sold to us by, the Harris Corporation Master Rabbi Trust, with thetrustee thereof acting at our direction, to fund obligations of the Rabbi Trust under our deferred compensation plans. Our equity incentive plansprovide that the value of shares delivered to us to pay the exercise price of options or to cover tax withholding obligations shall be the closingprice of our common stock on the date the relevant transaction occurs.
The information required by this Item with respect to securities authorized for issuance under our equitycompensation plans is included in “Item 12. Security Ownership of Certain Beneficial Owners and Management andRelated Stockholder Matters — Equity Compensation Plan Information” of this Report. See Note 14: Stock Optionsand Other Share-Based Compensation in the Notes for a general description of our share-based incentive plans.
28
ITEM 6. SELECTED FINANCIAL DATA.
The following table summarizes our selected historical financial information for each of the last five fiscal years.Amounts pertaining to our results of operations are presented on a continuing operations basis. See Note 3:Discontinued Operations in the Notes for information regarding discontinued operations. The selected financialinformation shown below has been derived from our audited Consolidated Financial Statements, which for datapresented for fiscal 2014 and 2013 are included elsewhere in this Report. This table should be read in conjunction withour other financial information, including “Item 7. Management’s Discussion and Analysis of Financial Condition andResults of Operations” and the Consolidated Financial Statements and accompanying Notes, included elsewhere in thisReport.
(1) Results for fiscal 2013 included an $83.0 million after-tax ($.74 per diluted share) charge, net of government cost reimbursement, for Company-wide restructuring and other actions, including prepayment of long-term debt, asset impairments, a write-off of capitalized software, facilityconsolidation, workforce reductions and other associated costs.
(2) Results for fiscal 2012 included a $46.3 million after-tax ($.40 per diluted share) charge for integration and other costs in our Integrated NetworkSolutions segment associated with our acquisitions of CapRock Holdings, Inc. and its subsidiaries, including CapRock Communications, Inc.(collectively, “CapRock”), Schlumberger group’s Global Connectivity Services business (“Schlumberger GCS”) and Carefx.
(3) Results for fiscal 2011 included a $36.8 million after-tax ($.29 per diluted share) charge for integration and other costs in our Integrated NetworkSolutions segment associated with our acquisitions of CapRock, Schlumberger GCS, the terrestrial network infrastructure assets of thegovernment business of Core180, Inc. and Carefx.
(4) Results for fiscal 2010 included a $14.5 million after-tax ($.11 per diluted share) charge for integration and other costs in our RFCommunications segment associated with our acquisition of substantially all of the assets of the Tyco Electronics wireless systems business.
29
ITEM 7. MANAGEMENT’S DISCUSSION AND ANALYSIS OF FINANCIAL CONDITION ANDRESULTS OF OPERATIONS.
OVERVIEW
The following Management’s Discussion and Analysis (“MD&A”) is intended to assist in an understanding of ourfinancial condition and results of operations. This MD&A is provided as a supplement to, should be read inconjunction with, and is qualified in its entirety by reference to, our Consolidated Financial Statements andaccompanying Notes appearing elsewhere in this Report. Except for the historical information contained herein, thediscussions in this MD&A contain forward-looking statements that involve risks and uncertainties. Our future resultscould differ materially from those discussed herein. Factors that could cause or contribute to such differences include,but are not limited to, those discussed below in this MD&A under “Forward-Looking Statements and Factors that MayAffect Future Results.”
The following is a list of the sections of this MD&A, together with our perspective on their contents, which wehope will assist in reading these pages:
‰ Business Considerations — a general description of our business; the value drivers of our business; fiscal 2014results of operations and liquidity and capital resources key indicators; and industry-wide opportunities,challenges and risks that are relevant to us in the defense, government and commercial markets. In this sectionof this MD&A, “income from continuing operations” refers to income from continuing operations attributable toHarris Corporation common shareholders.
‰ Operations Review — an analysis of our consolidated results of operations and of the results in each of our threebusiness segments, to the extent the segment operating results are helpful to an understanding of our business asa whole, for the three years presented in our financial statements. In this section of this MD&A, “income fromcontinuing operations” refers to income from continuing operations attributable to Harris Corporation commonshareholders.
‰ Liquidity, Capital Resources and Financial Strategies — an analysis of cash flows, common stockrepurchases, dividends, capital structure and resources, contractual obligations, off-balance sheet arrangements,commercial commitments, financial risk management, impact of foreign exchange and impact of inflation.
‰ Critical Accounting Policies and Estimates — a discussion of accounting policies and estimates that require themost judgment and a discussion of accounting pronouncements that have been issued but not yet implementedby us and their potential impact on our financial position, results of operations and cash flows.
‰ Forward-Looking Statements and Factors that May Affect Future Results — cautionary information aboutforward-looking statements and a description of certain risks and uncertainties that could cause our actualresults to differ materially from our historical results or our current expectations or projections.
BUSINESS CONSIDERATIONS
GeneralWe are an international communications and information technology company serving government and
commercial markets in more than 125 countries. We are dedicated to developing best-in-class assuredcommunications® products, systems and services for global markets. Our company generates revenue, income and cashflows by developing, manufacturing and selling communications products and software as well as providing relatedservices. We sell directly to our customers, the largest of which are U.S. Government customers and their primecontractors, and we utilize agents and intermediaries to sell and market some products and services, especially ininternational markets.
We structure our operations primarily around the products and services we sell and the markets we serve, and wereport the financial results of our continuing operations in the following three business segments:
‰ RF Communications, serving (i) U.S. Department of Defense and International Tactical Communications(“Tactical Communications”) and (ii) Public Safety and Professional Communications markets;
‰ Integrated Network Solutions, serving (i) IT Services, (ii) Managed Satellite and Terrestrial CommunicationsSolutions (which market is served by our Harris CapRock Communications business) and (iii) CommercialHealthcare Solutions markets; and
‰ Government Communications Systems, serving (i) Civil, (ii) National Intelligence and (iii) Defense markets.
In the third quarter of fiscal 2012, our Board of Directors approved a plan to exit CIS, which provided remotecloud hosting, and to dispose of the related assets, and we completed the sale of the remaining assets of CIS in the first
30
quarter of fiscal 2014. In the fourth quarter of fiscal 2012, our Board of Directors approved a plan to divest BroadcastCommunications, which provided digital media management solutions in support of broadcast customers, and wecompleted the sale of Broadcast Communications in the third quarter of fiscal 2013. Both CIS and BroadcastCommunications were formerly part of our Integrated Network Solutions segment. For additional informationregarding discontinued operations, see Note 3: Discontinued Operations in the Notes. Except for disclosures related toour cash flows, or unless otherwise specified, disclosures in this Report relate solely to our continuing operations.
At the beginning of the first quarter of fiscal 2014, to leverage the breadth of our IT enterprise network andinformation assurance capabilities for the IT services market, we began managing our cyber security network testingoperation as part of our Integrated Network Solutions segment rather than our Government Communications Systemssegment. As a result, we reassigned $2.4 million of goodwill (determined on a relative fair value basis) to ourIntegrated Network Solutions segment from our Government Communications Systems segment. The historical results,discussion and presentation of our business segments as set forth in this Report have been adjusted to reflect the impactof this change to our business segment reporting structure for all periods presented in this Report.
Financial information with respect to all of our other activities, including corporate costs not allocated to theoperating segments or discontinued operations, is reported as part of the “Unallocated corporate expense” or “Non-operating income (loss)” line items in our Consolidated Financial Statements and accompanying Notes.
Value Drivers of Our BusinessOur two core value drivers are excellence and innovation.
Our Company-wide commitment to excellence is embodied in our Harris Business Excellence (“HBX”) program,which provides the framework and tools that empower every employee to drive continuous improvement in businessperformance and customer satisfaction. HBX incorporates standardized, industry-proven processes and tools based onthe principles of Lean and Six Sigma. Fiscal 2014 was the first full year of program implementation, and we madesignificant strides in three primary areas — customer satisfaction, productivity and asset velocity — through our effortsto optimize processes, eliminate waste, reduce costs and enhance quality across our Company, including in areas suchas manufacturing and field operations, supply chain and overhead functions, and working capital initiatives. Onemethod we use to drive continuous improvement is “value engineering” — continuously evaluating new materials,processes and technologies to insert into products already in production, helping to reduce costs and improve bothquality and customer satisfaction.
Innovation is at the very core of our success, and investment in research and development (“R&D”) represents itsfoundation. Our R&D investments are focused on adding new features to existing products, tailoring offerings forinternational markets, and creating totally new-to-the-world solutions to address our customers’ toughestcommunications challenges. Innovation also leads to natural extensions of our core capabilities for capturing newopportunities in adjacent markets. Innovation provides differentiation and a key competitive advantage for us.
To ensure our investment in R&D is cost-effective and supports innovation across the entire Company, we haveadopted a portfolio management approach, optimizing investment at the Company level rather than the business unitlevel. We have introduced standardized processes and common metrics to track progress and gauge success, and wehave established Core Technology Centers to more fully leverage R&D investment across our Company.
Innovation at Harris also includes introducing new business models to the marketplace to provide our customerswith innovative solutions at lower costs. For example, in the tactical communications market, we provide a“commercial off-the-shelf” approach that entails investing our own R&D funds to provide new mission-criticalcommunications at a much faster pace and lower cost compared to the lengthy development cycle of the traditionalprogram-of-record approach. We also partnered with the FAA to provide a fully-managed service for the FAA FTInetwork that provides mission-critical network capabilities to connect controllers and pilots across more than 4,000nodes, resulting in significantly higher bandwidth and uptime at half the cost of the traditional approach. We also are atthe forefront of a unique piggyback approach of using commercially-hosted satellite payloads to provide multiplemissions on satellites, speeding time-to-mission and lowering costs compared to the traditional model of building andlaunching separate exquisite satellites for each mission requirement.
Key IndicatorsWe believe our value drivers, when implemented, will improve our financial results, including: income from
continuing operations and income from continuing operations per diluted common share; revenue; income fromcontinuing operations as a percentage of revenue; net cash provided by operating activities; return on invested capital;and return on average equity. The measure of our success is reflected in our results of operations and liquidity andcapital resources key indicators as discussed below.
31
Fiscal 2014 Results of Operations Key Indicators: Income from continuing operations, income from continuingoperations per diluted common share, revenue, and income from continuing operations as a percentage of revenuerepresent key measurements of our value drivers:
‰ Income from continuing operations increased 15.7 percent to $539.8 million in fiscal 2014 from $466.4 millionin fiscal 2013;
‰ Income from continuing operations per diluted common share increased 20.2 percent to $5.00 in fiscal 2014from $4.16 in fiscal 2013;
‰ Revenue decreased 2.0 percent to $5.0 billion in fiscal 2014 from $5.1 billion in fiscal 2013; and‰ Income from continuing operations as a percentage of revenue increased to 10.8 percent in fiscal 2014 from
9.1 percent in fiscal 2013.
Refer to MD&A heading “Operations Review” below in this Report for more information.
Liquidity and Capital Resources Key Indicators: Net cash provided by operating activities, return on investedcapital and return on average equity also represent key measurements of our value drivers:
‰ Net cash provided by operating activities increased to $849.2 million in fiscal 2014 from $833.0 million in fiscal2013;
‰ Return on invested capital (defined as after-tax operating income from continuing operations divided by thetwo-point average of invested capital at the beginning and ending of the fiscal year, where invested capitalequals equity plus debt, less cash and cash equivalents) increased to 20.4 percent in fiscal 2014 from17.1 percent in fiscal 2013; and
‰ Return on average equity (defined as income from continuing operations divided by the two-point average ofequity at the beginning and ending of the fiscal year) increased to 31.9 percent in fiscal 2014 from 26.6 percentin fiscal 2013.
Refer to MD&A heading “Liquidity, Capital Resources and Financial Strategies” below in this Report for moreinformation on net cash provided by operating activities.
Industry-Wide Opportunities, Challenges and RisksDepartment of Defense and Other U.S. Federal Markets: U.S. Government budgets remained constrained in
fiscal 2014, and we anticipate a similarly constrained spending environment in fiscal 2015. Contributing to the slowspending environment and similar to U.S. Government Fiscal Year (“GFY”) 2014, Congress has yet to pass the GFY2015 appropriations bills. This means specific budget allocations by program have not been finalized, and if not passedby October 1, 2014, we expect the U.S. Government will operate under a continuing resolution.
Deficit spending has caused U.S. Government budgets to come under significant pressure. In particular, theBudget Control Act of 2011 resulted in automatic spending reductions, known as sequestration, through budget capsfor both defense and non-defense spending. In December 2013, Congress enacted the Bipartisan Budget Act of 2013,modifying the budget caps and increasing the limits on discretionary defense spending for GFY 2014 and GFY 2015 byapproximately $22 billion and $9 billion, respectively, with similar spending relief for non-defense governmentspending. This resulted in a U.S. national defense spending cap of approximately $520 billion for GFY 2014 andapproximately $521 billion for GFY 2015. Passing the 2-year, Bipartisan Budget Act of 2013 provided more certaintyin the budget planning process for both GFY 2014 and 2015 and gave the DoD flexibility in deciding priorities.
For GFYs 2016 through 2021, however, the Bipartisan Budget Act of 2013 retained the previous budget caps andacross-the-board spending reduction methodology as provided under the Budget Control Act of 2011, and as a result ofthe return to full sequestration, there remains uncertainty regarding how sequester cuts would be applied in GFY 2016and beyond. Even under full sequestration, though, the national defense spending cap would be approximately $523billion for GFY 2016, which is higher than the cap for GFY 2015. Alternatively, under the President’s budget requestdated March 2014, which ignores spending caps, national defense spending for GFY 2016 would also be higher atapproximately $535 billion.
Government Oversight and Risk: As a U.S. Government contractor, we are subject to U.S. Governmentoversight. The U.S. Government may investigate our business practices and audit our compliance with applicable rulesand regulations. Depending on the results of those investigations and audits, the U.S. Government could make claimsagainst us. Under U.S. Government procurement regulations and practices, an indictment or conviction of agovernment contractor could result in that contractor being fined and/or suspended from being able to bid on, or frombeing awarded, new U.S. Government contracts for a period of time. Similar government oversight exists in most othercountries where we conduct business.
32
For a discussion of risks relating to U.S. Government contracts and subcontracts, see “Item 1. Business —Principal Customers; Government Contracts” and “Item 1A. Risk Factors” of this Report. We are also subject to otherrisks associated with U.S. Government business, including technological uncertainties, dependence on annualappropriations and allotment of funds, extensive regulations and other risks, which are discussed in “Item 1A. RiskFactors” and “Item 3. Legal Proceedings” of this Report.
State and Local: We also provide products to state and local government agencies that are committed toprotecting our homeland and public safety. The public safety market weakened during fiscal 2014, having concludedan upgrade cycle primarily related to the Federal Communications Commission’s narrow-banding mandate that drovehigher-than-average market demand. Future market opportunities include upgrading aging analog infrastructure to newdigital standards, as well as opportunities associated with next-generation LTE solutions for high data-rate applications,an emerging market in the early stages of development.
International: We believe there is continuing international demand for tactical radio and public safetycommunications for military, government, and commercial customers, as well as for turnkey managed satellitecommunications solutions for government, energy and maritime markets. We believe we can leverage our domainexpertise and proven technology provided in the U.S. for air traffic management, weather ground system technologyand commercially hosted satellite payloads in pursuing international opportunities to further expand our internationalbusiness.
Commercial: We are leveraging proven technologies and capabilities for government applications into attractivecommercial markets. After a long history of providing satellite antennas, space electronics, and payload technology tothe government market, we are applying that same technology and capability in the commercial space market.Similarly, we provide turnkey managed satellite communications solutions not only to government customers inremote and harsh locations but also for commercial energy and maritime customers. After first addressing thegovernment healthcare IT market, we began providing a full range of interoperability and business intelligencesolutions to address the growing complexity in the commercial healthcare IT market. Also, an initiative is underway toleverage our success in providing weather ground system technology for the government market into commercialmarkets such as agriculture, which relies heavily on advanced forecasting capabilities and other weather information.
We believe that our experience, technologies and capabilities are well aligned with the demand and requirementsof the markets noted above in this Report. However, we remain subject to the spending levels, pace and priorities of theU.S. Government as well as international governments and commercial customers, and to general economic conditionsthat could adversely affect us, our customers and our suppliers. We also remain subject to other risks associated withthese markets, including technological uncertainties, adoption of our new products and other risks that are discussedbelow in this Report under “Forward-Looking Statements and Factors that May Affect Future Results” and in“Item 1A. Risk Factors” of this Report.
RevenueFiscal 2014 Compared With Fiscal 2013: The decrease in revenue in fiscal 2014 compared with fiscal 2013 was
primarily due to lower revenue in our Integrated Network Solutions segment, while modestly lower revenue in our RFCommunications segment offset modestly higher revenue in our Government Communications Systems segment. The$113 million decrease in revenue in our Integrated Network Solutions segment was primarily due to lower revenuefrom U.S. Government customers across the segment.
34
Fiscal 2013 Compared With Fiscal 2012: The decrease in revenue in fiscal 2013 compared with fiscal 2012 wasprimarily due to lower revenue in our RF Communications and Integrated Network Solutions segments. The $295million decrease in revenue in our RF Communications segment was primarily due to lower Tactical Communicationsrevenue. The $34 million decrease in revenue in our Integrated Network Solutions segment was due to lower ITServices revenue, partially offset by moderate revenue growth in Harris CapRock Communications and our healthcareoperations.
See the “Discussion of Business Segment Results of Operations” discussion below in this MD&A for furtherinformation.
Gross Margin PercentageFiscal 2014 Compared With Fiscal 2013: Gross margin as a percentage of revenue (“gross margin percentage”)
in fiscal 2014 was essentially unchanged from fiscal 2013 and primarily reflects a 1.0 percentage point increase ingross margin percentage in our Government Communications Systems segment resulting from good programexecution, partially offset by a 0.7 percentage point decrease in gross margin percentage in our RF Communicationssegment resulting from weakness at Public Safety and Professional Communications.
Fiscal 2013 Compared With Fiscal 2012: The decrease in gross margin percentage in fiscal 2013 compared withfiscal 2012 was primarily due to a lower percentage of our overall sales generated by our higher-margin RFCommunications segment and a 1.9 percentage point decrease in gross margin percentage in our Integrated NetworkSolutions segment, partially offset by a 1.4 percentage point increase in gross margin percentage in our RFCommunications segment.
See the “Discussion of Business Segment Results of Operations” discussion below in this MD&A for furtherinformation.
Engineering, Selling and Administrative ExpensesFiscal 2014 Compared With Fiscal 2013: The decrease in engineering, selling and administrative (“ESA”)
expenses and ESA expenses as a percentage of revenue (“ESA percentage”) in fiscal 2014 compared with fiscal 2013was primarily due to $74.7 million of charges recorded in the fourth quarter of fiscal 2013 for company-widerestructuring and other actions and the benefit in fiscal 2014 from prior-year restructuring actions, and an out-of-periodadjustment in the third quarter of fiscal 2014 related to our post-employment benefit plan that reduced general andadministrative expenses, partially offset by higher research and development expenses.
Overall Company-sponsored research and development costs were $264.1 million in fiscal 2014 compared with$254.1 million in fiscal 2013 (including a $17.8 million write-off of capitalized software in our Integrated NetworkSolutions segment, as described below).
Fiscal 2013 Compared With Fiscal 2012: The increase in ESA percentage in fiscal 2013 compared with fiscal2012 was primarily due to a 3.0 percentage point increase in ESA percentage in our RF Communications segment,partially offset by a 2.5 percentage point decrease in ESA percentage in our Integrated Network Solutions segment.The increase in ESA percentage in our RF Communications segment was primarily driven by ESA expenses in fiscal2013 that were essentially flat with fiscal 2012 relative to a 14 percent decrease in segment revenue. Althoughbenefiting from operational excellence initiatives and restructuring actions, RF Communications segment ESAexpenses in fiscal 2013 were higher primarily due to an 8 percent increase in spending on research and developmentcompared with fiscal 2012 and also included a $9 million charge for restructuring actions in the fourth quarter of fiscal2013. The decrease in ESA percentage in our Integrated Network Solutions segment was primarily due to lowergeneral and administrative expenses, including the impact of ongoing cost-reduction efforts and $58 million of chargesrecorded in fiscal 2012 for integration and other costs associated with our acquisitions of CapRock, Schlumberger GCSand Carefx, partially offset by $44 million of charges recorded in fiscal 2013 for asset impairments and a $17.8 millionwrite-off of capitalized software due to a change in accounting estimate.
Overall Company-sponsored research and development costs were $254.1 million in fiscal 2013 (including the$17.8 million write-off of capitalized software in our Integrated Network Solutions segment noted above) comparedwith $218.9 million in fiscal 2012.
See the “Discussion of Business Segment Results of Operations” discussion below in this MD&A for furtherinformation.
Non-Operating Income (Loss)Fiscal 2014 Compared With Fiscal 2013: Non-operating income in fiscal 2014 was due to net income related to
intellectual property matters. Non-operating loss in fiscal 2013 was primarily due to a $33.2 million charge associatedwith our optional redemption on May 28, 2013 of the entire outstanding $300 million principal amount of our 5%
35
Notes due October 1, 2015, a $10.8 million impairment of a cost-method investment and a $6.4 million impairment ofan investment in a joint venture, partially offset by a $9.0 million gain on the sale of securities available-for-sale.
Fiscal 2013 Compared With Fiscal 2012: Non-operating loss in fiscal 2013 was primarily due to the items notedfor fiscal 2013 in the discussion above regarding fiscal 2014 compared with fiscal 2013. Non-operating income infiscal 2012 was primarily due to royalty income related to certain patents.
See Note 20: Non-Operating Income (Loss) in the Notes for further information.
Net Interest ExpenseFiscal 2014 Compared With Fiscal 2013: Our net interest expense decreased in fiscal 2014 compared with fiscal
2013 primarily due to lower debt levels as a result of our optional redemption on May 28, 2013 of the entireoutstanding $300 million principal amount of our 5% Notes due October 1, 2015.
Fiscal 2013 Compared With Fiscal 2012: Our net interest expense decreased slightly in fiscal 2013 comparedwith fiscal 2012 primarily due to lower debt levels as a result of our redemption of our 5% Notes as noted above in thediscussion regarding fiscal 2014 compared with fiscal 2013.
See Note 17: Interest Expense in the Notes for further information.
Income TaxesFiscal 2014 Compared With Fiscal 2013: In fiscal 2014, our effective tax rate benefited from additional
deductions (primarily related to manufacturing) and additional research credits claimed on our fiscal 2013 tax returncompared with our recorded estimates at the end of fiscal 2013, the settlement of a state tax audit and additionalpermanent deductions based on recent tax litigation unrelated to us. In fiscal 2013, legislation was enacted that restoredthe U.S. Federal income tax credit for qualifying research and development expenses. This resulted in a benefit ofapproximately $8.4 million (approximately 1.3 percent of income from continuing operations before income taxes) incalculating our effective tax rate (income taxes as a percentage of income from continuing operations before incometaxes). In fiscal 2013, our effective tax rate also benefited from additional deductions (primarily related tomanufacturing) claimed on our fiscal 2012 tax return compared with our recorded estimates at the end of fiscal 2012,favorable tax settlements, tax elections resulting in the deductibility of certain expenses, a reduction in estimated non-U.S. tax liabilities, a reduction in state taxes due to changes in certain state tax laws and confirmation of the availabilityof certain acquired tax attributes due to audit resolution.
Fiscal 2013 Compared With Fiscal 2012: The major discrete items from which our fiscal 2013 effective tax ratebenefited are those noted for fiscal 2013 in the discussion above regarding fiscal 2014 compared with fiscal 2013. Infiscal 2012, our effective tax rate benefited from additional tax credits and manufacturing deductions claimed on ourfiscal 2011 tax return compared with our recorded estimates at the end of fiscal 2011, as well as from a reduction instate taxes due to changes in certain state tax laws and a reduction in estimated tax liabilities.
See Note 21: Income Taxes in the Notes for further information.
Discontinued Operations, Net of Income TaxesFiscal 2014 Compared With Fiscal 2013: Discontinued operations in fiscal 2014 consisted of a $6.9 million
after-tax increase in the loss on sale of Broadcast Communications from miscellaneous adjustments for contingenciesrelated to the disposition, partially offset by a $1.9 million after-tax gain on sale of the remaining assets of CIS.Discontinued operations in fiscal 2013 included a loss of $32.7 million ($32.2 million after-tax) on the sale ofBroadcast Communications in the third quarter of fiscal 2013, as well as non-cash impairment charges totaling $314.4million ($297.3 million after-tax) recorded during the first two quarters of fiscal 2013 related to BroadcastCommunications based on indicators of value, including financial performance, market conditions, indications of valuefrom interested parties and our entering into a definitive Asset Sale Agreement relating to the sale of BroadcastCommunications. Additionally, based on market indications during fiscal 2013, we recorded non-cash impairmentcharges totaling $16.5 million ($10.1 million after-tax) to write down assets of CIS to their estimated fair value, lessestimated costs to sell.
Fiscal 2013 Compared With Fiscal 2012: Discontinued operations in fiscal 2013 included the items noted forfiscal 2013 in the discussion above regarding fiscal 2014 compared with fiscal 2013. Discontinued operations in fiscal2012 included non-cash impairment charges totaling $447.6 million ($417.0 million after-tax) related to BroadcastCommunications and charges of $142.6 million ($90.2 million after-tax) for impairment of goodwill and other long-lived assets and for exit and disposal costs related to CIS.
See Note 3: Discontinued Operations in the Notes for further information.
36
Income From Continuing Operations Per Diluted Common Share Attributable to Harris Corporation CommonShareholders
Fiscal 2014 Compared With Fiscal 2013: The increase in income from continuing operations per dilutedcommon share in fiscal 2014 compared with the fiscal 2013 was primarily due to the same reasons noted in thediscussions above in this MD&A regarding fiscal 2014 compared with fiscal 2013 and by the reduction in averagecommon shares outstanding as a result of shares repurchased.
Fiscal 2013 Compared With Fiscal 2012: The decrease in income from continuing operations per dilutedcommon share in fiscal 2013 compared with the fiscal 2012 was primarily due to the same reasons noted in thediscussions above in this MD&A regarding fiscal 2013 compared with fiscal 2012, partially offset by the reduction inaverage common shares outstanding as a result of shares repurchased.
See the “Common Stock Repurchases” discussion below in this MD&A for further information.
Discussion of Business Segment Results of Operations
Fiscal 2014 Compared With Fiscal 2013: Segment revenue in fiscal 2014 included Tactical Communicationsrevenue of $1,307.2 million, a 4 percent increase from $1,255.5 million in fiscal 2013; and Public Safety andProfessional Communications revenue of $520.8 million, a 12 percent decrease from $593.5 million in fiscal 2013. Theincrease in Tactical Communications revenue was primarily due to higher revenue in international markets, mostlyoffset by lower revenue from DoD customers. The decrease in Public Safety and Professional Communicationsrevenue was primarily due to continued market weakness.
The decrease in segment gross margin percentage in fiscal 2014 compared with fiscal 2013 was primarily due toweakness in Public Safety and Professional Communications and a $7 million benefit from the cumulative effect of acorrection made in the fourth quarter of fiscal 2013 in the timing of cost recognition on tactical radio programs. Thedecrease in segment ESA percentage in fiscal 2014 compared with fiscal 2013 was primarily driven by a $9 millioncharge for restructuring actions in the fourth quarter of fiscal 2013 and an out-of-period adjustment in the third quarterof fiscal 2014 related to our post-employment benefit plan that reduced segment general and administrative expenses,partially offset by an 8 percent increase in spending on research and development and the impact of accruals in the firstquarter of fiscal 2014 for legal matters related to a Public Safety and Professional Communications program. Thedecrease in segment operating income and operating income as a percentage of revenue (“operating marginpercentage”) in fiscal 2014 compared with fiscal 2013 reflected the items discussed above regarding this segment.
Segment orders were $1.63 billion for fiscal 2014, including $1.13 billion in Tactical Communications and $497million in Public Safety and Professional Communications, compared with $1.90 billion for fiscal 2013, including$1.34 billion in Tactical Communications and $562 million in Public Safety and Professional Communications.Segment funded backlog was $1.13 billion at the end of fiscal 2014, including $564 million in TacticalCommunications and $570 million in Public Safety and Professional Communications, compared with $1.34 billion atthe end of fiscal 2013, including $743 million in Tactical Communications and $598 million in Public Safety andProfessional Communications.
The percentage of this segment’s revenue that was derived from sales to U.S. Government customers, including theDoD and intelligence and civilian agencies, as well as foreign military sales funded through the U.S. Government,whether directly or through prime contractors, was approximately 46 percent in fiscal 2014 and 43 percent in fiscal 2013.
37
Fiscal 2013 Compared With Fiscal 2012: Segment revenue in fiscal 2013 included Tactical Communicationsrevenue of $1,255.5 million, a 20 percent decrease from $1,570.4 million in fiscal 2012; and Public Safety andProfessional Communications revenue of $593.5 million, a 3 percent increase from $573.7 million in fiscal 2012. Thedecrease in Tactical Communications revenue reflects the impact of U.S. and international tactical radio procurementdelays due to the slowdown in spending resulting from U.S. Government funding constraints experienced under thecontinuing resolution and magnified when sequestration was triggered, as well as key order delays in the internationalmarket.
The increase in segment gross margin percentage in fiscal 2013 compared with fiscal 2012 was primarily drivenby a favorable product mix within Tactical Communications and a $7 million benefit from the cumulative effect of acorrection made in the fourth quarter of fiscal 2013 in the timing of cost recognition on tactical radio programs. Theincrease in segment ESA percentage in fiscal 2013 compared with fiscal 2012 was primarily driven by segment ESAexpenses that were only slightly higher compared with fiscal 2012 relative to a 14 percent decrease in segment revenue.Although benefiting from operational excellence initiatives and restructuring actions, segment ESA expenses in fiscal2013 were slightly higher primarily due to an 8 percent increase in spending on research and development comparedwith fiscal 2012 and also included a $9 million charge for restructuring actions in the fourth quarter of fiscal 2013. Thedecrease in segment operating margin percentage in fiscal 2013 compared with fiscal 2012 reflected the itemsdiscussed above regarding this segment for fiscal 2013 compared with fiscal 2012 and was primarily due to thedecrease in revenue in Tactical Communications.
Segment orders were $1.90 billion for fiscal 2013, including $1.34 billion in Tactical Communications and$562 million in Public Safety and Professional Communications, compared with $1.94 billion for fiscal 2012,including $1.47 billion in Tactical Communications and $468 million in Public Safety and ProfessionalCommunications. Segment funded backlog was $1.34 billion at the end of fiscal 2013, including $743 million inTactical Communications and $598 million in Public Safety and Professional Communications, compared with $1.30billion at the end of fiscal 2012, including $665 million in Tactical Communications and $635 million in Public Safetyand Professional Communications.
The percentage of this segment’s revenue that was derived from sales to U.S. Government customers, includingthe DoD and intelligence and civilian agencies, as well as foreign military sales funded through the U.S. Government,whether directly or through prime contractors, was approximately 43 percent in fiscal 2013 and 46 percent infiscal 2012.
Fiscal 2014 Compared With Fiscal 2013: The $113 million decrease in segment revenue in fiscal 2014compared with fiscal 2013 was primarily due to lower revenue from U.S. Government customers in both IT Servicesand Harris CapRock Communications, partially offset by higher revenue from commercial customers in HarrisCapRock Communications and our healthcare operations.
The slight decrease in segment gross margin percentage in fiscal 2014 compared with fiscal 2013 was primarilyattributable to an out-of-period adjustment made to revenue and cost of sales for satellite and terrestrialcommunications services and margin pressure from a competitive market environment, mostly offset by increases ingross margin percentage on satellite and terrestrial communications services due to operational excellenceimprovements. The decrease in segment ESA percentage in fiscal 2014 compared with fiscal 2013 was primarily due to$44 million of charges recorded in the fourth quarter of fiscal 2013 for asset impairments and a write-off of capitalized
38
software due to a change in accounting estimate, and an out-of-period adjustment in the third quarter of fiscal 2014related to our post-employment benefit plan that reduced segment general and administrative expenses, as well asoperational excellence improvements, including the benefit of restructuring actions in fiscal 2013. The increases insegment operating income and operating margin percentage in fiscal 2014 compared with fiscal 2013 were attributableto the decrease in segment ESA percentage, partially offset by the decrease in segment gross margin percentage, asdiscussed above regarding this segment.
Segment orders were $1.53 billion for fiscal 2014 compared with $1.57 billion for fiscal 2013. The percentage ofthis segment’s revenue that was derived from sales to U.S. Government customers, including the DoD and intelligenceand civilian agencies, as well as foreign military sales funded through the U.S. Government, whether directly orthrough prime contractors, was approximately 60 percent in fiscal 2014 and 62 percent in fiscal 2013.
Fiscal 2013 Compared With Fiscal 2012: The decrease in segment revenue in fiscal 2013 compared with fiscal2012 was primarily due to an 11 percent decrease in IT Services revenue, primarily from the loss of the Patriotprogram, partially offset by revenue growth in Harris CapRock Communications and our healthcare operations of 8percent and 7 percent, respectively.
The decrease in segment gross margin and gross margin percentage in fiscal 2013 compared with fiscal 2012 wasprimarily attributable to a decrease in gross margin percentage on satellite and terrestrial communications services,increased costs associated with delivering software products and increased costs on a service contract with agovernment healthcare customer. The decreases in segment ESA expenses and ESA percentage in fiscal 2013compared with fiscal 2012 were primarily due to lower general and administrative expenses, including the impact ofongoing cost-reduction efforts and $58 million of charges recorded in fiscal 2012 for integration and other costsassociated with our acquisitions of CapRock, Schlumberger GCS and Carefx, partially offset by $44 million of chargesrecorded in fiscal 2013 for asset impairments and a write-off of capitalized software due to a change in accountingestimate. The increases in segment operating income and operating margin percentage in fiscal 2013 compared withfiscal 2012 were attributable to the decreases in segment ESA expenses and ESA percentage, partially offset by thedecrease in segment gross margin percentage, as discussed above regarding this segment for fiscal 2013 compared withfiscal 2012.
Segment orders were $1.57 billion for fiscal 2013 compared with $1.78 billion for fiscal 2012. The percentage ofthis segment’s revenue that was derived from sales to U.S. Government customers, including the DoD and intelligenceand civilian agencies, as well as foreign military sales funded through the U.S. Government, whether directly orthrough prime contractors, was approximately 62 percent in fiscal 2013 and 66 percent in fiscal 2012.
Fiscal 2014 Compared With Fiscal 2013: The $17 million increase in segment revenue in fiscal 2014 comparedwith fiscal 2013 was primarily due to higher revenue from classified customers, the FAA NextGen DataCommprogram, the U.S. Army MET program, the F-35 program and the wireless products business, partially offset by lowerrevenue from the NOAA GOES-R weather program.
The 1.0 percentage point increase in segment gross margin percentage in fiscal 2014 compared with fiscal 2013was primarily due to continued strong program performance, including retirement of risk on certain space programs.The slight decrease in segment ESA percentage in fiscal 2014 compared with fiscal 2013 was primarily driven by anout-of-period adjustment in the third quarter of fiscal 2014 related to our post-employment benefit plan that reducedsegment general and administrative expenses, as well as operational excellence improvements and the benefit of
39
restructuring actions in fiscal 2013, partially offset by higher spending on research and development. The increases insegment operating income and operating margin percentage in fiscal 2014 compared with fiscal 2013 reflected theitems discussed above regarding this segment.
Segment orders were $1.78 billion for fiscal 2014 and $1.90 billion for fiscal 2013. The percentage of thissegment’s revenue that was derived from sales to U.S. Government customers, including the DoD and intelligence andcivilian agencies, as well as foreign military sales funded through the U.S. Government, whether directly or throughprime contractors, was approximately 93 percent in fiscal 2014 and approximately 93 percent in fiscal 2013.
Fiscal 2013 Compared With Fiscal 2012: Segment revenue in fiscal 2013 compared with fiscal 2012 decreasedslightly, primarily due to lower revenue from DoD customers and from certain classified programs that were impactedby sequestration, mostly offset by higher revenue from the SGSS program for NASA and ADS-B receiver payloads forAireon, LLC.
Segment operating margin percentage was essentially flat in fiscal 2013 compared with fiscal 2012. The slightincrease in segment gross margin percentage, primarily driven by strong program performance, including theretirement of risk on certain space programs, was offset by slightly higher segment ESA percentage, primarily from a$10 million charge associated with Company-wide restructuring and other actions in the fourth quarter of fiscal 2013.
Segment orders were $1.90 billion for fiscal 2013 and $1.87 billion for fiscal 2012. The percentage of thissegment’s revenue that was derived from sales to U.S. Government customers, including the DoD and intelligence andcivilian agencies, as well as foreign military sales funded through the U.S. Government, whether directly or throughprime contractors, was approximately 93 percent in fiscal 2013 and approximately 97 percent in fiscal 2012.
Unallocated Corporate Expense and Corporate Eliminations
Fiscal 2014 Compared With Fiscal 2013: The decrease in unallocated corporate expense in fiscal 2014compared with fiscal 2013 was primarily due to a $21 million charge associated with Company-wide restructuring andother actions in the fourth quarter of fiscal 2013, as noted below regarding fiscal 2013 compared with fiscal 2012, andthe benefit in fiscal 2014 from prior year restructuring actions. The increase in corporate eliminations in fiscal 2014compared with fiscal 2013 was primarily due to higher intersegment eliminations for sales of services between ourIntegrated Network Solutions segment and our Government Communications Systems segment.
Fiscal 2013 Compared With Fiscal 2012: The increase in unallocated corporate expense in fiscal 2013 fromfiscal 2012 was primarily due to a $21 million charge associated with Company-wide restructuring and other actions inthe fourth quarter of fiscal 2013, including facility consolidation, asset impairments, workforce reductions and otherassociated costs, partially offset by lower expenses resulting from cost-reduction actions in fiscal 2012 and savingsfrom operational excellence initiatives in fiscal 2013. The increase in corporate eliminations in fiscal 2013 comparedwith fiscal 2012 was primarily due to higher intersegment sales between IT Services in our Integrated NetworkSolutions segment and our Government Communications Systems and RF Communications segments.
LIQUIDITY, CAPITAL RESOURCES AND FINANCIAL STRATEGIES
Cash and cash equivalents: Our Consolidated Statement of Cash Flows includes cash flows related toBroadcast Communications and CIS, and our Consolidated Balance Sheet as of the end of fiscal 2013 reflects CIS asdiscontinued operations. However, other than proceeds related to the sale of Broadcast Communications and CIS andnet additions of property, plant and equipment and capitalized software related to Broadcast Communications and CISdisclosed at “Net cash used in investing activities” below, the impact of cash flows related to BroadcastCommunications and CIS to our consolidated cash flows was not material.
The $240.0 million increase in cash and cash equivalents from fiscal 2013 to fiscal 2014 was primarily due to$849.2 million of net cash provided by operating activities, $141.3 million of proceeds from exercises of employeestock options and $42.0 million of net proceeds from the sale of discontinued operations, partially offset by $309.4million used to repurchase shares of our common stock, $201.3 million used for net additions of property, plant andequipment, $180.3 million used to pay cash dividends and $99.7 million used for net repayments of borrowings. The$35.0 million decrease in cash and cash equivalents from fiscal 2012 to fiscal 2013 was primarily due to $414.9 millionused to repurchase shares of our common stock, $346.4 million used for net repayments of borrowings, $178.2 millionused for net additions of property, plant and equipment and capitalized software and $164.7 million used to pay cashdividends, mostly offset by $833.0 million of net cash provided by operating activities, $147.4 million of net proceedsfrom the sale of discontinued operations and $97.9 million of proceeds from exercises of employee stock options.
Our financial position remained strong at June 27, 2014. We ended the fiscal year with cash and cash equivalentsof $561.0 million; we have no long-term debt maturing until December 1, 2017; we have a senior unsecured $1 billionrevolving credit facility that expires in September 2017 (all of which was available to us as of June 27, 2014); and wedo not have any material defined benefit pension plan obligations. Our $561.0 million of cash and cash equivalents atJune 27, 2014 included $188 million held by our foreign subsidiaries, $134 million of which was available for use inthe U.S. without incurring additional U.S. income taxes. We would be required to recognize U.S. income taxes of $16million on the remaining $54 million if we were to repatriate such funds to the U.S., but we have no current plans torepatriate such funds.
Given our current cash position, outlook for funds generated from operations, credit ratings, available creditfacility, cash needs and debt structure, we have not experienced to date, and do not expect to experience, any materialissues with liquidity, although we can give no assurances concerning our future liquidity, particularly in light of theU.S. Government budget uncertainties and the state of global commerce and financial uncertainty.
We also currently believe that existing cash, funds generated from operations, our credit facility and access to thepublic and private debt and equity markets will be sufficient to provide for our anticipated working capitalrequirements, capital expenditures, dividend payments, repurchases under our share repurchase program and potentialacquisitions for the next 12 months and for the reasonably foreseeable future thereafter. We anticipate tax paymentsover the next three years to be approximately equal to our tax expense for the same period. For additional informationregarding our income taxes, see Note 21: Income Taxes in the Notes. Other than those cash outlays noted in the“Contractual Obligations” discussion below in this MD&A, capital expenditures, dividend payments, repurchasesunder our share repurchase program and potential acquisitions, no other significant cash outlays are anticipated infiscal 2015.
There can be no assurance, however, that our business will continue to generate cash flows at current levels or thatthe cost or availability of future borrowings, if any, under our commercial paper program or our credit facility or in thedebt markets will not be impacted by any potential future credit and capital markets disruptions. If we are unable tomaintain cash balances or generate sufficient cash flow from operations to service our obligations, we may be requiredto sell assets, reduce capital expenditures, reduce or eliminate strategic acquisitions, reduce or terminate our sharerepurchases, reduce or eliminate dividends, refinance all or a portion of our existing debt or obtain additional financing.Our ability to make principal payments or pay interest on or refinance our indebtedness depends on our futureperformance and financial results, which, to a certain extent, are subject to general conditions in or affecting thedefense, government and integrated communications and information technology and services markets and to generaleconomic, political, financial, competitive, legislative and regulatory factors beyond our control.
Net cash provided by operating activities: Our net cash provided by operating activities was consistently high infiscal 2014, 2013 and 2012, reflecting solid earnings and good working capital management. Cash flow fromoperations was positive in all of our business segments in fiscal 2014, 2013 and 2012.
Net cash used in investing activities: The $142.9 million increase in net cash used in investing activities infiscal 2014 compared with fiscal 2013 was primarily due to $105.4 million less of proceeds from the sale ofdiscontinued operations (consisting of, for fiscal 2014, $27.0 million of net proceeds from the sale of CIS and $15.0million of proceeds from payment of a note receivable related to the sale of Broadcast Communications, compared
41
with $147.4 million of net proceeds from the sale of Broadcast Communications in fiscal 2013), as well as $23.1million more used for net additions of property, plant and equipment and capitalized software that primarily reflectedinvestments in new systems and infrastructure to support growth. The $229.2 million decrease in net cash used ininvesting activities in fiscal 2013 compared with fiscal 2012 was primarily due to $147.4 million more of proceedsfrom the sale of discontinued operations (consisting of the net proceeds from the sale of Broadcast Communications infiscal 2013) and $55.6 million less used for net additions of property, plant and equipment and capitalized software thatprimarily reflected $37.2 million less used for net additions to property, plant and equipment and capitalized softwarerelated to Broadcast Communications and CIS. Our total capital expenditures in fiscal 2015 are expected to beapproximately $200 million.
Net cash used in financing activities: The $391.6 million decrease in net cash used in financing activities infiscal 2014 compared with fiscal 2013 was primarily due to $246.7 million less of net repayments of borrowings(primarily reflecting $332.2 million used for our optional redemption on May 28, 2013 of the entire outstanding $300million principal amount of our 5% Notes due October 1, 2015), $105.5 million less of repurchases of our commonstock and $43.4 million more of proceeds from exercises of employee stock options, partially offset by $15.6 millionmore used to pay cash dividends. The $229.9 million increase in net cash used in financing activities in fiscal 2013compared with fiscal 2012 was primarily due to $321.5 million more of net repayments of borrowings (primarilyreflecting $332.2 million used for our redemption of our 5% Notes as noted above) and $25.1 million more used to paycash dividends, partially offset by $69.7 million more of proceeds from exercises of employee stock options and $58.6million less of repurchases of our common stock.
Common Stock RepurchasesDuring fiscal 2014, we used $300.0 million to repurchase 4,560,802 shares of our common stock under our
repurchase program at an average price per share of $65.78, including commissions. During fiscal 2013, we used$400.0 million (including proceeds from our sale of Broadcast Communications) to repurchase 8,287,130 shares of ourcommon stock under our repurchase program at an average price per share of $48.27, including commissions. In fiscal2014 and fiscal 2013, $8.8 million and $14.9 million, respectively, in shares of our common stock were delivered to usor withheld by us to satisfy withholding taxes on employee share-based awards. Additionally, in fiscal 2014, we used$0.6 million to repurchase 8,000 shares of our common stock from our Rabbi Trust which is associated with our non-qualified deferred compensation plans. Shares repurchased by us are cancelled and retired.
On August 23, 2013, our Board of Directors approved our new $1 billion 2013 Repurchase Program, which was inaddition to our prior 2011 Repurchase Program. Our repurchases during the second quarter of fiscal 2014 used theremaining authorization under our 2011 Repurchase Program. As of June 27, 2014, we had a remaining, unusedauthorization of approximately $834 million under our 2013 Repurchase Program, which does not have a stated expirationdate. Our repurchase programs have resulted, and our 2013 Repurchase Program is expected to continue to result, inrepurchases in excess of the dilutive effect of shares issued under our share-based incentive plans. However, the level ofour repurchases depends on a number of factors, including our financial condition, capital requirements, cash flows,results of operations, future business prospects and other factors our Board of Directors may deem relevant. Repurchasesare expected to be funded with available cash and commercial paper and may be made through open market purchases,private transactions, transactions structured through investment banking institutions or any combination thereof. Thetiming, volume and nature of repurchases are subject to market conditions, applicable securities laws and other factors andare at our discretion and may be suspended or discontinued at any time. Additional information regarding repurchasesduring fiscal 2014 and fiscal 2013 and our repurchase programs is set forth above under “Item 5. Market for Registrant’sCommon Equity, Related Stockholder Matters and Issuer Purchases of Equity Securities” of this Report.
DividendsOn August 23, 2014, our Board of Directors increased the quarterly cash dividend rate on our common stock from
$.42 per share to $.47 per share, for an annualized cash dividend rate of $1.88 per share, which was our thirteenthconsecutive annual increase in our quarterly cash dividend rate. Our annualized cash dividend rate was $1.68 per sharein fiscal 2014 and $1.48 per share in fiscal 2013. Our annualized cash dividend rate was $1.32 per share for the last twoquarters of fiscal 2012 and $1.12 per share for the first two quarters of fiscal 2012. There can be no assurances that ourannualized cash dividend rate will continue to increase. Quarterly cash dividends are typically paid in March, June,September and December. We currently expect that cash dividends will continue to be paid in the near future, but wecan give no assurances concerning payment of future dividends. The declaration of dividends and the amount thereofwill depend on a number of factors, including our financial condition, capital requirements, cash flows, results ofoperations, future business prospects and other factors that our Board of Directors may deem relevant. Additionalinformation concerning our dividends is set forth above under “Item 5. Market for Registrant’s Common Equity,Related Stockholder Matters and Issuer Purchases of Equity Securities” of this Report.
42
Capital Structure and Resources2012 Credit Agreement: As discussed in Note 11: Credit Arrangements in the Notes, on September 28, 2012,
we established a new $1 billion 5-year senior unsecured revolving credit facility (the “2012 Credit Facility”) byentering into a Revolving Credit Agreement (the “2012 Credit Agreement”) with a syndicate of lenders. The 2012Credit Facility replaced our prior revolving credit facilities. The description of the 2012 Credit Facility and the 2012Credit Agreement set forth in Note 11: Credit Arrangements in the Notes is incorporated herein by reference.
Short-Term Debt: Our short-term debt at June 27, 2014 and June 28, 2013 was $58.3 million and$144.6 million, respectively. Our short-term debt at June 27, 2014 and June 28, 2013 primarily consisted ofcommercial paper issued to partially fund our optional redemption on May 28, 2013 of the entire outstanding $300million principal amount of our 5% Notes due October 1, 2015. Our commercial paper program was supported atJune 27, 2014 and June 28, 2013 by the 2012 Credit Facility.
Long-Term Debt: The description of our long-term debt set forth in Note 13: Long-Term Debt in the Notes isincorporated herein by reference. As discussed in Note 13: Long-Term Debt in the Notes, on May 28, 2013, wecompleted our optional redemption of the entire outstanding $300 million principal amount of our 5% Notes dueOctober 1, 2015 at a “make-whole” redemption price of $332.2 million as set forth in the 5% Notes, which wereterminated and cancelled.
Other: We have an automatically effective, universal shelf registration statement, filed with the SEC onFebruary 27, 2013, related to the potential future issuance of an indeterminate amount of securities, including debtsecurities, preferred stock, common stock, fractional interests in preferred stock represented by depositary shares andwarrants to purchase debt securities, preferred stock or common stock.
We expect to maintain operating ratios, fixed-charge coverage ratios and balance sheet ratios sufficient forretention of, or improvement to, our current debt ratings. There are no assurances that our debt ratings will not bereduced in the future. If our debt ratings are lowered below “investment grade,” we may not be able to issue short-termcommercial paper, but may instead need to borrow under our credit facility or pursue other options. In addition, if ourdebt ratings are lowered to below “investment grade,” we may also be required to provide collateral to support aportion of our outstanding performance bonds. For a discussion of such performance bonds, see the “CommercialCommitments” discussion below. We do not currently expect a downgrade of our current debt ratings, but noassurances can be given. If our debt ratings are downgraded, it could adversely impact, among other things, our futureborrowing costs and access to capital markets and our ability to receive certain types of contract awards.
Contractual ObligationsAt June 27, 2014, we had contractual cash obligations to repay debt, to purchase goods and services and to make
payments under operating leases. Payments due under these long-term obligations are as follows:
(1) Amounts do not include pension contributions and payments for various welfare and benefit plans because such amounts had not beendetermined beyond fiscal 2014.
(2) The purchase obligations of $1,196.9 million included (a) $344.9 million of purchase obligations related to our Government CommunicationsSystems segment, which were fully funded under contracts with the U.S. Government, and $66.8 million of these purchase obligations related tocost-plus type contracts where our costs were fully reimbursable; and (b) the purchase of satellite bandwidth in our Integrated Network Solutionssegment.
(3) Amounts do not include unrecognized tax benefits of $71.9 million.
43
Off-Balance Sheet ArrangementsIn accordance with the definition under SEC rules, any of the following qualify as off-balance sheet arrangements:
‰ Any obligation under certain guarantee contracts;
‰ A retained or contingent interest in assets transferred to an unconsolidated entity or similar arrangement thatserves as credit, liquidity or market risk support to that entity for such assets;
‰ Any obligation, including a contingent obligation, under certain derivative instruments; and
‰ Any obligation, including a contingent obligation, under a material variable interest held by the registrant in anunconsolidated entity that provides financing, liquidity, market risk or credit risk support to the registrant, orengages in leasing, hedging or research and development services with the registrant.
Currently we are not participating in any material transactions that generate relationships with unconsolidatedentities or financial partnerships, including variable interest entities, and we do not have any material retained orcontingent interest in assets as defined above. As of June 27, 2014, we did not have material financial guarantees orother contractual commitments that are reasonably likely to adversely affect our results of operations, financialcondition or cash flows. In addition, we are not currently a party to any related party transactions that materially affectour results of operations, financial condition or cash flows.
We have, from time to time, divested certain of our businesses and assets. In connection with these divestitures,we often provide representations, warranties and/or indemnities to cover various risks and unknown liabilities, such asenvironmental liabilities and tax liabilities. We cannot estimate the potential liability from such representations,warranties and indemnities because they relate to unknown conditions. We do not believe, however, that the liabilitiesrelating to these representations, warranties and indemnities will have a material adverse effect on our results ofoperations, financial condition or cash flows.
Due to our downsizing of certain operations pursuant to acquisitions, restructuring plans or otherwise, certain propertiesleased by us have been sublet to third parties. In the event any of these third parties vacates any of these premises, we would belegally obligated under master lease arrangements. We believe that the financial risk of default by such sublessees isindividually and in the aggregate not material to our results of operations, financial condition or cash flows.
Commercial CommitmentsWe have entered into commercial commitments in the normal course of business including surety bonds, standby
letter of credit agreements and other arrangements with financial institutions and customers primarily relating to theguarantee of future performance on certain contracts to provide products and services to customers or to obtaininsurance policies with our insurance carriers. At June 27, 2014, we had commercial commitments on outstandingsurety bonds, standby letters of credit and other arrangements, as follows:
The surety bonds and standby letters of credit used for performance are primarily related to Public Safety andProfessional Communications. As is customary in bidding for and completing network infrastructure projects forpublic safety systems, contractors are required to procure surety bonds and/or standby letters of credit for bids,performance, warranty and other purposes (collectively, “Performance Bonds”). Such Performance Bonds normallyhave maturities of up to three years and are standard in the industry as a way to provide customers a mechanism to seek
44
redress if a contractor does not satisfy performance requirements under a contract. Typically, a customer is permitted todraw on a Performance Bond if we do not fulfill all terms of a project contract. In such an event, we would be obligatedto reimburse the financial institution that issued the Performance Bond for the amounts paid. It has been rare for ourPublic Safety and Professional Communications business to have a Performance Bond drawn upon. In addition,pursuant to the terms under which we procure Performance Bonds, if our credit ratings are lowered to below“investment grade,” we may be required to provide collateral to support a portion of the outstanding amount ofPerformance Bonds. Such a downgrade could increase the cost of the issuance of Performance Bonds and could makeit more difficult to procure Performance Bonds, which would adversely impact our ability to compete for contractawards. Such collateral requirements could also result in less liquidity for other operational needs or corporatepurposes. In addition, any future disruptions, uncertainty or volatility in financial and insurance markets could alsoadversely affect our ability to obtain Performance Bonds and may result in higher funding costs.
Financial Risk ManagementIn the normal course of doing business, we are exposed to the risks associated with foreign currency exchange
rates and changes in interest rates. We employ established policies and procedures governing the use of financialinstruments to manage our exposure to such risks.
Foreign Exchange and Currency: We use foreign currency forward contracts and options to hedge bothbalance sheet and off-balance sheet future foreign currency commitments. Factors that could impact the effectivenessof our hedging programs for foreign currency include accuracy of sales estimates, volatility of currency markets andthe cost and availability of hedging instruments. A 10 percent change in currency exchange rates for our foreigncurrency derivatives held at June 27, 2014 would not have had a material impact on the fair value of such instrumentsor our results of operations or cash flows. This quantification of exposure to the market risk associated with foreigncurrency financial instruments does not take into account the offsetting impact of changes in the fair value of ourforeign denominated assets, liabilities and firm commitments. See Note 19: Derivative Instruments and HedgingActivities in the Notes for additional information.
Interest Rates: As of June 27, 2014, we had long-term debt obligations. The fair value of our long-term debtobligations is impacted by changes in interest rates; however, a 10 percent change in interest rates for our long-termdebt obligations at June 27, 2014 would not have had a material impact on the fair value of such long-term debtobligations. Additionally, there is no interest rate risk associated with our long-term debt obligations on our results ofoperations and cash flows, because the interest rates on our long-term debt obligations are fixed, and because our long-term debt is not putable (redeemable at the option of the holders of the debt prior to maturity).
As of June 27, 2014, we also had short-term variable-rate debt outstanding, primarily under our commercial paperprogram, subject to interest rate risk. We utilize our commercial paper program to satisfy short-term cash requirements,including bridge financing for strategic acquisitions until longer-term financing arrangements are put in place,temporarily funding repurchases under our share repurchase programs and temporarily funding redemption of long-term debt. The interest rate risk associated with this short-term debt on our results of operations and cash flows is notmaterial.
We can give no assurances, however, that interest rates will not change significantly or have a material effect onthe fair value of our long-term debt obligations or on our results of operations or cash flows over the next twelvemonths.
Impact of Foreign ExchangeApproximately 28 percent of our international business was transacted in local currency environments in fiscal
2014 compared with 32 percent in fiscal 2013. The impact of translating the assets and liabilities of these operations toU.S. dollars is included as a component of shareholders’ equity. As of June 27, 2014, the cumulative foreign currencytranslation adjustment included in shareholders’ equity was a $6.6 million gain compared with a $27.2 million loss atJune 28, 2013. We utilize foreign currency hedging instruments to minimize the currency risk of internationaltransactions. Gains and losses resulting from currency rate fluctuations did not have a material effect on our results infiscal 2014, 2013 or 2012.
Impact of InflationTo the extent feasible, we have consistently followed the practice of adjusting our prices to reflect the impact of
inflation on salaries and fringe benefits for employees and the cost of purchased materials and services. Inflation andchanging prices did not materially adversely impact our gross margin, revenue or operating income in fiscal 2014, 2013or 2012.
45
CRITICAL ACCOUNTING POLICIES AND ESTIMATES
The following is not intended to be a comprehensive list of all of our accounting policies or estimates. Oursignificant accounting policies are more fully described in Note 1: Significant Accounting Policies in the Notes. Inpreparing our financial statements and accounting for the underlying transactions and balances, we apply ouraccounting policies and estimates as disclosed in the Notes. We consider the policies and estimates discussed below ascritical to an understanding of our financial statements because their application places the most significant demandson our judgment, with financial reporting results dependent on estimates about the effect of matters that are inherentlyuncertain and may change in subsequent periods. Specific risks for these critical accounting estimates are described inthe following paragraphs. The impact and any associated risks related to these estimates on our business operations arediscussed throughout this MD&A where such estimates affect our reported and expected financial results. Seniormanagement has discussed the development and selection of the critical accounting policies and estimates and therelated disclosure included herein with the Audit Committee of our Board of Directors. Preparation of this Reportrequires us to make estimates and assumptions that affect the reported amount of assets and liabilities, disclosure ofcontingent assets and liabilities at the date of our financial statements and the reported amounts of revenue andexpenses during the reporting period. Actual results may differ from those estimates.
Besides estimates that meet the “critical” accounting estimate criteria, we make many other accounting estimatesin preparing our financial statements and related disclosures. All estimates, whether or not deemed critical, affectreported amounts of assets, liabilities, revenue and expenses as well as disclosures of contingent assets and liabilities.Estimates are based on experience and other information available prior to the issuance of the financial statements.Materially different results can occur as circumstances change and additional information becomes known, includingfor estimates that we do not deem “critical.”
Revenue RecognitionA significant portion of our business is derived from development and production contracts. Revenue and profits
related to development and production contracts are recognized using the percentage-of-completion method, generallybased on the ratio of costs incurred to estimated total costs at completion (i.e., the “cost-to-cost” method) withconsideration given for risk of performance and estimated profit. The majority of the revenue in our GovernmentCommunications Systems segment (and to a certain extent, revenue in our Integrated Network Solutions segment)relates to development and production contracts, and the percentage-of-completion method of revenue recognition isprimarily used for these contracts. Change orders, claims or other items that may change the scope of a developmentand production contract are included in contract value only when the value can be reliably estimated and realization isprobable. Possible incentives or penalties and award fees applicable to performance on development and productioncontracts are considered in estimating contract value and profit rates and are recorded when there is sufficientinformation to assess anticipated contract performance. Incentive provisions that increase earnings based solely on asingle significant event are generally not recognized until the event occurs.
Under the percentage-of-completion method of accounting, a single estimated total profit margin is used torecognize profit for each development and production contract over its period of performance. Recognition of profit ondevelopment and production fixed-price contracts requires estimates of the total cost at completion and themeasurement of progress toward completion. The estimated profit or loss on a development and production contract isequal to the difference between the estimated contract value and the estimated total cost at completion. Due to the long-term nature of many of our programs, developing the estimated total cost at completion often requires judgment.Factors that must be considered in estimating the cost of the work to be completed include the nature and complexity ofthe work to be performed, subcontractor performance, the risk and impact of delayed performance, availability andtiming of funding from the customer and the recoverability of any claims outside the original development andproduction contract included in the estimate to complete. At the outset of each contract, we gauge its complexity andperceived risks and establish an estimated total cost at completion in line with these expectations. After establishing theestimated total cost at completion, we follow a standard estimate at completion process in which management reviewsthe progress and performance on our ongoing development and production contracts at least quarterly and, in manycases, more frequently. If we successfully retire risks associated with the technical, schedule and cost aspects of acontract, we may lower our estimated total cost at completion commensurate with the retirement of these risks.Conversely, if we are not successful in retiring these risks, we may increase our estimated total cost at completion.Additionally, at the outset of a cost-reimbursable contract (for example, contracts containing award or incentive fees),we establish an estimate of total contract value, or revenue, based on our expectation of performance on the contract.As the cost-reimbursable contract progresses, our estimates of total contract value may increase or decrease if, forexample, we receive higher or lower than expected award fees. When adjustments in estimated total costs atcompletion or in estimates of total contract value are determined, the related impact to operating income is recognized
46
using the cumulative catch-up method, which recognizes in the current period the cumulative effect of suchadjustments for all prior periods. Anticipated losses on development and production contracts or programs in progressare charged to operating income when identified. We have not made any material changes in the methodologies used torecognize revenue on development and production contracts or to estimate our costs related to development andproduction contracts in the past three fiscal years.
Estimate at completion adjustments had the following impacts to operating income for the periods presented:2014 2013 2012
There were no individual impacts to operating income due to estimate at completion adjustments in fiscal 2014,2013 or 2012 that were material to our results of operations on a consolidated or segment basis for such periods.
We also recognize revenue from arrangements requiring the delivery or performance of multiple deliverables orelements under a bundled sale. In these arrangements, judgment is required to determine the appropriate accounting,including whether the individual deliverables represent separate units of accounting for revenue recognition purposes,and the timing of revenue recognition for each deliverable. If we determine that individual deliverables representseparate units of accounting, we recognize the revenue associated with each unit of accounting separately, and contractrevenue is allocated among the separate units of accounting at the inception of the arrangement based on relativeselling price. If options or change orders materially change the scope of work or price of the contract subsequent toinception, we reevaluate and adjust our prior conclusions regarding units of accounting and allocation of contractrevenue as necessary. The allocation of selling price among the separate units of accounting may impact the timing ofrevenue recognition, but will not change the total revenue recognized on the arrangement. We establish the sellingprice used for each deliverable based on the vendor-specific objective evidence (“VSOE”) of selling price, or third-party evidence (“TPE”) of selling price if VSOE of selling price is not available, or best estimate of selling price(“BESP”) if neither VSOE of selling price nor TPE of selling price is available. In determining VSOE of selling price,a substantial majority of the recent standalone sales of the deliverable must be priced within a relatively narrow range.In determining TPE of selling price, we evaluate competitor prices for similar deliverables when sold separately.Generally, comparable pricing of our products to those of our competitors with similar functionality cannot beobtained. In determining BESP, we consider both market data and entity-specific factors, including market conditions,the geographies in which our products are sold, our competitive position and strategy, and our profit objectives.
Provisions for Excess and Obsolete Inventory LossesWe value our inventory at the lower of cost or market. We balance the need to maintain prudent inventory levels
to ensure competitive delivery performance with the risk of excess or obsolete inventory due to changing technologyand customer requirements. We regularly review inventory quantities on hand and record a provision for excess andobsolete inventory primarily based on our estimated forecast of product demand, anticipated end of product life andproduction requirements. The review of excess and obsolete inventory applies to all of our business segments. Severalfactors may influence the sale and use of our inventories, including our decision to exit a product line, technologicalchange and new product development. These factors could result in a change in the amount of obsolete inventoryquantities on hand. Additionally, our estimates of future product demand may prove to be inaccurate, in which case wemay have understated or overstated the provision required for excess and obsolete inventory. In the future, if wedetermine that our inventory is overvalued, we would be required to recognize such costs in the “Cost of product sales”line item in our Consolidated Statement of Income at the time of such determination. In the case of goods which havebeen written down below cost, such reduced amount is to be considered the cost for subsequent accounting purposes.We have not made any material changes in the reserve methodology used to establish our inventory loss reservesduring the past three fiscal years.
As of June 27, 2014, our reserve for excess and obsolete inventory was $38.0 million, or 12 percent of our grossinventory balance, which compares with our reserve of $35.8 million, or 11 percent of our gross inventory balance, asof June 28, 2013. We recorded $4.8 million, $6.7 million and $10.8 million in inventory write-downs that eitherreduced our reserve for excess and obsolete inventory or our income from continuing operations before income taxesduring fiscal 2014, 2013 and 2012, respectively. Although we make reasonable efforts to ensure the accuracy of ourforecasts of future product demand, including the impact of planned future product launches, any significantunanticipated changes in demand or technological developments could have a significant impact on the value of ourinventory and our reported operating results.
47
GoodwillGoodwill in our Consolidated Balance Sheet as of June 27, 2014 and June 28, 2013 was $1,711.2 million and
$1,692.0 million, respectively. Goodwill is not amortized. We perform annual (or under certain circumstances, morefrequent) impairment tests of our goodwill using a two-step process. The first step is to identify potential impairmentby comparing the fair value of each of our reporting units with its net book value, including goodwill, adjusted forallocations of corporate assets and liabilities as appropriate. If the fair value of a reporting unit exceeds its adjusted netbook value, goodwill of the reporting unit is considered not impaired and the second step of the impairment test isunnecessary. If the adjusted net book value of a reporting unit exceeds its fair value, the second step of the goodwillimpairment test compares the implied fair value of the reporting unit’s goodwill with the carrying amount of thatgoodwill. If the carrying amount of the reporting unit’s goodwill exceeds the implied fair value of that goodwill, animpairment loss is recognized in an amount equal to that excess. The implied fair value of goodwill is determined inthe same manner as the amount of goodwill recognized in a business combination. The fair value of the reporting unitis allocated to all of the assets and liabilities of that unit, including any unrecognized intangible assets, as if thereporting unit had been acquired in a business combination and the fair value of the reporting unit was the purchaseprice paid to acquire the reporting unit.
We estimate fair values of our reporting units based on projected cash flows, and sales and/or earnings multiplesapplied to the latest twelve months’ sales and earnings of our reporting units. Projected cash flows are based on ourbest estimate of future sales, operating costs and balance sheet metrics reflecting our view of the financial and marketconditions of the underlying business; and the resulting cash flows are discounted using an appropriate discount ratethat reflects the risk in the forecasted cash flows. The sales and earnings multiples applied to the sales and earnings ofour reporting units are based on current multiples of sales and earnings for similar businesses, and based on sales andearnings multiples paid for recent acquisitions of similar businesses made in the marketplace. We then assess whetherany implied control premium, based on a comparison of fair value based purely on our stock price and outstandingshares with fair value determined by using all of the above-described models, is reasonable. We have not made anymaterial changes during the past three fiscal years in the methodology used in the assessment of whether or notgoodwill is impaired.
Fiscal 2012, 2013 and 2014 Impairment TestsIn the fourth quarter of fiscal 2012, 2013 and 2014, we performed our annual impairment tests of our reporting
units’ goodwill. We completed these tests with no adjustment required to the goodwill of any of our reporting units.For all of our reporting units, the fair value determination resulted in an amount that exceeded the reporting unit’sadjusted net book value by a substantial margin. See Note 3: Discontinued Operations in the Notes for informationregarding impairments related to Broadcast Communications goodwill.
Income Taxes and Tax Valuation AllowancesWe record the estimated future tax effects of temporary differences between the tax basis of assets and liabilities and
amounts reported in our Consolidated Balance Sheet, as well as operating loss and tax credit carryforwards. We followvery specific and detailed guidelines in each tax jurisdiction regarding the recoverability of any tax assets recorded on thebalance sheet and provide necessary valuation allowances as required. Future realization of deferred tax assets ultimatelydepends on the existence of sufficient taxable income of the appropriate character (for example, ordinary income orcapital gain) within the carryback or carryforward periods available under the tax law. We regularly review our deferredtax assets for recoverability based on historical taxable income, projected future taxable income, the expected timing ofthe reversals of existing temporary differences and tax planning strategies. We have not made any material changes in themethodologies used to determine our tax valuation allowances during the past three fiscal years.
Our Consolidated Balance Sheet as of June 27, 2014 included current deferred tax assets of $112.2 million, non-current deferred tax assets of $87.3 million and current deferred tax liabilities of $2.1 million. This compares withcurrent deferred tax assets of $121.2 million, non-current deferred tax assets of $124.8 million and current deferred taxliabilities of $1.8 million as of June 28, 2013. For all jurisdictions for which we have net deferred tax assets, we expectthat our existing levels of pre-tax earnings are sufficient to generate the amount of future taxable income needed torealize these tax assets. Our valuation allowance related to deferred income taxes, which is reflected in ourConsolidated Balance Sheet, was $68.2 million as of June 27, 2014 and $74.1 million as of June 28, 2013. Although wemake reasonable efforts to ensure the accuracy of our deferred tax assets, if we continue to operate at a loss in certainjurisdictions or are unable to generate sufficient future taxable income, or if there is a material change in the actualeffective tax rates or time period within which the underlying temporary differences become taxable or deductible, or ifthe potential impact of tax planning strategies changes, we could be required to increase the valuation allowanceagainst all or a significant portion of our deferred tax assets resulting in a substantial increase in our effective tax rateand a material adverse impact on our operating results.
48
Impact of Recently Issued Accounting PronouncementsAccounting pronouncements that have recently been issued but have not yet been implemented by us are
described in Note 2: Accounting Changes or Recent Accounting Pronouncements in the Notes, which describes thepotential impact that these pronouncements are expected to have on our financial position, results of operations andcash flows.
FORWARD-LOOKING STATEMENTS AND FACTORS THAT MAY AFFECT FUTURE RESULTS
The following are some of the factors we believe could cause our actual results to differ materially from ourhistorical results or our current expectations or projections. Other factors besides those listed here also could adverselyaffect us. See “Item 1A. Risk Factors” of this Report for more information regarding factors that might cause ourresults to differ materially from those expressed in or implied by the forward-looking statements contained in thisReport.
‰ We depend on U.S. Government customers for a significant portion of our revenue, and the loss of theserelationships, a reduction in U.S. Government funding or a change in U.S. Government spending priorities couldhave an adverse impact on our business, financial condition, results of operations and cash flows.
‰ We depend significantly on U.S. Government contracts, which often are only partially funded, subject toimmediate termination, and heavily regulated and audited. The termination or failure to fund, or negative auditfindings for, one or more of these contracts could have an adverse impact on our business, financial condition,results of operations and cash flows.
‰ We could be negatively impacted by a security breach, through cyber attack, cyber intrusion or otherwise, orother significant disruption of our IT networks and related systems or of those we operate for certain of ourcustomers.
‰ We enter into fixed-price contracts that could subject us to losses in the event of cost overruns or a significantincrease in inflation.
‰ We derive a significant portion of our revenue from international operations and are subject to the risks of doingbusiness internationally, including fluctuations in currency exchange rates.
‰ Our reputation and ability to do business may be impacted by the improper conduct of our employees, agents orbusiness partners.
‰ We may not be successful in obtaining the necessary export licenses to conduct certain operations abroad, andCongress may prevent proposed sales to certain foreign governments.
‰ The continued effects of the general weakness in the global economy and the U.S. Government’s budget deficitsand national debt and sequestration could have an adverse impact on our business, financial condition, results ofoperations and cash flows.
‰ Our future success will depend on our ability to develop new products, systems, services and technologies thatachieve market acceptance in our current and future markets.
‰ We participate in markets that are often subject to uncertain economic conditions, which makes it difficult toestimate growth in our markets and, as a result, future income and expenditures.
‰ We cannot predict the consequences of future geo-political events, but they may adversely affect the markets inwhich we operate, our ability to insure against risks, our operations or our profitability.
‰ We have made, and may continue to make, strategic acquisitions and divestitures that involve significant risksand uncertainties.
‰ Disputes with our subcontractors and the inability of our subcontractors to perform, or our key suppliers totimely deliver our components, parts or services, could cause our products or services to be produced ordelivered in an untimely or unsatisfactory manner.
‰ Third parties have claimed in the past and may claim in the future that we are infringing directly or indirectlyupon their intellectual property rights, and third parties may infringe upon our intellectual property rights.
‰ The outcome of litigation or arbitration in which we are involved is unpredictable and an adverse decision inany such matter could have a material adverse effect on our financial condition, results of operations and cashflows.
‰ We face certain significant risk exposures and potential liabilities that may not be covered adequately byinsurance or indemnity.
‰ Changes in our effective tax rate may have an adverse effect on our results of operations.‰ We have significant operations in locations that could be materially and adversely impacted in the event of a
natural disaster or other significant disruption.‰ Changes in the regulatory framework under which our managed satellite and terrestrial communications
solutions operations are operated could adversely affect our business, financial condition, results of operationsand cash flows.
49
‰ We rely on third parties to provide satellite bandwidth for our managed satellite and terrestrial communicationssolutions, and any bandwidth constraints could harm our business, financial condition, results of operations andcash flows.
‰ Changes in future business or other market conditions could cause business investments and/or recordedgoodwill or other long-term assets to become impaired, resulting in substantial losses and write-downs thatwould adversely affect our results of operations.
‰ We must attract and retain key employees, and failure to do so could seriously harm us.
ITEM 7A. QUANTITATIVE AND QUALITATIVE DISCLOSURES ABOUT MARKET RISK.
In the normal course of doing business, we are exposed to the risks associated with foreign currency exchangerates and changes in interest rates. We employ established policies and procedures governing the use of financialinstruments to manage our exposure to such risks. For a discussion of such policies and procedures and the relatedrisks, see “Financial Risk Management” in “Item 7. Management’s Discussion and Analysis of Financial Condition andResults of Operations” of this Report, which is incorporated by reference into this Item 7A.
50
ITEM 8. FINANCIAL STATEMENTS AND SUPPLEMENTARY DATA.
INDEX TO FINANCIAL STATEMENTS AND SUPPLEMENTARY DATAPage
MANAGEMENT’S REPORT ON INTERNAL CONTROLOVER FINANCIAL REPORTING
The management of Harris Corporation (the “Company”) is responsible for establishing and maintaining adequateinternal control over financial reporting as such term is defined in Rules 13a-15(f) and 15d-15(f) under the SecuritiesExchange Act of 1934, as amended. The Company’s internal control over financial reporting is designed to providereasonable assurance, based on an appropriate cost-benefit analysis, regarding the reliability of financial reporting andthe preparation of financial statements for external purposes in accordance with U.S. generally accepted accountingprinciples. The Company’s internal control over financial reporting includes those policies and procedures that:(i) pertain to the maintenance of records that, in reasonable detail, accurately and fairly reflect the transactions anddispositions of the assets of the Company; (ii) provide reasonable assurance that transactions are recorded as necessaryto permit preparation of financial statements in accordance with U.S. generally accepted accounting principles, and thatreceipts and expenditures of the Company are being made only in accordance with authorizations of management anddirectors of the Company; and (iii) provide reasonable assurance regarding prevention or timely detection ofunauthorized acquisition, use or disposition of the Company’s assets that could have a material effect on the financialstatements.
Because of its inherent limitations, internal control over financial reporting may not prevent or detectmisstatements. Therefore, even those systems determined to be effective can provide only reasonable assurance withrespect to financial statement preparation and presentation. Also, projections of any evaluation of effectiveness tofuture periods are subject to the risk that controls may become inadequate because of changes in conditions, or that thedegree of compliance with the policies or procedures may deteriorate.
Management, with the participation of our Chief Executive Officer and Chief Financial Officer, assessed theeffectiveness of the Company’s internal control over financial reporting as of June 27, 2014. In making thisassessment, management used the criteria set forth by the Committee of Sponsoring Organizations of the TreadwayCommission (COSO) in Internal Control — Integrated Framework (1992 framework). Based on management’sassessment and those criteria, management concluded that the Company maintained effective internal control overfinancial reporting as of June 27, 2014.
The Company’s independent registered certified public accounting firm, Ernst & Young LLP, has issued a reporton the effectiveness of the Company’s internal control over financial reporting. This report appears on page 54 of thisAnnual Report on Form 10-K.
52
REPORT OF INDEPENDENT REGISTERED CERTIFIED PUBLIC ACCOUNTING FIRM
The Board of Directors and Shareholders of Harris Corporation
We have audited the accompanying consolidated balance sheets of Harris Corporation as of June 27, 2014 andJune 28, 2013, and the related consolidated statements of income, comprehensive income, cash flows, and equity, foreach of the three fiscal years in the period ended June 27, 2014. Our audits also included the financial statementschedule listed in the Index at Item 15(2). These financial statements and schedule are the responsibility of theCompany’s management. Our responsibility is to express an opinion on these financial statements and schedule basedon our audits.
We conducted our audits in accordance with the standards of the Public Company Accounting Oversight Board(United States). Those standards require that we plan and perform the audit to obtain reasonable assurance aboutwhether the financial statements are free of material misstatement. An audit includes examining, on a test basis,evidence supporting the amounts and disclosures in the financial statements. An audit also includes assessing theaccounting principles used and significant estimates made by management, as well as evaluating the overall financialstatement presentation. We believe that our audits provide a reasonable basis for our opinion.
In our opinion, the financial statements referred to above present fairly, in all material respects, the consolidatedfinancial position of Harris Corporation at June 27, 2014 and June 28, 2013, and the consolidated results of itsoperations and its cash flows for each of the three fiscal years in the period ended June 27, 2014, in conformity withU.S. generally accepted accounting principles. Also, in our opinion, the related financial statement schedule, whenconsidered in relation to the basic financial statements taken as a whole, presents fairly in all material respects theinformation set forth therein.
We also have audited, in accordance with the standards of the Public Company Accounting Oversight Board(United States), Harris Corporation’s internal control over financial reporting as of June 27, 2014, based on criteriaestablished in Internal Control — Integrated Framework issued by the Committee of Sponsoring Organizations of theTreadway Commission (1992 framework) and our report dated August 25, 2014 expressed an unqualified opinionthereon.
/s/ ERNST & YOUNG LLP
Orlando, FloridaAugust 25, 2014
53
REPORT OF INDEPENDENT REGISTERED CERTIFIED PUBLIC ACCOUNTING FIRM
The Board of Directors and Shareholders of Harris Corporation
We have audited Harris Corporation’s internal control over financial reporting as of June 27, 2014, based oncriteria established in Internal Control — Integrated Framework issued by the Committee of Sponsoring Organizationsof the Treadway Commission (1992 framework) (the COSO criteria). Harris Corporation’s management is responsiblefor maintaining effective internal control over financial reporting, and for its assessment of the effectiveness of internalcontrol over financial reporting included in the accompanying Management’s Report on Internal Control OverFinancial Reporting. Our responsibility is to express an opinion on the company’s internal control over financialreporting based on our audit.
We conducted our audit in accordance with the standards of the Public Company Accounting Oversight Board(United States). Those standards require that we plan and perform the audit to obtain reasonable assurance aboutwhether effective internal control over financial reporting was maintained in all material respects. Our audit includedobtaining an understanding of internal control over financial reporting, assessing the risk that a material weaknessexists, testing and evaluating the design and operating effectiveness of internal control based on the assessed risk, andperforming such other procedures as we considered necessary in the circumstances. We believe that our audit providesa reasonable basis for our opinion.
A company’s internal control over financial reporting is a process designed to provide reasonable assuranceregarding the reliability of financial reporting and the preparation of financial statements for external purposes inaccordance with generally accepted accounting principles. A company’s internal control over financial reportingincludes those policies and procedures that (1) pertain to the maintenance of records that, in reasonable detail,accurately and fairly reflect the transactions and dispositions of the assets of the company; (2) provide reasonableassurance that transactions are recorded as necessary to permit preparation of financial statements in accordance withU.S. generally accepted accounting principles, and that receipts and expenditures of the company are being made onlyin accordance with authorizations of management and directors of the company; and (3) provide reasonable assuranceregarding prevention or timely detection of unauthorized acquisition, use, or disposition of the company’s assets thatcould have a material effect on the financial statements.
Because of its inherent limitations, internal control over financial reporting may not prevent or detectmisstatements. Also, projections of any evaluation of effectiveness to future periods are subject to the risk that controlsmay become inadequate because of changes in conditions, or that the degree of compliance with the policies orprocedures may deteriorate.
In our opinion, Harris Corporation maintained, in all material respects, effective internal control over financialreporting as of June 27, 2014, based on the COSO criteria.
We also have audited, in accordance with the standards of the Public Company Accounting Oversight Board(United States), the consolidated balance sheets of Harris Corporation as of June 27, 2014 and June 28, 2013, and therelated consolidated statements of income, comprehensive income, cash flows, and equity, for each of the three fiscalyears in the period ended June 27, 2014 of Harris Corporation and our report dated August 25, 2014 expressed anunqualified opinion thereon.
/s/ ERNST & YOUNG LLP
Orlando, FloridaAugust 25, 2014
54
CONSOLIDATED STATEMENT OF INCOMEFiscal Years Ended
2014 2013 2012(In millions, except per share amounts)
See accompanying Notes to Consolidated Financial Statements.
59
NOTES TO CONSOLIDATED FINANCIAL STATEMENTS
NOTE 1: SIGNIFICANT ACCOUNTING POLICIES
Principles of Consolidation — Our Consolidated Financial Statements include the accounts of HarrisCorporation and its consolidated subsidiaries. As used in these Notes to Consolidated Financial Statements (these“Notes”), the terms “Harris,” “Company,” “we,” “our” and “us” refer to Harris Corporation and its consolidatedsubsidiaries. Intracompany transactions and accounts have been eliminated.
See Note 3: Discontinued Operations for information regarding discontinued operations. Except for disclosuresrelated to our cash flows, or unless otherwise specified, disclosures in our Consolidated Financial Statements and theseNotes relate solely to our continuing operations.
At the beginning of the first quarter of fiscal 2014, to leverage the breadth of our information technology (“IT”)enterprise network and information assurance capabilities for the IT services market, we began managing our cybersecurity network testing operation as part of our Integrated Network Solutions segment rather than our GovernmentCommunications Systems segment. As a result, we reassigned $2.4 million of goodwill (determined on a relative fairvalue basis) to our Integrated Network Solutions segment from our Government Communications Systems segment.The historical results, discussion and presentation of our business segments as set forth in our Consolidated FinancialStatements and these Notes have been adjusted to reflect the impact of this change to our business segment reportingstructure for all periods presented in our Consolidated Financial Statements and these Notes.
Use of Estimates — Our Consolidated Financial Statements have been prepared in conformity withU.S. generally accepted accounting principles (“GAAP”) and require management to make estimates and assumptions.These estimates and assumptions affect the reported amounts of assets and liabilities and disclosure of contingentassets and liabilities at the date of the Consolidated Financial Statements and the reported amounts of revenue andexpenses during the reporting period. These estimates and assumptions are based on experience and other informationavailable prior to issuance of the Consolidated Financial Statements. Materially different results can occur ascircumstances change and additional information becomes known.
Fiscal Year — Our fiscal year ends on the Friday nearest June 30. Fiscal 2014, 2013 and 2012 each included52 weeks.
Cash and Cash Equivalents — Cash equivalents are temporary cash investments with a maturity of three orfewer months when purchased. These investments include accrued interest and are carried at the lower of cost ormarket.
Fair Value of Financial Instruments — The carrying amounts reflected in our Consolidated Balance Sheet forcash and cash equivalents, accounts receivable, non-current receivables, notes receivable, accounts payable and short-term debt approximate their fair values. Fair values for long-term debt are primarily based on quoted market prices forthose or similar instruments. See Note 22: Fair Value Measurements for additional information regarding fair valuesfor our long-term debt. A discussion of fair values for our derivative financial instruments is included under the caption“Financial Instruments and Risk Management” in this Note 1: Significant Accounting Policies.
Accounts Receivable — We record receivables at net realizable value and they generally do not bear interest.This value includes an allowance for estimated uncollectible accounts to reflect any loss anticipated on the accountsreceivable balances which is charged to the provision for doubtful accounts. We calculate this allowance based on ourhistory of write-offs, level of past due accounts and economic status of the customers. We consider a receivabledelinquent if it is unpaid after the term of the related invoice has expired. Write-offs are recorded at the time acustomer receivable is deemed uncollectible. See Note 5: Receivables for additional information regarding accountsreceivable.
Inventories — Inventories are valued at the lower of cost (determined by average and first-in, first-out methods)or market. We regularly review inventory quantities on hand and record a provision for excess and obsolete inventoryprimarily based on our estimated forecast of product demand, anticipated end of product life and productionrequirements. See Note 6: Inventories for additional information regarding inventories.
Property, Plant and Equipment — Property, plant and equipment are carried on the basis of cost and includesoftware capitalized for internal use. Depreciation of buildings, machinery and equipment is computed by the straight-lineand accelerated methods. The estimated useful lives of buildings, including leasehold improvements, generally rangebetween 2 and 45 years. The estimated useful lives of machinery and equipment generally range between 2 and 10 years.Amortization of internal-use software begins when the software is put into service and is based on the expected useful lifeof the software. The useful lives over which we amortize internal-use software generally range between 3 and 7 years. SeeNote 7: Property, Plant and Equipment for additional information regarding property, plant and equipment.
60
NOTES TO CONSOLIDATED FINANCIAL STATEMENTS (Continued)
Goodwill — Goodwill is not amortized. We perform annual (or under certain circumstances, more frequent)impairment tests of our goodwill using a two-step process. The first step is to identify potential impairment bycomparing the fair value of each of our reporting units with its net book value, including goodwill, adjusted forallocations of corporate assets and liabilities as appropriate. If the fair value of a reporting unit exceeds its adjusted netbook value, goodwill of the reporting unit is considered not impaired and the second step of the impairment test isunnecessary. If the adjusted net book value of a reporting unit exceeds its fair value, the second step of the goodwillimpairment test compares the implied fair value of the reporting unit’s goodwill with the carrying amount of thatgoodwill. If the carrying amount of the reporting unit’s goodwill exceeds the implied fair value of that goodwill, animpairment loss is recognized in an amount equal to that excess. The implied fair value of goodwill is determined inthe same manner as the amount of goodwill recognized in a business combination. The fair value of the reporting unitis allocated to all of the assets and liabilities of that unit, including any unrecognized intangible assets, as if thereporting unit had been acquired in a business combination and the fair value of the reporting unit was the purchaseprice paid to acquire the reporting unit. See Note 8: Goodwill and Note 3: Discontinued Operations for additionalinformation regarding goodwill.
Long-Lived Assets, Including Finite-Lived Intangible Assets — Long-lived assets, including finite-livedintangible assets, are amortized on a straight-line basis over their useful lives. We assess the recoverability of thecarrying value of our long-lived assets, including finite-lived intangible assets, whenever events or changes incircumstances indicate the carrying amount of the assets may not be recoverable. We evaluate the recoverability ofsuch assets based on the expectations of undiscounted cash flows from such assets. If the sum of the expected futureundiscounted cash flows were less than the carrying amount of the asset, a loss would be recognized for the differencebetween the fair value and the carrying amount. See Note 7: Property, Plant and Equipment and Note 9: IntangibleAssets for additional information regarding long-lived assets and intangible assets.
In the fourth quarter of fiscal 2013, we recorded impairment charges totaling $34.7 million related to long-livedassets. These included an impairment in our Integrated Network Solutions segment related to intangible assets recordedin connection with our acquisition of Carefx Corporation (“Carefx”) in the fourth quarter of fiscal 2011, primarilyresulting from a shift in strategy away from Carefx’s legacy products; an impairment in our Integrated NetworkSolutions segment related to an IT services contract vehicle, primarily based on impacts of sequestration and a newrule incorporated into the contract vehicle limiting bid opportunities for large businesses; and an impairment of otherCompany-owned assets based on recent market indications.
Other Assets and Liabilities — No assets within the “Other current assets” line item in our Consolidated BalanceSheet exceeded 5 percent of our total current assets as of June 27, 2014 or June 28, 2013. No assets within the “Othernon-current assets” line item in our Consolidated Balance Sheet exceeded 5 percent of our total assets as of June 27,2014 or June 28, 2013. No accrued liabilities or expenses within the “Other accrued items” or “Other long-termliabilities” line items in our Consolidated Balance Sheet exceeded 5 percent of our total current liabilities or totalliabilities, respectively, as of June 27, 2014 or June 28, 2013.
Income Taxes — We follow the liability method of accounting for income taxes. We record the estimated futuretax effects of temporary differences between the tax basis of assets and liabilities and amounts reported in ourConsolidated Balance Sheet, as well as operating loss and tax credit carryforwards. We follow very specific anddetailed guidelines in each tax jurisdiction regarding the recoverability of any tax assets recorded on the balance sheetand provide necessary valuation allowances as required. We regularly review our deferred tax assets for recoverabilitybased on historical taxable income, projected future taxable income, the expected timing of the reversals of existingtemporary differences and tax planning strategies. See Note 21: Income Taxes for additional information regardingincome taxes.
Warranties — On development and production contract sales in our Government Communications Systemssegment and in our Integrated Network Solutions segment, the value or price of our warranty is generally included inthe contract and funded by the customer. A provision for warranties is built into the estimated program costs whendetermining the profit rate to accrue when applying the cost-to-cost percentage-of-completion revenue recognitionmethod. Warranty costs, as incurred, are charged to the specific program’s cost, and both revenue and cost arerecognized at that time. Factors that affect the estimated program cost for warranties include terms of the contract,complexity of the delivered product or service, number of installed units, historical experience and management’sassumptions regarding anticipated rates of warranty claims and cost per claim.
61
NOTES TO CONSOLIDATED FINANCIAL STATEMENTS (Continued)
On product sales in all our segments, we provide for future standard warranty costs upon product delivery. Thespecific terms and conditions of those warranties vary depending on the product sold, customer and country in whichwe do business. In the case of products sold by us, our warranties start from the shipment, delivery or customeracceptance date and continue as follows:
Segment Warranty Periods
RF Communications One to five years
Integrated Network Solutions Less than one year to five years
Government Communications Systems One to two years
Because our products are manufactured, in many cases, to customer specifications and their acceptance is basedon meeting those specifications, we historically have experienced minimal warranty costs. Factors that affect ourwarranty liability include the number of installed units, historical experience, anticipated delays in delivery of productsto end customers, in-country support for international sales and management’s assumptions regarding anticipated ratesof warranty claims and cost per claim. We assess the adequacy of our recorded warranty liabilities every quarter andmake adjustments to the liability as necessary. See Note 10: Accrued Warranties for additional information regardingwarranties.
Foreign Currency Translation — The functional currency for most international subsidiaries is the localcurrency. Assets and liabilities are translated at current rates of exchange and income and expense items are translatedat the weighted average exchange rate for the year. The resulting translation adjustments are recorded as a separatecomponent of shareholders’ equity.
Stock Options and Other Share-Based Compensation — We measure compensation cost for all share-basedpayments (including employee stock options) at fair value and recognize cost over the vesting period. It is our practiceto issue shares when options are exercised. See Note 14: Stock Options and Other Share-Based Compensation foradditional information regarding share-based compensation.
Restructuring Costs — We record restructuring charges for sales or terminations of product lines, closures orrelocations of business activities, changes in management structure, and fundamental reorganizations that affect thenature and focus of operations. Such costs include one-time termination benefits, contract termination costs and coststo consolidate facilities or relocate employees. We record these charges at their fair value when incurred. In caseswhere employees are required to render service until they are terminated in order to receive the termination benefitsand will be retained beyond the minimum retention period, we record the expense ratably over the future serviceperiod. These charges are included as a component of the “Cost of product sales” and “Engineering, selling andadministrative expenses” line items in our Consolidated Statement of Income.
In connection with Company-wide restructuring and other actions in the fourth quarter of fiscal 2013 to alignresources with our business outlook and challenging fiscal environment, we incurred restructuring costs, net ofgovernment cost reimbursement, of $16.6 million for workforce reductions (including severance and other employee-related exit costs) and $12.1 million for facility consolidation. This resulted in charges of $9.2 million, $0.4 million,$6.5 million and $12.6 million in our RF Communications, Integrated Network Solutions and GovernmentCommunications Systems segments and at our corporate headquarters, respectively. As of the end of fiscal 2013, wehad recorded liabilities of $26.0 million associated with these restructuring actions, of which the majority was paidduring fiscal 2014.
Revenue Recognition — Our segments have the following revenue recognition policies:
Development and Production Contracts: Estimates and assumptions, and changes therein, are important inconnection with, among others, our segments’ revenue recognition policies related to development and productioncontracts. Revenue and profits related to development and production contracts are recognized using the percentage-of-completion method, generally based on the ratio of costs incurred to estimated total costs at completion (i.e., the cost-to-cost method) with consideration given for risk of performance and estimated profit. Revenue and profits on cost-reimbursable development and production contracts are recognized as allowable costs are incurred on the contract, andbecome billable to the customer, in an amount equal to the allowable costs plus the profit on those costs.
Development and production contracts are combined when specific aggregation criteria are met. Criteria generallyinclude closely interrelated activities performed for a single customer within the same economic environment.Development and production contracts are generally not segmented. If development and production contracts aresegmented, we have determined that they meet specific segmenting criteria. Change orders, claims or other items thatmay change the scope of a development and production contract are included in contract value only when the value can
62
NOTES TO CONSOLIDATED FINANCIAL STATEMENTS (Continued)
be reliably estimated and realization is probable. Possible incentives or penalties and award fees applicable toperformance on development and production contracts are considered in estimating contract value and profit rates andare recorded when there is sufficient information to assess anticipated contract performance. Incentive provisions thatincrease earnings based solely on a single significant event are generally not recognized until the event occurs.
Under the percentage-of-completion method of accounting, a single estimated total profit margin is used torecognize profit for each development and production contract over its period of performance. Recognition of profit ondevelopment and production fixed-price contracts requires estimates of the total cost at completion and themeasurement of progress toward completion. The estimated profit or loss on a development and production contract isequal to the difference between the estimated contract value and the estimated total cost at completion. Due to the long-term nature of many of our programs, developing the estimated total cost at completion often requires judgment.Factors that must be considered in estimating the cost of the work to be completed include the nature and complexity ofthe work to be performed, subcontractor performance, the risk and impact of delayed performance, availability andtiming of funding from the customer and the recoverability of any claims outside the original development andproduction contract included in the estimate to complete. At the outset of each contract, we gauge its complexity andperceived risks and establish an estimated total cost at completion in line with these expectations. After establishing theestimated total cost at completion, we follow a standard Estimate at Completion (“EAC”) process in whichmanagement reviews the progress and performance on our ongoing development and production contracts at leastquarterly and, in many cases, more frequently. If we successfully retire risks associated with the technical, scheduleand cost aspects of a contract, we may lower our estimated total cost at completion commensurate with the retirementof these risks. Conversely, if we are not successful in retiring these risks, we may increase our estimated total cost atcompletion. Additionally, at the outset of a cost-reimbursable contract (for example, contracts containing award orincentive fees), we establish an estimate of total contract value, or revenue, based on our expectation of performance onthe contract. As the cost-reimbursable contract progresses, our estimates of total contract value may increase ordecrease if, for example, we receive higher or lower than expected award fees. When adjustments in estimated totalcosts at completion or in estimates of total contract value are determined, the related impact to operating income isrecognized using the cumulative catch-up method, which recognizes in the current period the cumulative effect of suchadjustments for all prior periods. Anticipated losses on development and production contracts or programs in progressare charged to operating income when identified. Net EAC adjustments resulting from changes in estimates favorablyimpacted our operating income by $53.3 million ($.33 per diluted share) in fiscal 2014, $47.1 million ($.29 per dilutedshare) in fiscal 2013 and $38.4 million ($.20 per diluted share) in fiscal 2012.
Products and Services Other Than Development and Production Contracts: Revenue from product sales otherthan development and production contracts and revenue from service arrangements are recognized when persuasiveevidence of an arrangement exists, the fee is fixed or determinable, collectibility is reasonably assured, and delivery ofa product has occurred and title has transferred or services have been rendered. Unearned income on service contractsis amortized by the straight-line method over the term of the contracts. Also, if contractual obligations related tocustomer acceptance exist, revenue is not recognized for a product or service unless these obligations are satisfied.
Multiple-Element Arrangements: We have entered into arrangements other than development and productioncontracts that require the delivery or performance of multiple deliverables or elements under a bundled sale. Thesearrangements are most prevalent in our RF Communications and Integrated Network Solutions segments. For example,in our RF Communications segment, in addition to delivering secure tactical radios and accessories, we may berequired to perform or provide installation, design and development solutions for custom communicationinfrastructures, and extended warranties. In our Integrated Network Solutions segment, the deliverables to our maritimecustomers may include satellite bandwidth services (voice, data and internet), terrestrial circuits, equipment,installation, and network operations center and other support services.
For arrangements with multiple elements, judgment is required to determine the appropriate accounting, includingwhether the individual deliverables represent separate units of accounting for revenue recognition purposes, and thetiming of revenue recognition for each deliverable. We recognize revenue for contractual deliverables as separate unitsof accounting when the delivered items have value to the customer on a standalone basis (i.e., if they are soldseparately by any vendor or the customer could resell the delivered items on a standalone basis) and, if the arrangementincludes a general right of return relative to the delivered items, we consider delivery or performance of theundelivered items as probable and substantially in our control.
Deliverables that are not separable are accounted for as a combined unit of accounting, and revenue generally isrecognized when persuasive evidence of an arrangement exists, the fee is fixed or determinable, collectibility isreasonably assured, and delivery of a product has occurred and title has transferred or services have been rendered. If we
63
NOTES TO CONSOLIDATED FINANCIAL STATEMENTS (Continued)
determine that the deliverables represent separate units of accounting, we recognize the revenue associated with each unitof accounting separately, and contract revenue is allocated among the separate units of accounting at the inception of thearrangement based on relative selling price. If options or change orders materially change the scope of work or price of thecontract subsequent to inception, we reevaluate and adjust our prior conclusions regarding units of accounting andallocation of contract revenue as necessary. The allocation of selling price among the separate units of accounting mayimpact the timing of revenue recognition, but will not change the total revenue recognized on the arrangement. Weestablish the selling price used for each deliverable based on the vendor-specific objective evidence (“VSOE”) of sellingprice, or third-party evidence (“TPE”) of selling price if VSOE of selling price is not available, or best estimate of sellingprice (“BESP”) if neither VSOE of selling price nor TPE of selling price is available. In determining VSOE of sellingprice, a substantial majority of the recent standalone sales of the deliverable must be priced within a relatively narrowrange. In determining TPE of selling price, we evaluate competitor prices for similar deliverables when sold separately.Generally, comparable pricing of our products to those of our competitors with similar functionality cannot be obtained.In determining BESP, we consider both market data and entity-specific factors, including market conditions, thegeographies in which our products are sold, our competitive position and strategy, and our profit objectives.
Bill-and-Hold Arrangements: Certain contracts include terms and conditions through which we recognizerevenue upon completion of equipment production, which is subsequently stored at our location at the customer’srequest. Revenue is recognized on such contracts upon the customer’s assumption of title and risk of ownership andwhen collectibility is reasonably assured. At the time of revenue recognition, there is a schedule of delivery of theproduct consistent with the customer’s business practices, the product has been separated from our inventory, and wedo not have any remaining performance obligations such that the earnings process is not complete.
Other: Net income or expense related to intellectual property matters is included as a component of the “Non-operating income (loss)” line item in our Consolidated Statement of Income and is recognized on the basis of termsspecified in contractual agreements. Shipping and handling fees billed to customers are included in the “Revenue fromproduct sales” line item in our Consolidated Statement of Income and the associated costs are included in the “Cost ofproduct sales” line item in our Consolidated Statement of Income. Also, we record taxes collected from customers andremitted to governmental authorities on a net basis in that they are excluded from revenues.
Retirement and Post-Employment Benefits — As of June 27, 2014, we provide retirement benefits tosubstantially all U.S.-based employees primarily through a defined contribution retirement plan that includes a 401(k)plan and certain non-qualified deferred compensation plans. The defined contribution retirement plan has matching andsavings elements. Contributions by us to the retirement plan are based on employees’ savings with no other fundingrequirements. We may make additional contributions to the retirement plan at our discretion. Retirement and post-employment benefits also include a defined benefit plan in the United Kingdom that is closed to new participants andan unfunded limited healthcare plan for U.S.-based retirees and employees on long-term disability. We estimatebenefits for these plans using actuarial valuations that are based in part on certain key assumptions we make, includingthe discount rate, the expected long-term rate of return on plan assets, the rates of increase in future compensationlevels, healthcare cost trend rates and employee turnover and mortality, each as appropriate based on the nature of theplans. We accrue the cost of these benefits during an employee’s active service life, except in the case of our healthcareplan for disabled employees, the costs of which we accrue when the disabling event occurs.
Retirement and post-employment benefit expenses amounted to $46.6 million in fiscal 2014, $49.8 million infiscal 2013 and $47.4 million in fiscal 2012.
Environmental Expenditures — We capitalize environmental expenditures that increase the life or efficiency ofproperty or that reduce or prevent environmental contamination. We accrue environmental expenses resulting fromexisting conditions that relate to past operations when the costs are probable and reasonably estimable.
We are named as a potentially responsible party at 14 sites where future liabilities could exist. These sites include1 site owned by us, 9 sites associated with our former graphics, broadcast communications or semiconductor locations,and 4 treatment or disposal sites not owned by us that contain hazardous substances allegedly attributable to us frompast operations. Based on an assessment of relevant factors, we have estimated that our discounted liability under theComprehensive Environmental Response, Compensation and Liability Act (commonly known as the “Superfund Act”)and other environmental statutes and regulations for identified sites, using an 8.5 percent discount rate, isapproximately $5.1 million. The current portion of this liability is included in the “Other accrued items” line item andthe non-current portion is included in the “Other long-term liabilities” line item in our Consolidated Balance Sheet. Theestimated aggregate undiscounted amount that will be incurred over the next 10 years is approximately $7.7 million.The estimated payments for the next five years are approximately $0.8 million per year, and the aggregate amountthereafter is approximately $3.6 million. The relevant factors we considered in estimating our potential liabilities under
64
NOTES TO CONSOLIDATED FINANCIAL STATEMENTS (Continued)
the Superfund Act and other environmental statutes and regulations include cost-sharing agreements with other partiesand potential indemnification from successor and predecessor owners of these sites. We do not believe that anyuncertainties regarding these relevant factors will materially affect our potential liability under the Superfund Act andother environmental statutes and regulations.
Financial Guarantees and Commercial Commitments — Financial guarantees are contingent commitmentsissued to guarantee the performance of a customer to a third party in borrowing arrangements, such as commercialpaper issuances, bond financings and similar transactions. As of June 27, 2014, there were no such contingentcommitments accrued for in our Consolidated Balance Sheet.
We have entered into commercial commitments in the normal course of business including surety bonds, standbyletter of credit agreements and other arrangements with financial institutions and customers primarily relating to theguarantee of future performance on certain contracts to provide products and services to customers and to obtaininsurance policies with our insurance carriers. As of June 27, 2014, we had total commercial commitments, includingperformance guarantees, of $727.4 million.
Financial Instruments and Risk Management — In the normal course of doing business, we are exposed toglobal market risks, including the effect of changes in foreign currency exchange rates. We use derivative instrumentsto manage our exposure to such risks and formally document all relationships between hedging instruments and hedgeditems, as well as the risk-management objective and strategy for undertaking hedge transactions. We recognize allderivatives in our Consolidated Balance Sheet at fair value. Derivatives that are not hedges must be adjusted to fairvalue through income. If the derivative is a hedge, depending on the nature of the hedge, changes in the fair value ofthe derivative are either offset against the change in fair value of assets, liabilities or firm commitments throughearnings or recognized in other comprehensive income until the hedged item is recognized in earnings. The ineffectiveportion of a derivative’s change in fair value is immediately recognized in earnings. We do not hold or issuederivatives for trading purposes. See Note 19: Derivative Instruments and Hedging Activities for additional informationregarding our use of derivative instruments.
Income From Continuing Operations Per Share — For all periods presented in our Consolidated FinancialStatements and these Notes, income from continuing operations per share is computed using the two-class method. Thetwo-class method of computing income from continuing operations per share is an earnings allocation formula thatdetermines income from continuing operations per share for common stock and any participating securities accordingto dividends paid and participation rights in undistributed earnings. Our restricted stock awards and restricted stockunit awards meet the definition of participating securities and are included in the computations of income fromcontinuing operations per basic and diluted common share. Our performance share awards and performance share unitawards do not meet the definition of participating securities because they do not contain rights to receive nonforfeitabledividends and, therefore, are excluded from the computations of income from continuing operations per basic anddiluted common share. Under the two-class method, income from continuing operations per common share iscomputed by dividing the sum of earnings distributed to common shareholders and undistributed earnings allocated tocommon shareholders by the weighted average number of common shares outstanding for the period. Income fromcontinuing operations per diluted common share is computed using the more dilutive of the two-class method or thetreasury stock method. In applying the two-class method, undistributed earnings are allocated to both common sharesand participating securities based on the weighted average shares outstanding during the period. See Note 15: IncomeFrom Continuing Operations Per Share for additional information.
NOTE 2: ACCOUNTING CHANGES OR RECENT ACCOUNTING PRONOUNCEMENTS
Adoption of New Accounting StandardsIn the first quarter of fiscal 2014, we adopted an accounting standard issued by the Financial Accounting
Standards Board (“FASB”) that requires entities to provide details of reclassifications in the disclosure of changes inaccumulated other comprehensive income (“AOCI”) balances. In addition, for significant items reclassified out ofAOCI in the fiscal quarter, entities must provide information about the effects on net income together, in one location,on the face of the statement where net income is presented, or as a separate disclosure in the notes. For items notreclassified to net income in their entirety in the fiscal quarter, entities must cross-reference to the note whereadditional details about the effects of the reclassifications are disclosed. The adoption of this update did not impact ourfinancial position, results of operations or cash flows.
Accounting Standards Issued But Not Yet EffectiveIn March 2013, the FASB issued an accounting standards update that clarifies previous U.S. GAAP regarding the
release of cumulative translation adjustment (“CTA”) into earnings in certain situations. When an entity ceases to have
65
NOTES TO CONSOLIDATED FINANCIAL STATEMENTS (Continued)
a controlling financial interest in a subsidiary or group of assets within a consolidated foreign entity and the sale ortransfer of such subsidiary or group of assets results in the complete or substantially complete liquidation of suchforeign entity, any related CTA should be reclassified from AOCI and included in the calculation of the gain or loss onthe sale or transfer. Upon a sale or complete or substantially complete liquidation of an investment in a consolidatedforeign entity that results in either (1) a loss of a controlling financial interest in the foreign entity or (2) an acquirerobtaining control of an acquiree in which the acquirer held an equity interest immediately before the acquisition date ina business combination achieved in stages, any related CTA should be reclassified from AOCI and included in thecalculation of the gain or loss on the sale or liquidation. For a sale of part of an ownership interest in a foreigninvestment that is accounted for as an equity method investment, a pro rata portion of CTA attributable to thatinvestment should be reclassified from AOCI and included in the calculation of the gain or loss on the sale. Thisstandard is to be applied prospectively and is effective for fiscal years, and interim reporting periods within those years,beginning after December 15, 2013, which for us is our fiscal 2015. The adoption of this standard will not have amaterial impact on our financial position, results of operations or cash flows.
In July 2013, the FASB issued an accounting standards update that requires unrecognized tax benefits to bepresented as a decrease in a net operating loss, similar tax loss or tax credit carryforward if certain criteria are met. Thisstandard is to be applied prospectively and is effective for fiscal years, and interim reporting periods within those years,beginning after December 15, 2013, which for us is our fiscal 2015. Retrospective application is permitted. Theadoption of this standard is not expected to have a material impact on our financial position, results of operations orcash flows.
In April 2014, the FASB issued an accounting standards update that raises the threshold for disposals to qualify asdiscontinued operations and allows companies to have significant continuing involvement and continuing cash flowswith discontinued operations. This standard also requires additional disclosures for discontinued operations and newdisclosures for individually material disposal transactions that do not meet the definition of a discontinued operation.This standard is to be applied prospectively and is effective for fiscal years, and interim reporting periods within thoseyears, beginning after December 15, 2014, which for us is our fiscal 2016. Early adoption is permitted, but only fordisposals (or classifications as held for sale) that have not been reported in financial statements previously issued oravailable for issuance. The adoption of this standard is not expected to have a material impact on our financial position,results of operations or cash flows.
In May 2014, the FASB issued a comprehensive new revenue recognition standard that supersedes nearly allrevenue recognition guidance under U.S. GAAP and International Financial Reporting Standards and supersedes somecost guidance for construction-type and production-type contracts. The guidance in this standard is principles-based,and accordingly, entities will be required to use more judgment and make more estimates than under prior guidance,including identifying contract performance obligations, estimating variable consideration to include in the contractprice and allocating the transaction price to separate performance obligations. The guidance in this standard isapplicable to all contracts with customers, regardless of industry-specific or transaction-specific fact patterns.Additionally, this standard provides guidance for transactions that were not previously addressed comprehensively(e.g., service revenue, contract modifications, and licenses of intellectual property) and modifies guidance for multiple-element arrangements. The core principle of this standard is that entities should recognize revenue to depict the transferof promised goods or services to customers in an amount that reflects the consideration to which the entity expects tobe entitled in exchange for those goods and services. To help financial statement users better understand the nature,amount, timing and potential uncertainty of the revenue that is recognized, this standard requires significantly moreinterim and annual disclosures. This standard allows for either “full retrospective” adoption (application to all periodspresented) or “modified retrospective” adoption (application to only the most current period presented in the financialstatements, as well as certain additional required footnote disclosures). This standard is effective for fiscal years, andinterim reporting periods within those years, beginning after December 15, 2016, which for us is our fiscal 2018. Weare currently evaluating the impact this standard will have on our financial position, results of operations and cashflows.
NOTE 3: DISCONTINUED OPERATIONS
In the third quarter of fiscal 2012, our Board of Directors approved a plan to exit our cyber integrated solutionsoperation (“CIS”), which provided remote cloud hosting, and to dispose of the related assets, and we reported CIS asdiscontinued operations beginning with our financial results presented in our Quarterly Report on Form 10-Q for thethird quarter of fiscal 2012. On August 27, 2013, we completed the sale of the remaining assets of CIS for $35 million,including $28 million in cash and a $7 million subordinated promissory note. In the fourth quarter of fiscal 2012, ourBoard of Directors approved a plan to divest our broadcast communications operation (“Broadcast Communications”),
66
NOTES TO CONSOLIDATED FINANCIAL STATEMENTS (Continued)
which provided digital media management solutions in support of broadcast customers, and we reported BroadcastCommunications as discontinued operations beginning with our financial results presented in our Annual Report onForm 10-K for fiscal 2012. On February 4, 2013, we completed the sale of Broadcast Communications to an affiliate ofThe Gores Group, LLC pursuant to a definitive Asset Sale Agreement entered into December 5, 2012 for $225 million,including $160 million in cash, subject to customary adjustments (including a post-closing working capital adjustment,which is currently in litigation), a $15 million subordinated promissory note (which was collected in fiscal 2014) andan earnout of up to $50 million based on future performance. Should the litigation related to the post-closing workingcapital adjustment to the purchase price be resolved unfavorably to us, we believe such an outcome would not have amaterial adverse effect on our financial condition, results of operations or cash flows. Both CIS and BroadcastCommunications were formerly part of our Integrated Network Solutions segment.
Discontinued operations in fiscal 2014 consisted of an $18.0 million ($6.9 million after-tax) increase in the loss onsale of Broadcast Communications from miscellaneous adjustments for contingencies related to the disposition, and a$3.1 million ($1.9 million after-tax) gain on sale of the remaining assets of CIS. In fiscal 2014, the $9.9 milliondiscontinued operations tax benefit included a $4.8 million tax benefit recorded in the third quarter of fiscal 2014,primarily related to the realization of additional tax deductions in respect of Broadcast Communications on variousfiscal 2013 tax returns compared with our recorded estimates at the end of fiscal 2013. Discontinued operations infiscal 2013 included a loss of $32.7 million ($32.2 million after-tax) on the sale of Broadcast Communications in thethird quarter of fiscal 2013, as well as non-cash impairment charges totaling $314.4 million ($297.3 million after-tax)recorded during the first two quarters of fiscal 2013 related to Broadcast Communications based on indicators of value,including financial performance, market conditions, indications of value from interested parties and our entering into adefinitive Asset Sale Agreement relating to the sale of Broadcast Communications. Additionally, based on marketindications during fiscal 2013, we recorded non-cash impairment charges totaling $16.5 million ($10.1 million after-tax) to write down assets of CIS to their estimated fair value, less estimated costs to sell.
Summarized financial information for our discontinued operations related to CIS and Broadcast Communicationsis as follows:
Loss on sale of discontinued operations, net of income tax benefit of $9.9million and $.5 million in fiscal 2014 and 2013, respectively . . . . . . . . . . . . . (5.0) (32.2) —
Net unrealized gain on hedging derivatives, net of income taxes . . . . . . . . . . . . . . . . . . . . . 0.2 0.8
Unamortized loss on treasury lock, net of income taxes . . . . . . . . . . . . . . . . . . . . . . . . . . . (1.9) (2.4)
Unrecognized post-retirement obligations, net of income taxes of $9.5 million and $15.8million at June 27, 2014 and June 28, 2013, respectively . . . . . . . . . . . . . . . . . . . . . . . . (19.8) (29.8)
$(14.9) $(58.6)
(1) Reclassifications out of accumulated other comprehensive loss to earnings were not material for fiscal 2014 or 2013.
67
NOTES TO CONSOLIDATED FINANCIAL STATEMENTS (Continued)
Unbilled costs and accrued earnings on fixed-price contracts were net of progress payments of $100.7 million atJune 27, 2014 and $145.3 million at June 28, 2013.
NOTE 7: PROPERTY, PLANT AND EQUIPMENT
Property, plant and equipment are summarized below:
Depreciation and amortization expense related to property, plant and equipment was $142.1 million,$146.4 million and $143.0 million in fiscal 2014, 2013 and 2012, respectively.
NOTE 8: GOODWILL
Goodwill is not amortized. We perform annual (or under certain circumstances, more frequent) impairment testsof our goodwill.
68
NOTES TO CONSOLIDATED FINANCIAL STATEMENTS (Continued)
Changes in the carrying amount of goodwill for the fiscal years ended June 27, 2014 and June 28, 2013, bybusiness segment, were as follows:
The balances shown for our Integrated Network Solutions and Government Communications Systems segmentsreflect that we reassigned $2.4 million of goodwill (determined on a relative fair value basis) to our Integrated NetworkSolutions segment from our Government Communications Systems segment in connection with our transition at thebeginning of the first quarter of fiscal 2014 in managing our cyber security network testing operation as part of ourIntegrated Network Solutions segment rather than our Government Communications Systems segment, as described inNote 1: Significant Accounting Policies.
NOTE 9: INTANGIBLE ASSETS
We assess the recoverability of the carrying value of our long-lived assets, including intangible assets with finiteuseful lives, whenever events or changes in circumstances indicate the carrying amount of the assets may not berecoverable.
In the fourth quarter of fiscal 2013, we recorded impairment charges totaling $16.7 million in our IntegratedNetwork Solutions segment related to intangible assets recorded in connection with our acquisition of Carefx in thefourth quarter of fiscal 2011, primarily resulting from a shift in strategy away from Carefx’s legacy products. The$16.7 million of impairment charges were comprised of $5.4 million, $4.8 million, $5.4 million and $1.1 million forintangible assets related to customer relationships, developed technologies, contract backlog and trade names,respectively. Additionally, in the fourth quarter of fiscal 2013, we recorded a $12.3 million impairment charge in ourIntegrated Network Solutions segment related to an IT services contract vehicle (included in the “Other” intangibleasset category in the table above), primarily based on impacts of sequestration and a new rule incorporated into thecontract vehicle limiting bid opportunities for large businesses.
Amortization expense related to intangible assets was $59.3 million, $74.5 million and $78.6 million in fiscal2014, 2013 and 2012, respectively.
69
NOTES TO CONSOLIDATED FINANCIAL STATEMENTS (Continued)
Future estimated amortization expense for intangible assets is as follows:Total
Changes in our liability for standard product warranties, which is included as a component of the “Other accrueditems” and “Other long-term liabilities” line items in our Consolidated Balance Sheet, during fiscal 2014 and 2013,were as follows:
We also sell extended product warranties and recognize revenue from these arrangements over the warrantyperiod. Costs of warranty services under these arrangements are recognized as incurred. Deferred revenue associatedwith extended product warranties at June 27, 2014 and June 28, 2013 was $38.9 million and $34.6 million,respectively, and is included within the “Advance payments and unearned income” and “Other long-term liabilities”line items in our Consolidated Balance Sheet.
NOTE 11: CREDIT ARRANGEMENTS
2012 Credit Agreement: On September 28, 2012, we established a new $1 billion 5-year senior unsecuredrevolving credit facility (the “2012 Credit Facility”) by entering into a Revolving Credit Agreement (the “2012 CreditAgreement”) with a syndicate of lenders that replaced our prior credit facilities.
The 2012 Credit Agreement provides for the extension of credit to us in the form of revolving loans, includingswingline loans, and letters of credit, at any time and from time to time during the term of the 2012 Credit Agreement, inan aggregate principal amount at any time outstanding not to exceed $1 billion for both revolving loans and letters ofcredit, with a sub-limit of $70 million for swingline loans and a sub-limit of $175 million for letters of credit. The 2012Credit Agreement includes a provision pursuant to which, from time to time, we may request that the lenders in theirdiscretion increase the maximum amount of commitments under the 2012 Credit Agreement by an amount not to exceed$500 million. Only consenting lenders (including new lenders reasonably acceptable to the administrative agent) willparticipate in any such increase. In no event will the maximum amount of credit extensions available under the 2012Credit Agreement exceed $1.5 billion. The proceeds of loans or letters of credit borrowings under the 2012 CreditAgreement are restricted from being used for hostile acquisitions (as defined in the 2012 Credit Agreement) or for anypurpose in contravention of applicable laws. We are not otherwise restricted under the 2012 Credit Agreement from usingthe proceeds of loans or letters of credit borrowings under the 2012 Credit Agreement for working capital and othergeneral corporate purposes or from using the 2012 Credit Facility to support commercial paper issued by us from time totime. Borrowings under the 2012 Credit Agreement may be denominated in U.S. Dollars, Euros, Sterling and any othercurrency acceptable to the administrative agent and the lenders, with a non-U.S. currency sub-limit of $200 million. The2012 Credit Agreement provides that we may designate certain wholly owned subsidiaries as borrowers under the 2012Credit Agreement, and the obligations of any such subsidiary borrower must be guaranteed by Harris Corporation. The
70
NOTES TO CONSOLIDATED FINANCIAL STATEMENTS (Continued)
2012 Credit Agreement also provides that we may designate certain subsidiaries as unrestricted subsidiaries, which meanscertain of the representations and covenants in the 2012 Credit Agreement do not apply in respect of such subsidiaries.
At our election, borrowings under the 2012 Credit Agreement denominated in U.S. Dollars will bear interest eitherat (i) the eurocurrency rate for the applicable interest period plus an applicable margin, or (ii) the base rate plus anapplicable margin. The eurocurrency rate for an interest period is the rate per annum equal to (a) the London interbankoffered rate (“LIBOR”) for such interest period, divided by (b) a percentage equal to 1.00 minus the daily averageeurocurrency reserve rate for such interest period. The applicable interest rate margin over the eurocurrency rate isinitially equal to 1.125%, but may increase (to a maximum amount of 1.500%) or decrease (to a minimum amount of0.875%) based on changes in the ratings of our senior unsecured long-term debt securities (“Senior Debt Ratings”).The base rate is a fluctuating rate per annum equal to the highest of (i) the federal funds rate plus 0.50%, (ii) SunTrustBank’s publicly announced prime lending rate for U.S. Dollars, or (iii) the eurrocurrency rate determined on a dailybasis for a one-month interest period plus 100 basis points. The applicable interest rate margin over the base rate isinitially equal to 0.125%, but may increase (to a maximum amount of 0.500%) or decrease (to a minimum amount of0.000%) based on changes in our Senior Debt Ratings. Borrowings under the 2012 Credit Agreement denominated in acurrency other than U.S. Dollars will bear interest at the eurocurrency rate for the applicable interest period plus anapplicable margin, as described above, plus, in some cases, mandatory costs. Letter of credit fees are also determinedbased on our Senior Debt Ratings.
In addition to interest payable on the principal amount of indebtedness outstanding from time to time under the2012 Credit Agreement and letter of credit fees, we are required to pay a quarterly unused commitment fee, whichaccrues at an applicable rate per annum multiplied by the actual daily amount of the lenders’ aggregate unusedcommitments under the 2012 Credit Agreement. The applicable rate per annum for the unused commitment fee isinitially equal to 0.125%, but may increase (to a maximum amount of 0.200%) or decrease (to a minimum amount of0.080%) based on changes in our Senior Debt Ratings.
The 2012 Credit Agreement contains certain customary representations and certain customary covenants,including covenants limiting: certain liens on assets; certain mergers, consolidations or sales of assets; certain sale andleaseback transactions; certain vendor financing investments; and certain investments in unrestricted subsidiaries; and acovenant requiring that we not permit our ratio of consolidated total indebtedness to total capital, each as defined in the2012 Credit Agreement, to be greater than 0.60 to 1.00 at any time. We were in compliance with the covenants in the2012 Credit Agreement at June 27, 2014. The 2012 Credit Agreement contains certain events of default, including:failure to make payments; failure to perform or observe terms, covenants or agreements; material inaccuracy of anyrepresentation or warranty; payment default under other indebtedness with a principal amount in excess of$100 million or acceleration of or ability to accelerate such other indebtedness; occurrence of one or more finaljudgments or orders for the payment of money in excess of $100 million that remain unsatisfied; incurrence of certainERISA liability in excess of $100 million; any bankruptcy or insolvency; invalidity of 2012 Credit Agreementdocumentation; or a change of control (as defined in the 2012 Credit Agreement, including if a person or groupbecomes the beneficial owner of 25 percent or more of our voting stock). If an event of default occurs, then the lendersmay, among other things, terminate their commitments and declare all outstanding borrowings to be immediately dueand payable together with accrued interest and fees. All principal amounts borrowed or outstanding under the 2012Credit Agreement are due on September 28, 2017, unless the commitments are terminated earlier either at our requestor if certain events of default occur. At June 27, 2014, we had no borrowings outstanding under the 2012 CreditAgreement, but we had $30 million of short-term debt outstanding under our commercial paper program that wassupported by the 2012 Credit Facility.
Other: We have an automatically effective, universal shelf registration statement, filed with the SEC onFebruary 27, 2013, related to the potential future issuance of an indeterminate amount of securities, including debtsecurities, preferred stock, common stock, fractional interests in preferred stock represented by depositary shares andwarrants to purchase debt securities, preferred stock or common stock.
NOTE 12: SHORT-TERM DEBT
Our short-term debt at June 27, 2014 and June 28, 2013 was $58.3 million and $144.6 million, respectively. Theweighted-average interest rate for our short-term debt was 2.8 percent at June 27, 2014 and 0.8 percent at June 28,2013.
71
NOTES TO CONSOLIDATED FINANCIAL STATEMENTS (Continued)
The potential maturities of long-term debt, including the current portion, for the five years following fiscal 2014and, in total, thereafter are: $1.4 million in fiscal 2015; none in fiscal 2016; none in fiscal 2017; $400.0 million in fiscal2018; $350.0 million in fiscal 2019; and $825.8 million thereafter. All of our outstanding long-term debt isunsubordinated and unsecured with equal ranking.
On December 5, 2007, we completed the issuance of $400 million in aggregate principal amount of 5.95% Notesdue December 1, 2017. Interest on the notes is payable on June 1 and December 1 of each year. We may redeem thenotes at any time in whole or, from time to time, in part at the “make-whole” redemption price. The “make-whole”redemption price is equal to the greater of 100 percent of the principal amount of the notes being redeemed or the sumof the present values of the remaining scheduled payments of the principal and interest (other than interest accruing tothe date of redemption) on the notes being redeemed, discounted to the redemption date on a semi-annual basis(assuming a 360-day year consisting of twelve 30-day months) at the Treasury Rate, as defined, plus 30 basis points. Ineach case, we will pay accrued interest on the principal amount of the notes being redeemed to the redemption date. Inaddition, upon a change of control combined with a below-investment-grade rating event, we may be required to makean offer to repurchase the notes at a price equal to 101 percent of the aggregate principal amount of the notesrepurchased, plus accrued interest on the notes repurchased to the date of repurchase. In conjunction with the issuanceof the notes, we entered into treasury lock agreements to protect against fluctuations in forecasted interest paymentsresulting from the issuance of 10-year, fixed-rate debt due to changes in the benchmark U.S. Treasury rate. Theseagreements were determined to be highly effective in offsetting changes in forecasted interest payments as a result ofchanges in the benchmark U.S. Treasury rate. Upon termination of these agreements on December 6, 2007, werecorded a loss of $5.5 million, net of income tax, in shareholders’ equity as a component of accumulated othercomprehensive income. This loss, along with $5.0 million in debt issuance costs, is being amortized on a straight-linebasis over the life of the notes, which approximates the effective interest rate method, and is reflected as a portion ofinterest expense in our Consolidated Statement of Income.
On June 9, 2009, we completed the issuance of $350 million in aggregate principal amount of 6.375% Notes dueJune 15, 2019. Interest on the notes is payable on June 15 and December 15 of each year. We may redeem the notes atany time in whole or, from time to time, in part at the “make-whole” redemption price. The “make-whole” redemptionprice is equal to the greater of 100 percent of the principal amount of the notes being redeemed or the sum of thepresent values of the remaining scheduled payments of the principal and interest (other than interest accruing to thedate of redemption) on the notes being redeemed, discounted to the redemption date on a semi-annual basis (assuminga 360-day year consisting of twelve 30-day months) at the Treasury Rate, as defined, plus 37.5 basis points. In eachcase, we will pay accrued interest on the principal amount of the notes being redeemed to the redemption date. Inaddition, upon a change of control combined with a below-investment-grade rating event, we may be required to makean offer to repurchase the notes at a price equal to 101 percent of the aggregate principal amount of the notesrepurchased, plus accrued interest on the notes repurchased to the date of repurchase. We incurred $4.1 million in debtissuance costs and discounts related to the issuance of the notes, which are being amortized on a straight-line basis overthe life of the notes, which approximates the effective interest rate method, and are reflected as a portion of interestexpense in our Consolidated Statement of Income.
72
NOTES TO CONSOLIDATED FINANCIAL STATEMENTS (Continued)
On December 3, 2010, we completed the issuance of $400 million in aggregate principal amount of 4.4% Notesdue December 15, 2020 (the “2020 Notes”) and $300 million in aggregate principal amount of 6.15% Notes dueDecember 15, 2040 (the “2040 Notes”). Interest on each of the 2020 Notes and the 2040 Notes is payable semi-annually in arrears on June 15 and December 15 of each year. We may redeem the 2020 Notes and/or the 2040 Notes atany time in whole or, from time to time, in part at the applicable “make-whole” redemption price. The applicable“make-whole” redemption price is equal to the greater of 100 percent of the principal amount of the notes beingredeemed or the sum of the present values of the remaining scheduled payments of the principal and interest (otherthan interest accruing to the date of redemption) on the notes being redeemed, discounted to the redemption date on asemi-annual basis (assuming a 360-day year consisting of twelve 30-day months) at the Treasury Rate, as defined, plus25 basis points in the case of the 2020 Notes and 35 basis points in the case of the 2040 Notes. In each case, we willpay accrued interest on the principal amount of the notes being redeemed to the redemption date. In addition, upon achange of control combined with a below-investment-grade rating event, we may be required to make an offer torepurchase the notes at a price equal to 101 percent of the aggregate principal amount of the notes repurchased, plusaccrued interest on the notes repurchased to the date of repurchase. We incurred $5.5 million and $4.8 million in debtissuance costs and discounts related to the issuance of the 2020 Notes and 2040 Notes, respectively, which are beingamortized on a straight-line basis over the respective lives of the notes, which approximates the effective interest ratemethod, and are reflected as a portion of interest expense in our Consolidated Statement of Income.
In January 1996, we completed the issuance of $100 million in aggregate principal amount of 7.0% Debenturesdue January 15, 2026. The debentures are not redeemable prior to maturity.
In February 1998, we completed the issuance of $150 million in aggregate principal amount of 6.35% Debenturesdue February 1, 2028. On December 5, 2007, we repurchased and retired $25.0 million in aggregate principal amountof the debentures. On February 1, 2008, we redeemed $99.2 million in aggregate principal amount of the debenturespursuant to the procedures for redemption at the option of the holders of the debentures. We may redeem the remaining$25.8 million in aggregate principal amount of the debentures in whole, or in part, at any time at a pre-determinedredemption price.
NOTE 14: STOCK OPTIONS AND OTHER SHARE-BASED COMPENSATION
As of June 27, 2014, we had two shareholder-approved employee stock incentive plans (“SIPs”), including theHarris Corporation 2005 Equity Incentive Plan (As Amended and Restated Effective August 27, 2010) (“RestatedEIP”), under which options or other share-based compensation was outstanding, and we have granted the followingtypes of share-based awards under these SIPs: stock options, performance share awards, performance share unitawards, restricted stock awards and restricted stock unit awards. We believe that such awards more closely align theinterests of employees with those of shareholders. Certain share-based awards provide for accelerated vesting if there isa change in control (as defined under our SIPs).
Summary of Share-Based Compensation ExpenseThe following table summarizes the amounts and classification of share-based compensation expense:
Compensation cost related to share-based compensation arrangements that was capitalized as part of inventory orfixed assets in fiscal 2014, 2013 and 2012 was not material.
Shares of common stock remaining available for future issuance under our SIPs totaled 10,474,951 as of June 27,2014. In fiscal 2014, we issued an aggregate of 3,144,685 shares of common stock under the terms of our SIPs, whichis net of shares withheld for tax purposes.
73
NOTES TO CONSOLIDATED FINANCIAL STATEMENTS (Continued)
Stock OptionsThe following information relates to stock options that have been granted under shareholder-approved SIPs.
Option exercise prices are equal to or greater than the fair market value of our common stock on the date the optionsare granted, using the closing stock price of our common stock. Options may be exercised for a period set at the time ofgrant, which generally ranges from seven to ten years after the date of grant, and they generally become exercisable ininstallments, which are typically 33.3 percent one year from the grant date, 33.3 percent two years from the grant dateand 33.3 percent three years from the grant date.
The fair value as of the grant date of each option award was determined using the Black-Scholes-Merton option-pricing model which uses assumptions noted in the following table. Expected volatility is based on implied volatilityfrom traded options on our common stock and the historical volatility of our stock price over the expected term of theoptions. The expected term of the options is based on historical observations of our common stock over the past tenyears, considering average years to exercise for all options exercised, average years to cancellation for all optionscancelled and average years remaining for outstanding options, which is calculated based on the weighted-averagevesting period plus the weighted-average of the difference between the vesting period and average years to exerciseand cancellation. The risk-free interest rate for periods within the contractual life of the option is based on theU.S. Treasury yield curve in effect at the time of grant.
A summary of the significant assumptions used in determining the fair value of stock option grants under our SIPsis as follows:
Stock options outstanding at June 27, 2014 . . . . . . . . 3,873,644 $47.13 7.66 $111.76
Stock options exercisable at June 27, 2014 . . . . . . . . 1,455,342 $41.42 6.19 $ 50.30
The weighted-average grant-date fair value was $12.40 per share, $10.32 per share and $9.44 per share for optionsgranted during fiscal 2014, 2013 and 2012, respectively. The total intrinsic value of options exercised during fiscal2014, 2013 and 2012 was $51.0 million, $28.9 million and $16.2 million, respectively, at the time of exercise.
A summary of the status of our nonvested stock options at June 27, 2014 and changes during fiscal 2014 is asfollows:
NOTES TO CONSOLIDATED FINANCIAL STATEMENTS (Continued)
As of June 27, 2014, there was $27.2 million of total unrecognized compensation cost related to nonvested stockoptions granted under our SIPs. This cost is expected to be recognized over a weighted-average period of 1.54 years.The total fair value of stock options that vested during fiscal 2014, 2013 and 2012 was approximately $16.1 million,$22.7 million and $17.8 million, respectively.
Restricted Stock and Restricted Stock Unit AwardsThe following information relates to awards of restricted stock and restricted stock units that have been granted to
employees under our Restated EIP. The restricted stock and restricted stock units are not transferable until vested andthe restrictions lapse upon the achievement of continued employment over a specified time period.
The fair value as of the grant date of each restricted stock or restricted stock unit award is based on the closingprice of our common stock on the date of grant and is amortized to compensation expense over the vesting period. AtJune 27, 2014, there were 3,750 shares of restricted stock and 685,106 restricted stock units outstanding, all of whichwere payable in shares.
A summary of the status of our restricted stock and restricted stock units at June 27, 2014 and changes duringfiscal 2014 is as follows:
Shares
Weighted-AverageGrantPrice
Per Share
Restricted stock and restricted stock units outstanding at June 28, 2013 . . . . . . . . . . . 723,514 $42.29
Restricted stock and restricted stock units outstanding at June 27, 2014 . . . . . . . . . . . 688,856 $48.95
As of June 27, 2014, there was $16.2 million of total unrecognized compensation cost related to restricted stockand restricted stock unit awards under our Restated EIP. This cost is expected to be recognized over a weighted-average period of 1.27 years. The weighted-average grant date price per share of restricted stock and per unit ofrestricted stock units granted during fiscal 2014, 2013 and 2012 was $61.39, $46.54 and $37.67, respectively. The totalfair value of restricted stock and restricted stock units that vested during fiscal 2014, 2013 and 2012 was approximately$12.3 million, $11.4 million and $6.0 million, respectively.
Performance Share and Performance Share Unit AwardsThe following information relates to awards of performance shares and performance share units that have been
granted to employees under our Restated EIP. Generally, performance share and performance share unit awards aresubject to performance criteria such as meeting predetermined operating income and return on invested capital targets(and market conditions, such as total shareholder return, for such awards granted beginning in fiscal 2011) for a 3-yearperformance period. These awards also generally vest at the expiration of the same 3-year period. The finaldetermination of the number of shares to be issued in respect of an award is made by our Board of Directors or acommittee of our Board of Directors.
The fair value as of the grant date of each performance share or performance share unit award was determinedbased on a fair value from a multifactor Monte Carlo valuation model that simulates our stock price and totalshareholder return (“TSR”) relative to other companies in our TSR peer group, less a discount to reflect the delay inpayments of cash dividend-equivalents that are made only upon vesting. The fair value of each performance share orperformance share unit award is amortized to compensation expense over the vesting period if achievement of theperformance measures is considered probable. At June 27, 2014, there were no performance shares outstanding, andthere were 811,323 performance share units outstanding, all of which were payable in shares.
75
NOTES TO CONSOLIDATED FINANCIAL STATEMENTS (Continued)
A summary of the status of our performance shares and performance share units at June 27, 2014 and changesduring fiscal 2014 is as follows:
Shares
Weighted-AverageGrantPrice
Per Share
Performance shares and performance share units outstanding at June 28, 2013 . . . . . . 721,972 $43.03
As of June 27, 2014, there was $17.1 million of total unrecognized compensation cost related to performanceshare and performance share unit awards under our Restated EIP. This cost is expected to be recognized over aweighted-average period of 1.24 years. The weighted-average grant date price per share of performance shares and perunit of performance share units granted during fiscal 2014, 2013 and 2012 was $59.17, $45.92 and $37.56,respectively. The total fair value of performance shares and performance share units that vested during fiscal 2014,2013 and 2012 was approximately $3.5 million, $17.9 million and $17.2 million, respectively.
NOTE 15: INCOME FROM CONTINUING OPERATIONS PER SHARE
The computations of income from continuing operations per share are as follows (in this Note 15, “income fromcontinuing operations” refers to income from continuing operations attributable to Harris Corporation commonshareholders):
Income from continuing operations per basic common share (A)/(B) . . . . . . . . . . . . . . . . . . $ 5.05 $ 4.19 $ 4.83
Income from continuing operations per diluted common share (A)/(C) . . . . . . . . . . . . . . . . . $ 5.00 $ 4.16 $ 4.80
Potential dilutive common shares primarily consist of employee stock options and performance share andperformance share unit awards. Employee stock options to purchase approximately 651,904, 3,164,450 and 5,151,746shares of our common stock were outstanding at the end of fiscal 2014, 2013 and 2012, respectively, but were notincluded as dilutive stock options in the computations of income from continuing operations per diluted common sharebecause the effect would have been antidilutive.
NOTE 16: RESEARCH AND DEVELOPMENT
Company-sponsored research and development costs are expensed as incurred. These costs were $264.1 million,$254.1 million and $218.9 million in fiscal 2014, 2013 and 2012, respectively, and are included in the “Engineering,selling and administrative expenses” line item in our Consolidated Statement of Income. These costs in fiscal 2013included a $17.8 million write-off of capitalized software in our Integrated Network Solutions segment as a result of achange in accounting estimate. Customer-sponsored research and development costs are incurred pursuant tocontractual arrangements, principally U.S. Government-sponsored contracts requiring us to provide a product orservice meeting certain defined performance or other specifications (such as designs), and are accounted for principallyby the cost-to-cost percentage-of-completion method. Customer-sponsored research and development is included in ourrevenue and cost of product sales and services.
76
NOTES TO CONSOLIDATED FINANCIAL STATEMENTS (Continued)
NOTE 17: INTEREST EXPENSE
Total interest expense was $93.6 million, $109.1 million and $113.2 million in fiscal 2014, 2013 and 2012,respectively. Interest paid was $92.6 million, $109.9 million and $109.6 million in fiscal 2014, 2013 and 2012,respectively.
NOTE 18: LEASE COMMITMENTS
Total rental expense amounted to $48.3 million, $48.2 million and $47.9 million in fiscal 2014, 2013 and 2012,respectively. Future minimum rental commitments under leases with an initial lease term in excess of one year,primarily for land and buildings, amounted to approximately $221.0 million at June 27, 2014. These commitments forthe five years following fiscal 2014 and, in total, thereafter are: fiscal 2015 — $45.4 million; fiscal 2016— $37.8 million; fiscal 2017 — $31.6 million; fiscal 2018 — $21.1 million; fiscal 2019 — $16.7 million; and$68.4 million thereafter. These commitments do not contain any material rent escalations, rent holidays, contingentrent, rent concessions, leasehold improvement incentives or unusual provisions or conditions. We do not consider anyof these individual leases material to our operations. Leasehold improvements made either at the inception of the leaseor during the lease term are amortized over the current lease term, or estimated life, if shorter.
NOTE 19: DERIVATIVE INSTRUMENTS AND HEDGING ACTIVITIES
In the normal course of doing business, we are exposed to global market risks, including the effect of changes inforeign currency exchange rates. We use derivative instruments to manage our exposure to such risks and formallydocument all relationships between hedging instruments and hedged items, as well as the risk-management objectiveand strategy for undertaking hedge transactions. We recognize all derivatives in our Consolidated Balance Sheet at fairvalue. We do not hold or issue derivatives for trading purposes.
At June 27, 2014, we had open foreign currency forward contracts with a notional amount of $155.7 million, ofwhich $119.6 million were classified as fair value hedges and $36.1 million were classified as cash flow hedges. Thiscompares with open foreign currency forward contracts with a notional amount of $58.5 million at June 28, 2013, ofwhich $47.7 million were classified as fair value hedges and $10.8 million were classified as cash flow hedges. AtJune 27, 2014, contract expiration dates ranged from less than 1 month to 12 months, with a weighted average contractlife of 2 months.
Balance Sheet HedgesTo manage the exposure in our balance sheet to risks from changes in foreign currency exchange rates, we
implement fair value hedges. More specifically, we use foreign currency forward contracts and options to hedge certainbalance sheet items, including foreign currency denominated accounts receivable and inventory. Changes in the valueof the derivatives and the related hedged items are reflected in earnings, in the “Cost of product sales” line item in ourConsolidated Statement of Income. As of June 27, 2014, we had outstanding foreign currency forward contractsdenominated in the British Pound, Norwegian Krone, Singapore Dollar, Mexican Peso, Euro and Australian Dollar tohedge certain balance sheet items. The net gains or losses on foreign currency forward contracts designated as fairvalue hedges were not material in fiscal 2014, 2013 or 2012. In addition, no amounts were recognized in earnings infiscal 2014, 2013 or 2012 related to hedged firm commitments that no longer qualify as fair value hedges.
Cash Flow HedgesTo manage our exposure to currency risk and market fluctuation risk associated with anticipated cash flows that
are probable of occurring in the future, we implement cash flow hedges. More specifically, we use foreign currencyforward contracts and options to hedge off-balance sheet future foreign currency commitments, including purchasecommitments to suppliers, future committed sales to customers and intersegment transactions. These derivatives arebeing used to hedge currency exposures from cash flows anticipated across our business segments. We also havehedged U.S. Dollar payments to suppliers to maintain our anticipated profit margins in our international operations. Asof June 27, 2014, we had outstanding foreign currency forward contracts denominated in the Brazilian Real, BritishPound, Australian Dollar and Canadian Dollar to hedge certain forecasted transactions.
These derivatives have only nominal intrinsic value at the time of purchase and have a high degree of correlationto the anticipated cash flows they are designated to hedge. Hedge effectiveness is determined by the correlation of theanticipated cash flows from the hedging instruments and the anticipated cash flows from the future foreign currencycommitments through the maturity dates of the derivatives used to hedge these cash flows. These financial instrumentsare marked-to-market using forward prices and fair value quotes with the offset to other comprehensive income, net of
77
NOTES TO CONSOLIDATED FINANCIAL STATEMENTS (Continued)
hedge ineffectiveness. Gains and losses from other comprehensive income are reclassified to earnings when the relatedhedged item is recognized in earnings. The ineffective portion of a derivative’s change in fair value is immediatelyrecognized in earnings. The cash flow impact of our derivatives is included in the same category in our ConsolidatedStatement of Cash Flows as the cash flows of the related hedged items.
The net gains or losses from cash flow hedges recognized in earnings or recorded in other comprehensive income,including gains or losses related to hedge ineffectiveness, were not material in fiscal 2014, 2013 or 2012. We do notexpect the net gains or losses recognized in the “Accumulated other comprehensive loss” line item in our ConsolidatedBalance Sheet as of June 27, 2014 that will be reclassified to earnings from other comprehensive income within thenext 12 months to be material.
Credit RiskWe are exposed to the risk of credit losses from non-performance by counterparties to the financial instruments
discussed above, but we do not expect any of the counterparties to fail to meet their obligations. To manage creditrisks, we select counterparties based on credit ratings, limit our exposure to any single counterparty under definedguidelines and monitor the market position with each counterparty.
See Note 22: Fair Value Measurements for the amount of the assets and liabilities related to the foreign currencyforward contracts in our Consolidated Balance Sheet as of June 27, 2014, and see our Consolidated Statement ofComprehensive Income for additional information on changes in accumulated other comprehensive loss for the threefiscal years ended June 27, 2014.
NOTE 20: NON-OPERATING INCOME (LOSS)
The components of non-operating income (loss) were as follows:2014 2013 2012
(1) The loss in fiscal 2013 reflected a charge associated with our optional redemption on May 28, 2013 of the entire outstanding $300 millionprincipal amount of our 5% Notes due October 1, 2015.
NOTE 21: INCOME TAXES
The provisions for current and deferred income taxes are summarized as follows:2014 2013 2012
State and local income taxes allocable to certain U.S. Government contracts are included in our operatingexpenses and, therefore, are not included in our provision for income taxes. We have made no provision for U.S.income taxes on $266.6 million of undistributed earnings of international subsidiaries because of our intention toreinvest those earnings indefinitely. Determination of unrecognized deferred U.S. tax liability for the undistributedearnings of international subsidiaries is not practicable. Tax loss and credit carryforwards as of June 27, 2014 haveexpiration dates ranging between one year and no expiration in certain instances. The amount of Federal, international,and state and local tax loss carryforwards as of June 27, 2014 were $29.2 million, $89.5 million and $7.6 million,respectively. Income (loss) from continuing operations before income taxes of international subsidiaries was $59.2million, $3.9 million and $15.2 million in fiscal 2014, 2013 and 2012, respectively. Income taxes paid were $194.1million, $212.9 million and $205.2 million in fiscal 2014, 2013 and 2012, respectively. The valuation allowancedecreased $5.9 million from $74.1 million at the end of fiscal 2013 to $68.2 million at the end of fiscal 2014. Thevaluation allowance has been established for financial reporting purposes to offset certain domestic and foreigndeferred tax assets due to uncertainty regarding our ability to realize them in the future.
79
NOTES TO CONSOLIDATED FINANCIAL STATEMENTS (Continued)
A reconciliation of the beginning and ending amounts of unrecognized tax benefits is as follows:
As of June 27, 2014, we had $71.9 million of unrecognized tax benefits, of which $58.3 million would favorablyimpact our future tax rates in the event that the tax benefits are eventually recognized. As of June 28, 2013, we had$73.5 million of unrecognized tax benefits, of which $43.3 million would favorably impact our future tax rates in theevent that the tax benefits are eventually recognized.
We recognize accrued interest and penalties related to unrecognized tax benefits as part of our income taxexpense. We had accrued $12.8 million for the potential payment of interest and penalties as of June 27, 2014 (and thisamount was not included in the $71.9 million of unrecognized tax benefits balance at June 27, 2014 shown above) and$10.7 million of this total could favorably impact future tax rates. We had accrued $11.3 million for the potentialpayment of interest and penalties as of June 28, 2013 (and this amount was not included in the $73.5 million ofunrecognized tax benefits balance at June 28, 2013 shown above) and $9.0 million of this total could favorably impactfuture tax rates.
We file numerous separate and consolidated income tax returns reporting our financial results and, whereappropriate, those of our subsidiaries and affiliates, in the U.S. Federal jurisdiction, and various state, local and foreignjurisdictions. Pursuant to the Compliance Assurance Process, the Internal Revenue Service (“IRS”) is examining fiscal2010, fiscal 2011, fiscal 2012, fiscal 2013, fiscal 2014 and fiscal 2015. We are currently under examination by theCanadian Revenue Agency for fiscal years 2007 through 2010, and we are appealing portions of a Canadian assessmentrelating to fiscal years 2000 through 2006. We are currently under examination or contesting proposed adjustments byvarious state and international tax authorities for fiscal years ranging from 1997 through 2012. It is reasonably possiblethat there could be a significant decrease or increase to our unrecognized tax benefit balance during the course of thenext twelve months as these examinations continue, other tax examinations commence or various statutes of limitationsexpire. An estimate of the range of possible changes cannot be made because of the significant number of jurisdictionsin which we do business and the number of open tax periods.
NOTE 22: FAIR VALUE MEASUREMENTS
Fair value is defined as the price that would be received to sell an asset or paid to transfer a liability in theprincipal market (or most advantageous market, in the absence of a principal market) for the asset or liability in anorderly transaction between market participants at the measurement date. Entities are required to maximize the use ofobservable inputs and minimize the use of unobservable inputs in measuring fair value, and to utilize a three-level fairvalue hierarchy that prioritizes the inputs used to measure fair value. The three levels of inputs used to measure fairvalue are as follows:
‰ Level 1 — Quoted prices in active markets for identical assets or liabilities.
‰ Level 2 — Observable inputs other than quoted prices included within Level 1, including quoted prices forsimilar assets or liabilities in active markets; quoted prices for identical or similar assets or liabilities in marketsthat are not active; and inputs other than quoted prices that are observable or are derived principally from, orcorroborated by, observable market data by correlation or other means.
‰ Level 3 — Unobservable inputs that are supported by little or no market activity, are significant to the fair valueof the assets or liabilities, and reflect our own assumptions about the assumptions market participants would usein pricing the asset or liability developed using the best information available in the circumstances.
80
NOTES TO CONSOLIDATED FINANCIAL STATEMENTS (Continued)
The following table presents the fair value hierarchy of our assets and liabilities measured at fair value on arecurring basis (at least annually) as of June 27, 2014:
(1) Represents investments held in a Rabbi Trust associated with our non-qualified deferred compensation plans, which we include in the “Othercurrent assets” and “Other non-current assets” line items in our Consolidated Balance Sheet.
(2) Represents investments related to our defined benefit plan in the United Kingdom, which we include in the “Other non-current assets” line itemin our Consolidated Balance Sheet.
(3) Includes derivatives designated as hedging instruments, which we include in the “Other current assets” line item in our Consolidated BalanceSheet. The fair value of these contracts was measured using a market approach based on quoted foreign currency forward exchange rates forcontracts with similar maturities.
(4) Primarily represents obligations to pay benefits under certain non-qualified deferred compensation plans, which we include in the “Compensationand benefits” and “Other long-term liabilities” line items in our Consolidated Balance Sheet. Under these plans, participants designate investmentoptions (including money market, stock and fixed-income funds), which serve as the basis for measurement of the notional value of theiraccounts.
(5) Includes derivatives designated as hedging instruments, which we include in the “Other accrued items” line item in our Consolidated BalanceSheet. The fair value of these contracts was measured using a market approach based on quoted foreign currency forward exchange rates forcontracts with similar maturities.
The following table presents the carrying amounts and estimated fair values of our significant financialinstruments that were not measured at fair value (carrying amounts of other financial instruments not listed in the tablebelow approximate fair value due to the short-term nature of those items):
(1) The fair value was estimated using a market approach based on quoted market prices for our debt traded in the secondary market. If our long-term debt in our balance sheet were measured at fair value, it would be categorized in Level 2 of the fair value hierarchy.
NOTE 23: BUSINESS SEGMENTS
We structure our operations primarily around the products and services we sell and the markets we serve, and wereport the financial results of our operations in the following three reportable operating or business segments — RFCommunications, Integrated Network Solutions and Government Communications Systems. Our RF Communicationssegment is a global supplier of secure tactical radio communications and high-grade encryption solutions for military,government and commercial customers and also of secure communications systems and equipment for public safety,utility and transportation customers. Our Integrated Network Solutions segment provides government, energy,maritime and healthcare customers with integrated communications and IT and services, including mission-criticalend-to-end IT services, managed satellite and terrestrial communications solutions and standards-based healthcareinteroperability solutions. Our Government Communications Systems segment conducts advanced research and
81
NOTES TO CONSOLIDATED FINANCIAL STATEMENTS (Continued)
develops, produces, integrates and supports advanced communications and information systems that solve the mission-critical challenges of our civilian, intelligence and defense government customers worldwide, primarily the U.S.Government. Each business segment is comprised of multiple program areas and product and service lines thataggregate into such business segment.
See Note 3: Discontinued Operations for information regarding discontinued operations. Except for disclosuresrelated to our cash flows, or unless otherwise specified, disclosures in our Consolidated Financial Statements and theseNotes relate solely to our continuing operations.
As discussed in Note 1: Significant Accounting Policies, at the beginning of the first quarter of fiscal 2014, toleverage the breadth of our IT enterprise network and information assurance capabilities for the IT Services market, webegan managing our cyber security network testing operation as part of our Integrated Network Solutions segmentrather than our Government Communications Systems segment. The historical results, discussion and presentation ofour business segments as set forth in this Report have been adjusted to reflect the impact of this change to our businesssegment reporting structure for all periods presented in this Report.
The accounting policies of our business segments are the same as those described in Note 1: SignificantAccounting Policies. We evaluate each segment’s performance based on its operating income or loss, which we defineas profit or loss from operations before income taxes excluding interest income and expense, royalties and relatedintellectual property expenses, equity method investment income or loss and gains or losses from securities and otherinvestments. Intersegment sales are generally transferred at cost to the buying segment and the sourcing segmentrecognizes a profit that is eliminated. The “Corporate eliminations” line items in the tables below represent theelimination of intersegment sales and their related profits. The “Unallocated corporate expense” line item in the tablesbelow represents the portion of corporate expenses not allocated to our business segments.
Our products and systems are produced principally in the United States with international revenue derivedprimarily from exports. No revenue earned from any individual foreign country exceeded 3 percent of our total revenueduring fiscal 2014, 2013 or 2012.
Sales made to U.S. Government customers, including the DoD and intelligence and civilian agencies, as well asforeign military sales funded through the U.S. Government, whether directly or through prime contractors, by allsegments as a percentage of total revenue were 67 percent, 67 percent and 70 percent in fiscal 2014, 2013 and 2012,respectively. Revenue from services in fiscal 2014 was approximately 8 percent, 97 percent and 18 percent of totalrevenue in our RF Communications, Integrated Network Solutions and Government Communications Systemssegments, respectively.
82
NOTES TO CONSOLIDATED FINANCIAL STATEMENTS (Continued)
Selected information by business segment and geographical area is summarized below:2014 2013 2012
Corporate assets consisted primarily of cash, income taxes receivable, deferred income taxes, deferredcompensation plan investments, buildings and equipment. Depreciation and amortization included intangible assets,capitalized software and debt issuance costs amortization of $62.2 million, $77.8 million and $82.2 million in fiscal2014, 2013 and 2012, respectively.
Export revenue was $1.06 billion, $892.1 million and $955.8 million in fiscal 2014, 2013 and 2012, respectively.Fiscal 2014 export revenue and revenue from international operations was principally from Europe, Asia, the MiddleEast, Africa, Australia, and Canada. Fiscal 2014 long-lived assets from international operations were principally in theUnited Kingdom, which had $30.3 million of long-lived assets as of June 27, 2014.
Segment revenue, segment operating income and a reconciliation of segment operating income to total incomefrom continuing operations before income taxes follow:
(1) “Non-operating income (loss)” includes equity method investment income (loss); income (expense) related to intellectual property matters; gainsand losses on sales of investments, securities available-for-sale and prepayment of long-term debt; and impairments of investments and securitiesavailable-for-sale. Additional information regarding non-operating income (loss) is set forth in Note 20: Non-Operating Income (Loss).
(2) Income from continuing operations before income taxes included a $126.7 million charge, net of government cost reimbursement, for Company-wide restructuring and other actions, including prepayment of long-term debt, asset impairments, a write-off of capitalized software, facilityconsolidation, workforce reductions and other associated costs. This resulted in charges of $9.2 million, $52.5 million, $10.5 million and$21.3 million in our RF Communications, Integrated Network Solutions and Government Communications Systems segments and at ourcorporate headquarters, respectively, and $33.2 million (related to prepayment of long-term debt) in “Non-operating income (loss).”
(3) The operating income in our Integrated Network Solutions segment included a $58.2 million charge for integration and other costs associatedwith our acquisitions of CapRock Holdings, Inc. and its subsidiaries, including CapRock Communications, Inc., Schlumberger group’s GlobalConnectivity Services business and Carefx.
NOTE 24: LEGAL PROCEEDINGS AND CONTINGENCIES
From time to time, as a normal incident of the nature and kind of businesses in which we are, and were, engaged,various claims or charges are asserted and litigation or arbitration is commenced by or against us arising from orrelated to matters, including but not limited to: product liability; personal injury; patents, trademarks, trade secrets orother intellectual property; labor and employee disputes; commercial or contractual disputes; strategic acquisitions ordivestitures; the prior sale or use of former products allegedly containing asbestos or other restricted materials; breachof warranty; or environmental matters. Claimed amounts against us may be substantial but may not bear any reasonablerelationship to the merits of the claim or the extent of any real risk of court or arbitral awards. We record accruals forlosses related to those matters against us that we consider to be probable and that can be reasonably estimated. Gaincontingencies, if any, are recognized when they are realized and legal costs generally are expensed when incurred. AtJune 27, 2014, our accrual for the potential resolution of lawsuits, claims or proceedings that we consider probable ofbeing decided unfavorably to us is not material. Although it is not feasible to predict the outcome of these matters withcertainty, it is reasonably possible that some lawsuits, claims or proceedings may be disposed of or decidedunfavorably to us and in excess of the amounts currently accrued. Based on available information, in the opinion ofmanagement, settlements, arbitration awards and final judgments, if any, which are considered probable of beingrendered against us in litigation or arbitration in existence at June 27, 2014 are reserved against or would not have amaterial adverse effect on our financial condition, results of operations or cash flows.
Our tax filings are subject to audit by taxing authorities in jurisdictions where we conduct business. These auditsmay result in assessments of additional taxes that are subsequently resolved with the authorities or ultimately throughestablished legal proceedings. We believe we have adequately accrued for any ultimate amounts that are likely to resultfrom these audits; however, final assessments, if any, could be different from the amounts recorded in our ConsolidatedFinancial Statements. Additional information regarding audits and examinations by taxing authorities of our tax filingsis set forth in Note 21: Income Taxes.
84
SUPPLEMENTARY FINANCIAL INFORMATION
QUARTERLY FINANCIAL DATA (UNAUDITED)
Selected quarterly financial data is summarized below:
(1) For this line item, “income from continuing operations” refers to income from continuing operations attributable to Harris Corporation commonshareholders.
85
(2) For this line item, “net income” refers to net income attributable to Harris Corporation common shareholders.
(3) Discontinued operations, net of income taxes included a $213.1 million after-tax non-cash charge for impairment of goodwill related toBroadcast Communications.
(4) Discontinued operations, net of income taxes included an $84.2 million after-tax non-cash charge for impairment of goodwill, other long-livedassets and inventory related to Broadcast Communications.
(5) Discontinued operations, net of income taxes included a $23.6 million after-tax loss on sale of discontinued operations related to our sale ofBroadcast Communications to an affiliate of The Gores Group, LLC on February 4, 2013.
(6) Income from continuing operations before income taxes included an $83.0 million after-tax charge, net of government cost reimbursement, forCompany-wide restructuring and other actions, including prepayment of debt, asset impairments, a write-off of capitalized software, facilityconsolidation, workforce reductions and other associated costs.
ITEM 9. CHANGES IN AND DISAGREEMENTS WITH ACCOUNTANTS ON ACCOUNTING ANDFINANCIAL DISCLOSURE.
Not applicable.
ITEM 9A. CONTROLS AND PROCEDURES.
(a) Evaluation of Disclosure Controls and Procedures: We maintain disclosure controls and procedures that aredesigned to ensure that information required to be disclosed in our reports filed or submitted under the Exchange Act isrecorded, processed, summarized and reported within the time periods specified in SEC rules and forms. Our disclosurecontrols and procedures include, without limitation, controls and procedures designed to ensure that informationrequired to be disclosed in our reports filed or submitted under the Exchange Act is accumulated and communicated tomanagement, including our Chief Executive Officer and Chief Financial Officer, as appropriate to allow timelydecisions regarding required disclosures. There are inherent limitations to the effectiveness of any system of disclosurecontrols and procedures, including the possibility of human error and the circumvention or overriding of the controlsand procedures. Accordingly, even effective disclosure controls and procedures can provide only reasonable assuranceof achieving their control objectives, and management necessarily is required to use its judgment in evaluating the cost-benefit relationship of possible controls and procedures. As required by Rule 13a-15 under the Exchange Act, as of theend of fiscal 2014, we carried out an evaluation of the effectiveness of the design and operation of our disclosurecontrols and procedures. This evaluation was carried out under the supervision and with the participation of ourmanagement, including our Chief Executive Officer and our Chief Financial Officer. Based upon this work and otherevaluation procedures, our management, including our Chief Executive Officer and our Chief Financial Officer, hasconcluded that as of the end of fiscal 2014 our disclosure controls and procedures were effective.
(b) Changes in Internal Control: We periodically review our internal control over financial reporting as part ofour efforts to ensure compliance with the requirements of Section 404 of the Sarbanes-Oxley Act of 2002. In addition,we routinely review our system of internal control over financial reporting to identify potential changes to ourprocesses and systems that may improve controls and increase efficiency, while ensuring that we maintain an effectiveinternal control environment. Changes may include such activities as implementing new, more efficient systems,consolidating the activities of business units, migrating certain processes to our shared services organizations,formalizing policies and procedures, improving segregation of duties and increasing monitoring controls. In addition,when we acquire new businesses, we incorporate our controls and procedures into the acquired business as part of ourintegration activities. There have been no changes in our internal control over financial reporting that occurred duringthe quarter ended June 27, 2014 that have materially affected, or are reasonably likely to materially affect, our internalcontrol over financial reporting.
(c) Evaluation of Internal Control over Financial Reporting: Our management is responsible for establishingand maintaining adequate internal control over financial reporting. Our management, with the participation of ourChief Executive Officer and our Chief Financial Officer, assessed the effectiveness of our internal control overfinancial reporting as of the end of fiscal 2014 and concluded that our internal control over financial reporting waseffective as of the end of fiscal 2014. “Management’s Report on Internal Control Over Financial Reporting” is includedwithin “Item 8. Financial Statements and Supplementary Data” of this Report. The effectiveness of our internal controlover financial reporting was audited by Ernst & Young LLP, our independent registered public accounting firm. Theirunqualified report is included within “Item 8. Financial Statements and Supplementary Data” of this Report.
ITEM 9B. OTHER INFORMATION.
Not applicable.
86
PART III
ITEM 10. DIRECTORS, EXECUTIVE OFFICERS AND CORPORATE GOVERNANCE.
(a) Identification of Directors: The information required by this Item with respect to our directors isincorporated herein by reference to the discussion under the heading Proposal 1: Election of Directors in our ProxyStatement for our 2014 Annual Meeting of Shareholders scheduled to be held on October 24, 2014 (our “2014 ProxyStatement”), which is expected to be filed within 120 days after the end of our fiscal 2014.
(b) Identification of Executive Officers: Certain information regarding our executive officers is included in Part Iof this Report under the heading “Executive Officers of the Registrant” in accordance with General Instruction G(3) ofForm 10-K.
(c) Audit Committee Information; Financial Expert: The information required by this Item with respect to theAudit Committee of our Board of Directors and “audit committee financial experts” is incorporated herein by referenceto the discussion under the headings Board Committees and Committee Charters, Audit Committee and CommitteeMembership in our 2014 Proxy Statement, which is expected to be filed within 120 days after the end of our fiscal2014.
(d) Section 16(a) Beneficial Ownership Reporting Compliance: The information relating to compliance withSection 16(a) of the Exchange Act is incorporated herein by reference to the discussion under the headingSection 16(a) Beneficial Ownership Reporting Compliance in our 2014 Proxy Statement, which is expected to be filedwithin 120 days after the end of our fiscal 2014.
(e) Code of Ethics: All of our directors and employees, including our Chief Executive Officer, Chief FinancialOfficer, Principal Accounting Officer and other senior accounting and financial officers, are required to abide by ourCode of Conduct. Our Code of Conduct is posted on our website at http://harris.com/about/business-conduct.aspx andis also available free of charge by written request to our Director of Business Conduct, Harris Corporation, 1025 WestNASA Boulevard, Melbourne, Florida 32919. We intend to disclose on the Business Conduct section of our website athttp://harris.com/about/business-conduct.aspx any amendment to, or waiver from, our Code of Conduct that is requiredto be disclosed to shareholders, within four business days following such amendment or waiver. The informationrequired by this Item with respect to codes of ethics is incorporated herein by reference to the discussion under theheading Code of Conduct in our 2014 Proxy Statement, which is expected to be filed within 120 days after the end ofour fiscal 2014.
(f) Policy for Nominees: The information required under Item 407(c)(3) of Regulation S-K is incorporatedherein by reference to the discussion concerning procedures by which shareholders may recommend nominees to ourBoard of Directors contained under the heading Director Nomination Process and Criteria, and Board Diversity in our2014 Proxy Statement, which is expected to be filed within 120 days after the end of our fiscal 2014. No materialchanges to those procedures have occurred since the disclosure regarding those procedures in our Proxy Statement forour 2013 Annual Meeting of Shareholders. Additional information concerning requirements and procedures forshareholders directly nominating directors is contained under the heading Shareholder Proposals for the 2015 AnnualMeeting of Shareholders in our 2014 Proxy Statement, which is expected to be filed within 120 days after the end ofour fiscal 2014.
ITEM 11. EXECUTIVE COMPENSATION.
The information required by this Item with respect to compensation of our directors and executive officers isincorporated herein by reference to the discussion under the headings Director Compensation and Benefits, ExecutiveCompensation and Management Development and Compensation Committee Report in our 2014 Proxy Statement,which is expected to be filed within 120 days after the end of our fiscal 2014.
87
ITEM 12. SECURITY OWNERSHIP OF CERTAIN BENEFICIAL OWNERS AND MANAGEMENT ANDRELATED STOCKHOLDER MATTERS.
EQUITY COMPENSATION PLAN INFORMATION
The following table provides information as of June 27, 2014 about our common stock that may be issued,whether upon the exercise of options, warrants and rights or otherwise, under our existing equity compensation plans.
Plan Category
Number of securities to beissued upon exercise
of outstanding options,warrants and rights
(a) (2)
Weighted-averageexercise price
of outstanding options,warrants and rights
(b) (2)
Number of securitiesremaining available forfuture issuance under
(1) Consists of the Harris Corporation 2000 Stock Incentive Plan and the Harris Corporation 2005 Equity Incentive Plan (As Amended and RestatedEffective August 27, 2010) (the “2005 Equity Incentive Plan”). No additional awards may be granted under the Harris Corporation 2000 StockIncentive Plan.
(2) Under the 2005 Equity Incentive Plan, in addition to options, we have granted share-based compensation awards in the form of performanceshares, restricted stock, performance share units, restricted stock units or other similar types of share awards. As of June 27, 2014, there were1,500,179 such awards outstanding under that plan, consisting of (i) 3,750 restricted stock awards, for which all 3,750 shares were issued andoutstanding; and (ii) 1,496,429 performance share unit awards and restricted stock unit awards, for which all 1,496,429 were payable in sharesbut for which no shares were yet issued and outstanding. The 5,370,073 shares to be issued upon exercise of outstanding options, warrants andrights as listed in column (a) consisted of shares to be issued in respect of the exercise of 3,873,644 outstanding options and in respect of the1,496,429 performance share unit awards and restricted stock unit awards payable in shares. Because there is no exercise price associated withrestricted stock awards, performance share unit awards or restricted stock unit awards, all of which are granted to employees at no cost, suchawards are not included in the weighted average exercise price calculation in column (b).
See Note 14: Stock Options and Other Share-Based Compensation in the Notes for a general description of ourshare-based incentive plans.
The other information required by this Item with respect to security ownership of certain of our beneficial ownersand management is incorporated herein by reference to the discussion under the headings Our Largest Shareholdersand Shares Held By Our Directors and Executive Officers in our 2014 Proxy Statement, which is expected to be filedwithin 120 days after the end of our fiscal 2014.
ITEM 13. CERTAIN RELATIONSHIPS AND RELATED TRANSACTIONS, AND DIRECTORINDEPENDENCE.
The information required by this Item is incorporated herein by reference to the discussion under the headingsDirector Independence and Related Person Transaction Policy in our 2014 Proxy Statement, which is expected to befiled within 120 days after the end of our fiscal 2014.
ITEM 14. PRINCIPAL ACCOUNTING FEES AND SERVICES.
The information required by this Item is incorporated herein by reference to the discussion under the headingProposal 3: Ratification of the Appointment of Independent Registered Public Accounting Firm in our 2014 ProxyStatement, which is expected to be filed within 120 days after the end of our fiscal 2014.
88
PART IV
ITEM 15. EXHIBITS, FINANCIAL STATEMENT SCHEDULES.
The following documents are filed as a part of this Report:
Page
(1) List of Financial Statements Filed as Part of this ReportThe following financial statements and reports of Harris Corporation and its consolidated
subsidiaries are included in Item 8. of this Report at the page numbers referenced below:
All other schedules are omitted because they are not applicable, the amounts are not significant or the requiredinformation is shown in the Consolidated Financial Statements or the Notes thereto.
(3) Exhibits:
The following exhibits are filed herewith or are incorporated herein by reference to exhibits previously filedwith the SEC:
(2)(a) Agreement and Plan of Merger, dated as of May 21, 2010, by and among Harris Corporation,CapRock Holdings, Inc., Canyon Merger Corp., and, solely for purposes of Sections 7.11, 9.1 and 9.8, certainholders of the issued and outstanding equity securities of CapRock Holdings, Inc. party thereto as of the datethereof, and for purposes of the provisions thereof that apply to the Stockholder Representative, ABRYPartners V, L.P., incorporated herein by reference to Exhibit 2.1 to the Company’s Current Report onForm 8-K filed with the SEC on May 27, 2010. (Commission File Number 1-3863)
(2)(b) Share and Business Sale Agreement, dated as of November 6, 2010, between Schlumberger B.V.and Harris Corporation, incorporated herein by reference to Exhibit 2.1 to the Company’s Current Report onForm 8-K filed with the SEC on November 12, 2010. (Commission File Number 1-3863)
(2)(c)(i) Asset Sale Agreement, dated as of December 5, 2012, by and between Harris Corporation andGores Broadcast Solutions, Inc., incorporated herein by reference to Exhibit 2.1 to the Company’s CurrentReport on Form 8-K filed with the SEC on December 11, 2012. (Commission File Number 1-3863)
(ii) First Amendment to Asset Sale Agreement, dated January 31, 2013, by and between HarrisCorporation and HBC Solutions, Inc. (formerly known as Gores Broadcast Solutions, Inc.), incorporatedherein by reference to Exhibit 2(a) to the Company’s Quarterly Report on Form 10-Q for the fiscal quarterended March 29, 2013. (Commission File Number 1-3863)
(iii) Amendment to Asset Sale Agreement, dated February 3, 2013, by and between Harris Corporationand HBC Solutions, Inc. (formerly known as Gores Broadcast Solutions, Inc.), incorporated herein byreference to Exhibit 2(b) to the Company’s Quarterly Report on Form 10-Q for the fiscal quarter endedMarch 29, 2013. (Commission File Number 1-3863)
89
(iv) Amendment to Asset Sale Agreement, dated May 17, 2013, by and between Harris Corporation andHBC Solutions, Inc. (formerly known as Gores Broadcast Solutions, Inc.), incorporated herein by referenceto Exhibit 2(d)(iv) to the Company’s Annual Report on Form 10-K for fiscal year ended June 28, 2013.(Commission File Number 1-3863)
(3)(a) Restated Certificate of Incorporation of Harris Corporation (1995), as amended, incorporatedherein by reference to Exhibit 3(a) to the Company’s Quarterly Report on Form 10-Q for the fiscal quarterended September 28, 2012. (Commission File Number 1-3863)
(3)(b) By-Laws of Harris Corporation, as amended and restated effective October 26, 2012, incorporatedherein by reference to Exhibit 3.2 to the Company’s Current Report of Form 8-K filed with the SEC onOctober 31, 2012. (Commission File Number 1-3863)
(4)(a) Specimen stock certificate for the Company’s common stock, incorporated herein by reference toExhibit 4(a) to the Company’s Quarterly Report on Form 10-Q for the fiscal quarter ended December 31,2004. (Commission File Number 1-3863)
(4)(b)(i) Indenture, dated as of May 1, 1996, between Harris Corporation and The Bank of New York, asTrustee, relating to unlimited amounts of debt securities which may be issued from time to time by theCompany when and as authorized by the Company’s Board of Directors or a Committee of the Board,incorporated herein by reference to Exhibit 4 to the Company’s Registration Statement on Form S-3,Registration Statement No. 333-03111, filed with the SEC on May 3, 1996.
(ii) Instrument of Resignation from Trustee and Appointment and Acceptance of Successor Trusteeamong Harris Corporation, JP Morgan Chase Bank, as Resigning Trustee and The Bank of New York, asSuccessor Trustee, dated as of November 1, 2002 (effective November 15, 2002), incorporated herein byreference to Exhibit 99.4 to the Company’s Quarterly Report on Form 10-Q for the fiscal quarter endedSeptember 27, 2002. (Commission File Number 1-3863)
(4)(c) Indenture, dated as of October 1, 1990, between Harris Corporation and National City Bank, asTrustee, relating to unlimited amounts of debt securities which may be issued from time to time by theCompany when and as authorized by the Company’s Board of Directors or a Committee of the Board,incorporated herein by reference to Exhibit 4 to the Company’s Registration Statement on Form S-3,Registration Statement No. 33-35315, filed with the SEC on June 8, 1990.
(4)(d)(i) Indenture, dated as of September 3, 2003, between Harris Corporation and The Bank ofNew York Mellon Trust Company, N.A., as successor to The Bank of New York, as Trustee, relating tounlimited amounts of debt securities which may be issued from time to time by the Company when and asauthorized by the Company’s Board of Directors or a Committee of the Board, incorporated herein byreference to Exhibit 4(b) to the Company’s Registration Statement on Form S-3, Registration StatementNo. 333-108486, filed with the SEC on September 3, 2003.
(ii) Instrument of Resignation of Trustee, Appointment and Acceptance of Successor Trustee, dated asof June 2, 2009, among Harris Corporation, The Bank of New York Mellon (formerly known as The Bank ofNew York) and The Bank of New York Mellon Trust Company, N.A., as to Indenture dated as ofSeptember 3, 2003, incorporated herein by reference to Exhibit 4(m) to the Company’s RegistrationStatement on Form S-3, Registration Statement No. 333-159688, filed with the SEC on June 3, 2009.
(4)(e)(i) Subordinated Indenture, dated as of September 3, 2003, between Harris Corporation and TheBank of New York Mellon Trust Company, N.A., as successor to The Bank of New York, as Trustee,relating to unlimited amounts of debt securities which may be issued from time to time by the Companywhen and as authorized by the Company’s Board of Directors or a Committee of the Board, incorporatedherein by reference to Exhibit 4(c) to the Company’s Registration Statement on Form S-3, RegistrationStatement No. 333-108486, filed with the SEC on September 3, 2003.
(ii) Instrument of Resignation of Trustee, Appointment and Acceptance of Successor Trustee, dated asof June 2, 2009, among Harris Corporation, The Bank of New York Mellon (formerly known as The Bank ofNew York) and The Bank of New York Mellon Trust Company, N.A., as to Subordinated Indenture dated asof September 3, 2003, incorporated herein by reference to Exhibit 4(n) to the Company’s RegistrationStatement on Form S-3, Registration Statement No. 333-159688, filed with the SEC on June 3, 2009.
(4)(f) Form of the Company’s 5.95% Notes due 2017, incorporated herein by reference to Exhibit 4.1 tothe Company’s Current Report on Form 8-K filed with the SEC on December 5, 2007. (Commission FileNumber 1-3863)
90
(4)(g) Form of the Company’s 6.375% Notes due 2019, incorporated herein by reference to Exhibit 4.1to the Company’s Current Report on Form 8-K filed with the SEC on June 10, 2009. (Commission FileNumber 1-3863)
(4)(h) Form of the Company’s 4.40% Notes due 2020, incorporated herein by reference to Exhibit 4.1 tothe Company’s Current Report on Form 8-K filed with the SEC on December 3, 2010. (Commission FileNumber 1-3863)
(4)(i) Form of the Company’s 6.15% Notes due 2040, incorporated herein by reference to Exhibit 4.2 tothe Company’s Current Report on Form 8-K filed with the SEC on December 3, 2010. (Commission FileNumber 1-3863)
(4)(j) Pursuant to Regulation S-K Item 601(b)(4)(iii)(A), Registrant by this filing agrees, upon request,to furnish to the SEC a copy of other instruments defining the rights of holders of long-term debt of Harris.
*(10)(a)(i) Form of Director and Executive Officer Indemnification Agreement, effective as of, and foruse after, August 28, 2010, incorporated herein by reference to Exhibit 10(p) to the Company’s QuarterlyReport on Form 10-Q for the fiscal quarter ended October 1, 2010. (Commission File Number 1-3863)
(ii) Form of Director and Executive Officer Indemnification Agreement, for use on or after October 26,2012, incorporated herein by reference to Exhibit 10.1 to the Company’s Current Report on Form 8-K filedwith the SEC on October 31, 2012. (Commission File Number 1-3863)
*(10)(b) Form of Executive Change in Control Severance Agreement, effective as of, and for use after,April 22, 2010, incorporated herein by reference to Exhibit 10(o) to the Company’s Quarterly Report onForm 10-Q for the fiscal quarter ended October 1, 2010. (Commission File Number 1-3863)
*(10)(c)(i) Harris Corporation Annual Incentive Plan (effective as of July 3, 2010), incorporated hereinby reference to Exhibit 10.3 to the Company’s Current Report on Form 8-K filed with the SEC onSeptember 2, 2010. (Commission File Number 1-3863)
(ii) Amendment Number One to the Harris Corporation Annual Incentive Plan (Effective as of July 3,2010), dated December 10, 2013, incorporated herein by reference to Exhibit 10(d) to the Company’sQuarterly Report on Form 10-Q for the fiscal quarter ended December 27, 2013. (Commission File Number1-3863)
*(10)(d)(i) Harris Corporation 2000 Stock Incentive Plan, incorporated herein by reference toExhibit 4(b) to the Company’s Registration Statement on Form S-8, Registration Statement No. 333-49006,filed with the SEC on October 31, 2000.
(ii) Amendment No. 1 to Harris Corporation 2000 Stock Incentive Plan, dated as of December 3, 2004,incorporated herein by reference to Exhibit 10.2 to the Company’s Current Report on Form 8-K filed withthe SEC on December 8, 2004. (Commission File Number 1-3863)
(iii) Amendment No. 2 to Harris Corporation 2000 Stock Incentive Plan, effective January 1, 2009,incorporated herein by reference to Exhibit 10(c) to the Company’s Quarterly Report on Form 10-Q for thefiscal quarter ended January 2, 2009. (Commission File Number 1-3863)
(iv) Stock Option Agreement Terms and Conditions (as of 8/27/04) for grants under the HarrisCorporation 2000 Stock Incentive Plan, incorporated herein by reference to Exhibit 10(a) to the Company’sQuarterly Report on Form 10-Q for the fiscal quarter ended October 1, 2004. (Commission File Number 1-3863)
(v) Stock Option Agreement Terms and Conditions (as of 8/26/05) for grants under the HarrisCorporation 2000 Stock Incentive Plan, incorporated herein by reference to Exhibit 10.2 to the Company’sCurrent Report on Form 8-K filed with the SEC on September 1, 2005. (Commission File Number 1-3863)
(vi) Form of Outside Director Stock Option Agreement (as of 10/27/2000) for grants under the HarrisCorporation 2000 Stock Incentive Plan, incorporated herein by reference to Exhibit 10(d)(iii) to theCompany’s Annual Report on Form 10-K for the fiscal year ended June 29, 2001. (Commission File Number1-3863)
*(10)(e)(i) Harris Corporation 2005 Equity Incentive Plan, incorporated herein by reference toExhibit 10.1 to the Company’s Current Report on Form 8-K filed with the SEC on November 3, 2005.(Commission File Number 1-3863)
91
(ii) Amendment No. 1 to Harris Corporation 2005 Equity Incentive Plan, effective January 1, 2009,incorporated herein by reference to Exhibit 10(d) to the Company’s Quarterly Report on Form 10-Q for thefiscal quarter ended January 2, 2009. (Commission File Number 1-3863)
(iii) Stock Option Award Agreement Terms and Conditions (as of 10/28/05) for grants under the HarrisCorporation 2005 Equity Incentive Plan, incorporated herein by reference to Exhibit 10(f) to the Company’sQuarterly Report on Form 10-Q for the fiscal quarter ended December 30, 2005. (Commission File Number1-3863)
(iv) Form of Stock Option Award Agreement Terms and Conditions (as of June 30, 2007) for grantsunder the Harris Corporation 2005 Equity Incentive Plan, incorporated herein by reference to Exhibit 10.1 tothe Company’s Current Report on Form 8-K filed with the SEC on August 30, 2007. (Commission FileNumber 1-3863)
(v) Form of Stock Option Award Agreement Terms and Conditions (as of June 28, 2008) for grantsunder the Harris Corporation 2005 Equity Incentive Plan, incorporated herein by reference to Exhibit 10.1 tothe Company’s Current Report on Form 8-K filed with the SEC on August 28, 2008. (Commission FileNumber 1-3863)
(vi) Form of Stock Option Award Agreement Terms and Conditions (as of July 4, 2009) for grantsunder the Harris Corporation 2005 Equity Incentive Plan, incorporated herein by reference to Exhibit 10.1 tothe Company’s Current Report on Form 8-K filed with the SEC on September 3, 2009. (Commission FileNumber 1-3863)
*(10)(f)(i) Harris Corporation 2005 Equity Incentive Plan (As Amended and Restated EffectiveAugust 27, 2010), incorporated herein by reference to Exhibit 10.4 to the Company’s Current Report onForm 8-K filed with the SEC on September 2, 2010. (Commission File Number 1-3863)
(ii) Form of Stock Option Award Agreement Terms and Conditions (as of July 3, 2010) for grantsunder the Harris Corporation 2005 Equity Incentive Plan (As Amended and Restated Effective August 27,2010), incorporated herein by reference to Exhibit 10(c) to the Company’s Quarterly Report on Form 10-Qfor the fiscal quarter ended October 1, 2010. (Commission File Number 1-3863)
(iii) Form of Restricted Stock Award Agreement Terms and Conditions (as of July 3, 2010) for grantsunder the Harris Corporation 2005 Equity Incentive Plan (As Amended and Restated Effective August 27,2010), incorporated herein by reference to Exhibit 10(f) to the Company’s Quarterly Report on Form 10-Qfor the fiscal quarter ended October 1, 2010. (Commission File Number 1-3863)
(iv) Form of Restricted Stock Unit Award Agreement Terms and Conditions (as of July 3, 2010) forgrants under the Harris Corporation 2005 Equity Incentive Plan (As Amended and Restated EffectiveAugust 27, 2010), incorporated herein by reference to Exhibit 10(g) to the Company’s Quarterly Report onForm 10-Q for the fiscal quarter ended October 1, 2010. (Commission File Number 1-3863)
(v) Form of Stock Option Award Agreement Terms and Conditions (as of August 26, 2011) for grantsunder the Harris Corporation 2005 Equity Incentive Plan (As Amended and Restated Effective August 27,2010), incorporated herein by reference to Exhibit 10.1 to the Company’s Current Report on Form 8-K filedwith the SEC on August 31, 2011. (Commission File Number 1-3863)
(vi) Form of Performance Share Unit Award Agreement Terms and Conditions (as of August 26, 2011)for grants under the Harris Corporation 2005 Equity Incentive Plan (As Amended and Restated EffectiveAugust 27, 2010), incorporated herein by reference to Exhibit 10.2 to the Company’s Current Report onForm 8-K filed with the SEC on August 31, 2011. (Commission File Number 1-3863)
(vii) Form of Restricted Stock Unit Award Agreement Terms and Conditions (as of August 26, 2011)for grants under the Harris Corporation 2005 Equity Incentive Plan (As Amended and Restated EffectiveAugust 27, 2010), incorporated herein by reference to Exhibit 10.3 to the Company’s Current Report onForm 8-K filed with the SEC on August 31, 2011. (Commission File Number 1-3863)
(viii) Form of Restricted Stock Unit Award Agreement Terms and Conditions (as of June 30, 2012) forgrants under the Harris Corporation 2005 Equity Incentive Plan (As Amended and Restated EffectiveAugust 27, 2010), incorporated herein by reference to Exhibit 10.3 to the Company’s Current Report onForm 8-K filed with the SEC on August 29, 2012. (Commission File Number 1-3863)
92
(ix) Form of Stock Option Award Agreement Terms and Conditions (as of June 29, 2013) for grantsunder the Harris Corporation 2005 Equity Incentive Plan (As Amended and Restated Effective August 27,2010), incorporated herein by reference to Exhibit 10(a) to the Company’s Quarterly Report on Form 10-Qfor the fiscal quarter ended September 27, 2013. (Commission File Number 1-3863)
(x) Form of Performance Share Unit Award Agreement Terms and Conditions (as of June 29, 2013) forgrants under the Harris Corporation 2005 Equity Incentive Plan (As Amended and Restated EffectiveAugust 27, 2010), incorporated herein by reference to Exhibit 10(b) to the Company’s Quarterly Report onForm 10-Q for the fiscal quarter ended September 27, 2013. (Commission File Number 1-3863)
(xi) Form of Restricted Stock Unit Award Agreement Terms and Conditions (as of June 29, 2013) forgrants under the Harris Corporation 2005 Equity Incentive Plan (As Amended and Restated EffectiveAugust 27, 2010), incorporated herein by reference to Exhibit 10(c) to the Company’s Quarterly Report onForm 10-Q for the fiscal quarter ended September 27, 2013. (Commission File Number 1-3863)
*(10)(g)(i) Harris Corporation Retirement Plan (Amended and Restated Effective January 1, 2011),incorporated herein by reference to Exhibit 10(b) to the Company’s Quarterly Report on Form 10-Q for thefiscal quarter ended December 31, 2010. (Commission File Number 1-3863)
(ii) Amendment Number One to the Harris Corporation Retirement Plan (Amended and RestatedEffective January 1, 2011), dated June 28, 2011 and effective as of July 2, 2011, incorporated herein byreference to Exhibit 10(x)(ii) to the Company’s Annual Report on Form 10-K for the fiscal year ended July 1,2011. (Commission File Number 1-3863)
(iii) Amendment Number Two to the Harris Corporation Retirement Plan (Amended and RestatedEffective January 1, 2011), dated August 30, 2011 and effective as of September 1, 2011, incorporated hereinby reference to Exhibit 10(d) to the Company’s Quarterly Report on Form 10-Q for the fiscal quarter endedSeptember 30, 2011. (Commission File Number 1-3863)
(iv) Amendment Number Three to the Harris Corporation Retirement Plan (Amended and RestatedEffective January 1, 2011), dated January 31, 2013 and effective as of February 4, 2013, incorporated hereinby reference to Exhibit 10(a) to the Company’s Quarterly Report on Form 10-Q for the fiscal quarter endedMarch 29, 2013. (Commission File Number 1-3863)
(v) Amendment Number Four to the Harris Corporation Retirement Plan (Amended and RestatedEffective January 1, 2011), dated June 25, 2013 and effective as of July 15, 2013, incorporated herein byreference to Exhibit 10(g)(v) to the Company’s Annual Report on Form 10-K for the fiscal year endedJune 28, 2013. (Commission File Number 1-3863)
(vi) Amendment Number Five to the Harris Corporation Retirement Plan (Amended and RestatedEffective January 1, 2011), dated December 6, 2013 and effective as of July 1, 2013, incorporated herein byreference to Exhibit 4(d)(vi) to the Company’s Registration Statement on Form S-8, RegistrationNo. 333-192735, filed with the SEC on December 9, 2013.
(vii) Amendment Number Six to the Harris Corporation Retirement Plan (Amended and RestatedEffective January 1, 2011), dated December 10, 2013, incorporated herein by reference to Exhibit 10(b) tothe Company’s Quarterly Report on Form 10-Q for fiscal quarter ended December 27, 2013. (CommissionFile Number 1-3863)
(viii) Amendment Number Seven to the Harris Corporation Retirement Plan (Amended and RestatedEffective January 1, 2011), dated December 28, 2013, incorporated herein by reference to Exhibit 10(c) tothe Company’s Quarterly Report on Form 10-Q for fiscal quarter ended December 27, 2013. (CommissionFile Number 1-3863)
*(10)(h)(i) Harris Corporation Supplemental Executive Retirement Plan (amended and restated effectiveMarch 1, 2003), incorporated herein by reference to Exhibit 10(b)(i) to the Company’s Quarterly Report onForm 10-Q for the fiscal quarter ended March 28, 2003. (Commission File Number 1-3863)
(ii) Amendment No. 1 to Harris Corporation Supplemental Executive Retirement Plan, dated April 25,2003, incorporated herein by reference to Exhibit 10(b)(ii) to the Company’s Quarterly Report on Form 10-Qfor the fiscal quarter ended March 28, 2003. (Commission File Number 1-3863)
(iii) Amendment No. 2 to Harris Corporation Supplemental Executive Retirement Plan, dated June 4,2004, incorporated herein by reference to Exhibit 10(f)(iii) to the Company’s Annual Report on Form 10-Kfor the fiscal year ended July 2, 2004. (Commission File Number 1-3863)
93
(iv) Amendment No. 3 to Harris Corporation Supplemental Executive Retirement Plan, dated April 19,2007, incorporated herein by reference to Exhibit 10(g)(iv) to the Company’s Annual Report on Form 10-Kfor the fiscal year ended June 29, 2007. (Commission File Number 1-3863)
(v) Amendment No. 4 to Harris Corporation Supplemental Executive Retirement Plan, datedOctober 27, 2010 and effective as of August 28, 2010, incorporated herein by reference to Exhibit 10(j) to theCompany’s Quarterly Report on Form 10-Q for the fiscal quarter ended October 1, 2010. (Commission FileNumber 1-3863)
*(10)(i) Harris Corporation 2005 Supplemental Executive Retirement Plan (As Amended and RestatedEffective November 28, 2011), incorporated herein by reference to Exhibit 10(d) to the Company’s QuarterlyReport on Form 10-Q for the fiscal quarter ended December 30, 2011. (Commission File Number 1-3863)
*(10)(j)(i) Harris Corporation 1997 Directors’ Deferred Compensation and Annual Stock Unit AwardPlan (Amended and Restated Effective January 1, 2006), incorporated herein by reference to Exhibit 10.4 tothe Company’s Current Report on Form 8-K filed with the SEC on November 3, 2005. (Commission FileNumber 1-3863)
(ii) Amendment Number One to the Harris Corporation 1997 Directors’ Deferred Compensation andAnnual Stock Unit Award Plan (Amended and Restated Effective January 1, 2006), effective January 1,2009, incorporated herein by reference to Exhibit 10(g) to the Company’s Quarterly Report on Form 10-Qfor the fiscal quarter ended January 2, 2009. (Commission File Number 1-3863)
(iii) Amendment Number Two to the Harris Corporation 1997 Directors’ Deferred Compensation andAnnual Stock Unit Award Plan (Amended and Restated Effective January 1, 2006), dated October 27, 2010and effective as of August 28, 2010, incorporated herein by reference to Exhibit 10(l) to the Company’sQuarterly Report on Form 10-Q for the fiscal quarter ended October 1, 2010. (Commission FileNumber 1-3863)
*(10)(k)(i) Harris Corporation 2005 Directors’ Deferred Compensation Plan (as Amended and RestatedEffective January 1, 2009), incorporated herein by reference to Exhibit 10(h) to the Company’s QuarterlyReport on Form 10-Q for the fiscal quarter ended January 2, 2009. (Commission File Number 1-3863)
(ii) Amendment Number One to the Harris Corporation 2005 Directors’ Deferred Compensation Plan(As Amended and Restated Effective January 1, 2009), dated October 27, 2010 and effective as ofAugust 28, 2010, incorporated herein by reference to Exhibit 10(m) to the Company’s Quarterly Report onForm 10-Q for the fiscal quarter ended October 1, 2010. (Commission File Number 1-3863)
*(10)(l)(i) Amended and Restated Master Trust Agreement and Declaration of Trust, made as ofDecember 2, 2003, by and between Harris Corporation and The Northern Trust Company, incorporatedherein by reference to Exhibit 10(c) to the Company’s Quarterly Report on Form 10-Q for the fiscal quarterended January 2, 2004. (Commission File Number 1-3863)
(ii) Amendment to the Harris Corporation Master Trust, dated May 21, 2009, incorporated herein byreference to Exhibit 10(m)(ii) to the Company’s Annual Report on Form 10-K for the fiscal year endedJuly 3, 2009. (Commission File Number 1-3863)
(iii) Amendment to the Harris Corporation Master Trust, dated December 8, 2009 and effectiveDecember 31, 2009, incorporated herein by reference to Exhibit 4(e)(iii) to the Company’s RegistrationStatement on Form S-8, Registration Statement No. 333-163647, filed with the SEC on December 10, 2009.
*(10)(m)(i) Master Rabbi Trust Agreement, amended and restated as of December 2, 2003, by andbetween Harris Corporation and The Northern Trust Company, incorporated herein by reference toExhibit 10(d) to the Company’s Quarterly Report on Form 10-Q for the fiscal quarter ended January 2, 2004.(Commission File Number 1-3863)
(ii) First Amendment to Master Rabbi Trust Agreement, dated the 24th day of September, 2004,incorporated herein by reference to Exhibit 10(b) to the Company’s Quarterly Report on Form 10-Q for thefiscal quarter ended October 1, 2004. (Commission File Number 1-3863)
(iii) Second Amendment to the Harris Corporation Master Rabbi Trust Agreement, dated as ofDecember 8, 2004, incorporated herein by reference to Exhibit 10.5 to the Company’s Current Report onForm 8-K filed with the SEC on December 8, 2004. (Commission File Number 1-3863)
94
(iv) Third Amendment to the Harris Corporation Master Rabbi Trust Agreement, dated January 15,2009 and effective January 1, 2009, incorporated herein by reference to Exhibit 10(i) to the Company’sQuarterly Report on Form 10-Q for the fiscal quarter ended January 2, 2009. (Commission File Number1-3863)
(v) Fourth Amendment to the Harris Corporation Master Rabbi Trust Agreement, dated October 27,2010 and effective as of August 28, 2010, incorporated herein by reference to Exhibit 10(n) to theCompany’s Quarterly Report on Form 10-Q for the fiscal quarter ended October 1, 2010. (Commission FileNumber 1-3863)
(10)(n) Revolving Credit Agreement, dated as of September 28, 2012, by and among Harris Corporationand the other parties thereto, incorporated herein by reference to Exhibit 10.1 to the Company’s CurrentReport on Form 8-K filed with the SEC on October 4, 2012. (Commission File Number 1-3863)
(10)(o) Commercial Paper Issuing and Paying Agent Agreement, dated as of March 30, 2005, betweenCitibank, N.A. and Harris Corporation, incorporated herein by reference to Exhibit 99.2 to the Company’sCurrent Report on Form 8-K filed with the SEC on April 5, 2005. (Commission File Number 1-3863)
(10)(p) Commercial Paper Dealer Agreement, dated as of June 12, 2007, between Citigroup GlobalMarkets Inc. and Harris Corporation, incorporated herein by reference to Exhibit 10.1 to the Company’sCurrent Report on Form 8-K filed with the SEC on June 18, 2007. (Commission File Number 1-3863)
(10)(q) Commercial Paper Dealer Agreement, dated June 13, 2007, between Banc of America SecuritiesLLC and Harris Corporation, incorporated herein by reference to Exhibit 10.2 to the Company’s CurrentReport on Form 8-K filed with the SEC on June 18, 2007. (Commission File Number 1-3863)
(10)(r) Commercial Paper Dealer Agreement, dated as of June 14, 2007, between SunTrust CapitalMarkets, Inc. and Harris Corporation, incorporated herein by reference to Exhibit 10.3 to the Company’sCurrent Report on Form 8-K filed with the SEC on June 18, 2007. (Commission File Number 1-3863)
*(10)(s)(i) Letter Agreement, dated October 8, 2011, by and between Harris Corporation and Howard L.Lance, incorporated herein by reference to Exhibit 10.2 to the Company’s Current Report on Form 8-K filedwith the SEC on October 11, 2011. (Commission File Number 1-3863)
(ii) Amendment to Letter Agreement, dated as of July 23, 2012, by and between Harris Corporation andHoward L. Lance, incorporated herein by reference to Exhibit 10.1 to the Company’s Current Report onForm 8-K/A filed with the SEC on July 26, 2012. (Commission File Number 1-3863)
*10(t) Separation Agreement and Release of All Claims, dated as of August 21, 2012, by and betweenHarris Corporation and Jeffrey S. Shuman, incorporated herein by reference to Exhibit 10(b) to theCompany’s Quarterly Report on Form 10-Q for the fiscal quarter ended September 28, 2012. (CommissionFile Number 1-3863)
*(10)(u) Employment Agreement, dated October 8, 2011 and effective November 1, 2011, by andbetween Harris Corporation and William M. Brown, incorporated herein by reference to Exhibit 10.1 to theCompany’s Current Report on Form 8-K filed with the SEC on October 11, 2011. (Commission File Number1-3863)
*(10)(v) Offer Letter, dated July 20, 2012, by and between Harris Corporation and Robert L. Duffy,incorporated herein by reference to Exhibit 10(x) to the Company’s Annual Report on Form 10-K for fiscalyear ended June 28. 2013. (Commission File Number 1-3863)
*(10)(w) Offer Letter, dated December 11, 2012, by and between Harris Corporation and James D.Morris, incorporated herein by reference to Exhibit 10(y) to the Company’s Annual Report on Form 10-K forfiscal year ended June 28, 2013. (Commission File Number 1-3863)
*(10)(x) Offer Letter Agreement, dated February 4, 2014, between Harris Corporation and Miguel A.Lopez, incorporated herein by reference to Exhibit 10(b) to the Company’s Quarterly Report on Form 10-Qfor the fiscal quarter ended March 28, 2014. (Commission File Number 1-3863)
*(10)(y) Separation Agreement and Release of All Claims, dated February 12, 2014, between HarrisCorporation and Gary L. McArthur, incorporated herein by reference to Exhibit 10(c) to the Company’sQuarterly Report on Form 10-Q for fiscal quarter ended March 28, 2014. (Commission File Number 1-3863)
*(10)(z) Summary of Annual Compensation of Non-Employee Directors effective as of April 25, 2014.
(12) Statement regarding computation of ratio of earnings to fixed charges.
95
(21) Subsidiaries of the Registrant.
(23) Consent of Ernst & Young LLP, Independent Registered Certified Public Accounting Firm.
(24) Power of Attorney.
(31.1) Rule 13a-14(a)/15d-14(a) Certification of Chief Executive Officer.
(31.2) Rule 13a-14(a)/15d-14(a) Certification of Chief Financial Officer.
(32.1) Section 1350 Certification of Chief Executive Officer.
(32.2) Section 1350 Certification of Chief Financial Officer.
* Management contract or compensatory plan or arrangement.
96
SIGNATURES
Pursuant to the requirements of Section 13 or 15(d) of the Securities Exchange Act of 1934, the registranthas duly caused this report to be signed on its behalf by the undersigned, thereunto duly authorized.
HARRIS CORPORATION(Registrant)
Date: August 25, 2014 By: /S/ WILLIAM M. BROWN
William M. BrownChairman, President and Chief Executive Officer
Pursuant to the requirements of the Securities Exchange Act of 1934, this report has been signed below bythe following persons on behalf of the registrant and in the capacities and on the dates indicated.
Signature Title Date
/s/ WILLIAM M. BROWN
William M. Brown
Chairman, President and Chief ExecutiveOfficer (Principal Executive Officer)
August 25, 2014
/s/ MIGUEL A. LOPEZ
Miguel A. Lopez
Senior Vice President and ChiefFinancial Officer(Principal Financial Officer)
* Subsidiary of Harris Corporation less than 100% directly or indirectly owned by Harris Corporation.
THIS PAGE HAS BEEN INTENTIONALLY LEFT BLANK
Exhibit 23
CONSENT OF INDEPENDENT REGISTERED CERTIFIED PUBLIC ACCOUNTING FIRM
We consent to the incorporation by reference in the following registration statements of Harris Corporation and inthe related Prospectuses of our reports dated August 25, 2014, with respect to the consolidated financial statements andschedule of Harris Corporation, and the effectiveness of internal control over financial reporting of Harris Corporation,included in this Annual Report (Form 10-K) for the fiscal year ended June 27, 2014:
KNOW TO ALL PERSONS BY THESE PRESENTS, that each person whose signature appears below constitutesand appoints SCOTT T. MIKUEN and ROBERT A. JOHNSON JR., each and individually, as his or her true andlawful attorneys-in-fact and agents, with full power of substitution and resubstitution, for and in the name, place andstead of the undersigned, for him or her in any and all capacities, to sign the Annual Report on Form 10-K of HarrisCorporation, a Delaware corporation, with respect to the fiscal year ended June 27, 2014, and to sign any and allamendments to such Annual Report on Form 10-K and to file the same, with all exhibits thereto and all otherdocuments in connection therewith, with the Securities and Exchange Commission, granting unto each of suchattorneys-in-fact and agents, and each of them, full power and authority to do and perform each and every act and thingrequisite and necessary in connection with such matters and hereby ratifying and confirming all that each suchattorneys-in-fact or agents or their substitutes, may do or cause to be done by virtue hereof. This Power of Attorneymay be signed in counterparts.
Date: August 25, 2014.
/s/ WILLIAM M. BROWN /s/ KAREN KATEN
William M. BrownChairman, President and Chief Executive Officer
Karen KatenDirector
/s/ MIGUEL A. LOPEZ /s/ STEPHEN P. KAUFMAN
Miguel A. LopezSenior Vice President and Chief Financial Officer
Stephen P. KaufmanDirector
/s/ LEWIS A. SCHWARTZ /s/ LESLIE F. KENNE
Lewis A. SchwartzVice President, Principal Accounting Officer
Leslie F. KenneDirector
/s/ PETER W. CHIARELLI /s/ DAVID B. RICKARD
Peter W. ChiarelliDirector
David B. RickardDirector
/s/ THOMAS A. DATTILO /s/ JAMES C. STOFFEL
Thomas A. DattiloDirector
James C. StoffelDirector
/s/ TERRY D. GROWCOCK /s/ GREGORY T. SWIENTON
Terry D. GrowcockDirector
Gregory T. SwientonDirector
/s/ LEWIS HAY III /s/ HANSEL E. TOOKES II
Lewis Hay IIIDirector
Hansel E. Tookes IIDirector
/s/ VYOMESH I. JOSHI
Vyomesh I. JoshiDirector
Exhibit 31.1
CERTIFICATIONS
I, William M. Brown, Chairman, President and Chief Executive Officer of Harris Corporation, certify that:
1. I have reviewed this Annual Report on Form 10-K for the fiscal year ended June 27, 2014, ofHarris Corporation;
2. Based on my knowledge, this report does not contain any untrue statement of a material fact or omit to state amaterial fact necessary to make the statements made, in light of the circumstances under which such statements weremade, not misleading with respect to the period covered by this report;
3. Based on my knowledge, the financial statements, and other financial information included in this report, fairlypresent in all material respects the financial condition, results of operations and cash flows of the registrant as of, andfor, the periods presented in this report;
4. The registrant’s other certifying officer and I are responsible for establishing and maintaining disclosurecontrols and procedures (as defined in Exchange Act Rules 13a-15(e) and 15d-15(e)) and internal control over financialreporting (as defined in Exchange Act Rules 13a-15(f) and 15d-15(f)) for the registrant and have:
(a) Designed such disclosure controls and procedures, or caused such disclosure controls and procedures tobe designed under our supervision, to ensure that material information relating to the registrant, including itsconsolidated subsidiaries, is made known to us by others within those entities, particularly during the period inwhich this report is being prepared;
(b) Designed such internal control over financial reporting, or caused such internal control over financialreporting to be designed under our supervision, to provide reasonable assurance regarding the reliability offinancial reporting and the preparation of financial statements for external purposes in accordance with generallyaccepted accounting principles;
(c) Evaluated the effectiveness of the registrant’s disclosure controls and procedures and presented in thisreport our conclusions about the effectiveness of the disclosure controls and procedures, as of the end of theperiod covered by this report based on such evaluation; and
(d) Disclosed in this report any change in the registrant’s internal control over financial reporting thatoccurred during the registrant’s most recent fiscal quarter (the registrant’s fourth fiscal quarter in the case of anannual report) that has materially affected, or is reasonably likely to materially affect, the registrant’s internalcontrol over financial reporting; and
5. The registrant’s other certifying officer and I have disclosed, based on our most recent evaluation of internalcontrol over financial reporting, to the registrant’s auditors and the audit committee of the registrant’s board ofdirectors (or persons performing the equivalent functions):
(a) All significant deficiencies and material weaknesses in the design or operation of internal control overfinancial reporting which are reasonably likely to adversely affect the registrant’s ability to record, process,summarize and report financial information; and
(b) Any fraud, whether or not material, that involves management or other employees who have a significantrole in the registrant’s internal control over financial reporting.
/s/ WILLIAM M. BROWN
William M. BrownChairman, President and Chief Executive Officer
Date: August 25, 2014
Exhibit 31.2
CERTIFICATIONS
I, Miguel A. Lopez, Senior Vice President and Chief Financial Officer of Harris Corporation, certify that:
1. I have reviewed this Annual Report on Form 10-K for the fiscal year ended June 27, 2014, of HarrisCorporation;
2. Based on my knowledge, this report does not contain any untrue statement of a material fact or omit to state amaterial fact necessary to make the statements made, in light of the circumstances under which such statements weremade, not misleading with respect to the period covered by this report;
3. Based on my knowledge, the financial statements, and other financial information included in this report, fairlypresent in all material respects the financial condition, results of operations and cash flows of the registrant as of, andfor, the periods presented in this report;
4. The registrant’s other certifying officer and I are responsible for establishing and maintaining disclosurecontrols and procedures (as defined in Exchange Act Rules 13a-15(e) and 15d-15(e)) and internal control over financialreporting (as defined in Exchange Act Rules 13a-15(f) and 15d-15(f)) for the registrant and have:
(a) Designed such disclosure controls and procedures, or caused such disclosure controls and procedures tobe designed under our supervision, to ensure that material information relating to the registrant, including itsconsolidated subsidiaries, is made known to us by others within those entities, particularly during the period inwhich this report is being prepared;
(b) Designed such internal control over financial reporting, or caused such internal control over financialreporting to be designed under our supervision, to provide reasonable assurance regarding the reliability offinancial reporting and the preparation of financial statements for external purposes in accordance with generallyaccepted accounting principles;
(c) Evaluated the effectiveness of the registrant’s disclosure controls and procedures and presented in thisreport our conclusions about the effectiveness of the disclosure controls and procedures, as of the end of theperiod covered by this report based on such evaluation; and
(d) Disclosed in this report any change in the registrant’s internal control over financial reporting thatoccurred during the registrant’s most recent fiscal quarter (the registrant’s fourth fiscal quarter in the case of anannual report) that has materially affected, or is reasonably likely to materially affect, the registrant’s internalcontrol over financial reporting; and
5. The registrant’s other certifying officer and I have disclosed, based on our most recent evaluation of internalcontrol over financial reporting, to the registrant’s auditors and the audit committee of the registrant’s board ofdirectors (or persons performing the equivalent functions):
(a) All significant deficiencies and material weaknesses in the design or operation of internal control overfinancial reporting which are reasonably likely to adversely affect the registrant’s ability to record, process,summarize and report financial information; and
(b) Any fraud, whether or not material, that involves management or other employees who have a significantrole in the registrant’s internal control over financial reporting.
/s/ MIGUEL A. LOPEZ
Miguel A. LopezSenior Vice President and Chief Financial Officer
Date: August 25, 2014
Exhibit 32.1
CertificationPursuant to Section 1350 of Chapter 63 of Title 18 of theUnited States Code as Adopted Pursuant to Section 906
of the Sarbanes-Oxley Act of 2002
In connection with the filing of the Annual Report on Form 10-K of Harris Corporation (“Harris”) for the fiscalyear ended June 27, 2014, as filed with the Securities and Exchange Commission on the date hereof (the “Report”), theundersigned, William M. Brown, Chairman, President and Chief Executive Officer of Harris, hereby certifies, pursuantto Section 906 of the Sarbanes-Oxley Act of 2002, 18 U.S.C. § 1350, that:
(1) The Report fully complies with the requirements of Section 13(a) or 15(d), as applicable, of the SecuritiesExchange Act of 1934, as amended; and
(2) The information contained in the Report fairly presents, in all material respects, the financial conditionand results of operations of Harris as of the dates and for the periods expressed in the Report.
/s/ WILLIAM M. BROWN
William M. BrownChairman, President and Chief Executive Officer
Date: August 25, 2014
Exhibit 32.2
CertificationPursuant to Section 1350 of Chapter 63 of Title 18 of theUnited States Code as Adopted Pursuant to Section 906
of the Sarbanes-Oxley Act of 2002
In connection with the filing of the Annual Report on Form 10-K of Harris Corporation (“Harris”) for the fiscalyear ended June 27, 2014, as filed with the Securities and Exchange Commission on the date hereof (the “Report”), theundersigned, Miguel A. Lopez, Senior Vice President and Chief Financial Officer of Harris, hereby certifies, pursuantto Section 906 of the Sarbanes-Oxley Act of 2002, 18 U.S.C. § 1350, that:
(1) The Report fully complies with the requirements of Section 13(a) or 15(d), as applicable, of the SecuritiesExchange Act of 1934, as amended; and
(2) The information contained in the Report fairly presents, in all material respects, the financial conditionand results of operations of Harris as of the dates and for the periods expressed in the Report.
/s/ MIGUEL A. LOPEZ
Miguel A. LopezSenior Vice President and Chief Financial Officer
Date: August 25, 2014
THIS PAGE HAS BEEN INTENTIONALLY LEFT BLANK
H A R R I S CO R P O R AT I O N 1025 West NASA BoulevardMelbourne, Florida 32919-0001
U.S.: 1-800-442-7747International: 1-321-727-9207
h a r r i s . co m
Unsolicited PPEA Proposal for P25 Radio System Middlesex County, Virginia
November 2014
P25 Phase 2 System Page 1
Unsolicited Conceptual Proposal – P25 Phase 2 System (Option 1)
Introduction Harris Corporation, RF Communications Division (Harris) is pleased to provide Middlesex County,
Virginia with this unsolicited conceptual proposal to assist with planning for migration of the existing
analog conventional land mobile radio equipment to a state of the art P25 Phase 2 communications
solution that will provide the County with a state-of-the-art Land Mobile Radio (LMR) network that
will last well into the 21st century. This unsolicited conceptual proposal is intended to provide the
County with valuable planning information, as well as data that can be used if federal grant funds are
sought.
The comprehensive system described herein includes:
Redundant High Available System Core
Three site, UHF linear simulcast P25 Phase 2 LMR
system that will provide extensive coverage throughout
Middlesex County
Distributed IP Control Point with dual site redundancy
Four Trunked Talkpaths
IP-based MPLS microwave network configured in a
redundant loop configuration.
Conventional three site simulcast system for tone and
voice VHF paging.
New dispatch system with three Symphony consoles at
the Sheriff’s office Dispatch center.
SNMP-based Network Management System
Interoperability gateway for interfacing the VHF Paging systems into the P25 network
A push-to-talk over cellular BeOn system at no additional cost that will allow users to access the
new LMR system via their smart phone, personal computer or tablet
Description of the System Offering The Harris network is an APCO Project 25 (P25) Phase 2 trunking technology, which is based on the
VIDA (Voice Interoperability Data Access) platform. VIDA provides a unified network which supports
multiple applications and future growth capabilities. In addition, all these applications run on the same
network, which allows for ease of remote management, distributed fault tolerance and an investment for
the future.
Unsolicited PPEA Proposal for P25 Radio System Middlesex County, Virginia
November 2014
P25 Phase 2 System Page 2
Figure 1. System Overview Block Drawing
Unsolicited PPEA Proposal for P25 Radio System Middlesex County, Virginia
November 2014
P25 Phase 2 System Page 3
Unsolicited Conceptual Proposal – P25 Phase 2 System (Option 2)
Introduction
As an alternate “regional” approach, Harris has also designed a conceptual proposal that will join
Middlesex County and King and Queen County together in a “regional” system.
The comprehensive system described herein includes:
Redundant High Availability VIDA Premier Core that will allow continued expansion in the
event the more neighboring Counties would like to join the system
Six site, UHF linear simulcast P25 Phase 2 LMR
system that will provide extensive coverage throughout
both Middlesex and King and Queen Counties
Distributed IP Control Point with dual site redundancy
Four Trunked Talkpaths
IP-based MPLS microwave network configured in a
redundant loop configuration.
Conventional three site simulcast system for tone and
voice VHF paging.
New dispatch system in Middlesex County with three
Symphony consoles at the Sherriff’s office Dispatch
center and three Symphony consoles at the Courthouse
Dispatch center in King and Queen County
SNMP-based Network Management System
Interoperability gateway for interfacing the VHF Paging systems into the P25 network
A push-to-talk over cellular BeOn system at no additional cost that will allow users to access the
new LMR system via their smart phone, personal computer or tablet
Description of the System Offering The Harris network is an APCO Project 25 (P25) Phase 2 trunking technology, which is based on the
VIDA (Voice Interoperability Data Access) platform. VIDA provides a unified network which supports
multiple applications and future growth capabilities. In addition, all these applications run on the same
network, which allows for ease of remote management, distributed fault tolerance and an investment for
the future.
Unsolicited PPEA Proposal for P25 Radio System Middlesex County, Virginia
November 2014
P25 Phase 2 System Page 4
Figure 2. System Overview Block Drawing
Unsolicited PPEA Proposal for P25 Radio System Middlesex County, Virginia
November 2014
P25 Phase 2 System Page 5
Overview
The P25 Phase 2 standalone system design provides the following benefits to the County:
No New Construction – Harris plans to reuse all existing shelters, power sources and towers
at the Jamaica, Saluda and Hartfield sites.
LMR Coverage – Through the use of
existing Sites at Jamaica, Saluda and
Hartfield, preliminary engineering designs
indicate Middlesex County will have 95%
coverage for outdoor portable and mobile
radio communication providing a
minimum Delivered Audio Quality (DAQ) 3.4 for both outbound (talk-out) and inbound
(talk- in) communications. NOTE: Although the County indicated a site in the Deltaville
area, Harris does not require a site there in order to meet the Counties coverage of areas
around Stingray Point
Conventional Paging Coverage – Through the integration of Middlesex County’s current
VHF paging antenna system and a new Harris VHF simulcast paging system, Harris
preliminary engineering designs indicate that Middlesex County will have outdoor pager
coverage of 95% providing a minimum
Delivered Audio Quality (DAQ) 3.0.
1 % GOS with Phase 2 - Complete
Countywide simulcast design at Phase 2
assures sufficient capacity to achieve a
1% GOS with a maximum one second
call hold time throughout the County.
P25 Phase 1 and Phase 2 Compatibility – The P25 radio system and network supports
efficient use of both Phase 1 and Phase 2 radios from any manufacturer. While the proposal
provides the advanced capabilities of Phase 2 operation from the start, it equally supports
older Phase 1 operation for interop agencies from neighboring counties, legacy and mutual
aid users who may still be operating “Phase 1-only” capable terminals.
• The P25 network solution is configured to operate in both Phase 1 (FDMA) and Phase 2
(TDMA) modes. Each channel can
change modes with each call.
•
Agencies will have reliable public-safety grade coverage where and when they
need it.
Simulcast throughout the County improves portable coverage for first
responders.
Only Harris offers EDDM, where a single call can transmit simultaneously in both
Phase 1 and Phase 2 modes.
Unsolicited PPEA Proposal for P25 Radio System Middlesex County, Virginia
November 2014
P25 Phase 2 System Page 6
Unsolicited PPEA Proposal for P25 Radio System Middlesex County, Virginia
November 2014
P25 Phase 2 System Page 7
What is especially important is that when you need your system most, only Harris allows
your officers and dispatchers to maintain their standard operating procedures during a crisis so that
they can focus on their jobs instead of fumbling around with their communications equipment.
Interoperability with other P25-Compliant Systems – An option of an ISSI interface
allows a feature-rich connection to other P25 systems. Unlike other vendors’ solutions, the
Harris ISSI allows Phase 2 operation on the Middlesex County system even when Phase 1
users are interoperating via ISSI on the neighboring RF system(s).
Unsolicited PPEA Proposal for P25 Radio System Middlesex County, Virginia
November 2014
P25 Phase 2 System Page 8
IP Based Microwave System – A fully compliant IP based microwave backhaul network has
been designed to provide the following:
• Ultra High Capacity – 150 Mbps capacity
• High Reliability – The IP based microwave network employs ring architecture to achieve
the County’s reliability/availability goals across the backhaul network.
Standards-Based P25 Voice and Data – The network provides standards-based P25 data
supporting essential functional requirements such as Over The Air Programming (OTAP),
Over The Air Rekeying (OTAR), and Automatic Vehicle Location via GPS data.
Next-Generation, Mission-Critical Consoles – Harris’ new dispatch solution (“Symphony”)
offers the following:
• An “Award Winning” next-generation user interface that is more easily configurable and
provides greater simplicity of use than other consoles.
• An “Award Winning” hardware platform with a smaller footprint and quieter, more
reliable operation with no moving parts such as fans or hard drives; designed to provide
10 year MTBF reliability.
• Patent Pending Baton application that allows a Symphony console to display and be
controlled on Symphony dispatch consoles on a single CAD screen, thereby facilitating
dispatcher training and ease of migration to the new system.
BeOn® Cellular Integration – The industry’s only P25 cellular interface, Harris BeOn
technology brings distinct advantages to Middlesex County’s system:
• Included at no extra charge.
• Provides P25 PTT operation enabling direct smart phone communication with the P25
network using the same P25 talkgroups.
• Extends the range of the County network into a worldwide accessibility footprint.
All the features listed above bring real value to the Middlesex County community and establish a
feature-rich user environment. These features, coupled with Harris’ extensive experience in the
deployment and operation of public safety and military radio systems, make Harris the County’s best
choice to design, implement and maintain the new P25 network. Harris’ Land Mobile Radio network
experience spans a wide variety of customers, including:
10 statewide/province-wide public safety communication systems currently operating in the
U.S. and Canada
Spotsylvania County, Pittsylvania County and Region 2000 (Amherst County, Bedford
County, City of Lynchburg) in Commonwealth of Virginia
Four large utility systems whose communication footprints span multiple states
More than 100 operational P25 systems including P25 Phase 2 systems
Harris-owned and operated, mission-critical MPLS data network that provides nationwide
interconnectivity and supports critical operations at more than 3,000 airports
Unsolicited PPEA Proposal for P25 Radio System Middlesex County, Virginia
November 2014
P25 Phase 2 System Page 9
Site Equipment
Overview Harris included in its conceptual proposal to Middlesex County, site equipment that is all new, of
high quality, designed to provide high reliability to support mission critical communications, and in
current production. The site equipment, or RF infrastructure, consists of system and site control
equipment, simulcast equipment, receiver voting, base station equipment, and RF antenna systems.
System and Site Control Equipment The Harris VIDA core is responsible for controlling all voice and data channels in the system during
normal modes of operation. This equipment is fully APCO P25 compliant. Harris plans to install the
VIDA core equipment at Saluda site. Harris has included the following equipment:
Application High Availability (HA) VIDA core including
Redundant routers Network Clock
Simulcast Equipment Harris has proposed its state-of-the-art Distributed Control Point (DCP) for Middlesex County’s P25
system. This subsystem provides all necessary simulcast components and signal processing elements
required to optimize voice quality in coverage overlap areas. Harris has adjusted the timing
parameters of the system to minimize delay spread timing within the County boundary.
DCP does not require dedicated control point / prime site equipment. DCP is a software function that
resides in the traffic controllers and baseband modules at the RF site(s). As such, the simulcast
equipment is zero-footprint and fully redundant. DCP is licensed based on the number of DCP
capable sites desired. Harris is providing DCP capability at two sites in the Middlesex County system.
For the analog VHF paging system, traditional control point equipment is required. In this conceptual
design, the control point / prime site equipment is installed at the Saluda Site. This equipment is
comprised of an Intraplex NetExpress Multiplexer with Synchrocast3 Timing module. Alignment
equipment is also co-located with the control equipment.
Receiver Voting Receiver voting functionality for the P25 system is a software function built into each channel within
the simulcast system and is activated within the site acting as the control point. There are no
dedicated comparators, thereby eliminating potential failure points found in older simulcast systems.
Each received call is independently processed, divided real-time and voted on a 20msec interval to
ensure maximum voice quality.
As the analog VHF paging system is transmit-only, there are no receiver voters.
Base Station Equipment All of the Base Station equipment proposed for the Middlesex County system is solid-state in design
and functions with standard site conditions for temperature, altitude, and humidity. The equipment
also complies with Part 90 of the FCC Rules and Regulations, as well as appropriate EIA and similar
agency standards and is FCC-type accepted for the UHF frequency band. The NetSentry device has
alarm contact interfaces that provide status inputs to a separate alarm system. All subsystems have
Unsolicited PPEA Proposal for P25 Radio System Middlesex County, Virginia
November 2014
P25 Phase 2 System Page 10
been engineered to be as compact as possible and use with mounting configurations for standard relay
rack or cabinets.
Harris has proposed the following Base Station Equipment at the P25 sites:
Site Access Router/ Site Access Switch
Network Sentry
MASTR V Base Station – P25 Phase 2 UHF with integrated Traffic Controller and Baseband
Modules
• Traffic Control Module
• GPS Oscillators
Harris has proposed the following Base Station Equipment at the VHF paging sites:
MASTR III Base Station (transmit only)
NetExpress Multiplexer with Synchrocast3 Timing Module BeOn
Harris’ BeOn software interoperability solution allows PTT communications via existing commercial
cellular 3G and 4G broadband data and Wi-Fi networks. This solution is compatible with Apple®
iOS™ and Google ® Android ™ devices and provides access to P25 system talkgroups.
BeOn Group Communications The BeOn group communications suite was developed to extend traditional Land Mobile Radio
(LMR) Push-to-Talk (PTT) communication services to users on commercial cellular and private
broadband networks. With BeOn, voice communication services are delivered to subscribers as voice-
over-IP data packets using wireless broadband IP data services. Because BeOn abstracts the traditional
LMR functionality into a software-based network data service, BeOn can run across a variety of IP-
based broadband networks. The two primary deployments of BeOn are on 3G commercial cellular and
private public safety LTE networks. Using BeOn, subscribers on a cellular or public safety broadband
network can communicate amongst themselves or with interconnected LMR users.
BeOn goes beyond LMR by providing integrated voice, text messaging and location services. Using
BeOn, first responders can use the coverage and bandwidth of a broadband data network for
instantaneous communication capabilities between team members. In addition to broadband users,
BeOn subscribers can seamlessly interoperate with users on existing public safety LMR systems.
BeOn users can exchange text messages with other subscribers and dispatchers, and pass real-time
location and presence information between connected team members and the dispatcher’s CAD
system. With BeOn, subscribers improve their ability to respond to both routine and catastrophic
events because critical information about the response is both communicated and available.
Transmitted voice and text messages are both communicated in real-time, and are available locally on
subscriber handset for later recall. When these communications are combined with the integrated
mapping and presence (subscriber status) information, first responders can determine the most
efficient actions to address incidents.
Because BeOn operates over both commercial cellular and public safety LTE networks, utilizing these
networks provides an additional level of redundancy to mission-critical narrowband communications.
This extends the network coverage of a regional, statewide, or nationwide network to the global reach
Unsolicited PPEA Proposal for P25 Radio System Middlesex County, Virginia
November 2014
P25 Phase 2 System Page 11
of commercial cellular. BeOn subscribers on broadband networks are cost effective to deploy for both
mission critical and non-mission critical communications. Subscribers on these networks can quickly
be provisioned with a wide range of services, including end-to-end encrypted voice communications.
BeOn Network Overview BeOn directly integrates broadband group communication services into the LMR and LTE networks.
BeOn leverages the proposed VIDA core packet switching services, network management and
subscriber administration services with the addition of blade servers which host the BeOn Access
Point and Assignment Server applications:
• BeOn Access Point (AP) – The BeOn AP is the primary point of contact for BeOn
subscribers interfacing with the NSC. The AP proxies for all BeOn subscribers to the
network, mapping the traditional PTT services of the LMR network to the BeOn users
running the subscriber application. Each BeOn network, depending on loading and
topology, needs one or more APs to support subscribers within a given region.
• BeOn Assignment Server (AS) – The BeOn Assignment Server (AS) acts as the “home”
server for BeOn clients registering onto the system. The AS determines which BeOn AP
should serve each unique subscriber, and manages movement of subscribers between APs
when system conditions or roaming warrant changes. In most installations, the BeOn AS
and the BeOn AP run on separate blades together in the same physical server. Both the
BeOn AP and BeOn AS can be deployed in clusters (multiple servers) for both load
balancing and redundancy purposes.
BeOn over Private Broadband Networks Because BeOn is optimized to operate on 3GPP networks, the solution can also be used to provide
LMR voice services over private broadband networks such as the envisioned nationwide public safety
700 MHz LTE network. In the case of a private broadband network, the concept of an APN is
generally not required, as the complete network is a “private network” and the wireless network
termination point is not needed. In this case, the BeOn infrastructure will be connected to the same
network as the LTE core. In the event that the BeOn user agency is separate from the agency that is
operating the nationwide private broadband network, the APN concept that is used for commercial
carriers can be applied, and the private broadband network can be treated as a high reliability wireless
carrier to the agency BeOn traffic.
The BeOn Subscriber Application The BeOn subscriber application operates on selected Android devices. Because not every Android
device is optimized for PTT voice services, Harris engineering has selected the appropriate platforms
and, based on performance testing of the BeOn application, has approved the use of BeOn on a range
of Android devices. Key requirements for successful integration of the BeOn subscriber application
include suitable audio handling (in particular loud, distortion free receive audio propagation and
suitable microphone sensitivity), a touch screen display with a minimum 480x600 pixel resolution,
and an accessible button on which to map the PTT function. Harris has successfully implemented the
BeOn application on both consumer-grade Android devices, hardened Android devices, and iOS
devices.
Unsolicited PPEA Proposal for P25 Radio System Middlesex County, Virginia
November 2014
P25 Phase 2 System Page 12
Figure 4. BeOn Subscriber Equipment
The BeOn subscriber application allows the user instant access to voice, presence, mapping and text messaging features on supported Android platforms that vary from consumer grade to fully
environmentally hardened.
The BeOn subscriber application allows the user to select an active talkgroup to monitor, or if desired,
the user can scan multiple talkgroups. The BeOn subscriber application maps the PTT function to an
appropriate hardware button on the subscriber device, allowing users to instantly communicate with
their selected talkgroups. Received calls are temporarily stored locally on the device, so a user can
replay a missed call or series of calls as required. In addition to group communications, the BeOn
user can also communicate directly with individual subscribers by selecting a user from a contacts list
or entering a subscriber identification number.
The BeOn application also allows users to declare an emergency or distress condition. Declaring an
emergency on the BeOn subscriber devices elevates the priority of the calls throughout the BeOn and
connected LMR networks. The BeOn subscriber will also receive the emergency declarations from
other users. The emergency status of a talkgroup, user, or recorded transmission is visually denoted on
the subscriber display. If desired, specific BeOn subscribers can be configured by the system
administrator to act in a supervisory role, clearing emergencies that have been declared by other users.
Going beyond traditional voice services, the BeOn application provides easy access to presence (or
status) updates, group member location information, and group text messaging. The BeOn user’s
presence (available, silent, etc.) and location updates are transmitted to network and made available to
other members of the group so that each member of the group is aware of the other users’ locations
and presence states.1
BeOn Subscriber Feature Set BeOn provides a feature-rich user experience, augmenting traditional voice-based PTT services with
capabilities enabled by a broadband connection. BeOn allows users with broadband devices to
seamlessly interoperate with LMR user, supporting the following P25 voice features.
1 All of these features require the appropriate network infrastructure (as described previously) to support the feature
on the subscriber device.
Unsolicited PPEA Proposal for P25 Radio System Middlesex County, Virginia
November 2014
P25 Phase 2 System Page 13
Figure 5. BeOn Subscriber Features
BeOn Voice Feature Description
Group voice call (clear and encrypted)
BeOn users can initiate and receive group calls with users on both broadband and LMR networks. BeOn users receive the P25 subscriber
identifications (SUIDs) from all users, which are mapped in the subscriber device with aliases. BeOn users can participate in both clear
and encrypted group calls using P25 AES encryption.
Individual voice call (unacknowledged and acknowledged, clear and encrypted)
BeOn users can initiate and receive individual calls with users on both broadband and LMR networks. BeOn users initiate and receive individual calls using P25 subscriber identifications (SUIDs) or
subscriber aliases. Supported modes include both unencrypted and P25 AES encrypted calls. BeOn also supports both P25
unacknowledged and acknowledged individual calls.
Emergency/distress indication
BeOn users can initiate an emergency/distress call on the BeOn subscriber, and will receive emergency indications when other users
declare an emergency. BeOn users provisioned with supervisory privileges can clear emergency declarations. Within the BeOn network
and across connected LMR networks, emergency calls
have the highest level system priority.
Announcement Group Calls BeOn talkgroups are associated with a P25 announcement group, allowing dispatchers and other users to communicate with multiple
groups simultaneously.
Instant Recall/Call Logging
BeOn subscribers temporarily record incoming and outgoing calls on their device, allowing users to replay missed calls. Calls are
recorded in Event Logs, which group transmissions into
“conversations” to simplify replay.
Console/Supervisory Override Console dispatchers and supervisory users can override a call-in-
process
Talkgroup Scanning
The BeOn application allows subscribers to scan multiple talkgroups. Each user can select up to 16 talkgroups to monitor. BeOn talkgroup scanning allows the subscriber to designate talkgroups with priority, allowing a higher priority talkgroup call to interrupt a lower priority
talkgroup call.
Console Patch/Simulselect BeOn subscribers can participate in console patched talkgroups, or
receive console simulselect calls.
P25 Confirmed Call (with connected LMR (network)
BeOn subscribers can initiate P25 confirmed calls, where the network will check to ensure that narrowband LMR members of the talkgroup have access to a working channel before issuing the “talk” beep. With
P25 confirmed call, users on the BeOn network will be queued if narrowband working channels are not available to complete the call to
LMR users.
Unsolicited PPEA Proposal for P25 Radio System Middlesex County, Virginia
November 2014
P25 Phase 2 System Page 14
BeOn Voice Feature Description
Priority/Preemption support
BeOn supports multi-level call prioritization and preemption throughout network. When call volume exceeds capacity (primarily on the
narrowband network), BeOn calls will queue or preempt based on network priorities and policies.
P25 OTAR Key Management
BeOn subscribers can be included in OTAR crypto-nets, allowing BeOn subscribers to have encryption keys managed by the network Key
Management Facility (KMF). When a crypto-net is rekeyed, the BeOn subscribers are sent new keys using P25 encrypted Key Management
Messages from the KMF.
BeOn also provides advanced group communication features that enable situational awareness for
BeOn users. These advanced features take advantage of the inherent broadband connection between
BeOn devices, and the GPS capabilities of supported smart phones. With BeOn, subscribers
automatically exchange location and status information, allowing users to monitor the presence and
availability of other group members.
Figure 6. Be On Group Communication Features
BeOn Group Communication Feature Description
Group location GPS coordinates of group members are automatically exchanged and mapped on the BeOn mapping application.
User presence indication
The icons used by the BeOn subscriber application to display the group members’ location also display the members’ current status. This
combination of location and status is referred to as presence, and it provides BeOn users with a snapshot of situational awareness about the group. Individual subscribers have a choice of multiple status conditions
including:
Available
Silent/covert – received audio is recorded to the Event Log but
speaker output is muted
Emergency/distress
Unavailable/busy
Location Privacy A user may disable transmission of location/presence information if
required.
BeOn Text Messaging
BeOn users may directly communication with each other using the internal text messaging feature. BeOn text messaging allows the text messages to be included in the Event Log along with recorded audio
conversations.
Unsolicited PPEA Proposal for P25 Radio System Middlesex County, Virginia
November 2014
P25 Phase 2 System Page 15
The BeOn User Experience The BeOn subscriber application fully leverages the capabilities of the Android operating system and
uses discrete buttons on the supported hardware platforms. The BeOn subscriber application provides
intuitive and distinguishable icons for core functionality, with features driven through use of the
Android touch screen. For ease of access, the Push-to-Talk function is mapped to a specific hardware
button on each device.
The BeOn Home screen shows the currently selected talkgroup, scan operation, connection status and
the user identification of incoming calls. Using the tabbed interface, the user can select the Groups
screen to change talk groups, the Contacts screen to communicate individually with other BeOn users,
the Events screen to replay missed conversations, and the Scan screen to select and manage scan lists.
Other icons on the display provide access to Presence/Status updates and the Location services.
Figure 7. BeOn Subscriber Application
The BeOn subscriber application has an intuitive user interface which provides quick access to
multiple communication modes.
Unsolicited PPEA Proposal for P25 Radio System Middlesex County, Virginia
November 2014
P25 Phase 2 System Page 16
Unsolicited PPEA Proposal for P25 Radio System Middlesex County, Virginia
November 2014
P25 Phase 2 System Page 17
Unsolicited PPEA Proposal for P25 Radio System Middlesex County, Virginia
November 2014
P25 Phase 2 System Page 18
P25 VIDA Network Reliability Matrix The key to system availability is in understanding system failures, and what the consequences are to Mean
Time To Repair (MTTR). For example, all of the VIDA networking equipment in the signal chain is
configured as a ring such that a complete failure of one node will not cause a complete system failure.
Figure 8 below has been compiled to help evaluators understand possible failure modes, the effects of
those failures, and backup plans proposed to mitigate the effect of the failure.
Figure 8. Reliability Matrix
Failed System
Component
Failure
Scenario Effect Backup Plan Recovery Plan
Primary Network Switching Server
VM COMPLETE
Secondary Network Switching Server takes
control of system. System continues to
operate normally.
NONE REQUIRED. Call processing operates normally.
Repair Regional VIDA Primary Management
Server
Unsolicited PPEA Proposal for P25 Radio System Middlesex County, Virginia
November 2014
P25 Phase 2 System Page 19
Failed System
Component
Failure
Scenario Effect Backup Plan Recovery Plan
Regional Network Manager VM
COMPLETE
Lose ability to collect information from
devices from each of the regional networks.
Call processing operates normally.
NONE REQUIRED. Call processing operates normally
Repair RNM
Unified Administrative
System VM COMPLETE
Lose ability to configure devices on
the network. Call processing operates
normally.
NONE REQUIRED. Call processing operates normally
Repair UAS
Ethernet Switch COMPLETE Backup Ethernet
Switch routes information.
NONE REQUIRED. Call processing operates normally.
Repair Ethernet switch
Ethernet Router COMPLETE Backup Ethernet
Router routes information.
NONE REQUIRED. Call processing operates normally.
Repair Ethernet Router
Distributed Simulcast Control
Point
1) Lose a ControlPoint on a
simulcast cell
DCP will rollover to secondary Control
Point
NONE REQUIRED. The simulcast architecture does not propagate failure through the
rest of the system.
System automatically returns to normal
operation when failure corrected.
2) Lose access toa site
Lose coverage of affected site or
implement Bypass so that site trunks as an
orphan site. Call processing operates
normally.
Overlap coverage from other sites.
System automatically returns to normal
operation when failure corrected.
P25 Sites 1) Traffic
Controller Module
One Channel of capacity lost. Trunking features still intact. No
coverage lost. If Control Channel, then automatically moved to
another controller.
NONE REQUIRED, System continues to operate normally. May have greater number of
queued calls.
System automatically returns to normal
operation when failure corrected.
Unsolicited PPEA Proposal for P25 Radio System Middlesex County, Virginia
November 2014
P25 Phase 2 System Page 20
Failed System
Component
Failure
Scenario Effect Backup Plan Recovery Plan
2) COMPLETELose coverage of
affected site. Overlap coverage from other
sites.
System automatically returns to normal
operation when failure corrected.
Simulcast Fault Tolerance Any simulcast system requires one operational simulcast control point and multiple TX sites. The Harris
DCP architecture provides the control point functionality through software within the site equipment at each
site, providing both hardware and geographic redundancy. This is different than most vendor designs where a
centralized CP is used and failure of the CP usually results in the cell going into a bypass (significantly
altered state of operation) configuration. The Middlesex County system has been designed with a Primary
and Single Secondary Control Point.
Base Station/Channel Failure In a simulcast system, each TX site has the same number of base stations or channels. If a base station
fails, the corresponding base station (same channel number and frequency assignment) is taken out of
service at all other sites. The remaining channels still support all of the operations previously discussed.
Overall reliability is thus enhanced since the loss of a channel will only reduce total capacity; it does not
affect the system’s functionality or coverage. Unlike other simulcast systems that may restrict the control
channel to a subset of channels, with Harris’ design, any base station can be the control channel, which
provides the County with additional fault tolerance.
Simulcast Redundancy Distributed processing, as well as component and
subsystem redundancy, is used in the simulcast
system design. This architecture provides extremely
fault-tolerant operation, entering into “graceful degradation” operation only as a last resort. With Harris’
Distributed Control Point technology, a single control point failure will not affect the simulcast system or
coverage performance.
GPS Receiver Redundancy – Simulcast system timing and synchronization is accomplished
using redundant GPS receivers. In addition, redundant timing and synchronization modules are
utilized. If a GPS receiver or a timing and synchronization module fails, the redundant subsystem
is automatically switched into operation.
Power Supply Redundancy – The DCP and Site equipment can also be configured to use
multiple or redundant power supplies. This redundancy provides protection from power surges,
protection from short circuits, power output alarms, and supports load sharing. If a power supplyshould fail, the redundant supply takes over automatically.
There is no loss of coverage as a result
of losing a control point
Unsolicited PPEA Proposal for P25 Radio System Middlesex County, Virginia
November 2014
P25 Phase 2 System Page 21
Backup Power -Each site is equipped with UPSs and dual power supplies (or batteries and
rectifiers for DC powered versions) and a backup generator to assure that main power is alwaysavailable. NSC and Dispatch locations will be equipped similarly to avoid any power outage.
Bypass Mode The power of distributive processing is also exploited through the use of a Bypass Mode in Harris’ P25
simulcast systems. Should multiple failures disable all of the control points, the simulcast system is
capable of reconfiguring itself to operate in the Bypass Mode. The pre- planned Bypass Mode
configuration defines which transmit sites will continue to operate as stand-alone trunked radio sites, and
how many of the channels assigned to the simulcast system will be allotted to each isolated site. Other
simulcast systems revert to conventional operations at each site when control point failures occur.
In Bypass Mode of operation, all field users within the coverage provided by each operational isolated
transmit site can continue to communicate with one another locally in the trunking mode.
Distributed Processing Architecture All VIDA network systems use distributed processing architectures to provide unsurpassed fault tolerance.
This design philosophy concentrates on avoiding any single point or common-cause failure that will force
the system to non-trunked operation. A crisis situation is the worst time to lose the call capacity and
advanced features that trunking provides. The trunking control of a VIDA system resides with each
individual repeater station. If a station completely fails, the distributed processing capabilities of the
system automatically take that base station out of service. These stations are interconnected, which permits
sharing of control information among them, and allows the remaining stations to continue trunking. This
operation is transparent to the end-user. Other systems which rely on a site controller computer are
vulnerable to failures that can cause the site to revert to a failsoft mode, thereby forcing the radio user to
suddenly operate in conventional mode.
Autonomous Layers The concept of autonomous layers is simply that each layer of the network is defined to have a stand-alone
goal or purpose, independent of the layers above it. By designing systems under this concept, failures are
confined to the affected equipment, and do not spread to other parts of the network.
Integrated Data Options (OTAP/OTAR)
OTAP - Option Harris’ Over-The-Air Provisioning (Programming) “ProFile” feature provides the capability to read and
write P25 radio personalities over the air. In operating and maintaining a trunking system, the system
administrator periodically must change the personality of field radios. Most of the changes deal with group
structure, special call lists, radio operating parameters, and changes/additions to the configuration of the
trunked system. In the past, the logistics of locating and reprogramming radios has been very time
consuming and labor intensive. ProFile provides tremendous improvement in radio programming
efficiency and flexibility.
Unsolicited PPEA Proposal for P25 Radio System Middlesex County, Virginia
November 2014
P25 Phase 2 System Page 22
Design Features ProFile's execution is self-contained in the radio software and hardware, without an external data device
attached to the radio. OTAP is accomplished with ProFile Manager, which was developed to make
wireless programming simple and easy to perform. ProFile Manager sends and receives information
to/from radios via P25 packet-data.
The radio displays a unique status indicator when the radio enters the ProFile mode. The user can interrupt
the programming process if necessary simply by depressing the Push-To-Talk (PTT) button or declaring
an emergency. ProFile may also be disabled via the radio menu. Once a radio personality update is
successfully completed, the radio automatically resets itself, switches to the new personality, and returns to
normal operation. If reprogramming is unsuccessful, the radio continues to operate using the existing
programming settings. ProFile Manager informs the operator of the status.
Operational Features The basic functions of the ProFile Manager are to:
Provide a GUI-based user interface
Packetize personality data
Place a sequence of data calls via a data interface to send the entire personality file
Keep track of the sequencing and the re-sending of blocks after failed attempts
Display a status to the operator during and upon completion of the sending process
To program a radio over the air, ProFile places a series of individual data calls to the radio. OTAP data is
sent over a working channel, so OTAP “push times” depend on the complexity of the personality file
being pushed down to the radio. Radios are programmed sequentially; hence the higher the radio count in
the batch being programmed, the longer will be the time required to perform the OTAP operation. The
hardware/software required for the infrastructure to support OTAP has been included. The subscriber unit
feature is listed as an option with the unit terminal pricing.
Programming non-Harris Radios via OTAP P25 standards did not address specific radio designs in order to maintain competitiveness in the terminal
markets. This allows vendors to design and produce radios that can communicate in mixed vendor
environments while maintaining potential competitive advantages. While all systems are required to send
OTAP messages in a certain way, every radio vendor has a different way of writing their internal code
such that, in mixed vendor environments, the programming software is unique to a given vendor. In order
to reprogram a non-Harris radio, the State would have to buy the specific vendor’s OTAP software along
with their radios. Harris has been successful in implementing third party OTAP servers on a Harris
network.
OTAR - Option The proposed radio system is hardware ready to support P25 DES and AES encryption and Over the Air
Re-keying (OTAR) via the Key Management Facility Server. The Key Management Facility (KMF)
Server consists of a computer and key management software that provides Over- the-Air-Rekeying
(OTAR) and related key management services to P25 subscriber units. The UAS interfaces with the KMF
through its KMF UAS Interface. The UAS notifies the KMF of database changes. The KMF retrieves the
database changes through the UAS/KMF interface.
Unsolicited PPEA Proposal for P25 Radio System Middlesex County, Virginia
November 2014
P25 Phase 2 System Page 23
No additional costs will be incurred to prepare the installed infrastructure for encryption use of OTAR or
DES encryption.
Re-keying Non-Harris Radios Unlike OTAP, the Harris KMF can be used to re-key any vendor’s radio as long as they are following the
P25 specification.
Grade of Service (GoS) – Trunked System Harris has taken the requirements set forth in the Statement of Requirements and performed an analysis on
traffic to ensure we meet and exceed the County’s needs.
Traffic Analysis When designing the radio communications system, Harris carefully considers the expected radio traffic
load of the users and matches the system channel capacity at the sites to provide the desired performance.
For voice traffic, the load is measured in Erlangs, and performance is typically described by Grade of
Service (GoS). The mathematical tool used to estimate a queued radio system call performance is referred
to as Erlang C analysis.
Erlang C Analysis Erlang formulas have been applied to voice traffic engineering for many decades. Erlang B is used for
blocking systems such as the telephone system, where if resources are not available a call gets a ‘busy’ and
fails. The appropriate calculation for trunked radio systems is called Erlang C. Erlang C analysis provides
a theoretical basis to estimate radio system performance for any non-blocking, queuing system. Harris
trunked radio systems are non-blocking, which simply means that if channel resources are not available a
call will be placed in a queue until resources become available and it can be serviced. Harris applies
multi-level priority to calls in queue, so that the most important calls are serviced first.
Traffic Analysis Terms An Erlang represents a volume of voice calls, equivalent to one continuous voice stream without
interruption. One Erlang represents one hour’s worth, or 3600 seconds, of voice. As an example if
a user makes 6.76 calls per hour and each call has a 3.2 second duration, the load is 6.01 mErlang
(thousandths of an Erlang).
The Busy Hour is the one hour period when the radio system has the heaviest amount of use, or
traffic load. Radio system capacity is designed to meet performance needs based upon the
expected load during the busy hour.
A PTT (push-to-talk) spurt is a segment of voice starting with the channel grant tone and ending
with the release of PTT.
In Transmission Trunking each call consists of one PTT spurt.
In Message Trunking a call can consist of multiple PTT spurts which originate from various
users, with intervening hang times. Channel use is less efficient than transmission trunking
because the string of calls and their hang times result in longer call durations. However as the
channel is dedicated to the call, channel resources are guaranteed while the call is in progress.
Unsolicited PPEA Proposal for P25 Radio System Middlesex County, Virginia
November 2014
P25 Phase 2 System Page 24
Call Duration is the length of time the radio channel is dedicated to a call. In transmission
trunking systems this is the duration of one PTT spurt. In message trunking systems this can
include many PTT spurts with intervening hang times, and as a result message trunking call
durations can be quite long.
Hang time is the maximum allowable duration of time between PTT spurts where a working
channel is allocated to a message trunked call.
Over many years Harris compiled traffic statistics from many customers, and used these statistics to
develop a traffic load models for public safety, utility, and transit users. For example, the public safety
industry this load model is an average transmission trunking call duration of 3.2 seconds and average load
per user of 6.01 mErlangs.
Transmission Trunking versus Message trunking Each talkgroup can be configured either as message or transmission trunked in Harris radio systems. For a
transmission trunking, each PTT spurt is considered a call and is trunked independently. The benefit of
transmission trunking is that is provides a more efficient use of system resources.
Message trunking combines a string of PTT spurts together on a single working channel through the use of
an allowable hang time between PTT spurts (or calls) on a talkgroup. This occurs when a user sends a
voice call, then users respond in a sequence of exchanges. As long as the exchanges occur within the
allowable hang time provided by the talkgroup, the calls all occur on one system channel. The benefit to
message trunking is that it ensures a sequence of calls may occur on a specified talkgroup by reserving the
channel.
Harris recommends transmission trunking for all traffic except emergency calls rather than message
trunking. Transmission trunking provides more efficient use of the system’s radio channels. Hang time is
wasted system resource time. There is no hang time in a transmission trunked scheme. A comparison of
call duration between message and transmission trunking is shown in Figure 9.
Figure 9. Transmission vs. Message Trunking
Transmission Trunking Message Trunking
3.2 s 3.2 s Inbound PTT Spurt
1.0 s Hang Time
3.2 s 3.2 s Outbound PTT Response
2.0 s Hang Time
6.4 s 9.4 s Total Call Duration
As shown in Figure 9, a very simple message trunking conversation might consist of a 3.2 second inbound
PTT spurt, followed by a one second pause, then a similar response from the dispatcher or another user.
After the completion outbound PTT response, there is one last (two second) hang time, then the call ends.
The hang times increase the average length of the PTT spurts from 3.2 seconds to 4.7 seconds. The
average load per user increases from 6.01 mErlangs to 8.83 mErlangs. In this scenario, a transmission
trunking scheme supports about 50% more users than message trunking.
Figure 10 compares the number of users and talkpaths required under a transmission and a message
trunking operation.
Unsolicited PPEA Proposal for P25 Radio System Middlesex County, Virginia
November 2014
P25 Phase 2 System Page 25
Figure 10. Transmission Trunking and Message Trunking
Performance - Grade of Service Voice trunking systems are usually specified with respect to Grade of Service (GoS) and Queue Time. The
grade of service is the probability that a call will be in the queue for longer than the queue time. For
example a typical public safety specification is 1% GoS and 0.0 seconds queue time. This means “no more
than 1% of the calls shall spend more than 0.0 seconds in the queue.”
There is a tradeoff between GoS and queue time, and the same system can be described with many pairs.
Radio system vendors often specify GoS without the queue time, or alternatively specify a tight GoS and a
loose queue time to give a favorable impression of system performance.
Data Traffic Analysis In a similar manner data traffic load can be estimated and analyzed. The caveat is that as data does usually
not follow the well known voice call statistics, there is less agreement on the mathematical models. For
example, AVL is largely a predictable periodic load rather than a random arrival process; Data
applications may have significant higher loads at shift change. OTAR key change operations are typically
scheduled to avoid busy times. Thus while the channel load can be calculated, it cannot be simply added
into the Erlang C calculations. In general Harris has found that data busy hour and voice busy hour
usually do not coincide – in fact data traffic typically decreases when voice traffic increases. When
analyzing total traffic performance, Harris conservatively takes all these factors into account.
Unsolicited PPEA Proposal for P25 Radio System Middlesex County, Virginia
November 2014
P25 Phase 2 System Page 26
Site Equipment
High Availability VIDA Core Harris understands critical communications must be reliable. When a Public Safety member keys a radio,
he or she must be heard. Harris reliability begins with the High Availability redundant VIDA Core. There
are two virtual Network Switching Servers (NSS) provided, which can be geographically separated
(option) for an additional layer of redundancy. The primary NSS will be located at the Clayton 911 Center
along with the Interoperability Gateways. The 911 Center will also house primary system management
resources and the simulcast control point equipment. Two NSS’s provide the ultimate in redundancy and
reliability and are effective in ensuring system integrity in the event of a catastrophic structure failure.
Figure 11. NSC Configuration Diagram
System Highlights Figure 12 shows key points of the Harris design and the benefits to Middlesex County.
Unsolicited PPEA Proposal for P25 Radio System Middlesex County, Virginia
November 2014
P25 Phase 2 System Page 27
Figure 12. System Highlights
Feature Middlesex County Benefits
Common IP infrastructure Reduces the amount of equipment needed which reduces system complexity and
maintenance costs.
End-to-End IP network Allows packet switching technology to efficiently route information using less
Maximizes flexibility because consoles can be located anywhere on the County WAN system. Consoles can quickly be re-deployed to alternate locations. This provides the County with flexibility to dispatch from temporary locations during
events or to relocate their dispatch center in catastrophic conditions.
High Availability VIDA Core Configuration By using the primary switching server and the redundant hot stand-by switching server, the County can achieve maximum accessibility and minimizes the risk of
downtime.
P25 Compliant with TIA 102 Project 25 trunking standards
Infrastructure that supports multiple vendor’s P25 compliant radios.
AES & DES Encryption Ready
AES provides P25 compliant security. P25 compliant encryption is the only encryption method provided by Harris ensuring any vendor’s terminals will operate on the network. Some vendors provide encryption that is not P25
compliant, interfering with the goals and benefits of the P25 standard.
Commercial-Off-The-Shelf (COTS) IP backbone
Reduces equipment cost and provides the flexibility to upgrade non- proprietary equipment as industry technology advances.
Interoperability solutions Enables interoperability with surrounding jurisdictions and eases the migration
from the County’s existing system.
Over-the-air-Programming (OTAP)
Saves time and money with infrastructure that supports radio personality reconfigurations in the field, over the air. OTAP avoids the time and cost
associated with physically bringing the radio into a service shop for reprogramming.
VIDA Architecture
The use of commercial-off-the-shelf equipment allows simple replacement with faster, more powerful hardware when upgrades are desired. Other systems employing proprietary hardware often require complete system replacement
when one or more of their components become obsolete.
Unsolicited PPEA Proposal for P25 Radio System Middlesex County, Virginia
November 2014
P25 Phase 2 System Page 28
In addition to P25 trunking, the network takes advantage of IP simulcast technology. Using integrated
controllers, IP simulcast eliminates the need for complex multiplexing equipment or interface timing.
Configuration stores in parameters allowing for faster optimization, better stability and easier adjustment.
Additionally, the control point fits in one rack of equipment, resulting in lower power consumption and
space requirements.
Access Servers: Cisco Routers and Switches The High Availability NSC consists of redundant commercial-off-the-shelf (COTS) Cisco Routers and
Ethernet Switches. The use of COTS products allows Middlesex County to affordably upgrade system
components when needed. With COTS, compatibility is maintained and equipment cost is reduced.
Regional Network Manger (RNM) The Regional Network Manager (RNM) provides access to the administrative and management tasks of
a VIDA network.
Unified Administration System (UAS) The Unified Administrative System is a Web-based application that affords system administrators the
ability to make modifications to system parameters from a web browser anywhere on the network. By
using the UAS, the administrator can modify database parameters such as an individual user’s priority, a
group of users’ priority, talkgroups, telephone-connect privileges, encryption properties, user access to
specific sites, etc.
The UAS is the centralized access point from which the P25 Phase is provisioned. It is an integrated, real-
time administration tool based on a client-server architecture that allows multiple authenticated user access
at any location connected to the network.
The UAS is platform-independent, scalable, and customizable, and supports any ANSI-92 compliant
Relational Database Management System (RDBMS). Java Technology permits the server to run on any
platform that supports the Java Virtual Machine (JVM). This allows the use of a commercial-off-the-shelf
(COTS) Web-browser for System Administrators to gain access to the UAS and permits low-cost PC
based terminals to be used for client access, as long as they have VPN access to the system or direct
network access.
Unsolicited PPEA Proposal for P25 Radio System Middlesex County, Virginia
November 2014
P25 Phase 2 System Page 29
Figure 13. UAS User Interface
The UAS provides a database of resource pools from which administrators may configure dynamic
provisioning properties for the NSS Voice Switch (VNIC) and Interoperability Gateways. The VNIC
maintains a number of databases that are managed through the UAS. Examples of UAS database controls:
Talkgroup Configuration – The VNIC maintains a database of talkgroups, each of which
may represent an individual user or collection of users. Talkgroup parameters include:
Group Number – 16-bit identification code for the group (one entry per group)
Group Name – Text name to display for the group (one entry per group)
Access Priority – One of 256 levels, (one is highest and 256 is lowest)
Channel Hang Time – In message trunking, this is the period after release of PTT that the
talkpath remains allocated to the previously active talkgroup. If no call ensues, the talkpath is
released on expiration of the hang timer (one entry per group).
Talkback Timer – The time interval after the end of a transmission within which the user
must respond to the call on that received talkgroup (one entry per group).
User IDs Each user on the network is assigned a unique user ID that is ultimately associated with an agency and
region. These assignments are managed by the administrator. The Unified Administration System
references the user ID to ensure the terminal/user is authorized, and to verify the user’s privileges. The
UAS recognizes the User ID as a 10-digit number, in hierarchical format, as shown in figure below.
Typically, the user ID is defined as a concatenation of the user’s home region, the agency or AOC that the
user belongs to, and the ID that identifies the individual user or radio. User IDs are unique and allow
features like “selective calling” – a call directly from one user to another.
Unsolicited PPEA Proposal for P25 Radio System Middlesex County, Virginia
November 2014
P25 Phase 2 System Page 30
Figure 14. User ID Format
Talkgroup Call Priority
While the Project 25 standard only requires eight levels of priority, the Harris P25IP
VIDA network
leverages the recently-used priority to allow 10 levels of priority, as well as additional priority levels to
support preferred use by recent users, emergency calls and “All Calls.”
The Talkgroup Priority Class defines the access, queuing and data priorities of a group and are assigned on
a per-talkgroup or voice group basis.
Device Manager and Active Directory Microsoft Active Directory (AD) will be the primary method of controlling access to Middlesex County’s
VIDA network. This centralized service will perform authentication and authorization of users and devices
to restrict unauthorized network access.
AD authentication is extended to UNIX servers with the integration of Quest Authentication Services for
Solaris and Linux operating systems, and to devices that do not support the protocols (e.g.,. Cisco) through
RADIUS.
Intraplex NetExpress Multiplexer – Control Point for Simulcast
Paging and Analog Gateway The Intraplex NetXpress LX multiplexer (IX-LX-300 IP) combines the technology of the original
NetXpress multiplexer. When equipped with the CM-30 IP module it functions as an “edge” device in
multisite networks.
The NetXpress LX system’s features include:
CM-30 IP interface module for IP connectivity into WANs and LANs
Compatibility with Intraplex NetXpress systems
Wide variety of audio, voice, and data interface modules
Optional echo cancellation for 2-wire voice circuits
Transport of two contact closures in each direction
Adjustable packet size
Programmable jitter buffer depth
Advanced Intraplex forward error correction
Unsolicited PPEA Proposal for P25 Radio System Middlesex County, Virginia
November 2014
P25 Phase 2 System Page 31
QoS priority tagging
Unidirectional or bidirectional unicast streaming
Unidirectional multi-cast streaming
Web browser user interface
SNMP control
Current and previous software revision storage
Network statistics monitoring
Event logging
The CM-30 IP interface module operates as the command module in a NetXpress LX multiplexer. In
addition, it can replace the network interface module in an existing T1 or E1 system, converting it to IP
while utilizing the existing chassis with all its audio, voice, and data modules. The CM-30 module easily
transitions an existing Intraplex T1 or E1 system to cost- effective IP transmission.
SynchroCast3 Timing for Simulcast Systems The SynchroCast3 system in the NetXpress LX multiplexer maintains the phase alignment of the
transmitted signals, using GPS technology to provide:
GPS-controlled carrier frequency synchronization
GPS-controlled precision audio phase alignment
Dynamic adjustments to compensate for network routing changes
The SynchroCast3 system sends timing reference signals along with audio content to the transmitter sites.
GPS receivers, placed at the origination point and transmitter sites, provide a timing reference. At the
transmitter, timing signals coming from the origination point (along with audio content) are compared with
the local timing reference. A precise amount of delay follows to correct the timing difference between
transport paths. On synchronization of the signals, the system operates automatically to keep the preset
delay constant. The SynchroCast3 system carefully controls the receive jitter buffers associated with the IP
streams, allowing multiple locations to deliver their stream data at the same instant.
Simulcast Equipment The Harris MASTR V IP Simulcast system is the most advanced P25 simulcast system in the industry.
Building upon the successful tradition of MASTR V IP Simulcast solution, Harris raised the bar with our
new Distributed Control Point (DCP) technology. This new and innovative technology allows any and
every site to function as a simulcast prime site. Harris has virtualized the prime site control point
capability into every channel in the simulcast system providing the ultimate redundant solution. With
DCP, any and every site in the simulcast cell can function as a prime site thus eliminating the need and
cost of prime sites. The Harris IP Simulcast design features:
Lower Total Cost of Ownership
Reduction in Capital Expenses - Reduced upfront capital investment for equipment
Lower Operating Expenses – By eliminating the need for a dedicated control point, DCP saves
the customer in ongoing operating expenses. Less equipment means less shelter space, lower
Unsolicited PPEA Proposal for P25 Radio System Middlesex County, Virginia
November 2014
P25 Phase 2 System Page 32
maintenance costs, reduced installation times, fewer spare spares, and an overall reduction in
footprint.
Designed for cost savings - To lower the upfront and total cost of ownership, the DCP technology
has been designed to utilize IP Layer 3 technology to reduce the bandwidth needs of the simulcast
sites. There is no need for large and expensive 10 or 100Mbps Ethernet links between “prime
site” locations. The MASTR V IP Simulcast solution has the lowest bandwidth requirements in
the industry for redundant simulcast offerings.
Flexible Configuration
Control point transition flexibility - Allowing for best in class operation, another advanced
feature designed for DCP was the ability for automatic and manual control point functionality
transitions. Because of the fully redundant simulcast architecture, this feature allows for
automatic failover in disaster situations or manual transition for scheduled preventive
maintenance. Each form of transition is transparent to the system and allows users to maintain
critical communications.
Remote configuration, setup and testing conducted via IP
Improved Redundancy
Multiple control point sites - Distributed Control Point Technology allows the potential for any
site to have control point functionality
Enhanced Simulcast Bypass Feature - First in industry, the MASTR V IP simulcast offers
another layer of redundancy by adding Enhanced Simulcast Bypass operation. This new
redundancy feature enables trunked wide area failsoft communications for any disconnected
simulcast site to continue operations on the VIDA system as a multisite site allowing for trunked
wide area communications while in simulcast failsoft operation. With this new redundancy
feature, radio users on a disconnected simulcast site still maintain trunked operations across the
entire VIDA system.
Enhanced Security
Enhanced Failsoft with Security - Adding further redundancy to the simulcast system, Harris
adds enhanced security features to the industry standard failsoft operation. With the Harris
solution, all simulcast sites operate in trunking mode and maintain full user and talkgroup
authentication regardless if it is attached to the simulcast cell or not. This ensures only authorized
users and talkgroup operate on the VIDA system.
Superior Voting Technology
Includes both Phase 1 and Phase 2 - Building on our “best in class” simulcast voice quality,
Harris has expanded our advanced voting technology to include both Phase 1 and Phase 2
operation.
Integrated voting technology - The IP simulcast solution integrates our superior voting
technology into every channel within the simulcast system.
Software based architecture - There are no dedicated comparators and the solution is completely
distributed across the overall system.
Unsolicited PPEA Proposal for P25 Radio System Middlesex County, Virginia
November 2014
P25 Phase 2 System Page 33
Superior voting technology - Each call is independently processed, divided real-time and voted
on a 20msec interval to ensure maximum voice quality.
Other industry leading benefits provided by the MASTR V IP Simulcast System include:
Smallest footprint in the industry, reduces power and cooling requirements
Linear Modulation, improves coverage and reduces site count
Supports Phase 1 and Phase 2 on any channel
Distributed control channel – every channel is control channel capable
Remote configuration, setup and testing conducted through IP connectivity
Fully redundant and extended hold-over timing references
Automatic simulcast timing and alignment
Multi-technology site link connectivity options (T1 and Ethernet backhaul)
MASTR V IP Simulcast Available Options for Simulcast Sites
Standard Redundant site controller functionality (every channel site controller capable)
Standard Redundant external timing references
Standard Extended hold-over timing references
Standard Enhanced failsoft with security and site trunking
Standard Enhanced simulcast bypass (trunking wide area failsoft)
Standard Enhanced Dynamic Dual Mode (Phase 1 and Phase 2 interoperability)
Standard Distributed Control Point Functionality (available on any and all simulcast sites) Option
Redundant virtual voters (standard for every voice stream with DCP option)
Option Redundant link connectivity to VIDA Core
Option Redundant link connectivity to simulcast sites
Option Multi-technology link connectivity
MASTR V Base Station The Simulcast Control Point functions are now software features offered for the MASTR V base station.
Miniature Mobility Exchange The Miniature Mobility Exchange (MME) is required at any P25 site where P25 data support is desired.
Both P25 specific data applications such as over-the-air-rekeying (OTAR) and over-the- air-programming
(OTAP) and third-party data applications such as automatic vehicle location (AVL) and field reporting
require a P25 data infrastructure. Because the State desires the ability to utilize P25data applications such
as OTAR, an MME has been included at each P25 RF site. The P25 data infrastructure is enabled by the
MME at the site, data mobility enabled routers, and subscriber radios having data operation feature(s).
This data infrastructure is referred to as P25 Mobile IP Subsystem (PMIPS), and is built upon industry
standards.
Unsolicited PPEA Proposal for P25 Radio System Middlesex County, Virginia
November 2014
P25 Phase 2 System Page 34
The MME works with the P25 radio system to set up and handle data calls. Call handling is an important
MME feature, because of the disparity in speeds achievable via the computer network and the radio
network. The MME supports data conveyance via the Sub Network Dependent Convergence Protocol
(SNDCP) and the Simple Common-Air-Interface Encapsulation Protocol (SCEP) which enables a broad
range of compatibility with subscriber radios from various manufacturers.
Receiver Voting Receiver voting for the P25 Digital Simulcast implementation is performed at the Distributed Control
Point that is implemented in software in the MASTR V base station.
Base Station Equipment – P25 System Harris will take all precautions to supply base station equipment and antenna systems in proper working
order. We will verify proper operation before putting the equipment into service by verifying proper
alignment and assuring that the equipment meets published specifications. We will repair or replace any
Harris provided equipment that is found to be not in proper working condition or that does not meet the
published electrical specifications. As such, our equipment should not create spurious noise or
transmissions that would interfere with other RF systems.
Harris will perform an Intermod Study to analyze the potential for intermodulation products created by all
frequencies provided by the County. Harris will also include in the study (if provided) the frequencies of
other systems that are co-located at the Customer’s transmission site.
However, Harris cannot be responsible for intermodulation products created by the mixing of transmission
signals between the frequencies provided by Middlesex County and other RF systems in the area. This
would include not only intermod products that interfere with the Harris system but also intermod products
that interfere with other RF systems.
Neither can Harris be responsible for interference to equipment installed in the vicinity of our equipment
that is inadequately designed or inadequately installed, making it susceptible to interference from
equipment that is operating properly. Harris will make a best faith effort to identify any such equipment,
and recommend engineering solutions that might be applied to that equipment.
The P25 RF site equipment includes several core components:
Site Access Router and Site Access Switch
Network Sentry
Miniature Mobility Exchange
MASTR V Repeater
RF Conditioning and Antenna System
These core components are described in the following sections:
Site Access Router (SAR) and Site Access Switch (SAS) The site access router (SAR) acts as the network interface between the site equipment and the network
switching centers. These routers connect to both the backhaul interface and to the site access switch loop
by Ethernet connectivity. IP tunnels are provisioned between the site access router and the network
Unsolicited PPEA Proposal for P25 Radio System Middlesex County, Virginia
November 2014
P25 Phase 2 System Page 35
switching centers. In the event of a loss of communication to one network switching center, the site access
router will reroute traffic to an alternate network switching center. The site access router is responsible for
transporting all of the site’s voice, data, and management traffic.
Site Access Switches are connected to the SARs. The SAS increases the Ethernet physical port fanout in
order to connect all site components to the site access router.
Network Sentry The Network Sentry at each RF site plays an integral role in the integrated P25 system. It is a low-profile
rack mounted appliance running Windows embedded applications. It acts as an intermediary device
between the Network Switching Center and the RF site equipment.
Database changes performed on the UAS at the NSC propagate to the Network Sentry devices at each of
the P25 sites. The Network Sentry then provides these database updates to each traffic controller module
in the MASTR V repeaters.
The Network Sentry gathers and communicates equipment alarm status via SNMP back to the Regional
Network Manager. The Network Sentry monitors SNMP alarms from local site devices (both Harris and
non-Harris equipment), and has digital and analog input capabilities. Using these I/O ports, Network
Sentry can report status like door open/closed, generator engaged/disengaged, etc. The Network Sentry
can also provide relay output triggers to remotely control devices. For example, a dispatch console can be
configured with a push button that releases a door latch, or turns on a lighting circuit, etc.
The Regional Network Manager is capable of monitoring a mix of alarmed devices including Network
Sentry. The P25 equipment will immediately begin alarming through the Network Sentry once
connections are established.
MASTR V The MASTR V repeater is the P25 repeater
proposed for UHF sites. MASTR V is an all-digital
architecture supporting linear modulation (required
for P25 Phase 2 operation). The MASTR V is built
on a modular chassis which supports up to four
physical RF channels, with up to two MASTR V
chassis in a single equipment rack. A fully populated
single rack of eight MASTR V base stations
operating exclusively in P25 Phase 2 mode can
provide 14 simultaneous voice calls. Additional
talkpath capacity can be added to a site with the addition of a rack.
Figure 15 lists and summarizes the functions of the MASTR V base station modules.
Figure 15. MASTR V P25 Modules
Module Benefits
Traffic Controller Module
Manages data and control information for one Tx and one Rx channel module. Incoming data from dispatch points is processed into over-the-air P25-formatted Tx messages.
Processes decoded radio information received from the Broadband Processor module and handles all aspects of trunking (subscriber unit validation, assigned channels, queuing, etc.).
During P25 operation, the Traffic Controller module interprets and directs inbound calls. It issues appropriate control commands to and from the Tx and Rx modules, including how to
handle data between the base station and the control point (if operating in simulcast).
Unsolicited PPEA Proposal for P25 Radio System Middlesex County, Virginia
November 2014
P25 Phase 2 System Page 36
Module Benefits
Handles VoIP interfacing to other P25 sites. Incoming calls are formatted into a VoIP-capable protocol and sent to the Network Switching Center for further system routing.
Performs Distributed Control Point (DCP) functions when operating in a simulcast site
Ethernet Switch
Ethernet communications are utilized to pass voice and data transmissions, management, and control data between the Traffic Controller and supporting MASTR V modules via the Ethernet
switches.
Redundant modules are the standard configuration in a MASTR V shelf.
Baseband Processor Module
Generates all receive, transmit, and control processing for one or more RF channels. Provides a data interface between the Traffic Controller and the Tx and Rx modules. Generates a
heartbeat message used to monitor the health of the base station modules.
Tx Module
Provides a highly stable RF output to drive the High Power Amplifier module.
Uses a Direct Digital Synthesizer (DDS) which optimizes its modulation characteristics. DDS can digitally create a precision waveform or modulation scheme from a single on-board
oscillator.
Rx Module
The MASTR V Rx modules are dual-IF conversion receivers. The receiver uses a Sigma-Delta analog-to-digital converter to process the incoming IF signal. The output of the analog-to-digital
converter is a complex pair of I/Q baseband digital signals.
Supports a wide range of modulation waveforms required for current and next-generation public safety two-way radio communications.
High Power Amplifier Module
Continuous-duty, solid state, wide-band RF power amplifier. Amplifies the exciter output to the rated station output power level.
Equipped with an RF linearizer circuit to improve RF performance. The RF linearizer samples the RF output of the HPA, and provides waveform correction to the RF input signal relative to its RF output characteristics. This reduces waveform distortion and enhances simulcast operation.
Power Supply Module
Continuous-duty switching power supply.
Includes front panel LED status indicators for each DC output and a front panel ON/OFF switch used to disable the power supply and built-in cooling fan.
Traffic Control Module – Harris’ Multi-Redundant And Multi- Function Controllers The Traffic Controller interprets and directs inbound calls, processes the calls, and issues appropriate
commands about handling the calls. It is also responsible for the IP connectivity of each channel to the P25
network. The advanced processing power of the Traffic Controller monitors repeater communications,
while providing routing for multisite voice and data calls. The Traffic Controller also replicates, at the site,
key P25 database information to allow uninterrupted channel operation.
The Traffic Controller implements P25 call control, network management, and remote channel
management. Utilizing the Traffic Controller, P25 features such as radio registration, authentication, and
mobility management are available on a channel by channel basis.
The Traffic Controller encapsulates P25 clear and encrypted voice and data calls into IP packets for
routing throughout the network. The packets contain P25 user and talkgroup IDs, allowing the network to
operate with seamless end-to-end IP functionality.
Unsolicited PPEA Proposal for P25 Radio System Middlesex County, Virginia
November 2014
P25 Phase 2 System Page 37
In the case where a particular RF site is part of a simulcast cell (optional), the Traffic controller performs
the Distributed Control Point (DCP) functions in addition to the normal transmit/receive site functions.
DCP provides multiple-site control point redundancy, since the control point function can transfer to a
different site in the simulcast system in the event of failures at the active control point site.
The Traffic Controller is part of every MASTR V repeater, which makes each MASTR V intelligent with
the ability to take control should failure occur in the existing control channel.
Each channel has its own Traffic Controller module. This means that any channel is capable of operating
as control or working channel. It also means that failure of multiple Traffic Controllers will not cause the
site to revert to non-trunked operation. This is paramount to maintain the site capacity and efficiency of
trunked operation, to not disrupt users with a change in operational procedure on their radios, and to
maintain secure encrypted communications.
Each traffic controller module is capable of assuming site controller capability. With the MASTR V
architecture, there is no additional cost for site controller redundancy, and instead of being limited to two
site controllers, one is provided with each RF channel.
Enhanced Features of VIDA P25 RF systems Although the system has been designed for P25 Phase 2 operation, there are interoperability scenarios that
might benefit from allowing non-state mutual aid users with Phase 1-only capable radios access on the
system. In the event that there is a mix of Phase 1 and Phase 2 users anywhere on the State’s P25 system,
the Harris equipment is unique in its handling of this mixed traffic through two features:
Adaptive Site Resource Allocation
Enhanced Dynamic Dual Mode (EDDM)
MASTR III Base Station for Simulcast Paging
Figure 16. MASTR III Base Station
The MASTR III base station combines modular design and state-of-the-art technology to deliver superior
performance and reliability. It incorporates fully shielded and removable modules, front- mount controls,
and remote diagnostics.
The MASTR III provides secure digital or conventional analog communications for mission- critical
applications; supports the P25 CAI; and operates on a secure, scalable IP network.
Operating modes include:
P25 Trunking
Unsolicited PPEA Proposal for P25 Radio System Middlesex County, Virginia
November 2014
P25 Phase 2 System Page 38
P25 Conventional
Conventional analog
Features include:
Narrowband capable
PC programmable options
Modular design for fast, simple maintenance and servicing
MASTR III Base Station Modules For P25 operation, the following station modules are installable in the MASTR III base station.
Figure 17. MASTR III Base Station Modules
Module Benefits
System Module Contains all the analog audio processing and transmit/receive control circuitry for the ADC
transmit/receive shelf as configured for P25 operation.
Digital Signal Processor (DSP)
Provides the necessary processing to generate and decipher the outbound and inbound P25 over-the-air signaling.
Power Module Provides power to the transmit/receive shelf and modules.
Contains switching regulators for DC supplies.Receiver
Synthesizer Module
Generates a phase locked-loop local oscillator signal used by the receiver front end module.
Provides the selected reference oscillator signal to the transmitter synthesizer module.
Receiver Front End Module
Provides the front-end bandpass tuning that can pass the desired RF receiver frequency.
Mixes the RF signal from the bandpass circuit with the receiver synthesizer signal to create the first Intermediate Frequency (IF) frequency.
Receiver IF Module
Amplifies and down-converts the first IF signal to a second IF frequency
Transmitter Synthesizer
Module
Provides the RF excitation for input to the base station power amplifier. The output of the synthesizer is a four-level digital FM signal at the desired frequency, as determined by the system module.
Power Amplifier Is a wideband RF power amplifier that amplifies the signal from the transmitter synthesizer to the rated
RF output at the antenna port.
Analog Conventional Modes The MASTR III base station continues to be an industry leader in performance, versatility, and reliability.
It is configurable to operate as any of the following:
Conventional base station (2-wire or 4-wire audio)
Unsolicited PPEA Proposal for P25 Radio System Middlesex County, Virginia
November 2014
P25 Phase 2 System Page 39
Conventional repeater (stand-alone, no wire line)
Conventional repeater (with wire line control)
Remote-to-repeater
Transmit only (paging or other data applications)
P25 Conventional When equipped with a digital signal processor (DSP) module, the MASTR III base station operates as a
P25 Conventional station. P25 compliant stations use four-level FM modulation (C4FM) and are
backward compatible with traditional analog FM radios. P25 Conventional technology supports the
following modes of communication:
P25 Conventional base station (four-level FM)
P25 Conventional repeater
P25 Conventional repeater with console control
MASTR III P25 Conventional systems support the P25 CAI standards for conventional mode, including
the following features:
Group, individual, and emergency calls for local and remote operations
Patch, simulselect, console preempts, and supervisor preempts
with a digital signal processor modem for maximum design flexibility. The MASTR III P25 and SitePro
Controller enable sending of IP voice and data packets over the radio network and their reception at the
base station. This setup enables the following advantages of IP:
Seamless integration of off-the-shelf IP data applications
Economical routing and backhaul of network data
Distributed IP architecture, a key requirement for public safety users
Site Pro Controller The SitePro Controller provides transmitter control, network access, site database information, and IP
interface capabilities for the MASTR III station. In addition, it provides user and talkgroup validation,
limiting access to only those subscribers authorized to use the system based upon the database provisioned
by the Unified Administration System (UAS). Its performance equals that of any other vendors’ site
controller.
Unsolicited PPEA Proposal for P25 Radio System Middlesex County, Virginia
November 2014
P25 Phase 2 System Page 40
Antenna Systems
Transmit Combining System Transmit combiner(s) connect multiple RF channels from the outputs of base station HPAs to a single
antenna system. Combining transmitters conserves tower space and lowers the cost of multiple feed lines. Two
separate 800MHz combiners were used to maintain minimum transmitter to transmitter frequency spacing
requirements. The combiners use 5 inch and 8 inch diameter bandpass bandreject cavities. Each channel
is equipped with an integrated dual-stage isolator and load assemble capable of handling 125 W of fully
reflected power. The combiners for 800MHz Mutual Aid, and VHF paging have been placed in a single
open rack, where required.
Paging Transmit Filter A transmit filter has been added to the output of the paging transmitter to reduce transmitter noise. The
transmit filter is comprised of dual cavities (8 inch and 5 inch bandpass) with dual stage isolators). This
filter is mounted in the two-post open rack that houses the pre-selector and receiver multicoupler system.
Pre-selector and Receiver Multicoupler System The fundamental application of the pre-selector and receiver multi-coupler is to enable several frequencies
to share a common receive antenna system. The pre-selector help to pass only the desired channels used in
the P25 system design. The pre-selector uses 5 inch and 8 inch diameter bandpass bandreject cavities.
The pre-selector’s output feeds an 8 channel receiver multicoupler for connection to the system receivers;
unused outputs are terminated. Splitter losses are overcome by amplifier gain, and an integrated
adjustable attenuator allows for manual adjustment of gain. The multicoupler is field expandable in 8
channel increments to support up to 24 channels. The pre-selector and receiver multi-coupler are mounted
into a single two-post open rack.
Dispatch Console
General Requirements and Features
Symphony Dispatch Console
The Symphony Dispatch Consoles are full-featured, dispatch consoles with true IP secure network
connectivity. I/O is handled mainly from the rear of the Symphony processor and includes two display
ports, six discrete USB inputs and five relay-type inputs. Front and rear views are illustrated below:
Figure 18. Symphony Processor
A single network connection to a PC replaces the traditional audio switches found in older systems. The
Symphony Console is a more robust solution with less equipment and complexity. The core package of the
Symphony includes a Central Processing Unit (CPU), monitor, microphone, mouse, and speakers, and can
Unsolicited PPEA Proposal for P25 Radio System Middlesex County, Virginia
November 2014
P25 Phase 2 System Page 41
be placed on any standard furniture that has space to accommodate a monitor and the accessories shown in
the figure below.
This proposed network is extremely reliable and efficient in order to ensure the critical link of
communication for the public safety personnel is never broken. Harris also keeps the dispatcher in mind
and ensures that the user face is easy to navigate, without being cluttered, to perform their necessary
functions. This means that the screen display was designed so that all dispatch functions will be operable
from one display. The display is very flexible, allowing dispatch operators to rearrange icons according to
their preferences. Additionally, authorized personnel will have the ability to determine which functions are
available at each operator position. These screen configurations and an alias database will be stored locally
or on a centrally located server.
Figure 19. Symphony Dispatch Console
Symphony utilizes the CPU to perform the digitization of voice, similar to Voice over Internet
applications. It is an integral part of the VIDA network, and does not require any “back room” electronics
equipment, unlike other systems. This is a great savings in terms of installation cost and space
requirements. Because the console is IP-based and only requires a network connection to tie into the
VIDA network, ad hoc backup dispatch centers can be quickly established as the need dictates.
Figure 20. shows a sample of the Symphony console’s user interface. The display screen is composed of
panels and communications modules that provide dispatchers with system status at a glance. The panels
appear on every page of the display, and their contents do not change from page to page. Communication
modules, on the other hand, are linked to specific pages of the display. Thus, when you switch from page to
page, the panels will remain the same, and the communication modules will change.
Unsolicited PPEA Proposal for P25 Radio System Middlesex County, Virginia
November 2014
P25 Phase 2 System Page 42
Figure 20. User Display Symphony Dispatch Console
A communication module is the fundamental building block used to communicate through the console.
Each communication module can be individually programmed with a single entity, representing a talk
group, a radio unit, a conventional channel, or another console. When an entity is programmed into a
module, all audio related to that entity is routed to the console. Modules provide incoming call monitoring
and outgoing console-originated call transmissions. On the display screen, rectangular boxes represent the
modules. Up to 1,024 communication modules can exist across eight pages of the display.
Unsolicited PPEA Proposal for P25 Radio System Middlesex County, Virginia
November 2014
P25 Phase 2 System Page 43
Assumptions and Considerations Harris will provide System Engineering (SE) and overall Project Management (PM) support.
Harris will be responsible for the installation of proposed equipment, staging coordination,
cutover and miscellaneous installation material.
Middlesex County will prepare and submit any FCC documents in regards to this transition, if
necessary. Harris has not quoted any services to provide permits and licenses associated with
this budgetary upgrade.
Middlesex County will be responsible for any backhaul connectivity circuits other than
microwave (T1, fiber, WAN/LAN, etc.). This ROM includes estimate between all RF sites, the
simulcast control point, and/or the Network Switching Center at Saluda.
Harris will perform functional verification testing to assure proper operation of the new
simulcast system.
Harris offers no coverage guarantees with this budgetary proposal, however coverage
characterization tests have been included to document RF signal levels.
Middlesex County will continue to require a number of RF channels (3) for the new P25Phase 2 simulcast system. Channel resources and traffic loading will need to be carefully
designed and planned when a formal proposal is prepared for the County.
Harris assumes reuse of existing antennas for paging and has not added into this budgetary
proposal.
Harris has not included FX service renewal costs with this budgetary proposal.
Middlesex County does not require telephone interconnect for the new system.
Middlesex County is responsible for any required “civils” upgrades, to include towers,shelters, UPS, generators and prime/backup power for this project. Additionally, Middlesex
County is responsible for any HVAC as required for all equipment locations.
Harris assumes no responsibility for any interference resulting from any newlyreconfigured frequencies.
Harris has not provided a grand total for user radios needed for the P25 migration. MiddlesexCounty will need to determine terminal replacement quantities and apply individual terminalpricing provide in this budgetary proposal to determine the grand total.
Harris has not provided cost for reprogramming or retuning of any user equipment in thisbudgetary proposal but will provide one should the County decide to use radios that are
capable of P25 Phase 1.
Unsolicited PPEA Proposal for P25 Radio System Middlesex County, Virginia
November 2014
Confidential, Proprietary & Competition Sensitive
Pricing Page 1
Middlesex Standalone System Budgetary Pricing Scenario 1
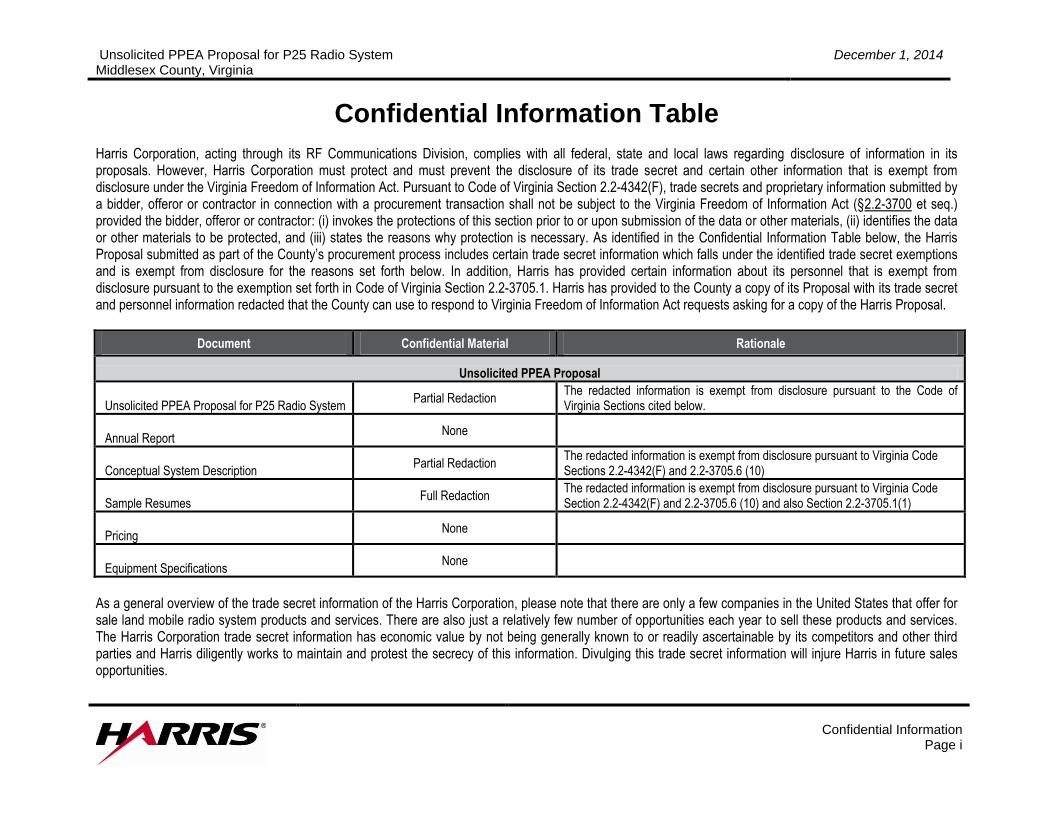
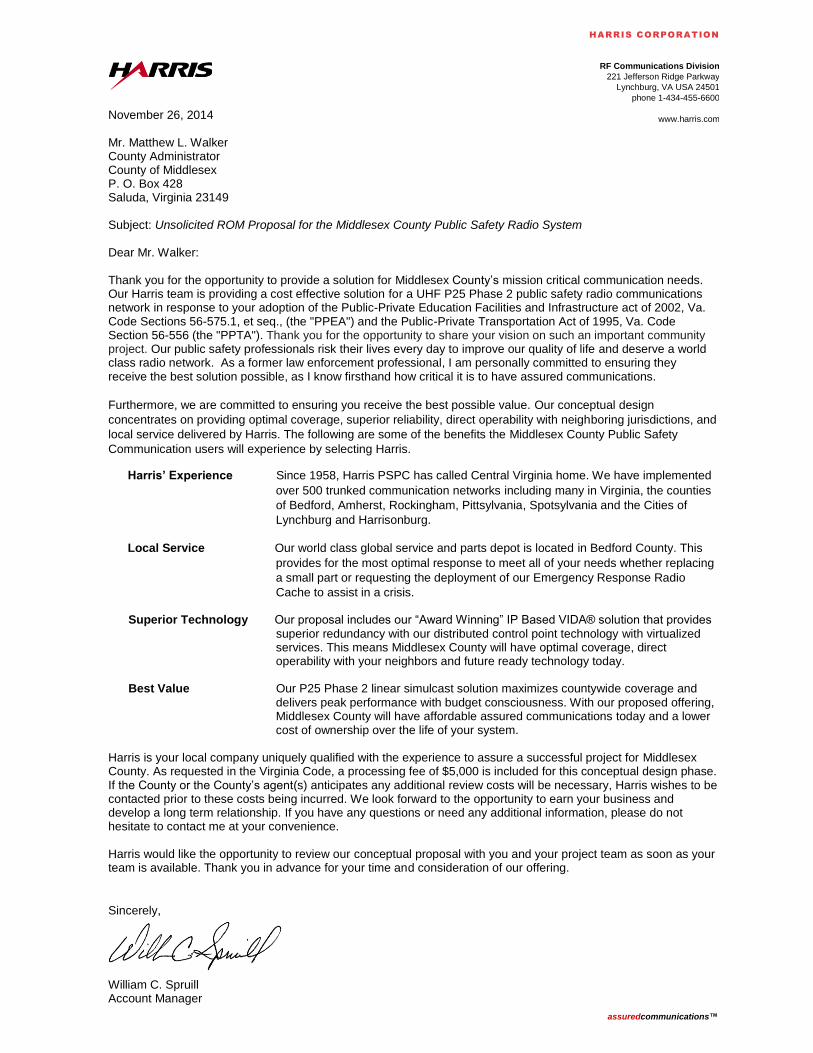
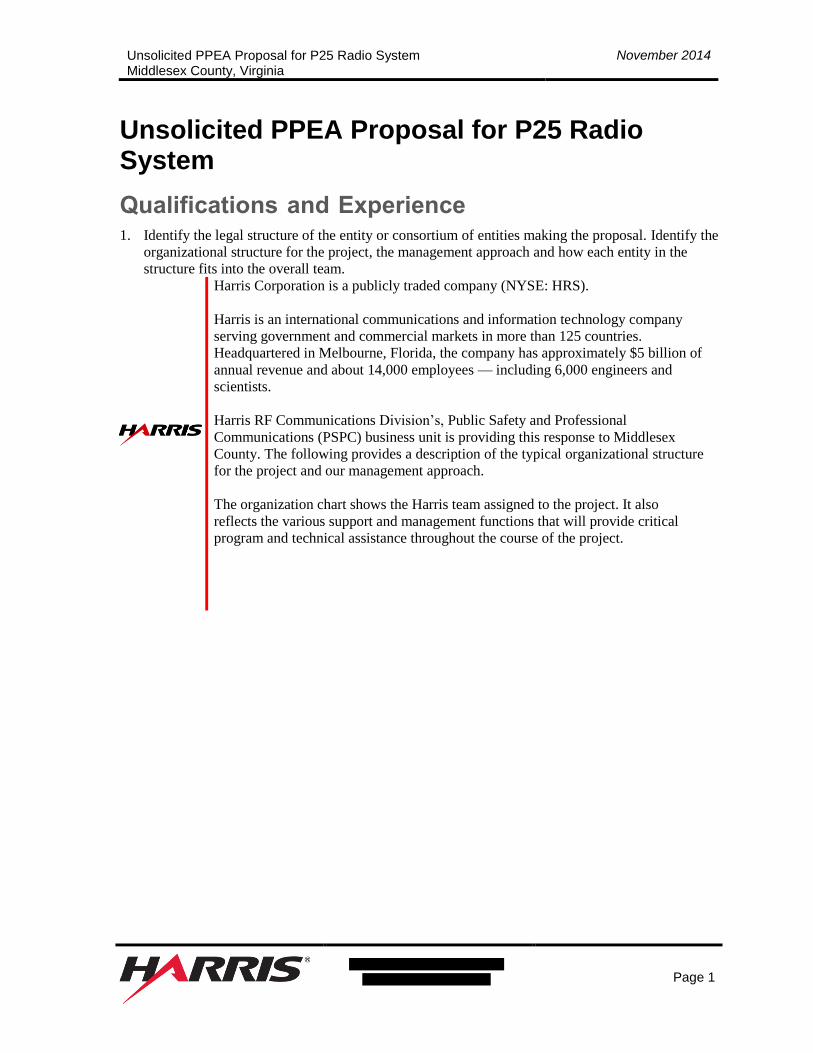

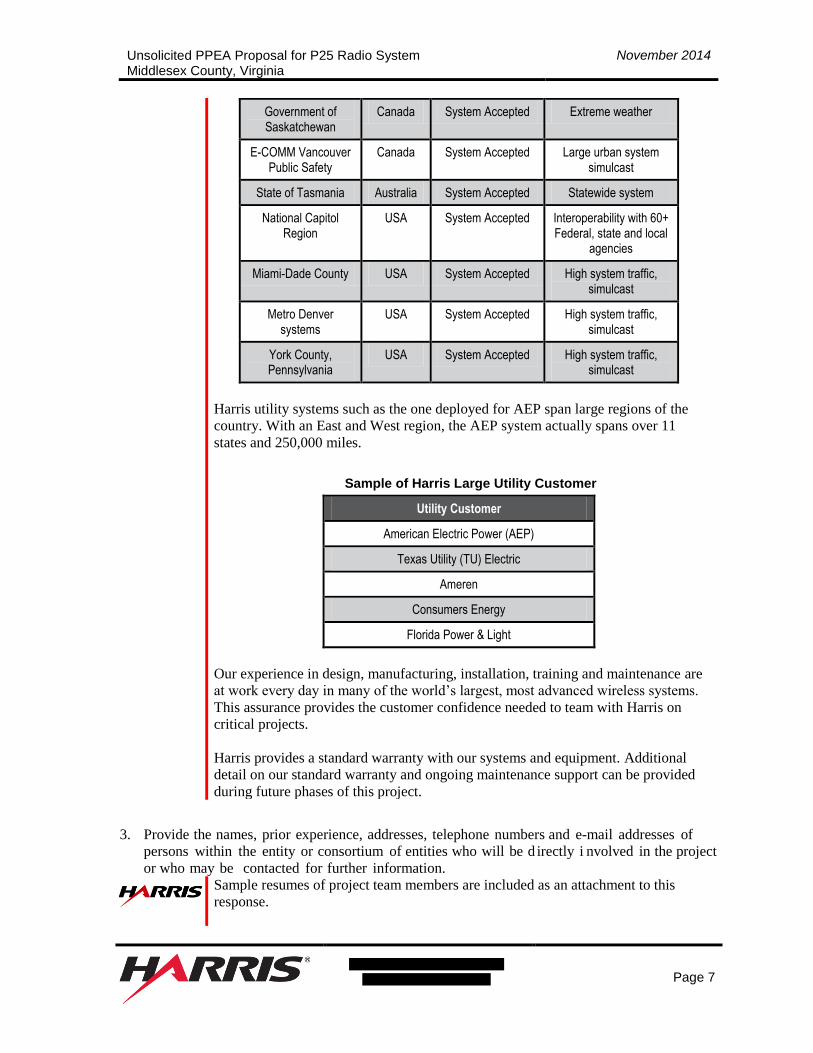

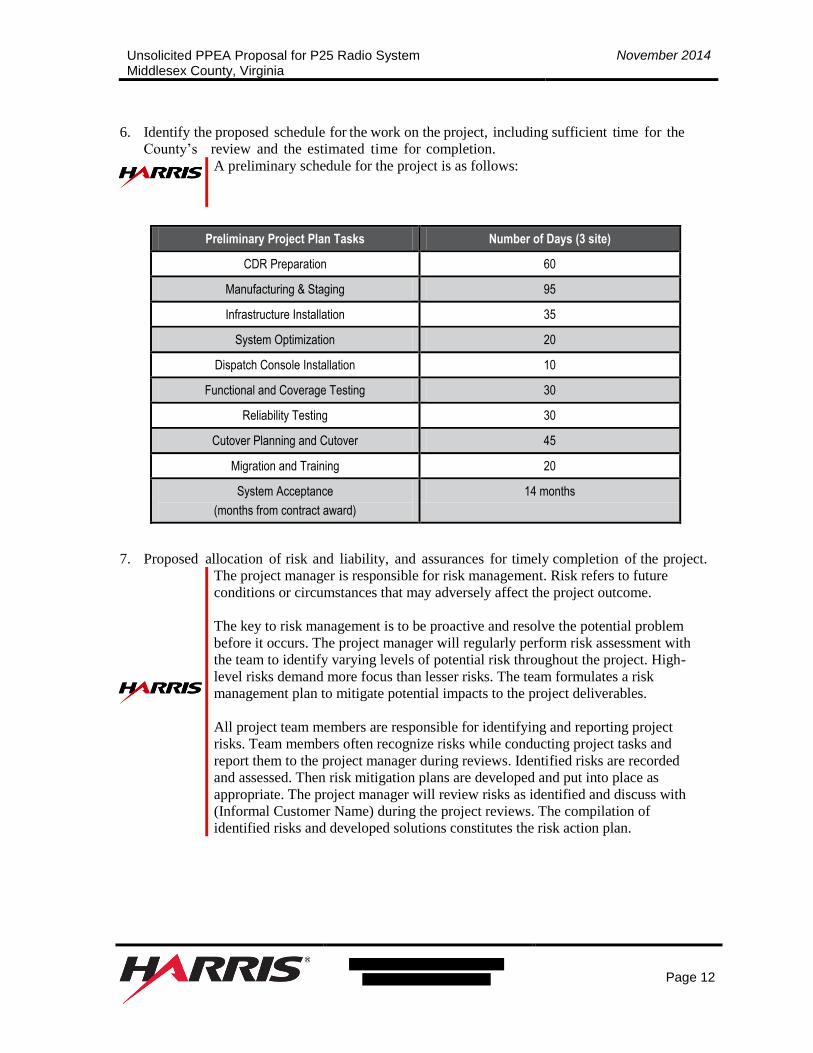
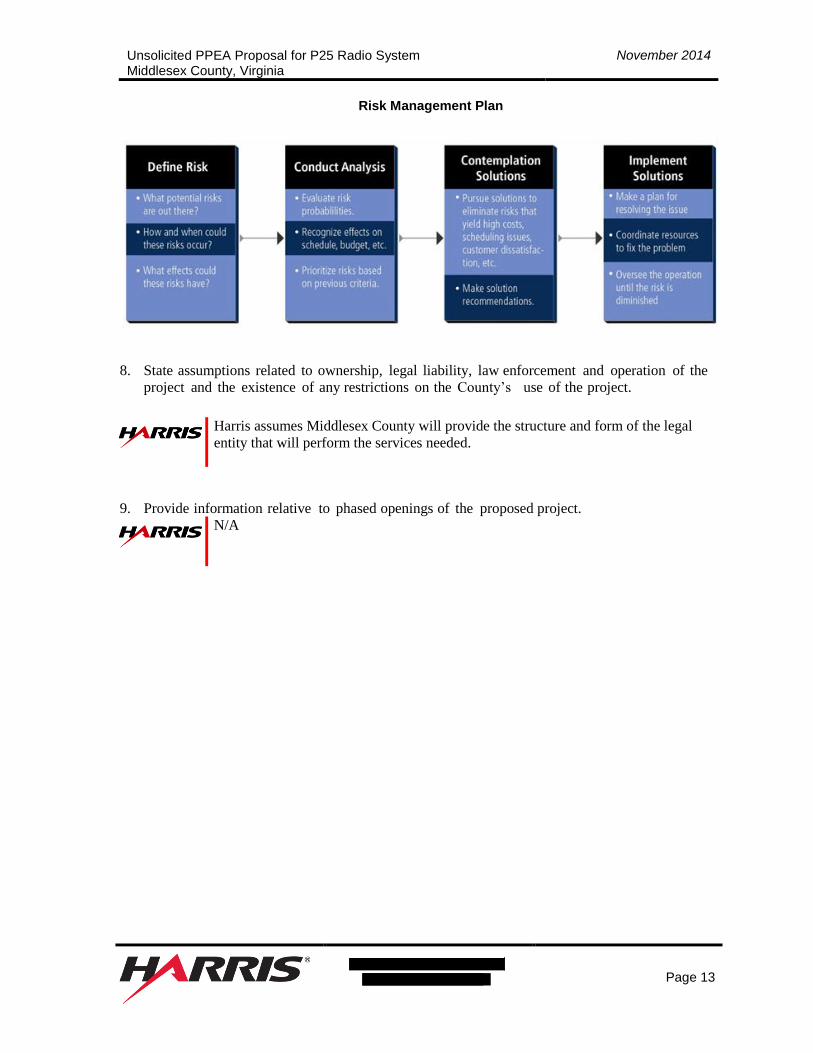


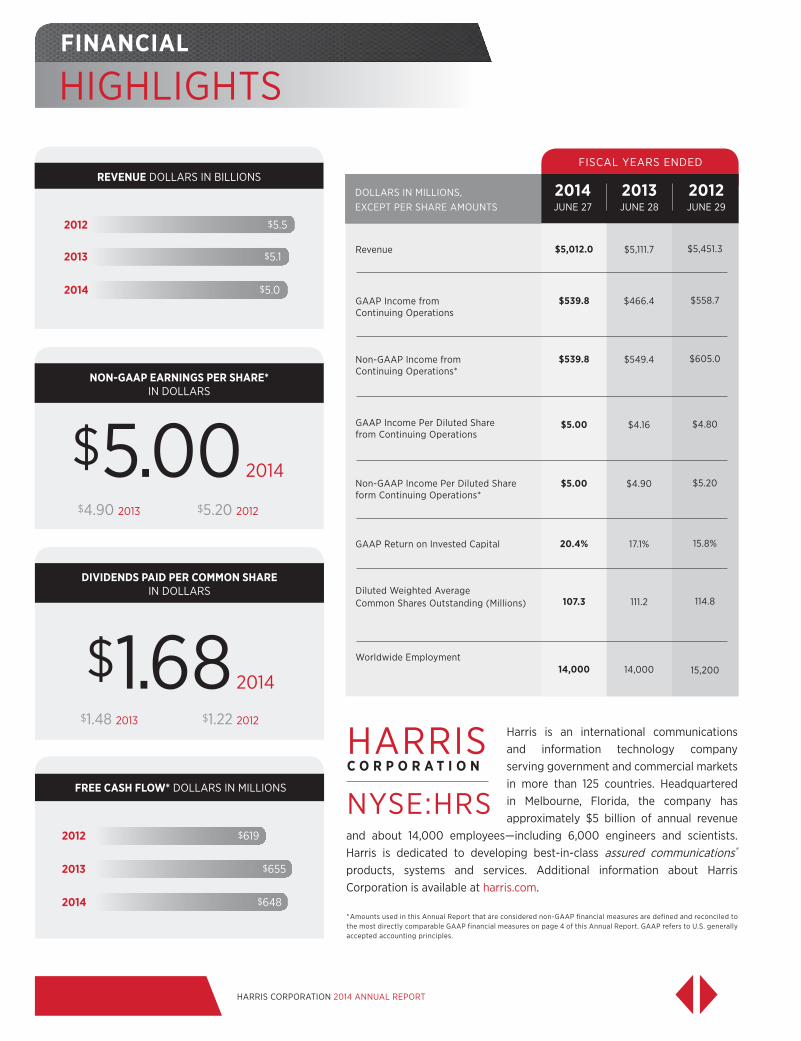

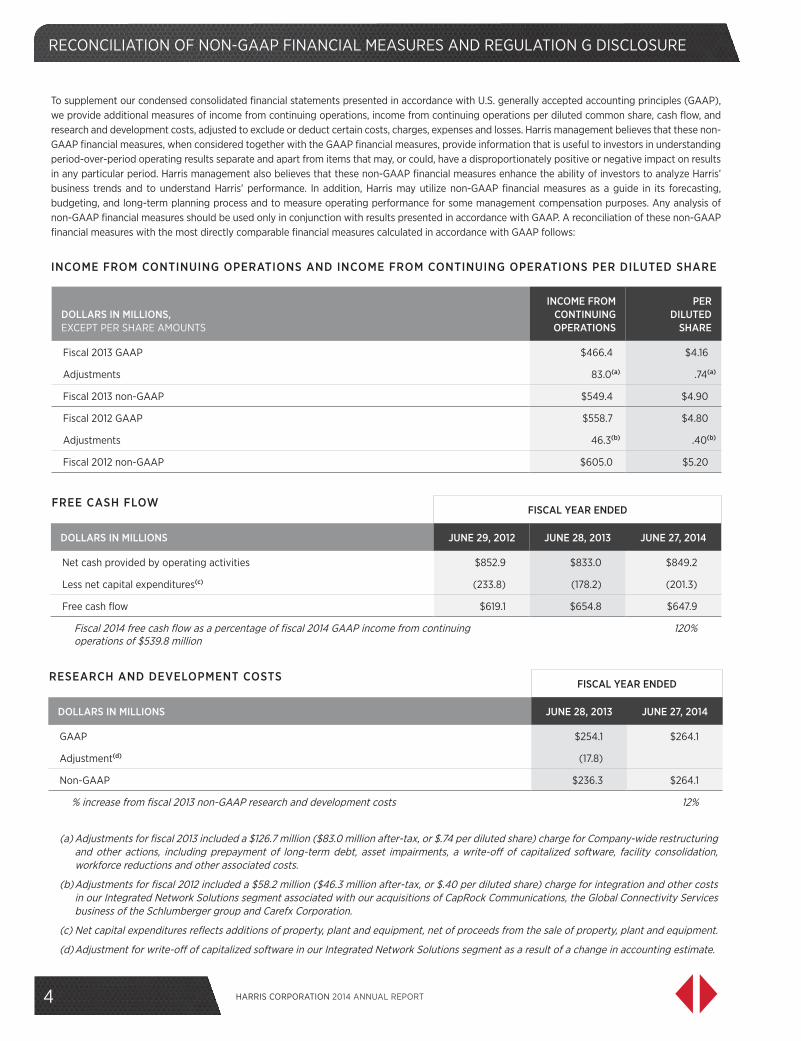
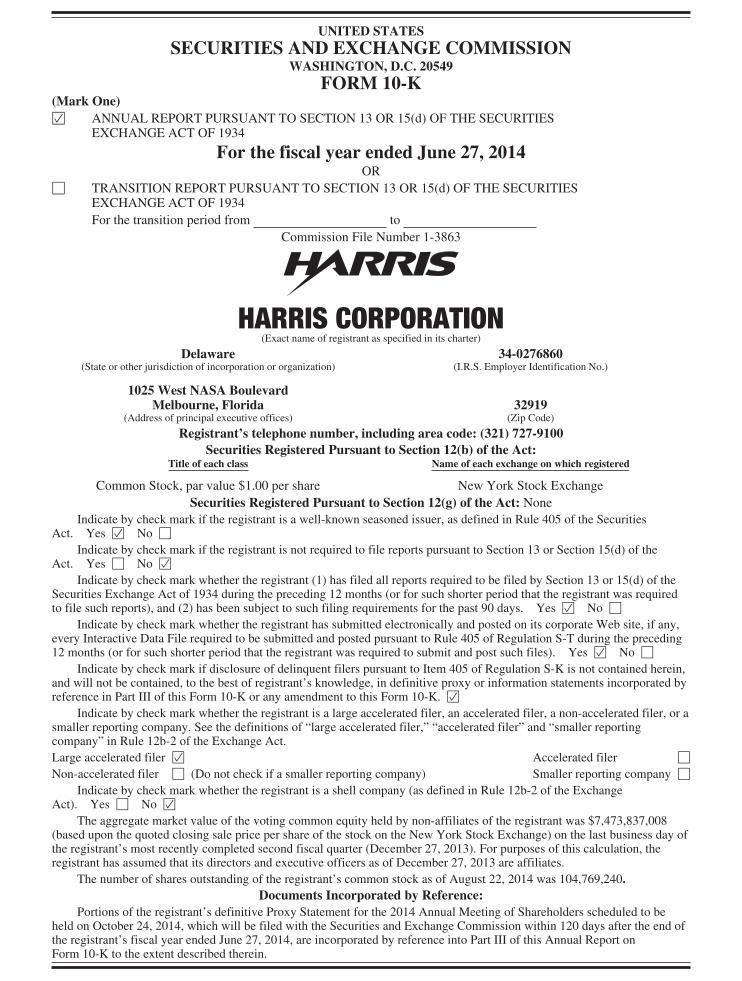


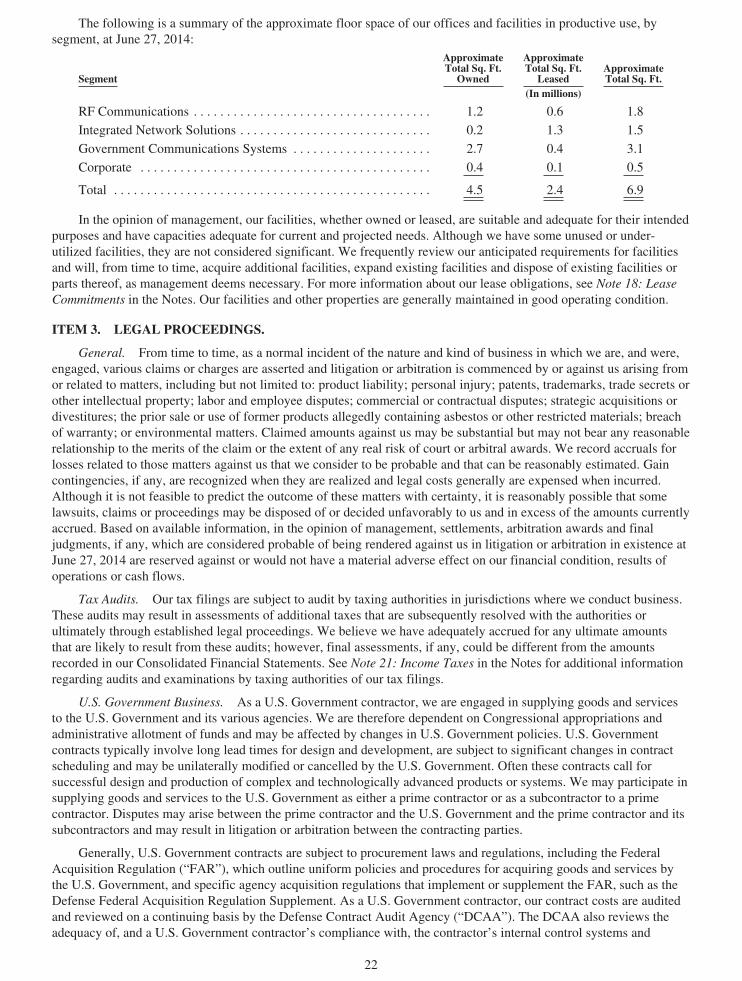
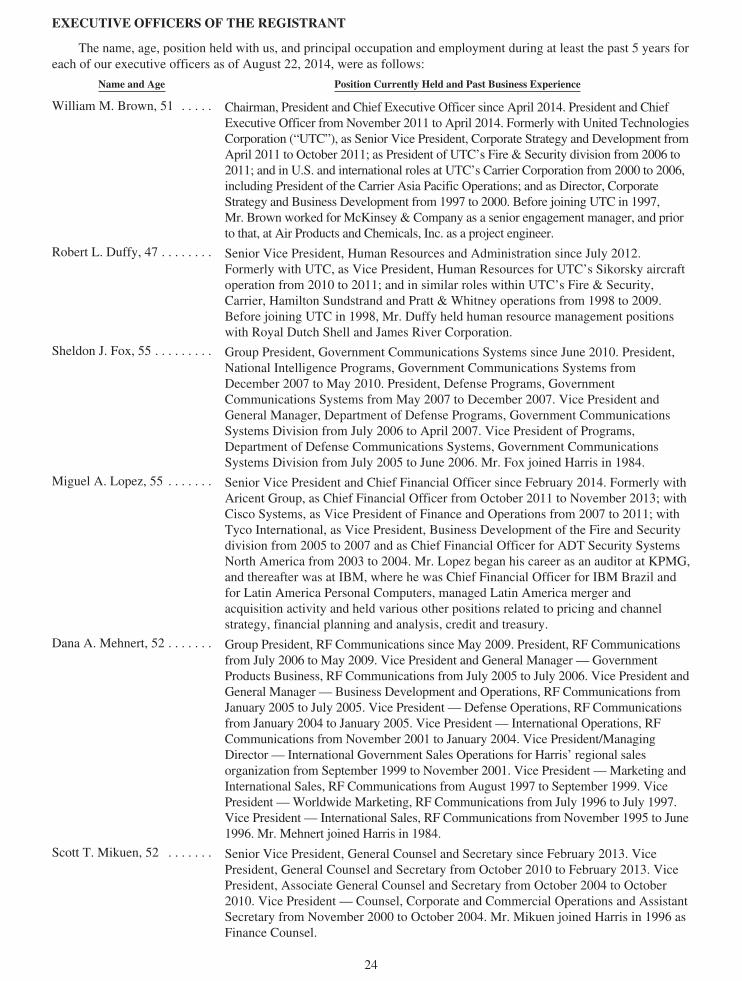

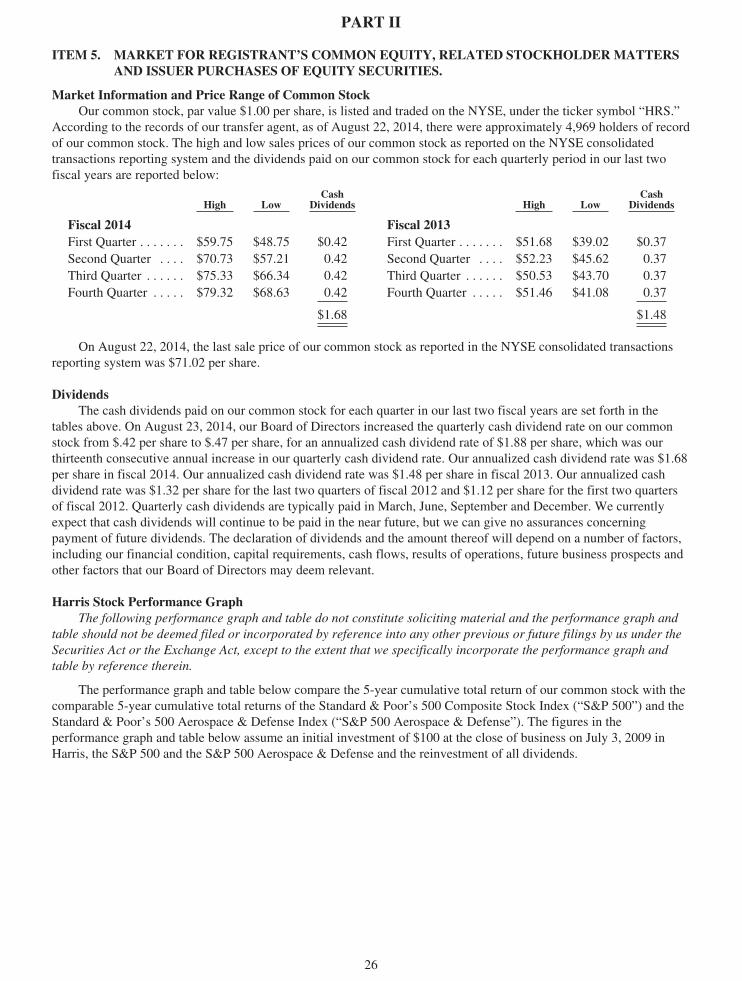
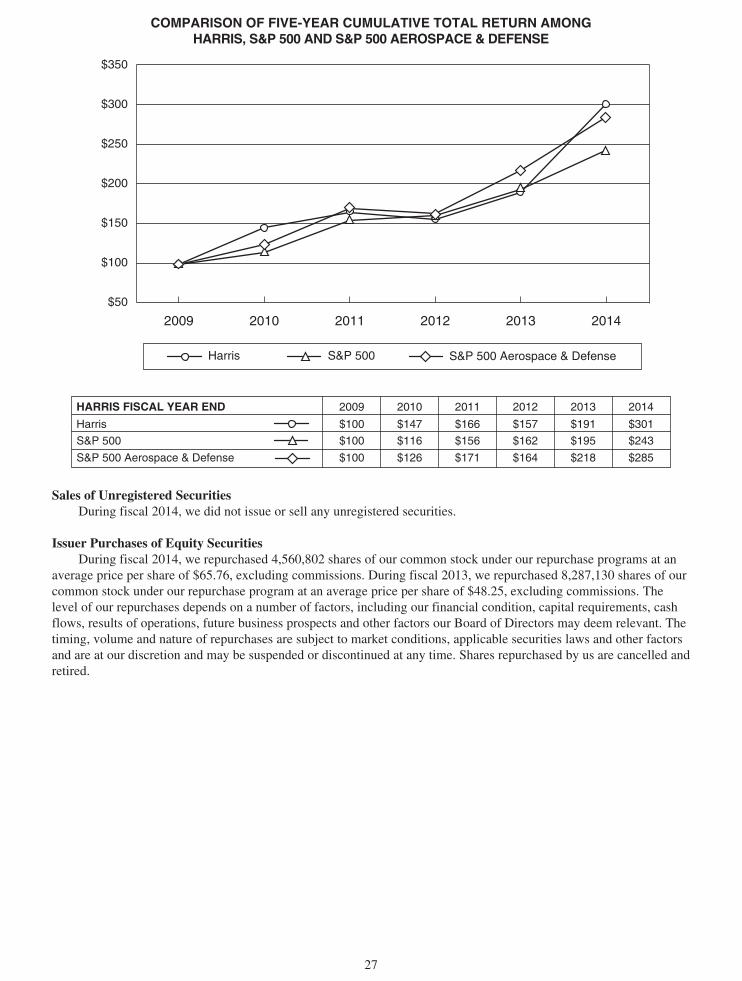
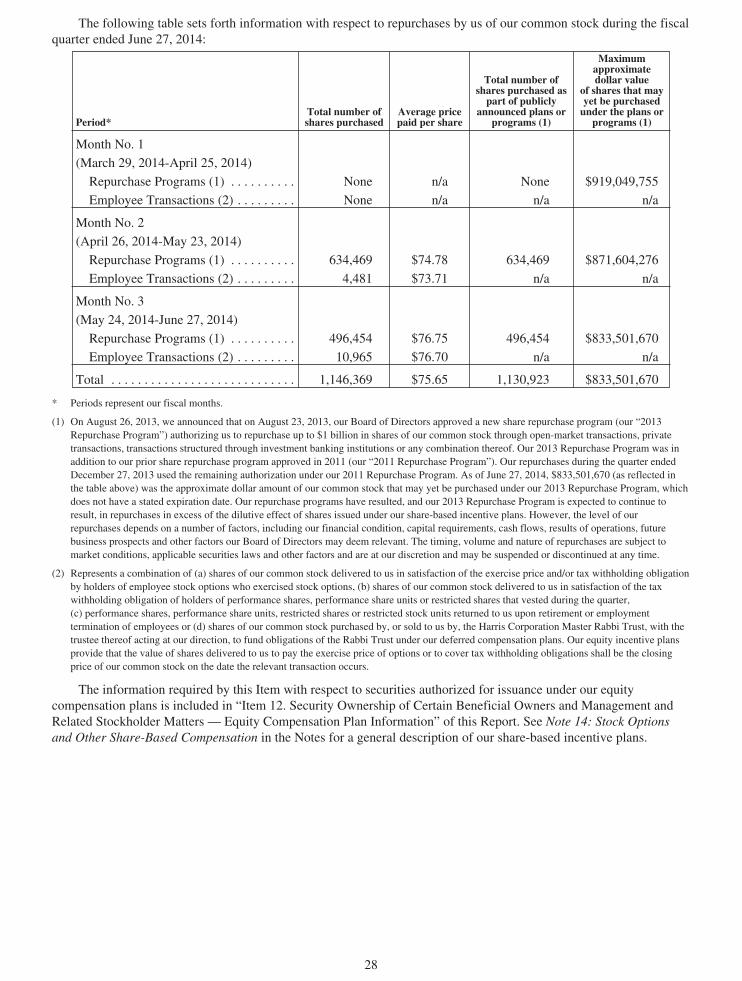
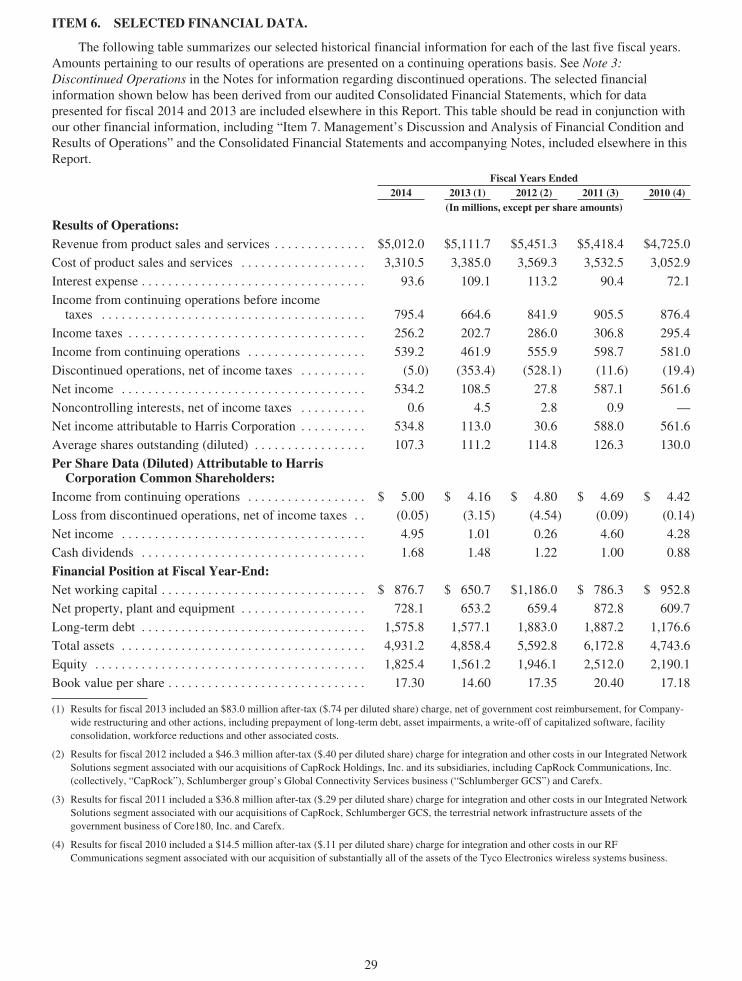
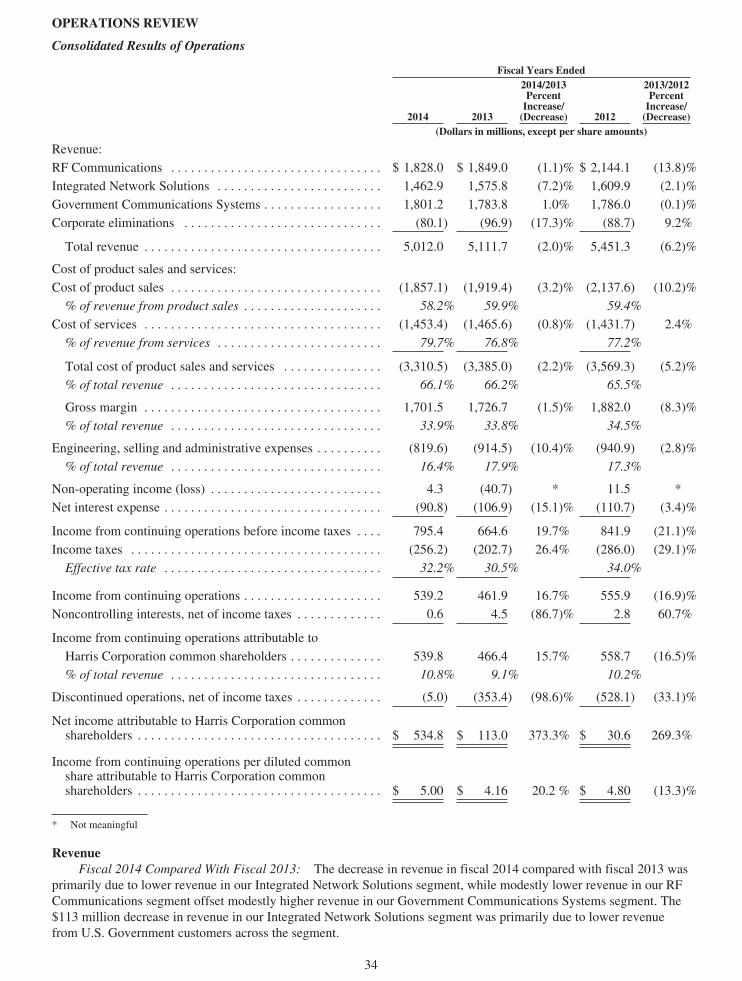
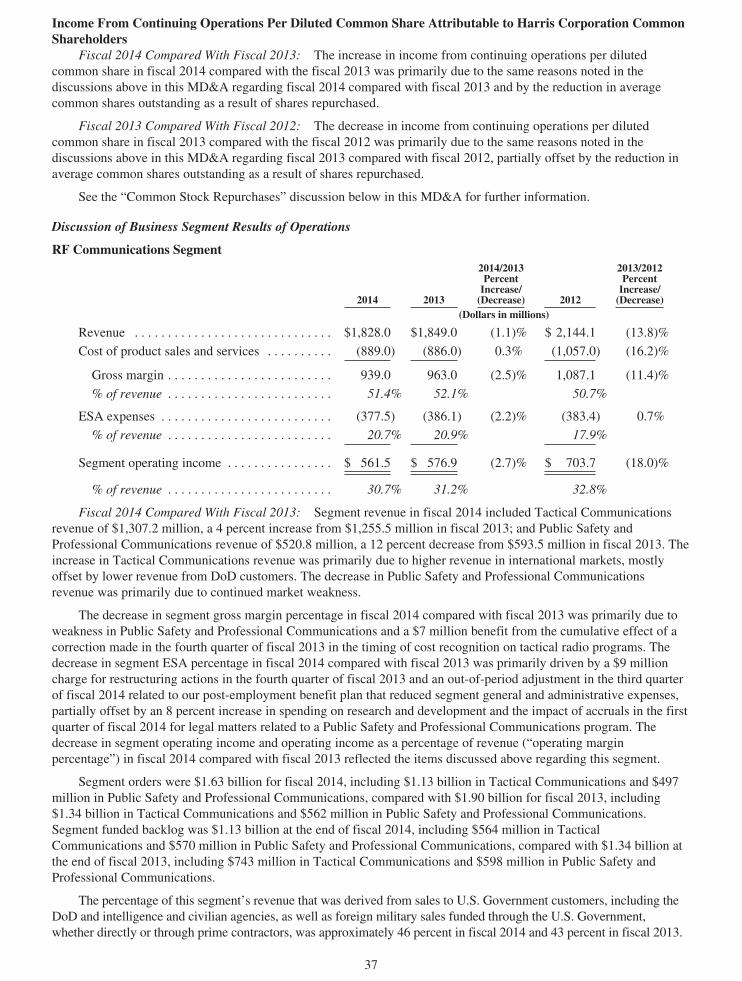
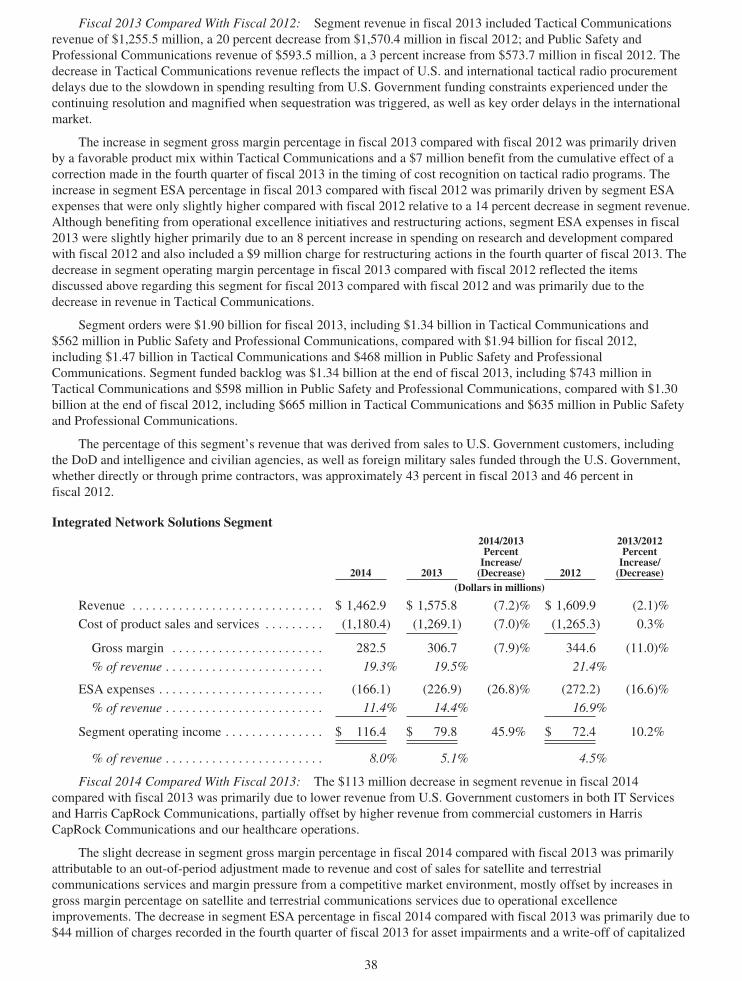

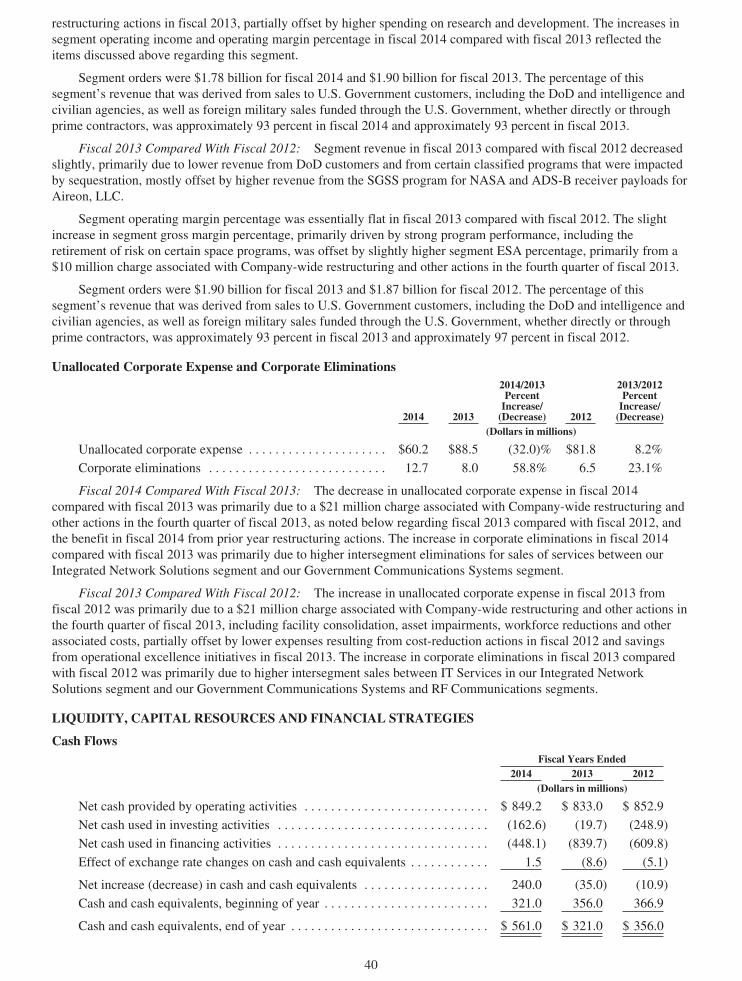

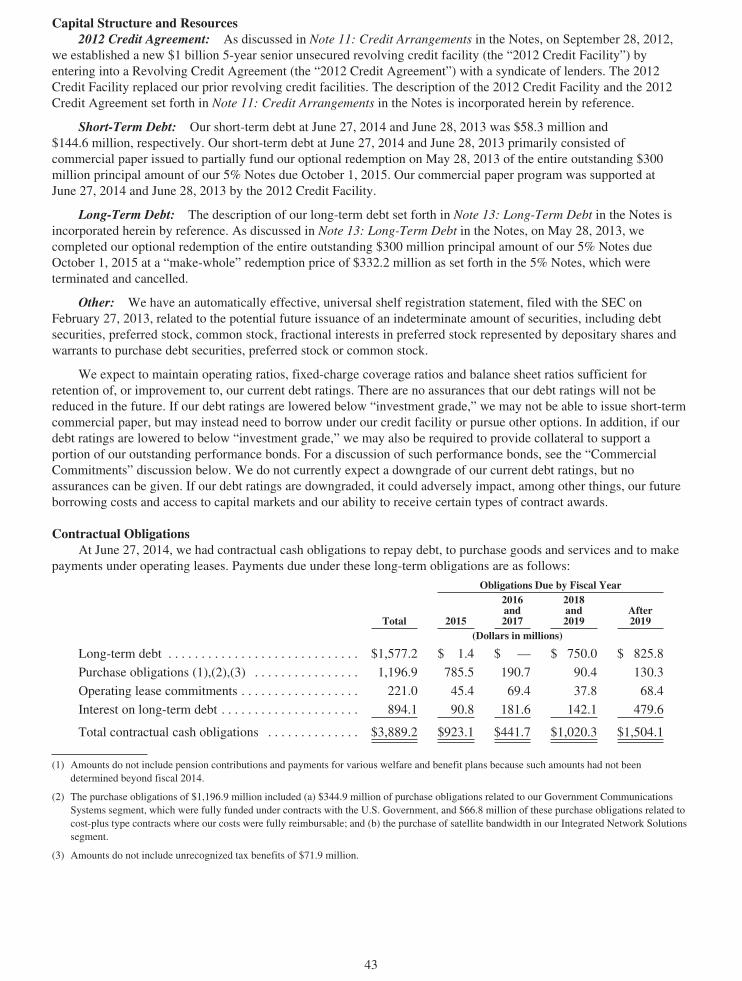
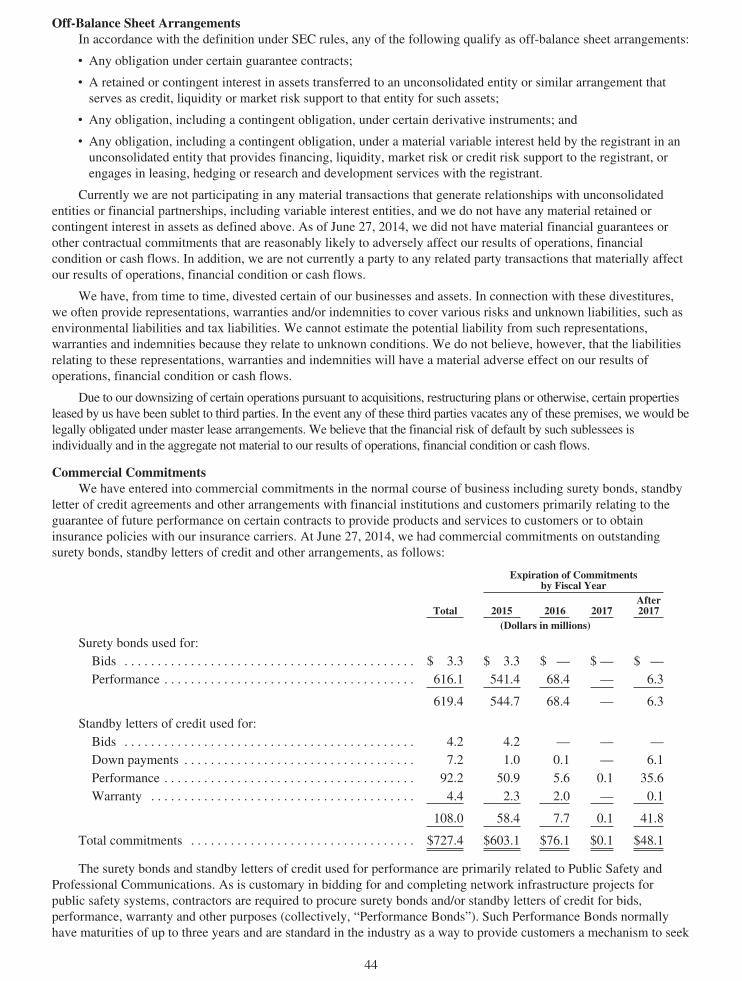

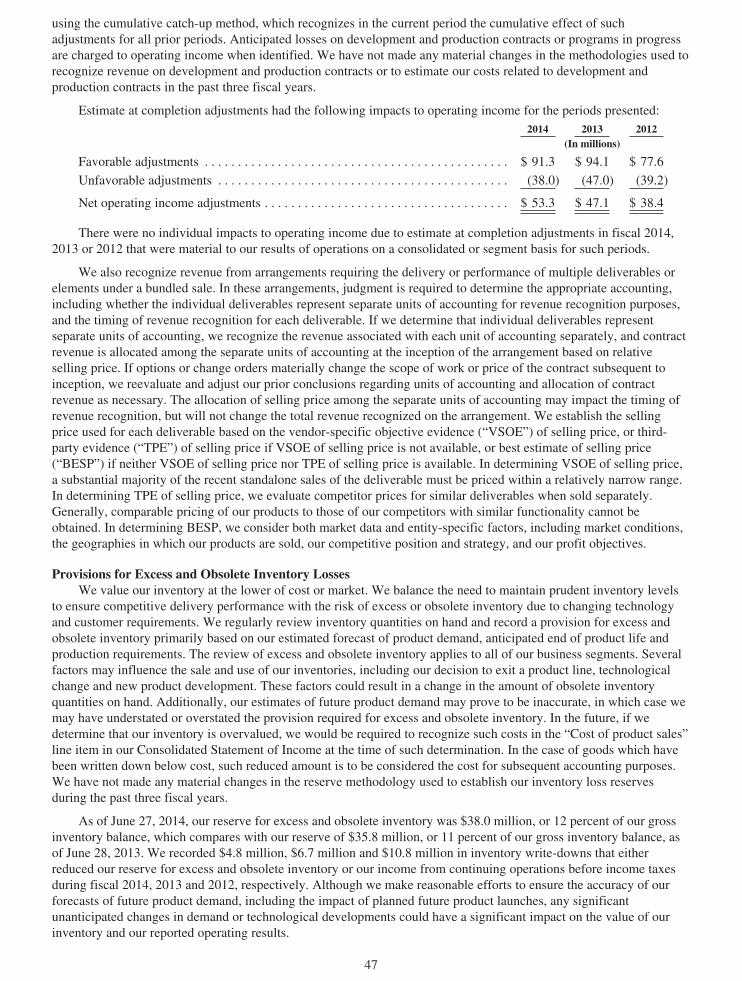


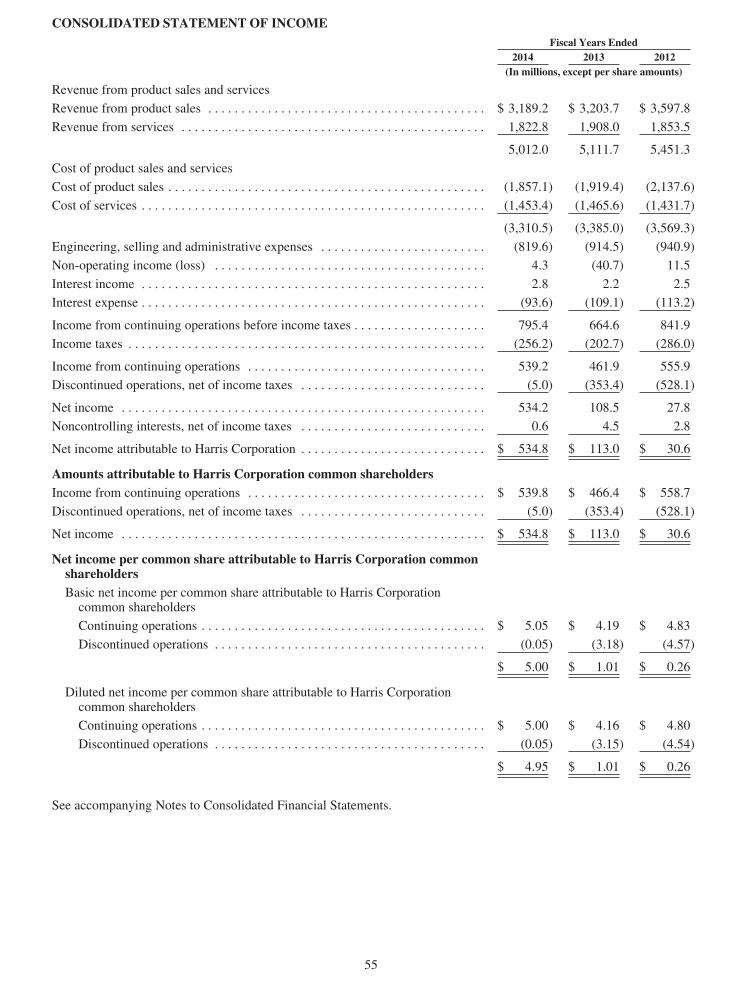
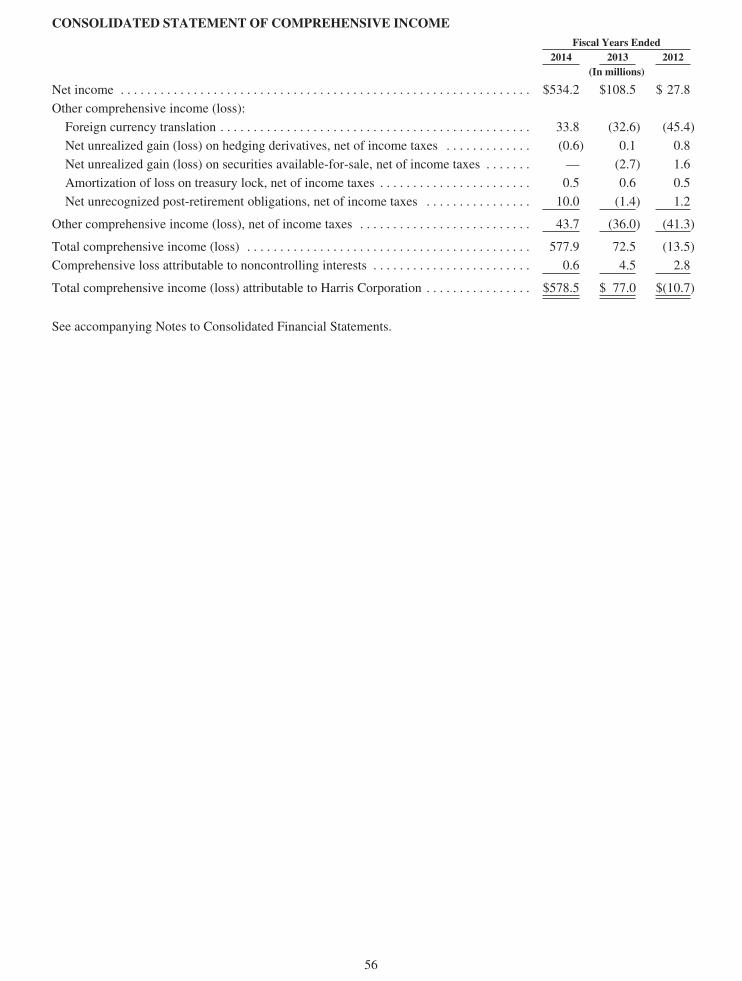
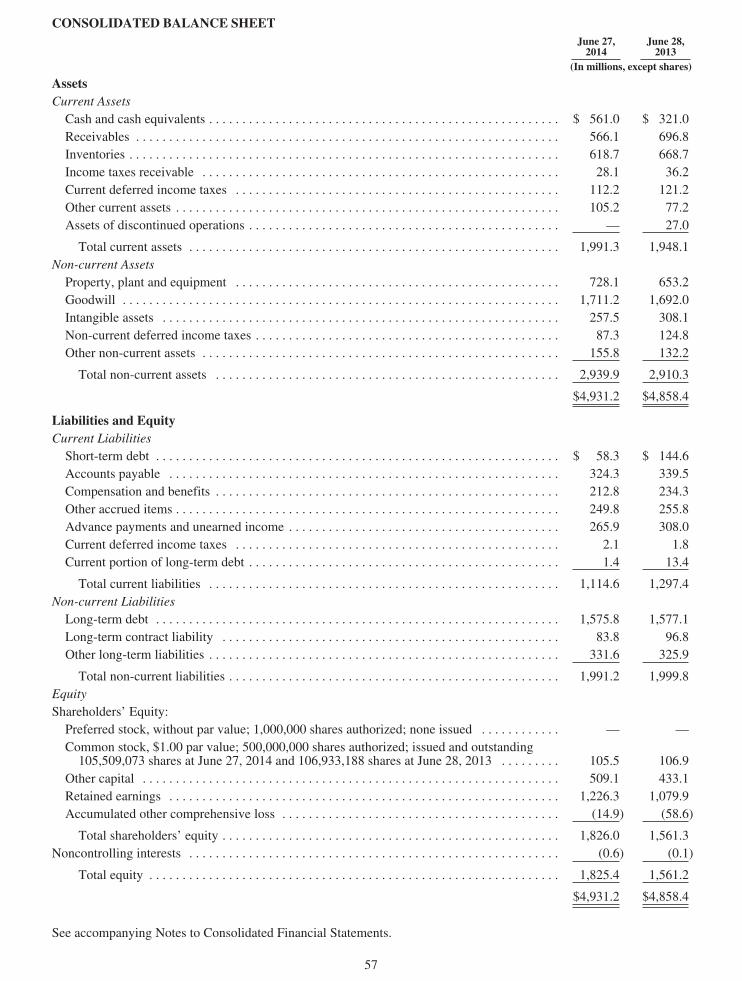
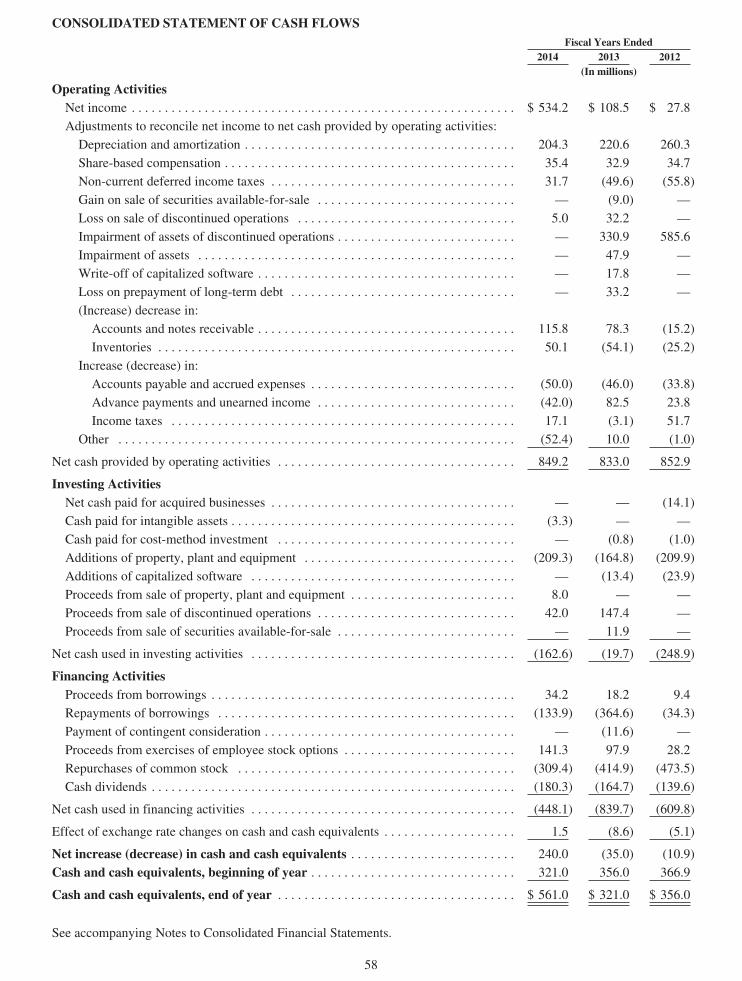
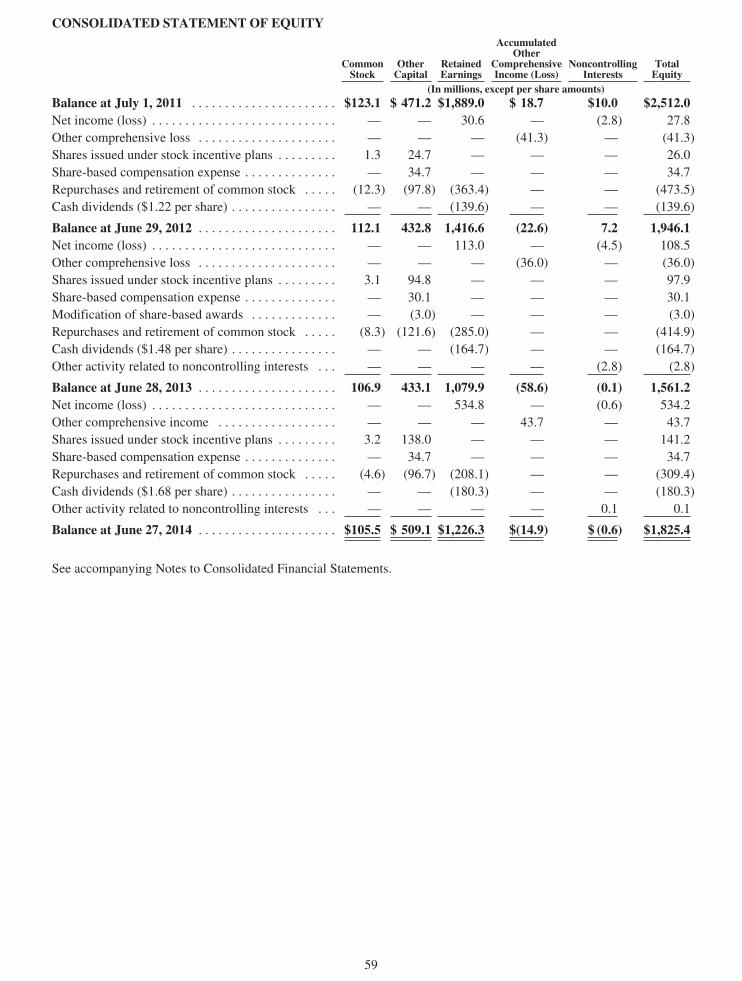


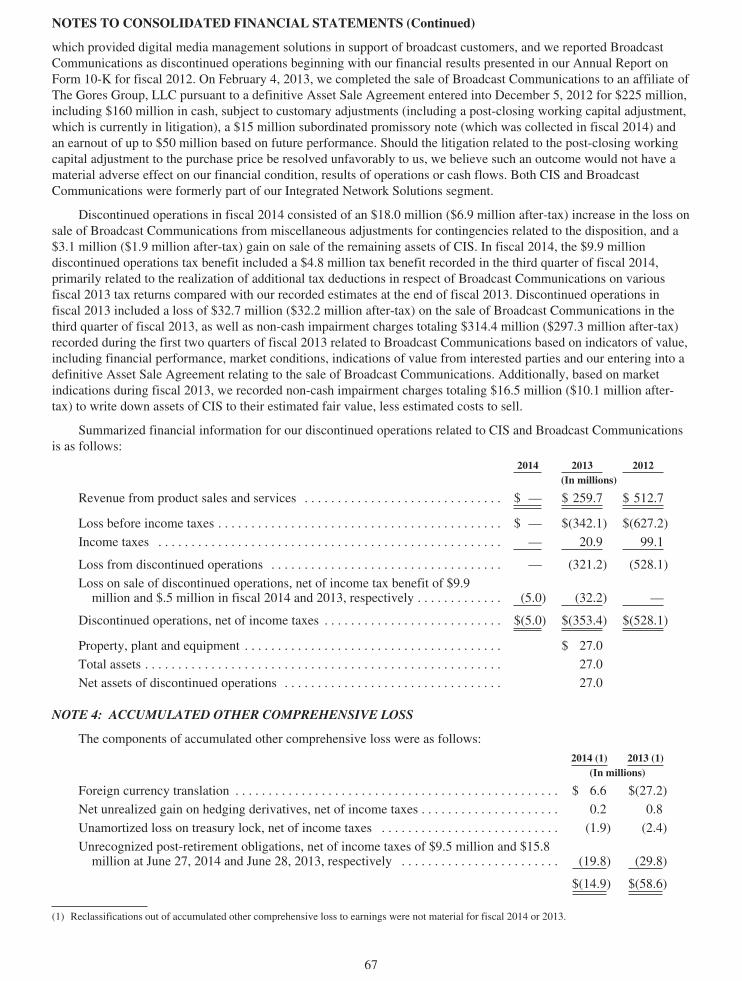
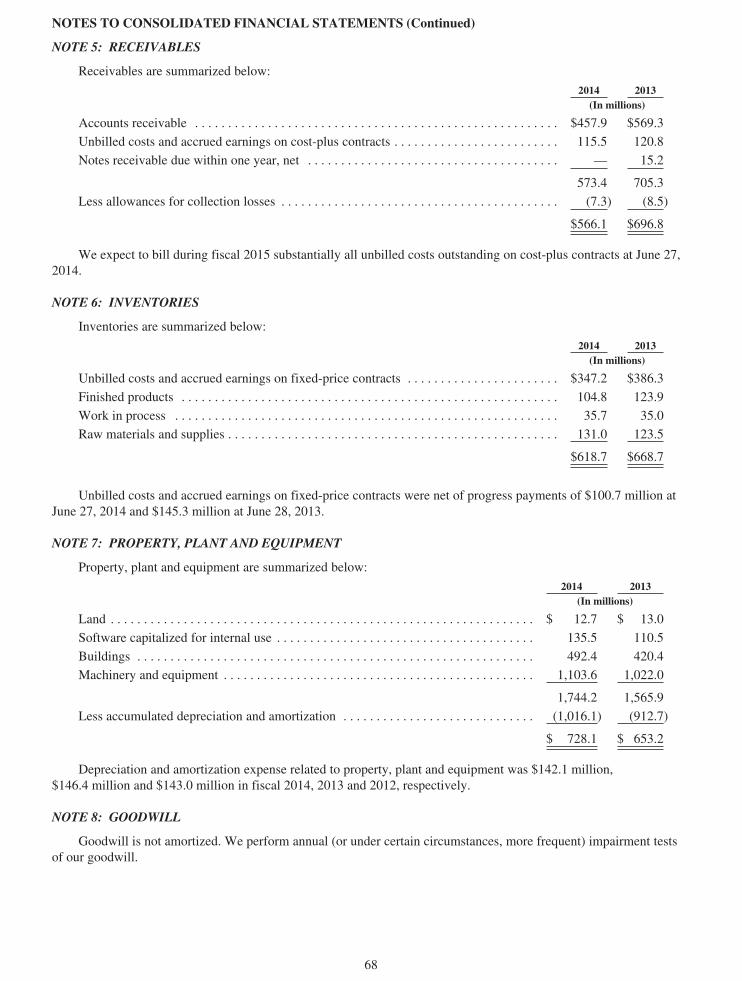
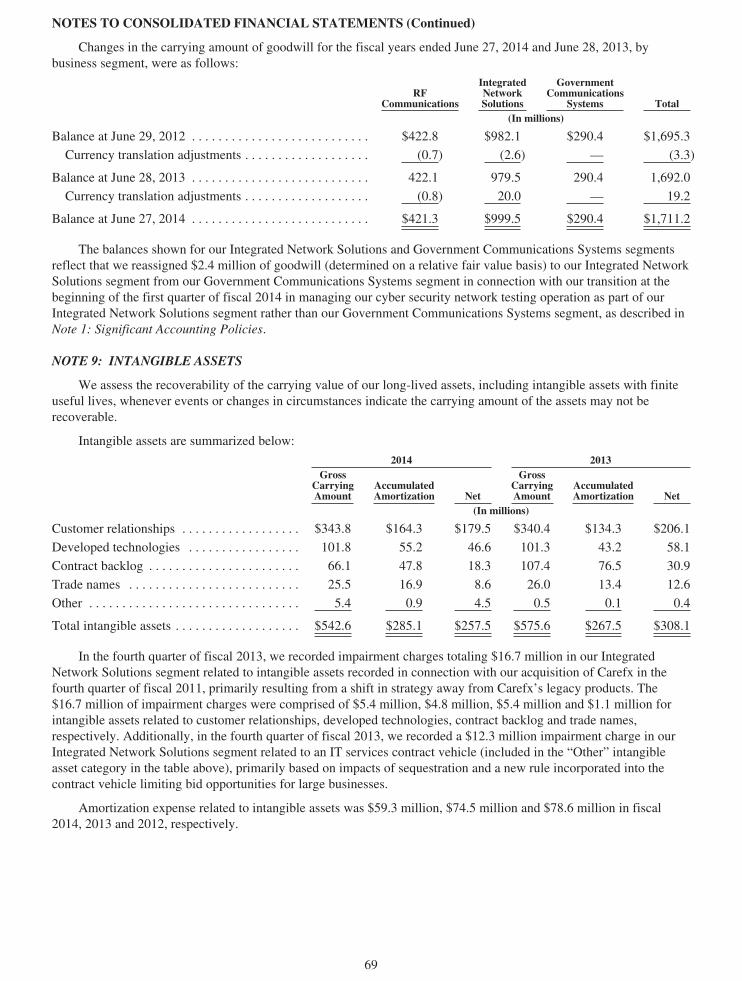

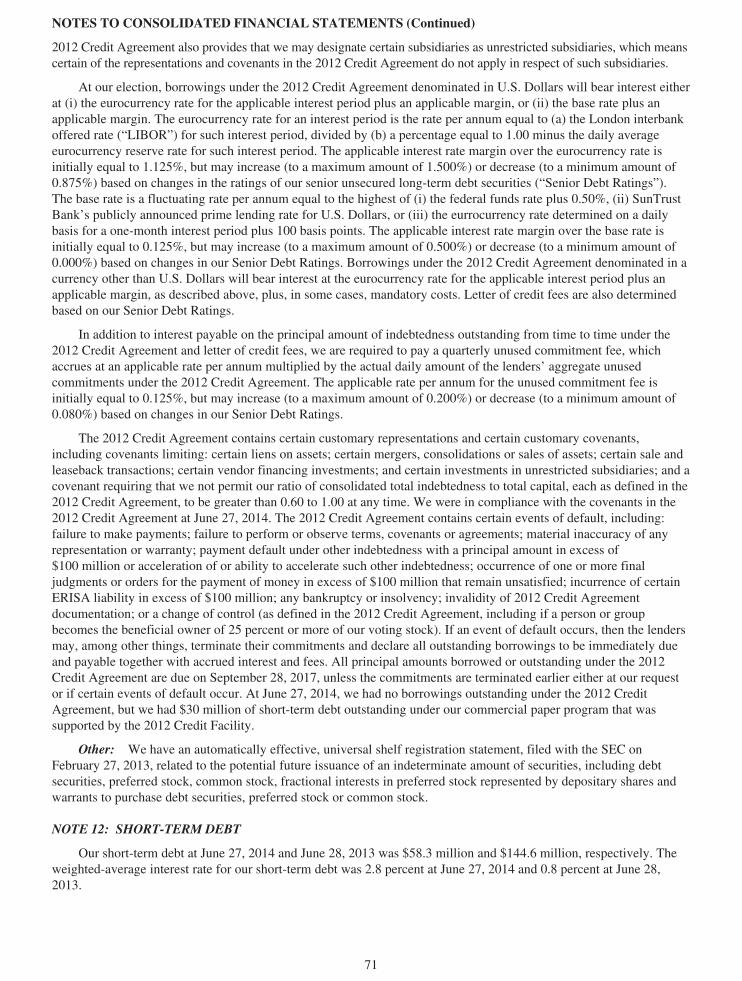
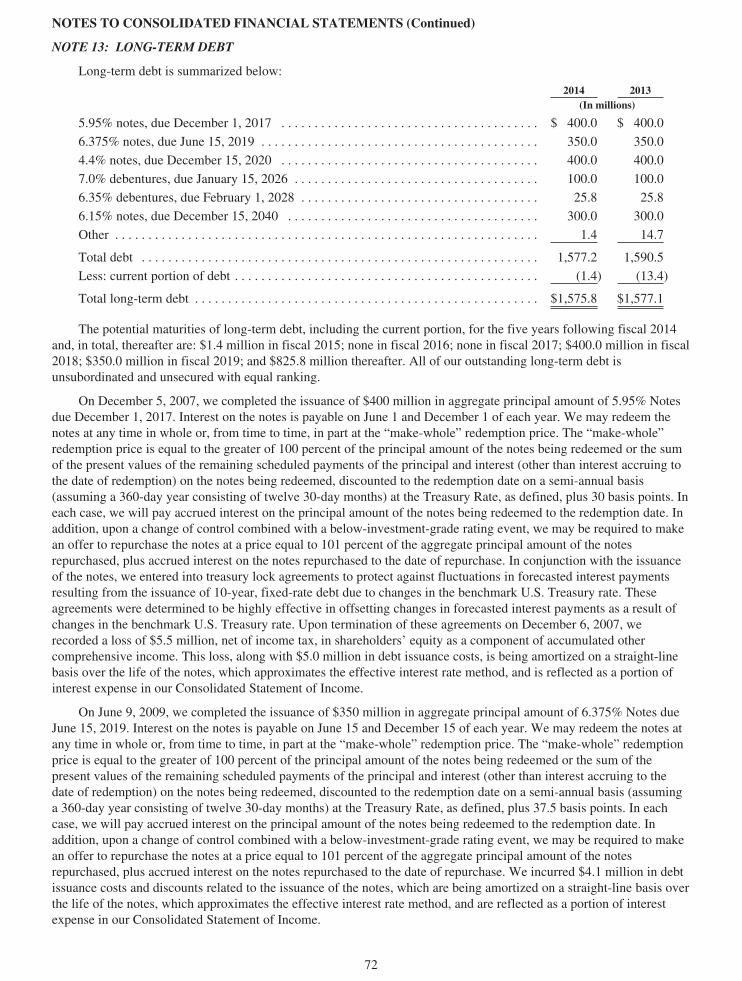
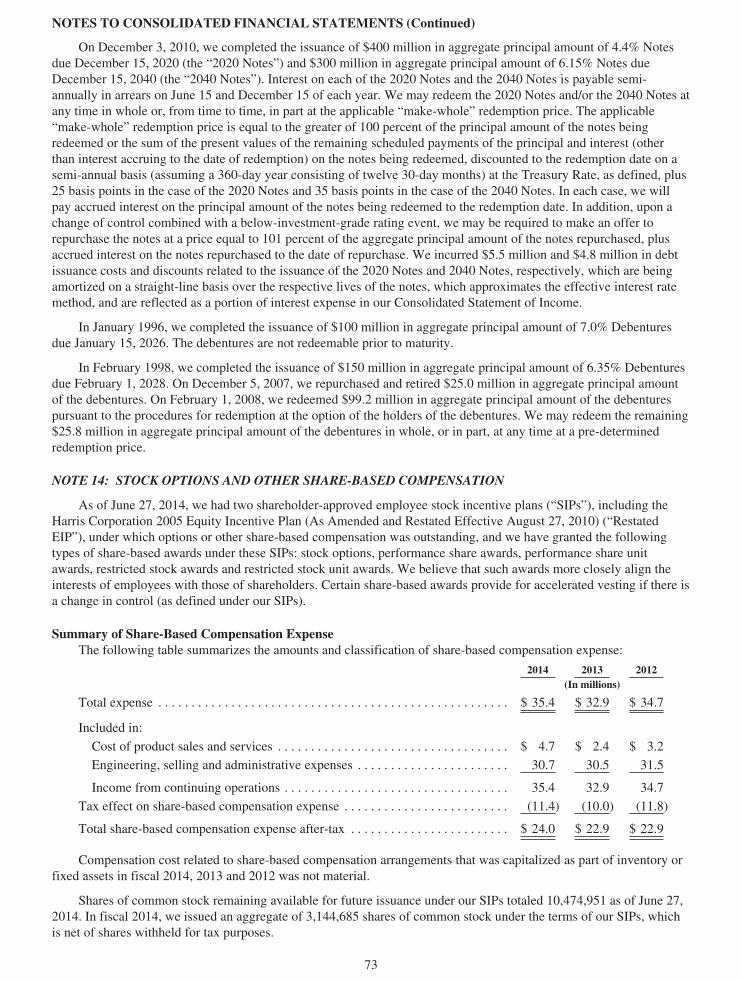

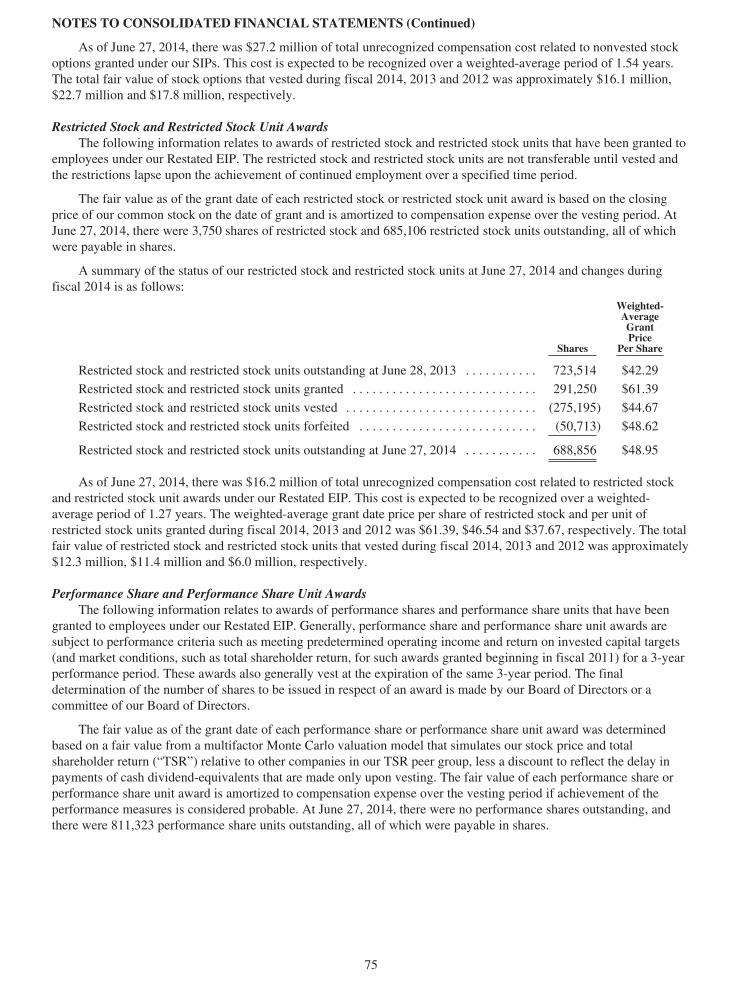
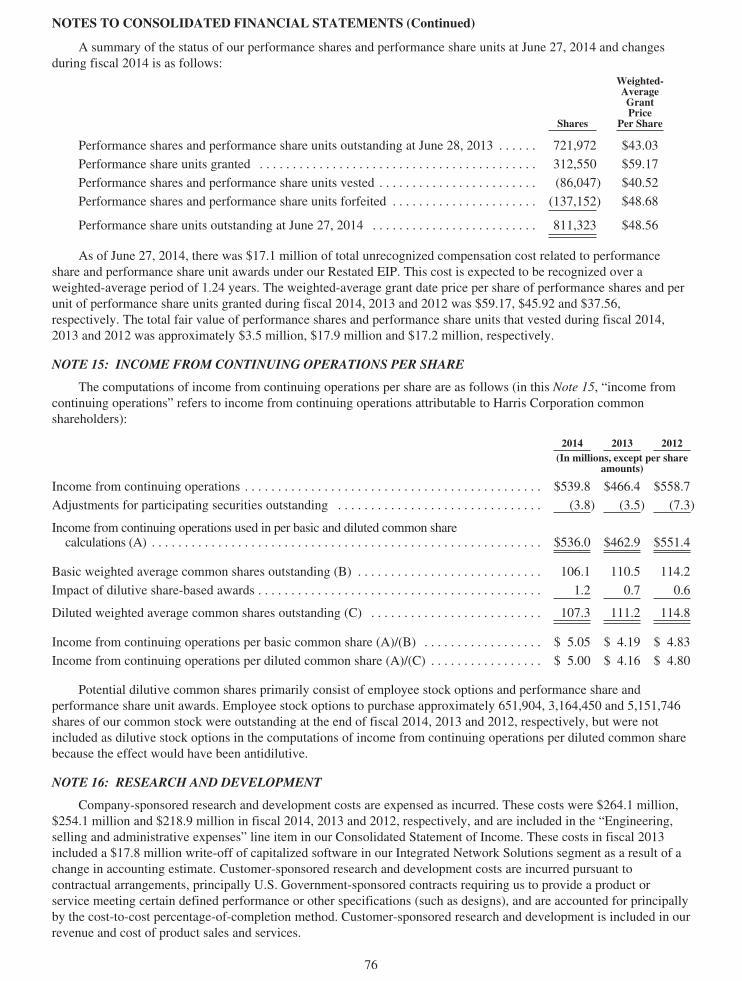

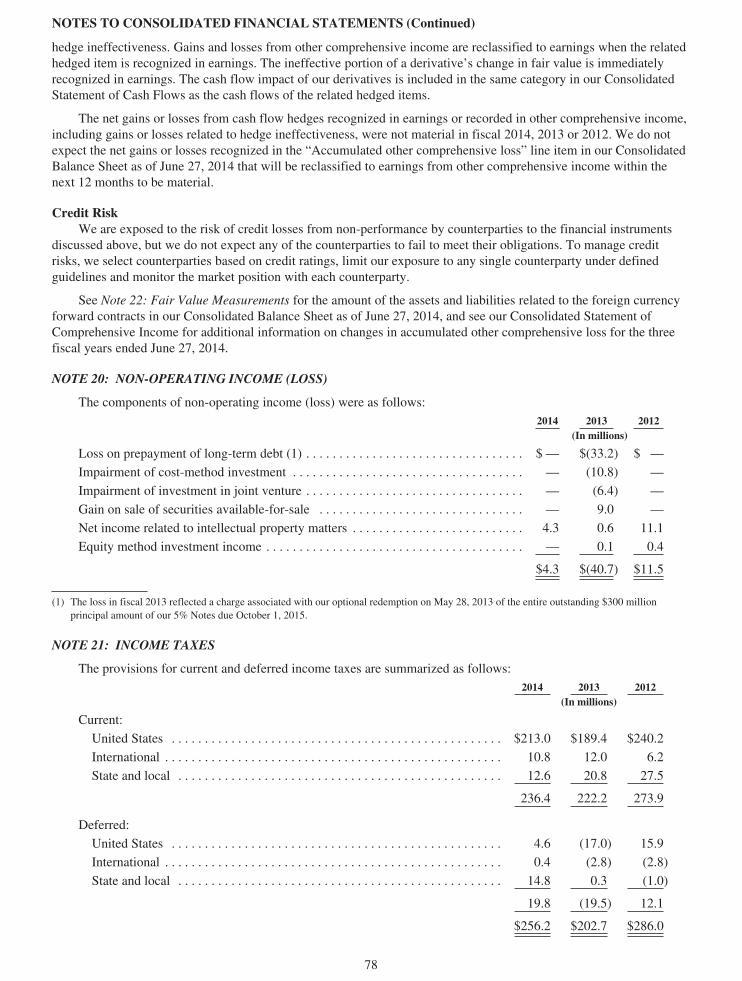
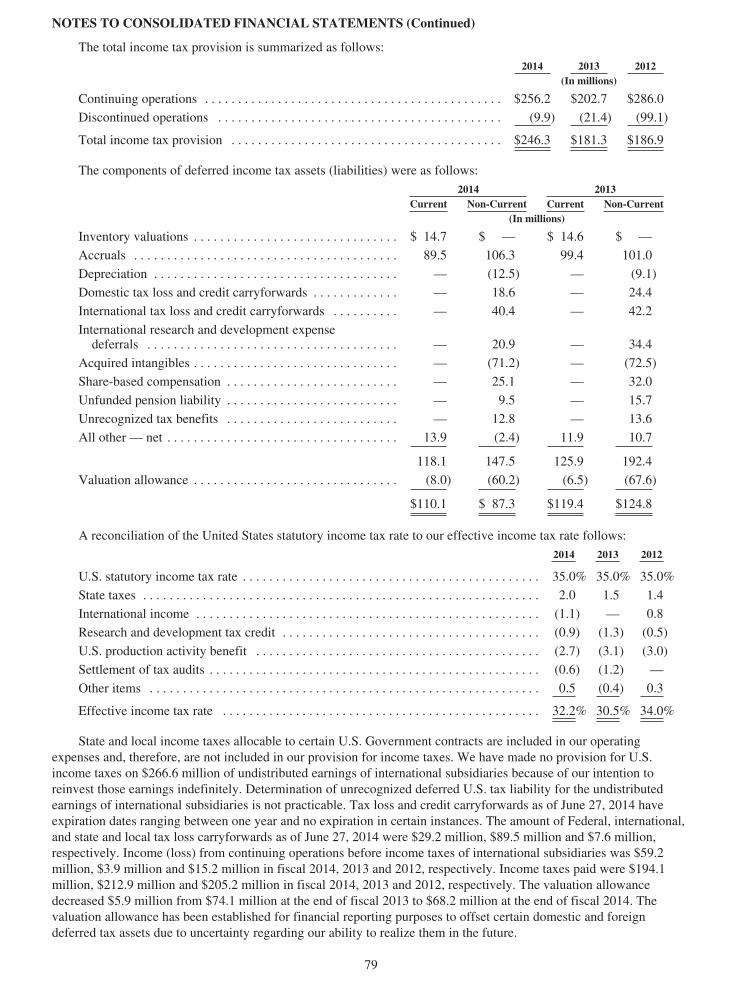

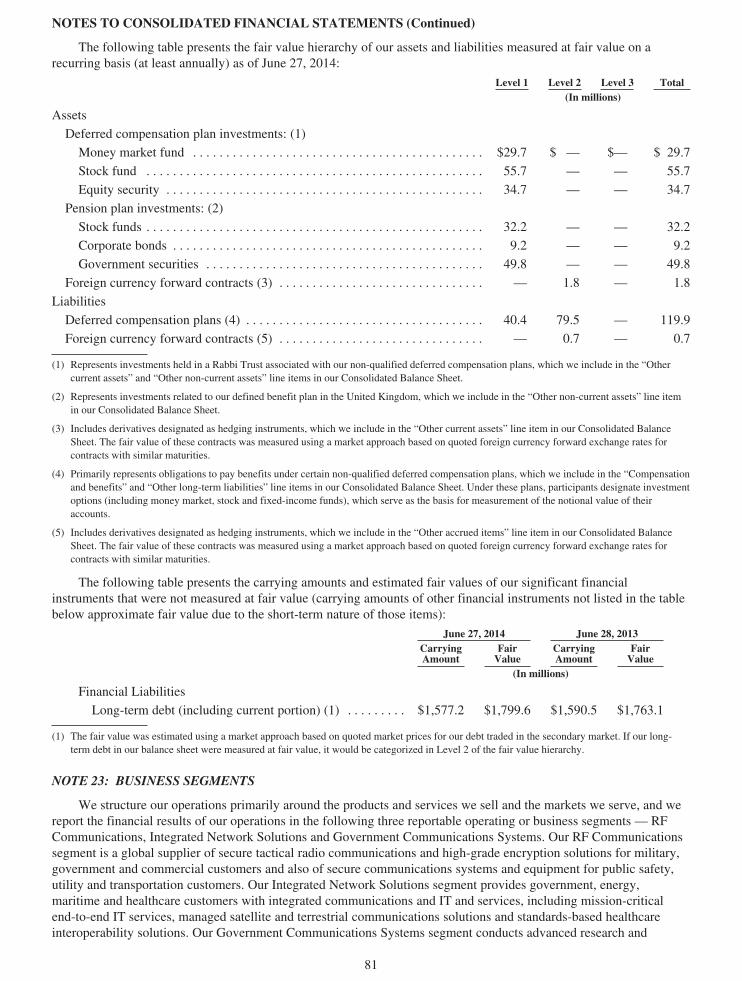

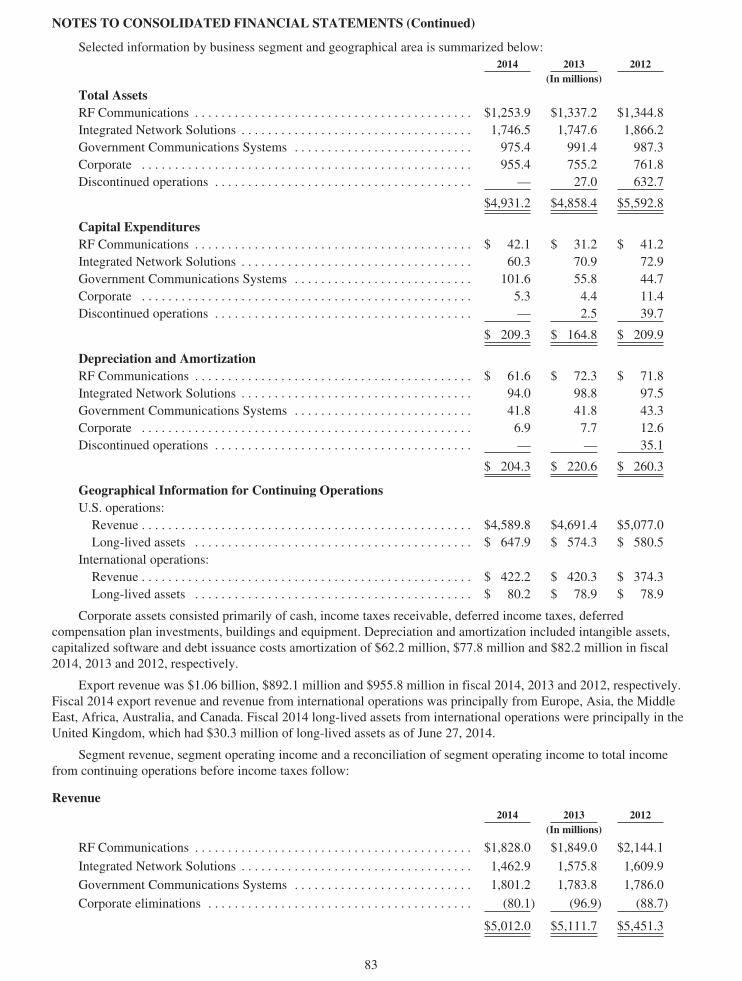
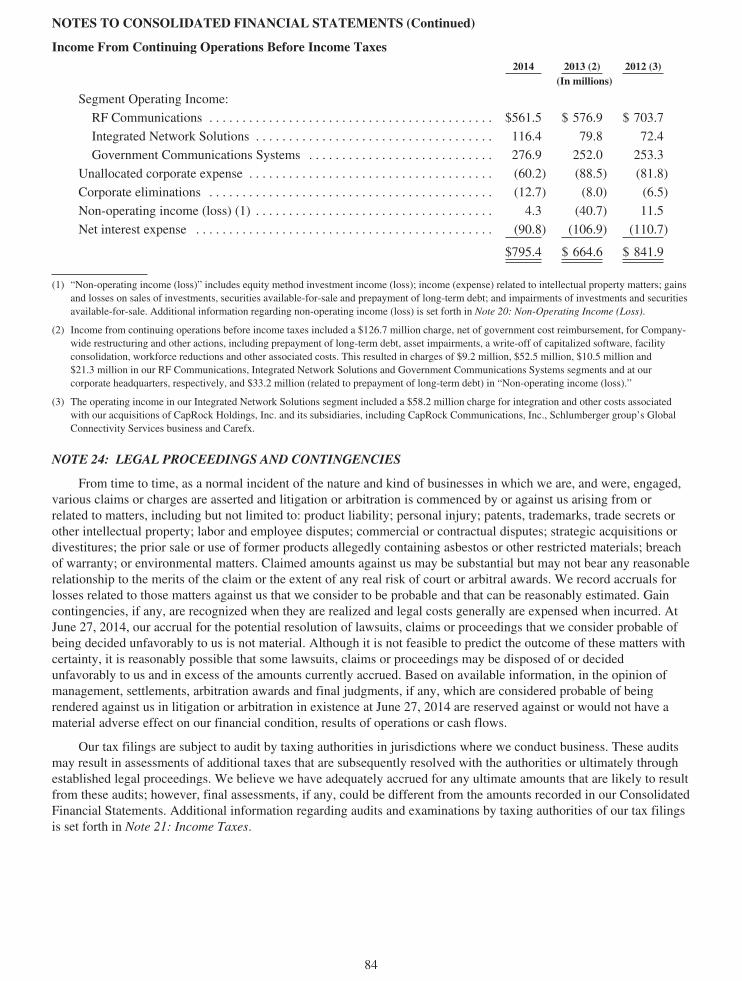
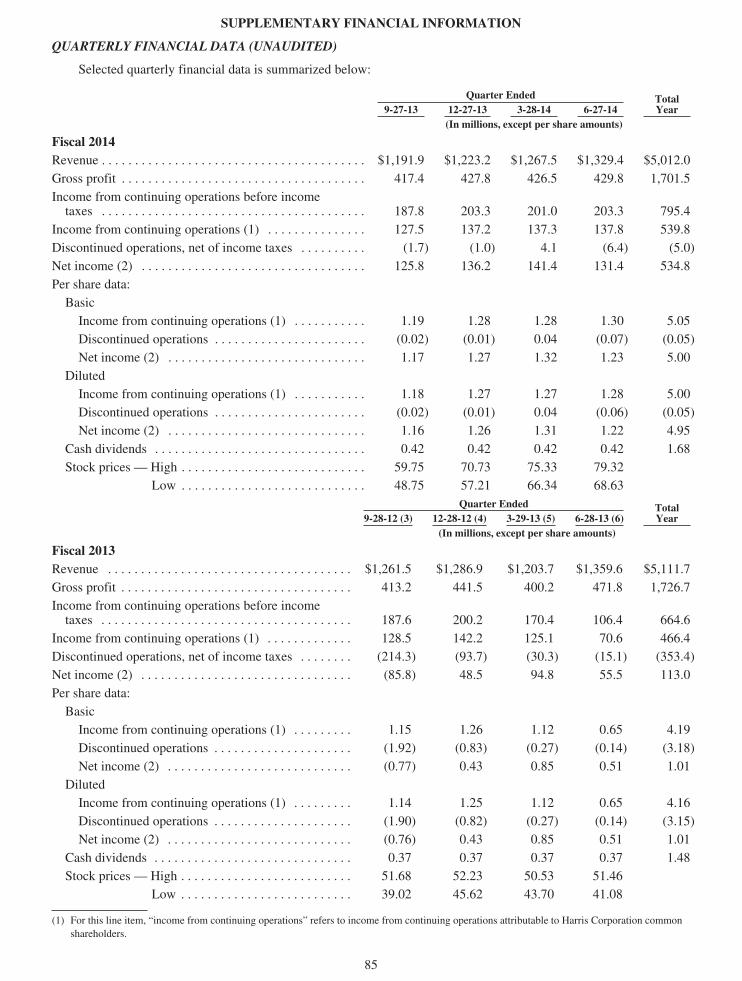


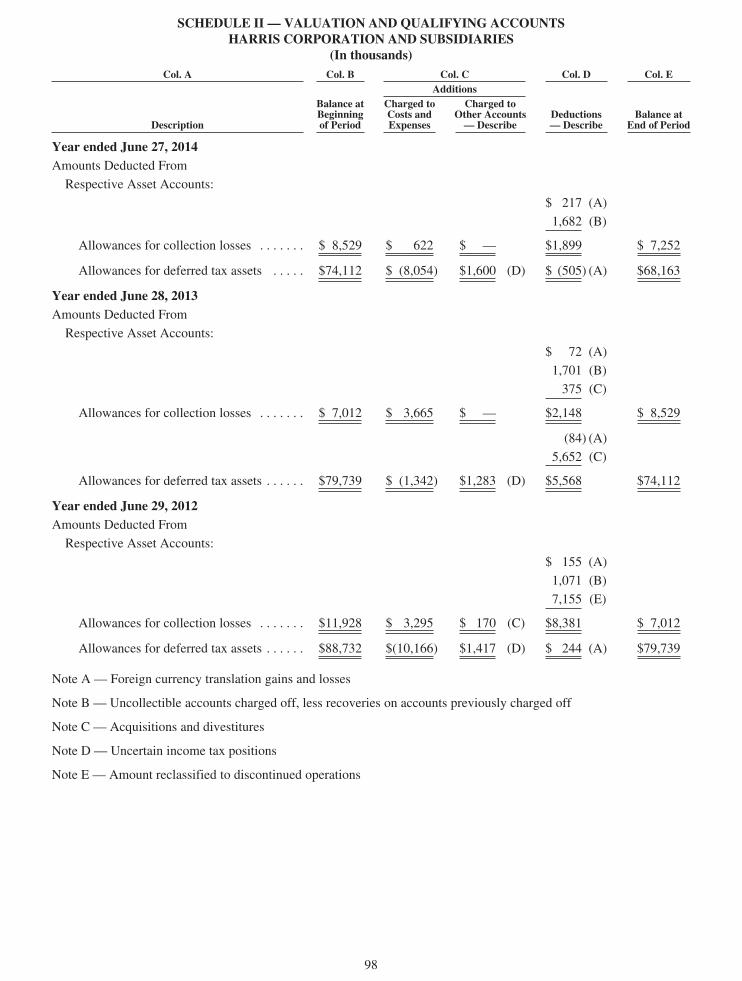
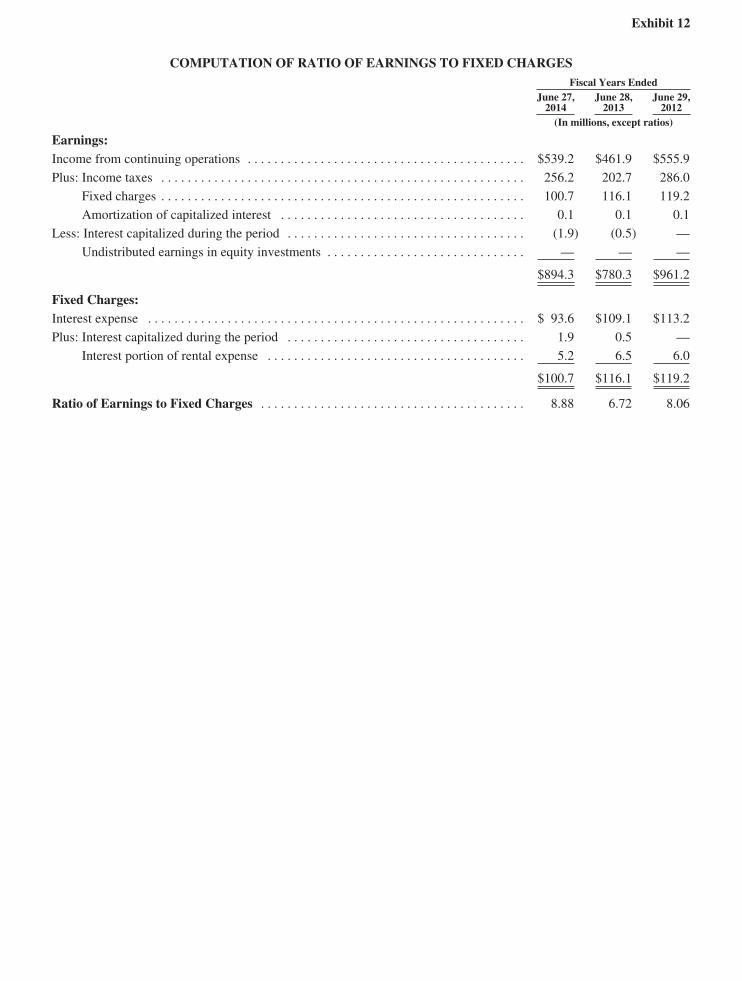

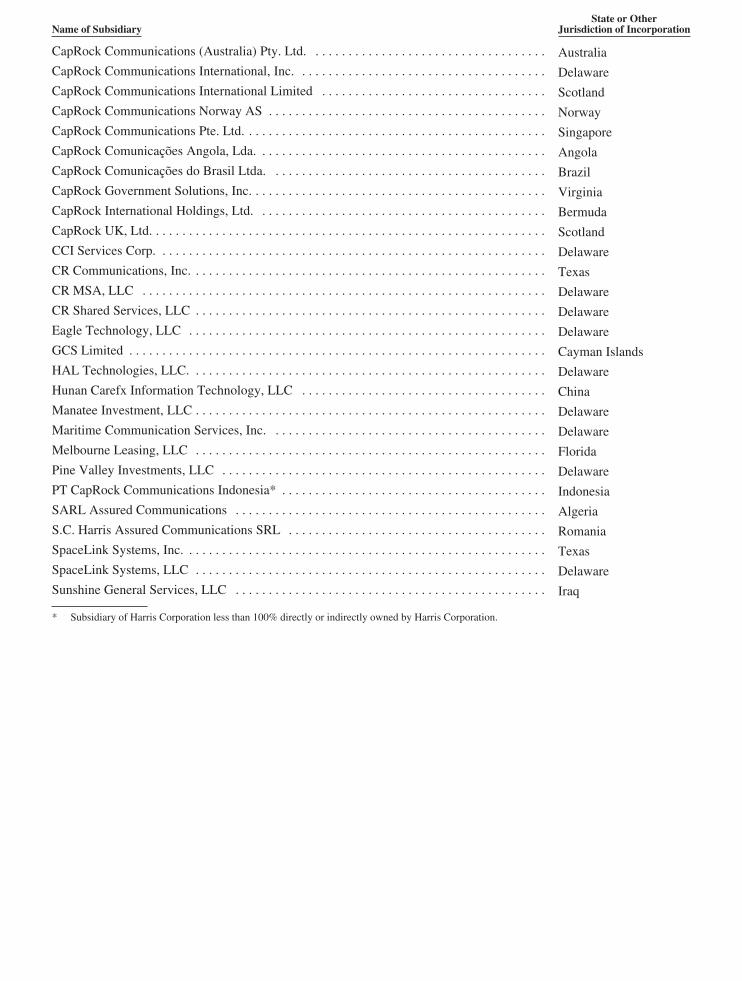


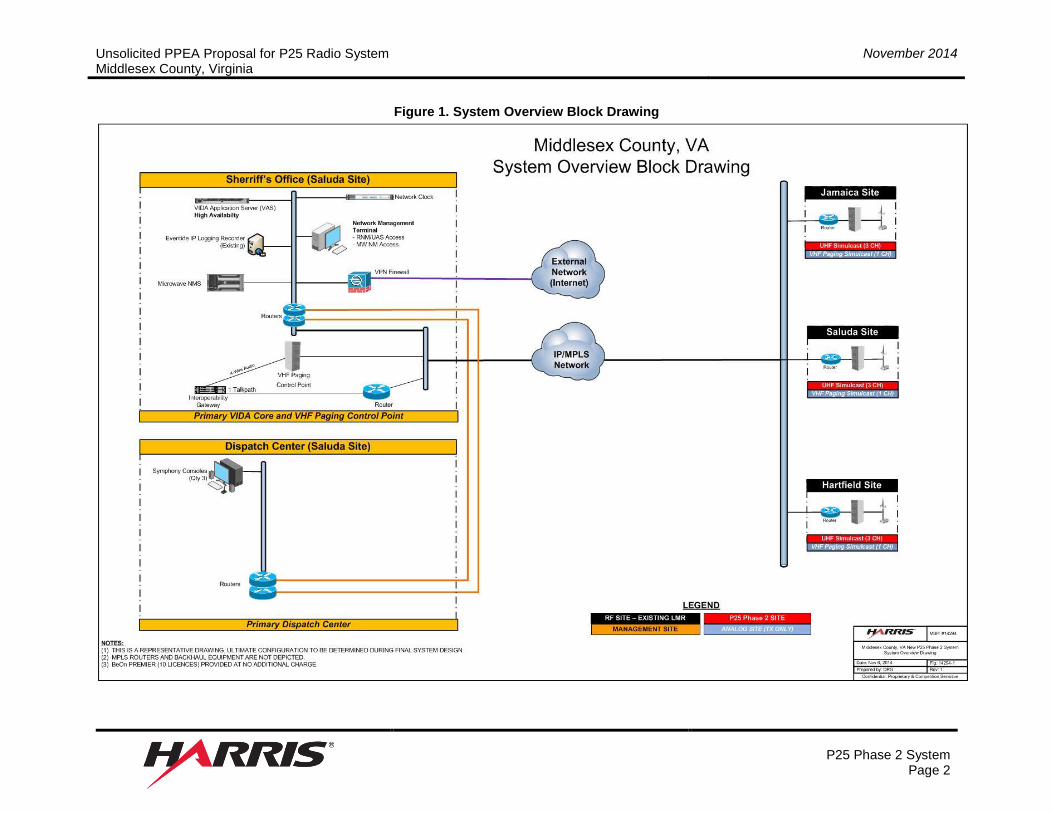

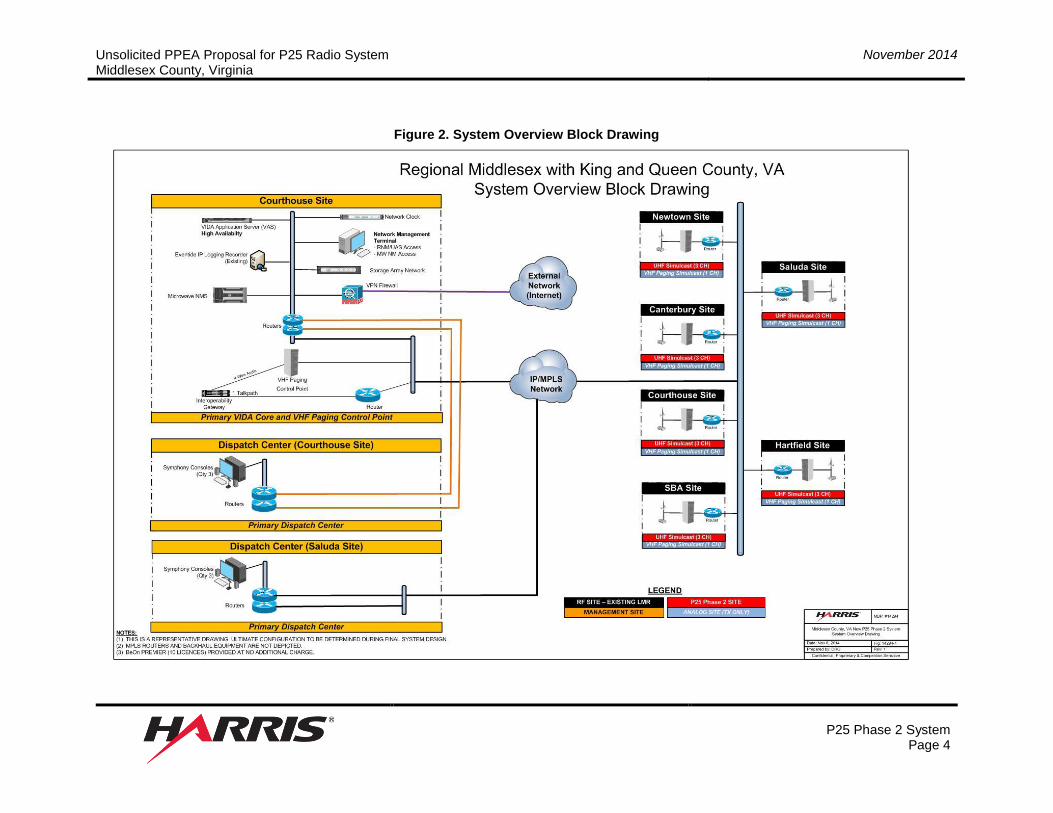
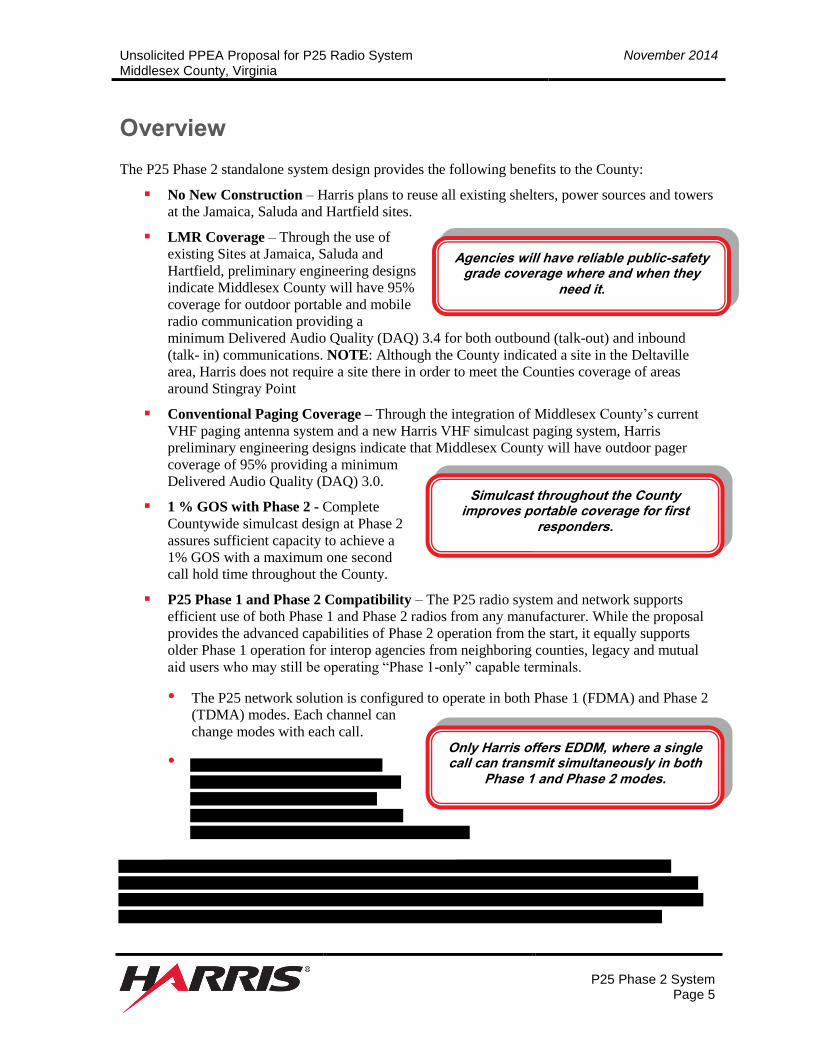


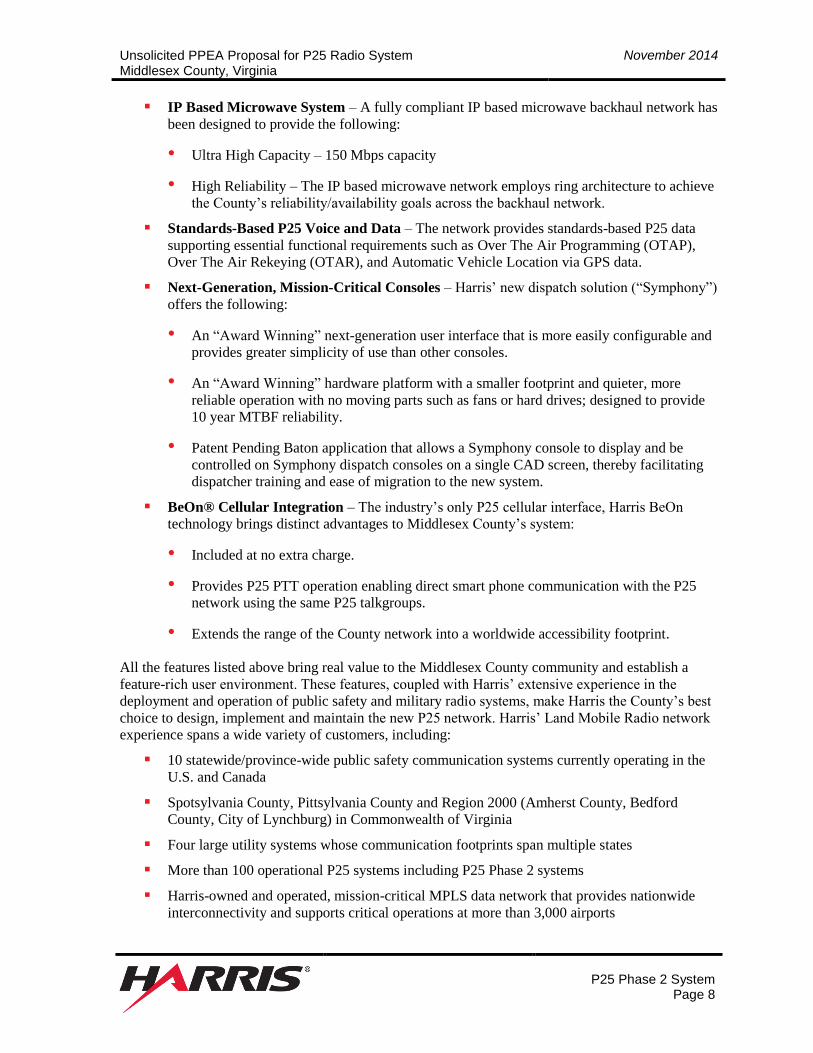

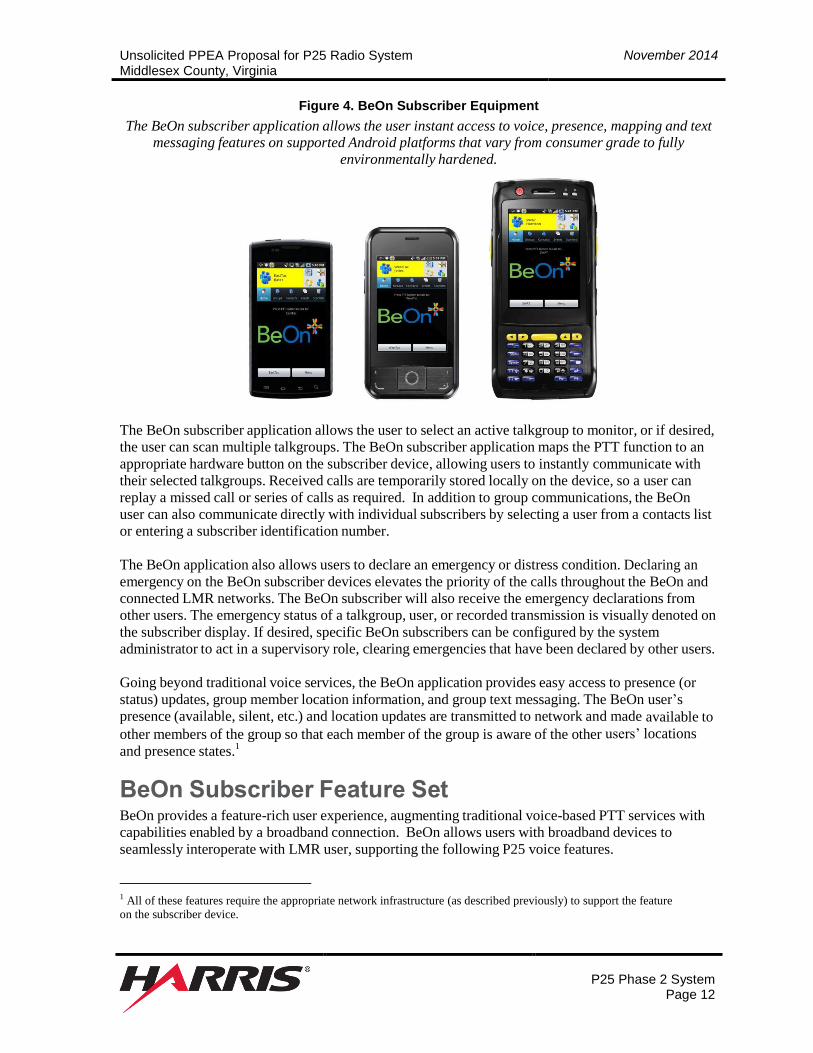
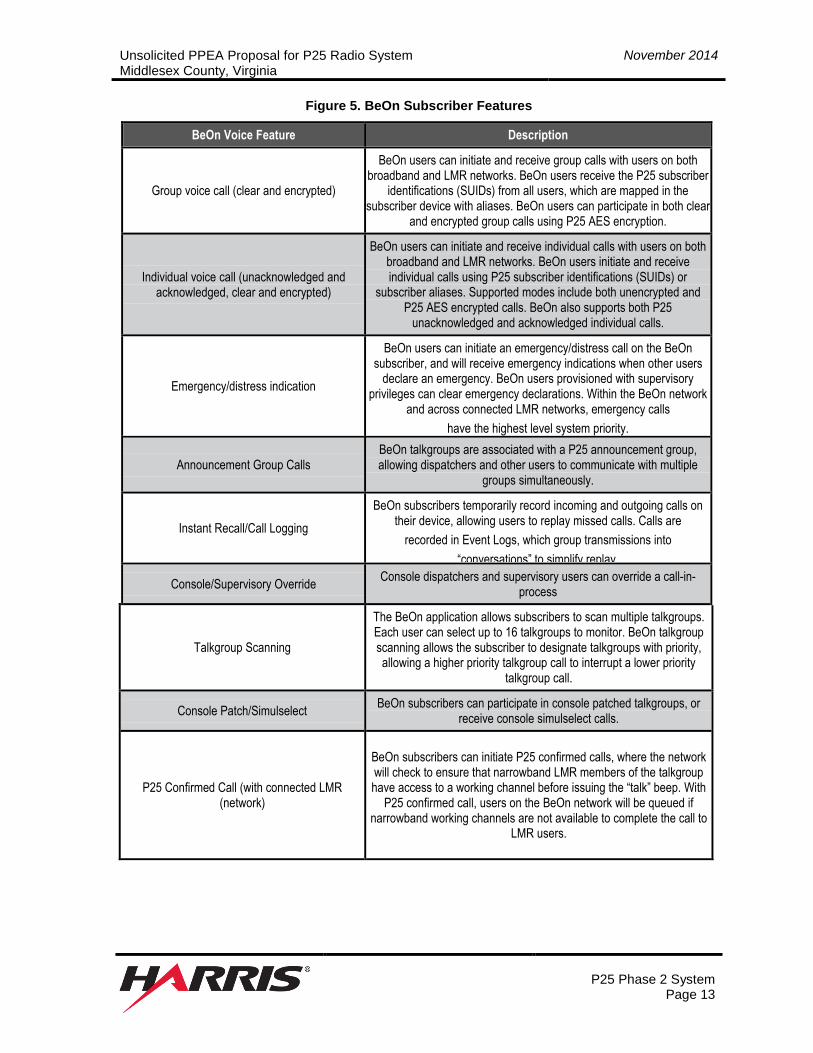
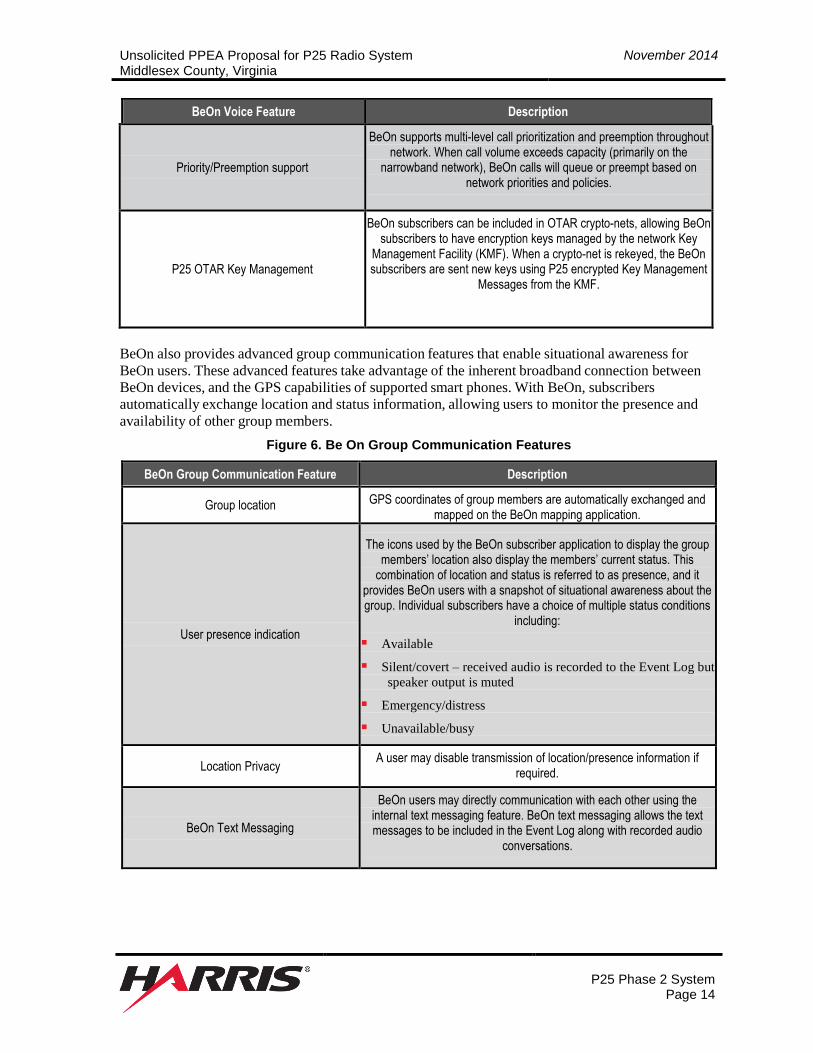
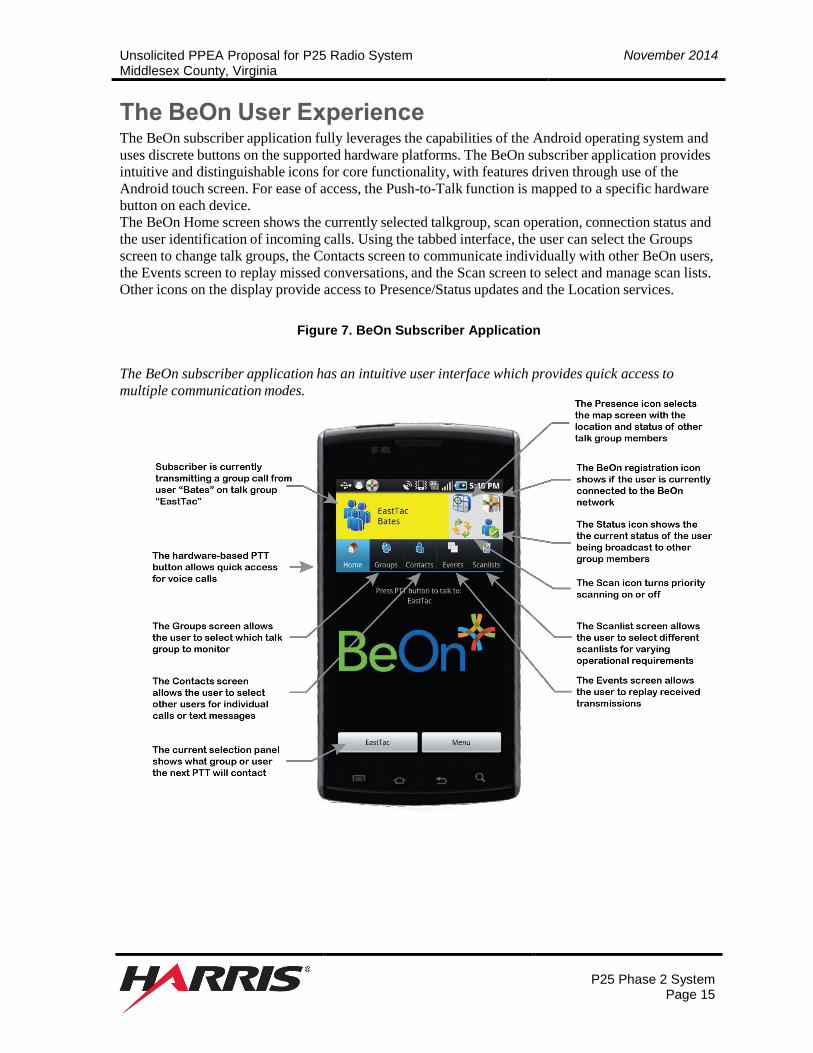


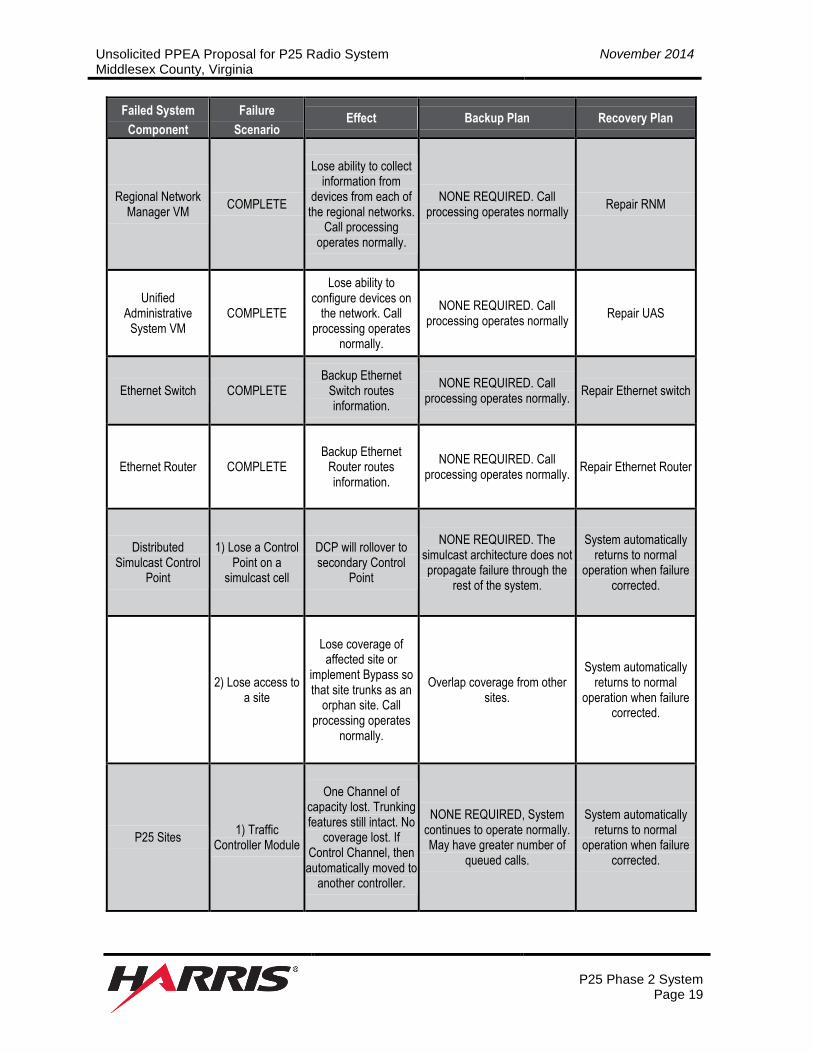
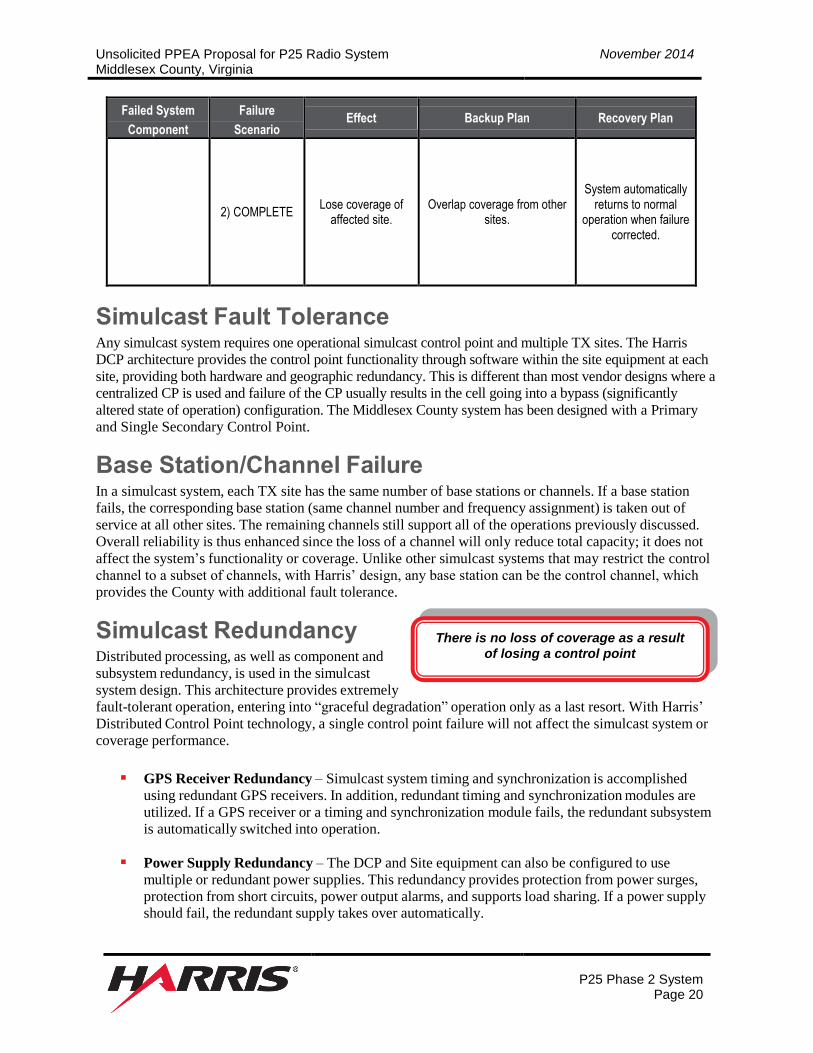
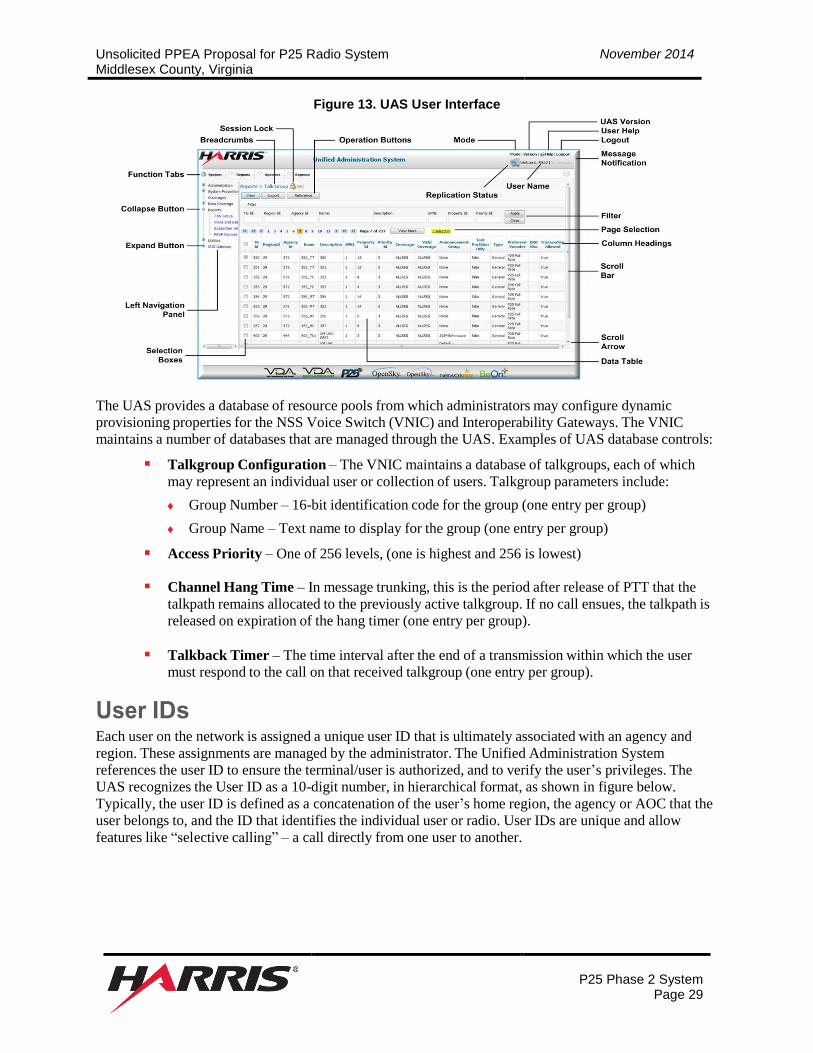
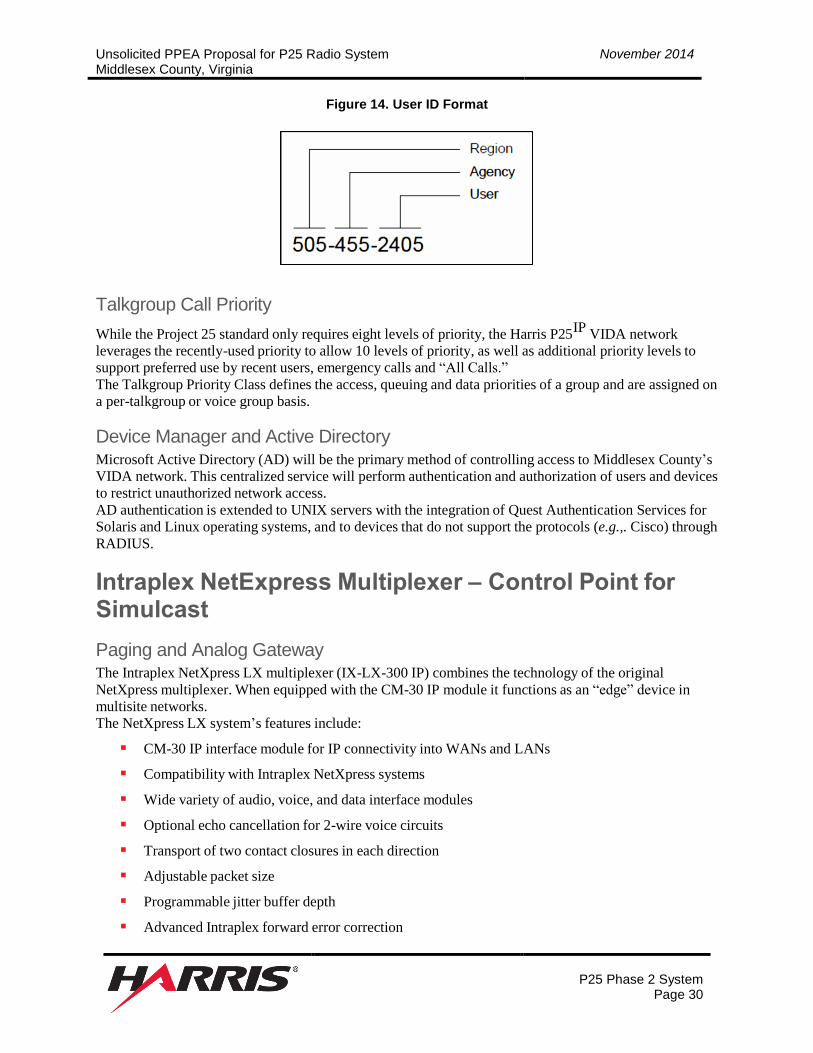
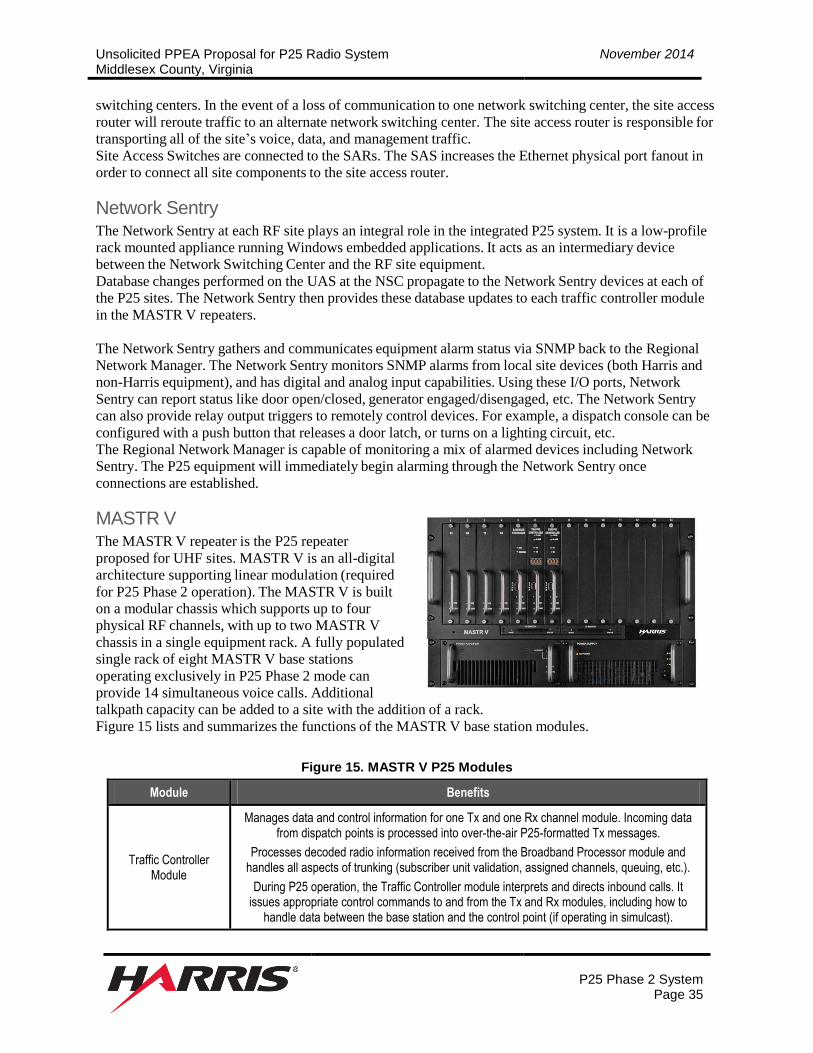
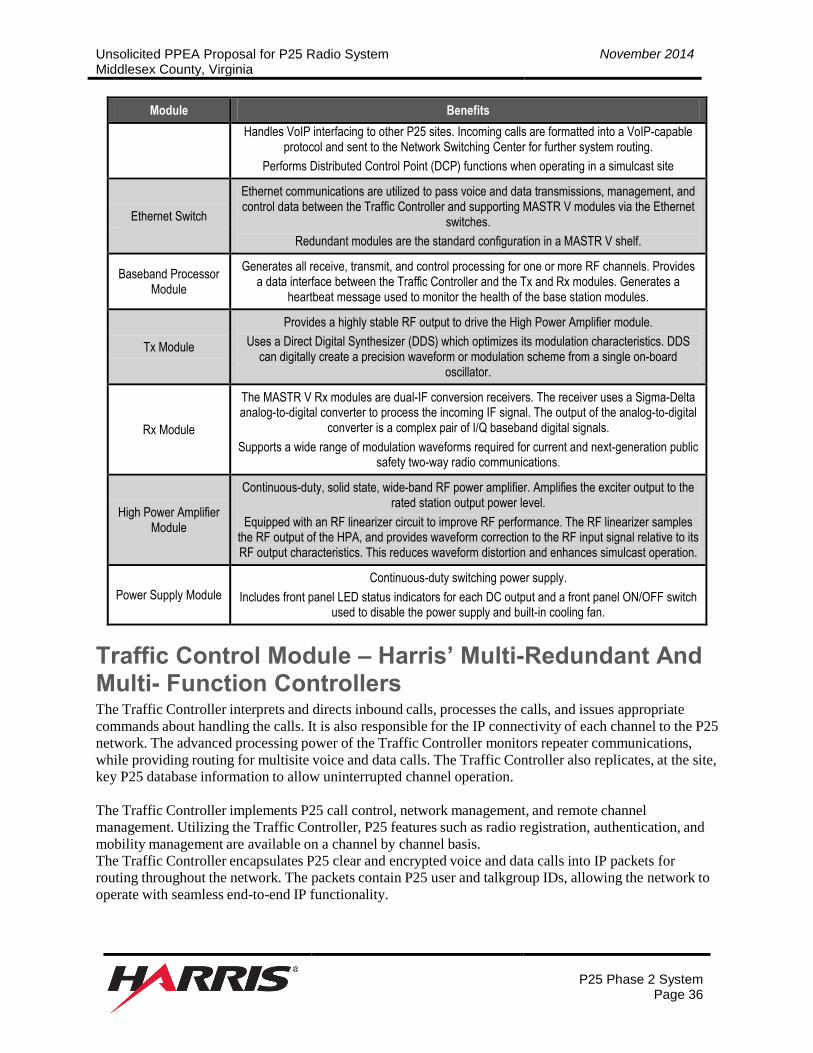
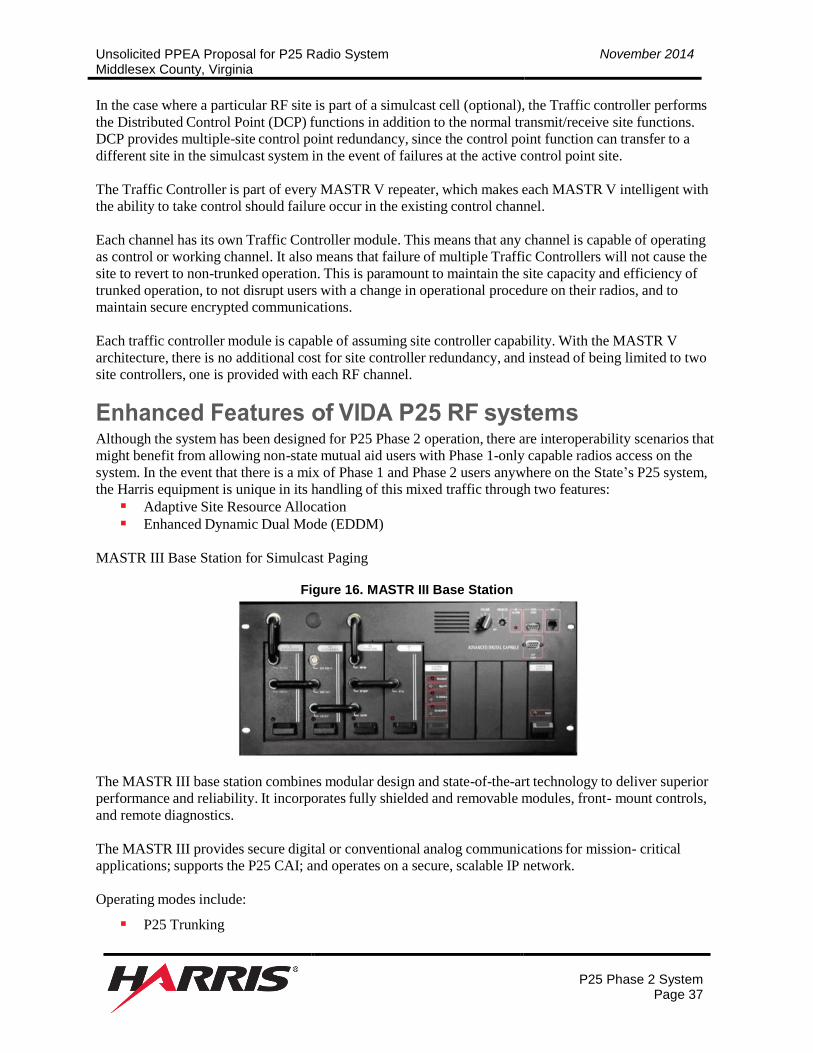
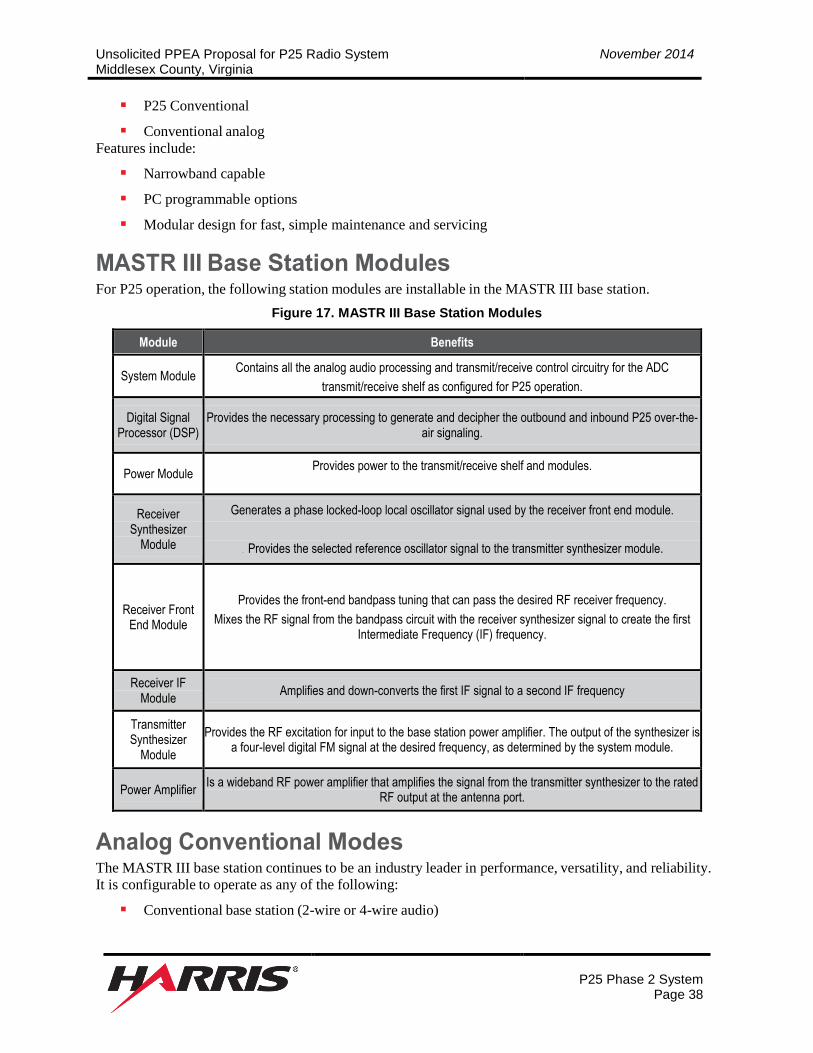
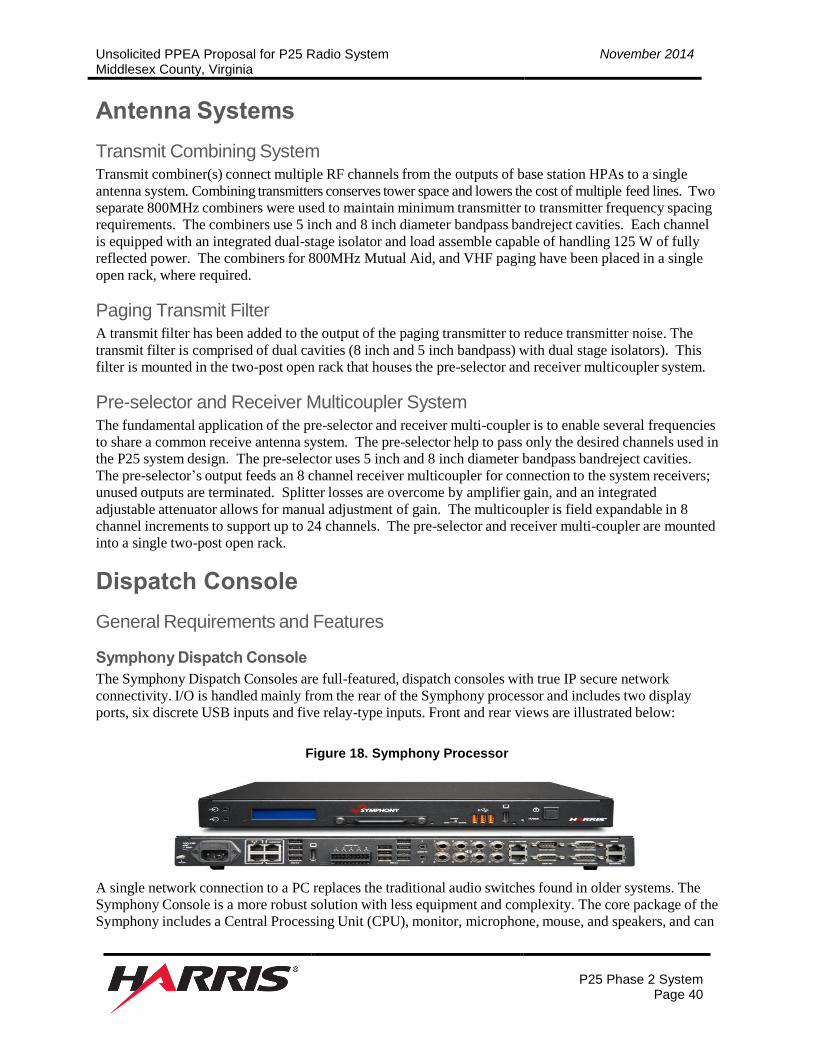
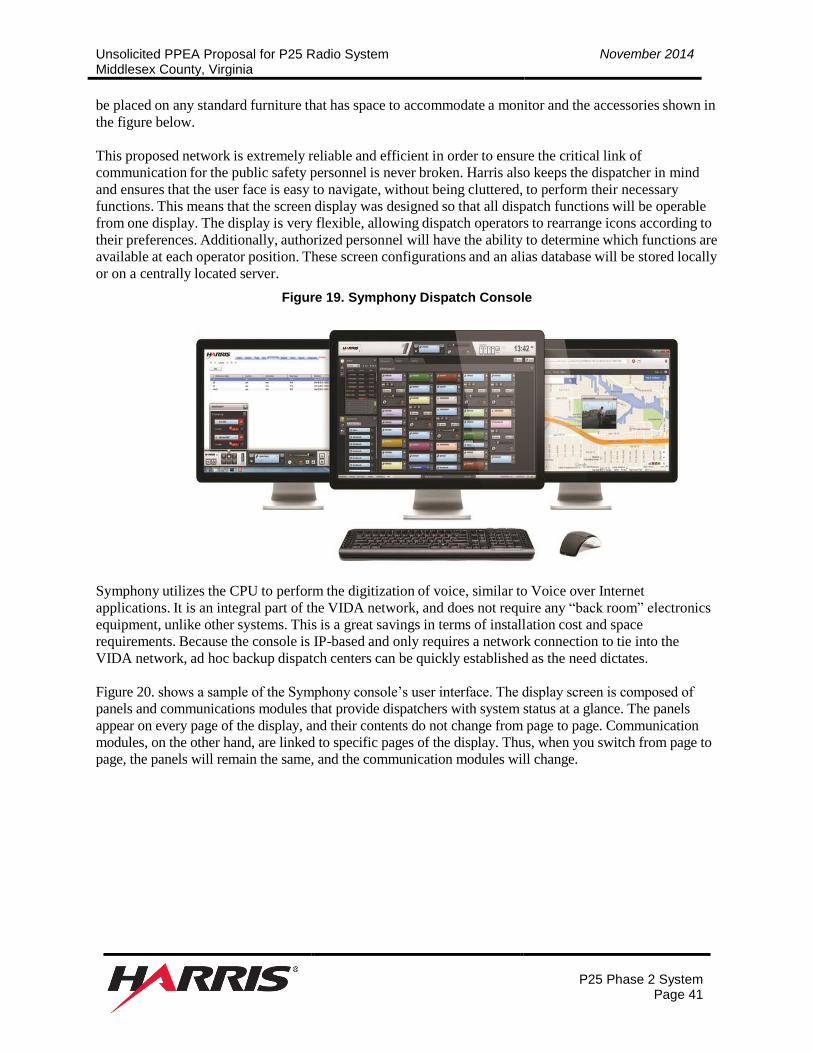
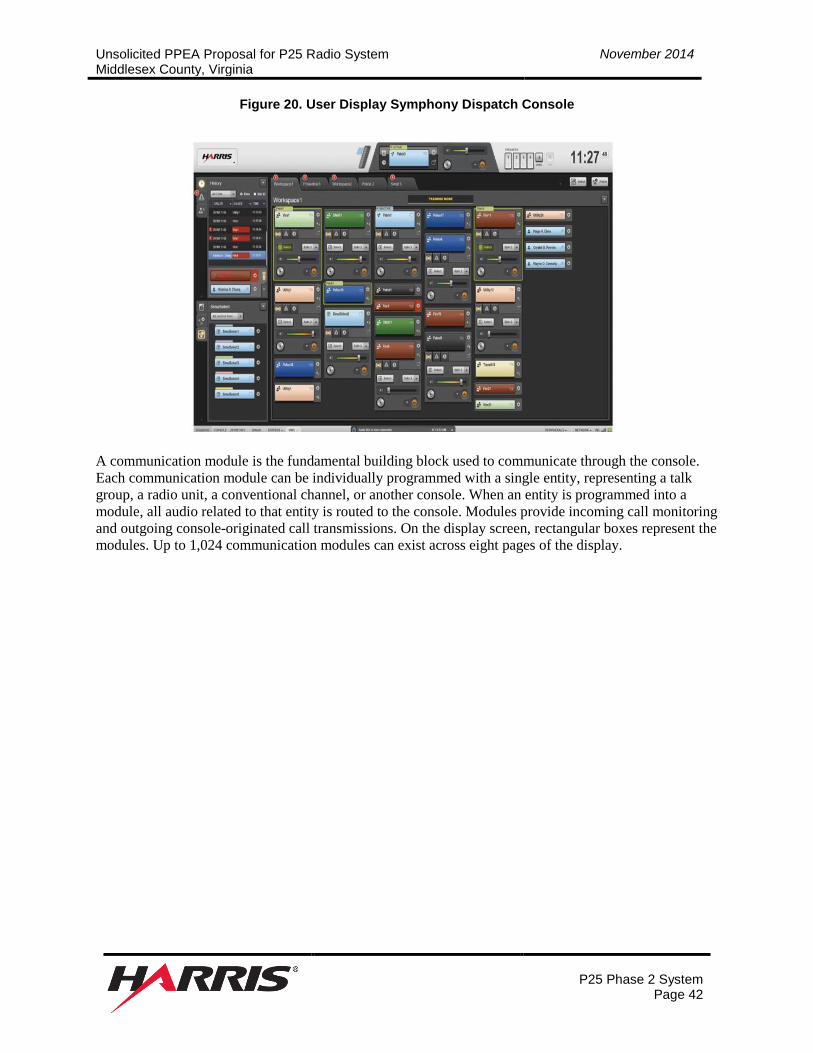


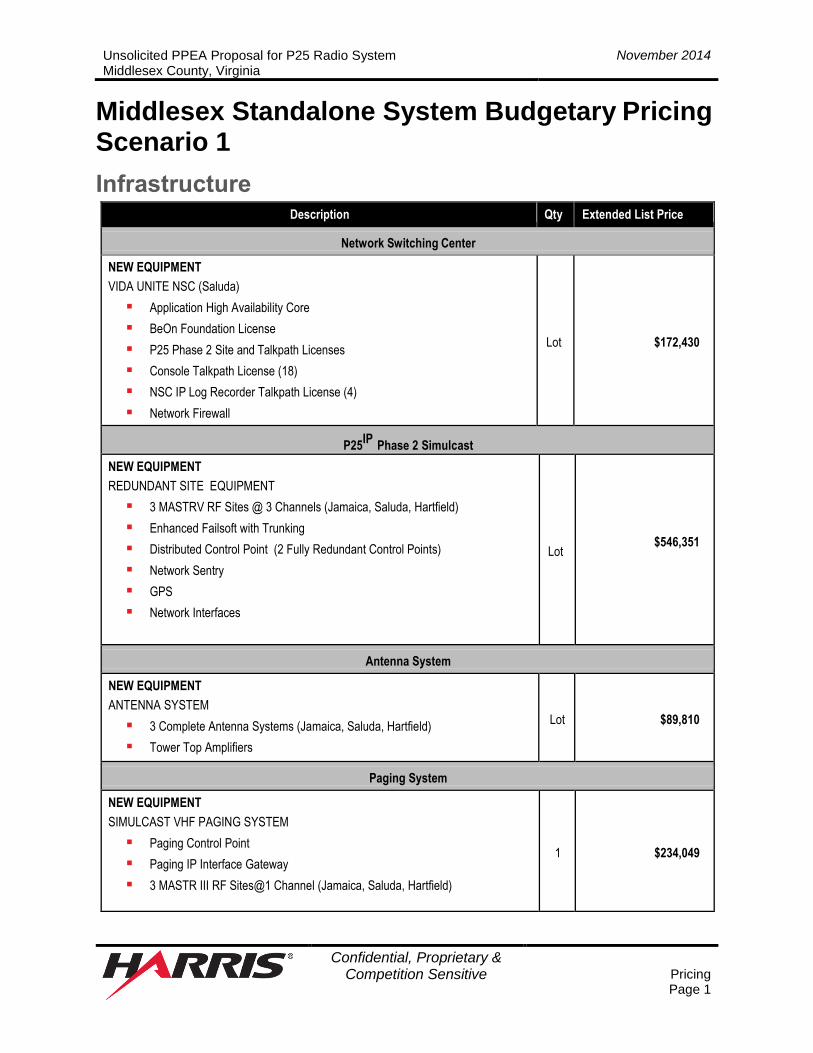
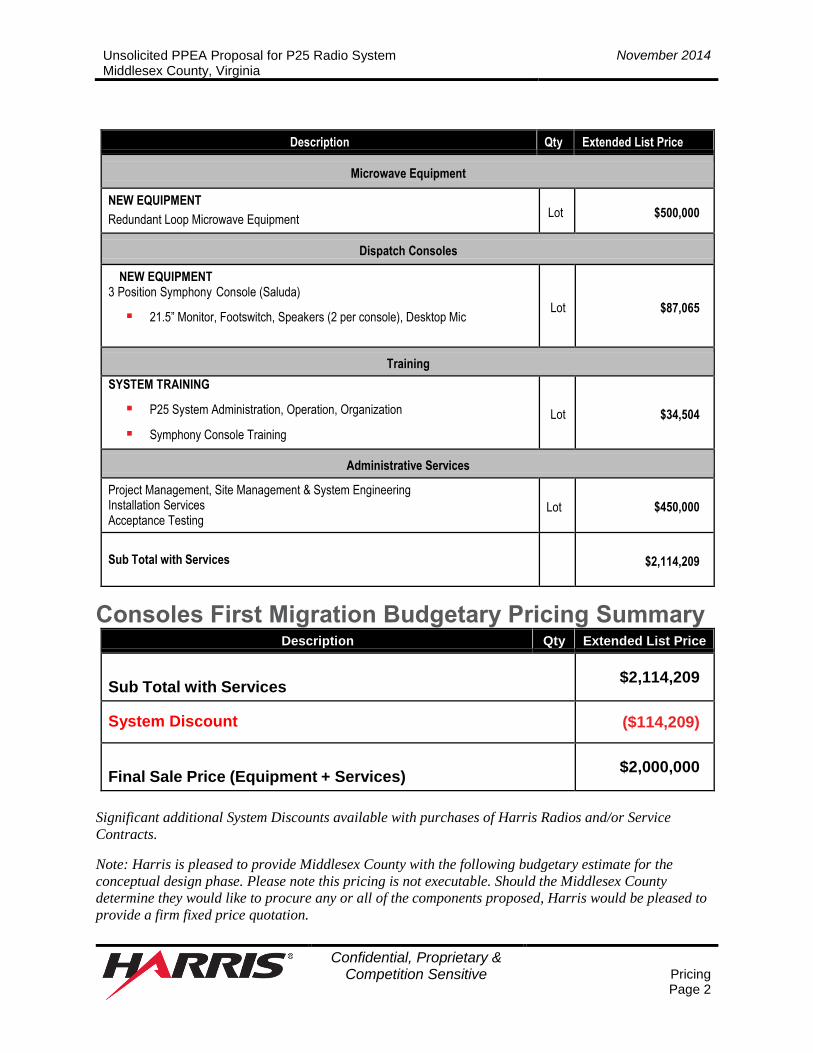
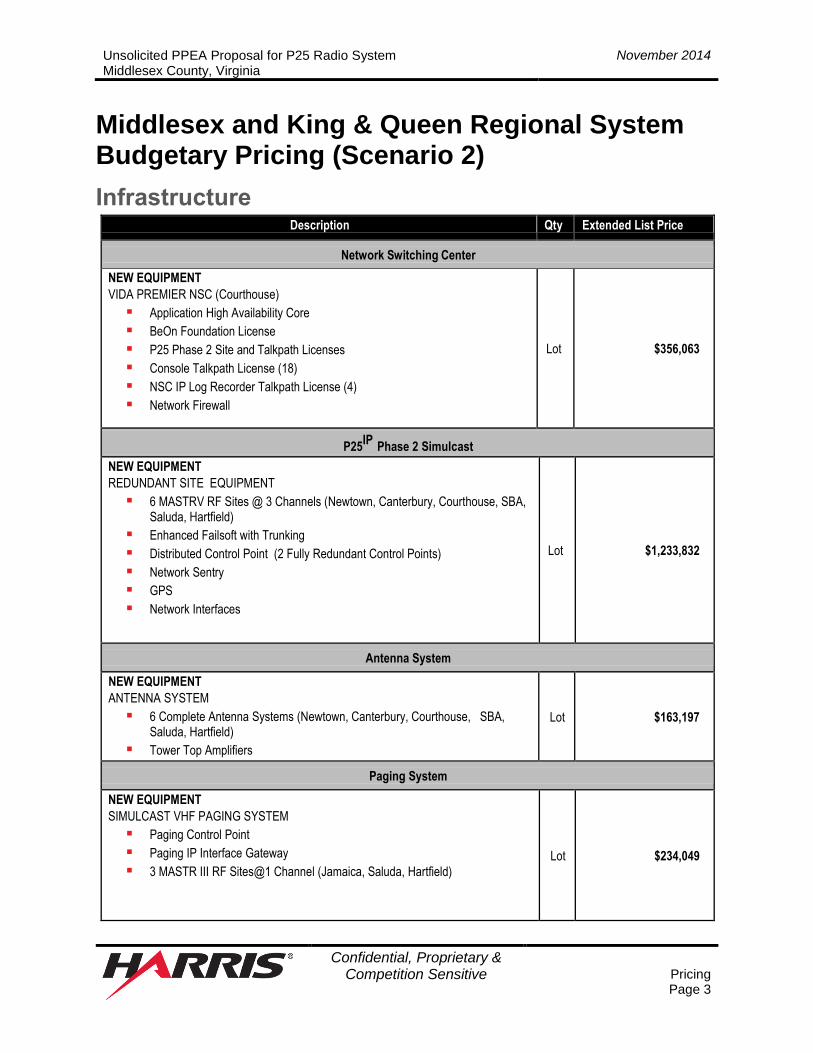
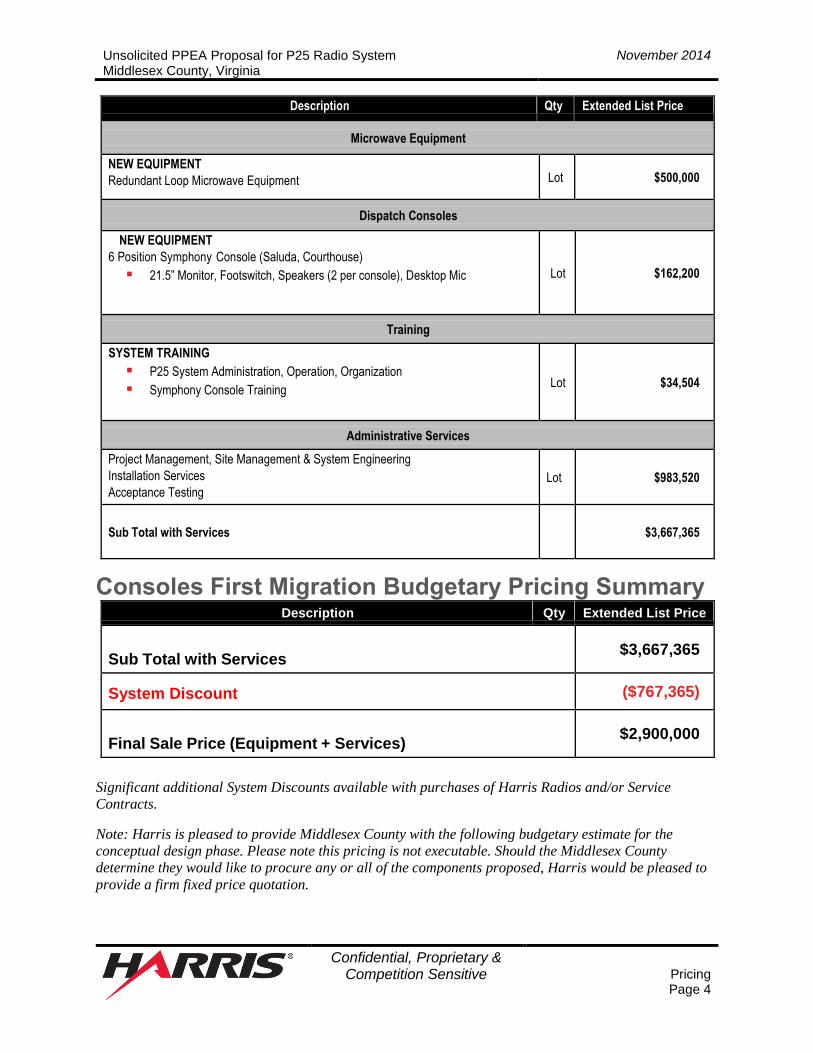
![PURPOSE - commonwealthconnect.virginia.gov€¦ · Web viewThis Public-Private Education Act (PPEA) Request for Proposal (RFP) by the County of . XXX [Or Counties, or PDC], Virginia,](https://static.documents.pub/doc/80x56/5e1c279a6bec5360d238b582/purpose-web-viewthis-public-private-education-act-ppea-request-for-proposal.jpg)


