27
Connecticut... on the move! TRANSPORTATION FAST FACTS
| Date post: | 06-Mar-2018 |
| Category: |
Documents |
| Upload: | truongmien |
| View: | 216 times |
| Download: | 1 times |

Connecticut... on the move!
TransporTaTion FasT FacTs
Table oF conTenTs
3
Transportation Fast Facts 2015All information represents most recent data available
Inquiries about this fact book may be directed to:Judd Everhart
Director of CommunicationsConnecticut Department of Transportation
2800 Berlin TurnpikeNewington, CT 06131
(860) 594-3062
For more information please visit www.ct.gov/dot
General Information . . . . . . . . . . . . . . . . . . . . . . . . . . . . . . . . . . . . . . . . Funding and Projects . . . . . . . . . . . . . . . . . . . . . . . . . . . . . . . . . . . . . . . Planning . . . . . . . . . . . . . . . . . . . . . . . . . . . . . . . . . . . . . . . . . . . . . . . . . . . . Highway System . . . . . . . . . . . . . . . . . . . . . . . . . . . . . . . . . . . . . . . . . . . .Transit and Ridesharing . . . . . . . . . . . . . . . . . . . . . . . . . . . . . . . . . . . . . Passenger Rail Services . . . . . . . . . . . . . . . . . . . . . . . . . . . . . . . . . . . . . . State Ferry Service . . . . . . . . . . . . . . . . . . . . . . . . . . . . . . . . . . . . . Bicyclists and Pedestrians . . . . . . . . . . . . . . . . . . . . . . . . . . . . . . Freight . . . . . . . . . . . . . . . . . . . . . . . . . . . . . . . . . . . . . . . . . . . . . . . . . . . . . Airports . . . . . . . . . . . . . . . . . . . . . . . . . . . . . . . . . . . . . . . . . . . . . . . . . . . .
46
1012263034384249

4 5General inFormaTion
Connecticut Department of Transportation (CTDOT)
General InformatIon
The vision of the Department of Transportation is to lead, inspire and motivate a progressive, responsive team, striving to exceed customer expectations.
The mission of the Connecticut Department of Transportation is to provide a safe and efficient intermodal transportation network that improves the quality of life and promotes economic vitality for the State and the region.
Measurable Results: We will endeavor to utilize the latest technology and preserve the integrity of our current assets to provide a safe, efficient, integrated, multimodal, transportation system that offers options for mobility.
Customer Service: We are committed to consulting with our internal and external stakeholders in an open and transparent decision-making process; and to being responsive by providing timely information on services and programs.
Quality of Life: We will strive to maintain and enhance the quality of life in the State and the region by maintaining the character of our communities, supporting responsible growth, and by enhancing and being sensitive to the environment.
Accountability & Integrity: We will prudently manage and invest the human and financial resources entrusted to the Department using sound criteria and efficient, cost-effective methods that put safety and preservation first.
Excellence: We will demand excellence in all we do to fulfill our mission by being solution-oriented and focused on project delivery. We will continuously re-evaluate our mission, values, performance and priorities to ensure that the Department and its employees are innovative and responsive to changing needs.
Vision
Mission
Values
CTDOT Organizational Chart
Commissioner’sOffice
Bureau of Engineering & Construction
Bureau of Finance &
Administration
Bureau of Highway
Operations
Bureau of Policy & Planning
Bureau of Public
Transportation
Engineering
Construction
Human Resources
Finance
Operations & Support
External Audit
Contract Administration
Rail
Transit & Ridesharing
State Maritime
Policy & Planning
Transportation Maintenance
Highway Operations
936 employees
416 employees
1511 employees
118 employees
104 employees
Note: Total employees = 3,085. Employee numbers listed are as of July 1, 2015.

6 7FundinG and projecTsfundInG and Projects
CTDOT Capital Funds FY11 - FY15 CTDOT Capital Funds FY16 - FY20 (Anticipated)
CTDOT Operating Funds FY11 - FY15
The capital funds reflected here represent new funds made available to CTDOT each year for projects, whereas CTDOT’s Capital Plan (not shown) represents funds programmed by year for specific projects. These capital funds apply to all transportation modes, except aviation.
The capital funds reflected here represent anticipated funds made available to CTDOT each year. In June 2015, the legislature approved an additional $2.8 billion (Ramp-Up) over the next five years as part of the Let’sGoCT! initiative.
The operating funds reflected here represent CTDOT appropriated expenditures, including debt service, public transportation operations, highway operations, and personnel.
Mill
ions
of D
olla
rs
Mill
ions
of D
olla
rsM
illio
ns o
f Dol
lars
Fringe Benefits**
CTDOT Expenditures
Debt Service
Total Funds
Major Capital Project Updates
Let’sGoCT!Ramp-Up
State Bonds and Special Authorizations
Total Funds
Federal Apportionments:FHWA, FTA, NHTSA
CONSTRUCTION
START YEAR
END YEAR
APPROX. COST (In Millions)
I-95 New Haven Harbor Crossing (Q-Bridge) 2008 2015 $550
Moses Wheeler Bridge Replacement 2011 2016 $250
Hartford Line Rail 2015 2017 $600
I-84 Waterbury Reconstruction 2015 2020 $340
Stamford Parking Garage (TOD) 2015 2018 $40
Rt. 8 Bridge Replacements 2015 2016 $40
West River Bridge Replacement 2014 2018 $130
Atlantic Street Bridge Replacement 2016 2019 $60
Rt. 15 Stamford-New Canaan 2013 2015 $70
New Haven Rail Yard Facility Improvements 2008 2025 $1,180
I-84 Hartford Viaduct 2021 2033 $4,000 - $6,000
Waterbury Bus Maintenance Facility 2015 2017 $100
Walk Bridge Replacement 2016 2021 $670
State Bonds and Special Authorizations
Total Funds
Federal Apportionments:FHWA, FTA, NHTSA
Special FederalFunds (Rail Adminis-tration / Earmarks / New Starts, etc.)
*FY15 funds are tentative/estimated (subject to final adjustments by the Office of the State Comptroller).**Fringe Benefits figures represent all Special Transportation Fund fringe expenditures (i.e., including DMV, with majority DOT).
*
*
$647 $627 $628 $632 $632
$134 $241$66 $61
$234
$278
$566$660 $712
$701$1,060
$1,434$1,354
$1,404$1,567
0
500
1,000
1,500
2,000
FY11 FY12 FY13 FY14 FY15(est.)
$632 $632 $632 $632 $632
$764 $753 $753 $753 $753
$275$520 $552
$750 $706$1,670
$1,905 $1,937
$2,135 $2,091
0
500
1,000
1,500
2,000
FY16(est.)
FY17(est.)
FY18(est.)
FY19(est.)
FY20(est.)
$441 $440 $438 $450 $460
$533 $551 $554 $575 $593
$132 $137 $157 $163 $191$1,106 $1,128 $1,149 $1,188 $1,244
0
500
1,000
1,500
2,000
FY11 FY12 FY13 FY14 FY15(est.)

25
35
45
55
65
LargePickupTruck
Minivan MidsizeCrossover
Small SUV Fullsize Car Midsize Car CompactCar
8 9
8aAAA Connecticut Fuel Gauge Prices 8bFHWA Highway Statistics - Table FE-101A 8cConnecticut Department of Revenue Services Annual Reports 8dOil Price Information Service
9a FHWA Highway Statistics – Table FE-9 9b2013 Connecticut Comprehensive Energy Strategy9cEPA and NHTSA Fuel Economy Standards
Fueling Transportation Funding Transportation
Gas Prices in Connecticut 2011-2015
Diesel Prices in Connecticut 2011-2015
Connecticut and the Federal Highway Trust Fund (HTF)9a
Corporate Average Fuel Economy (CAFÉ) Standards
Pric
e Pe
r Gal
lon
Pric
e Pe
r Gal
lon
Federal Gas Tax = 18.4 cents per gallon (since 1993)8b
State Gas Tax = 25 cents per gallon (since 2001)8c
Gross Receipts Tax = 8.1% of wholesale price (adjusted in 2013 with assessment capped at $3.00) 8c
Federal Diesel Tax = 24.4 cents per gallon (since 1993)8b
State Diesel Tax = 50.3 cents per gallon (7/1/15-6/30/16)8c
Federal fuel efficiency standards, along with consumer demand for more fuel efficient vehicles, are resulting in a more fuel efficient fleet. While this trend improves our nation’s energy security, saves consumers money at the pump, and reduces greenhouse gas (GHG) emissions, the increased fuel efficiency decreases gas sales and therefore reduces motor fuel taxes collected.
Total Gas Taxes8c
(Federal, State, and Gross Receipts)
Costs for Crude Oil, Refining, Distribution, & Marketing8d
Retail Price8a
Over the last several years, Connecticut has received almost twice as much Federal funds than it contributed in motor fuel and other tax payments to the HTF. However, due to the insolvency of the HTF, today, most (if not all) states receive more apportionment funding from the HTF than they contribute in tax payments to the HTF. Since 2008, in the absence of a sustainable revenue source for the HTF, Congress has approved transfers of almost $60 Billion from other funds to the HTF to keep it afloat.
Mile
s Pe
r Gal
lon
More than 60% of Connecticut’s Special Transportation Fund (STF) revenue comes from State motor fuel and oil company taxes. While oil prices fluctuated up and down over the last several years, motor fuel taxes remained relatively flat.
Total Diesel Taxes8c
(Federal and State)
Costs for Crude Oil, Refining, Distribution, & Marketing8d
Retail Price8a
Notes: If indexed to inflation, in 2015, the federal gas tax would be about 30 cents per gallon, the federal diesel tax would be about 40 cents per gallon, and the State gas tax would be about 34 cents per gallon. The State diesel tax is assessed annually to reflect wholesale fuel trends. State diesel tax from 7/1/14-6/30/15 was 54.5 cents per gallon.
$0.00$0.50$1.00$1.50$2.00$2.50$3.00$3.50$4.00$4.50
Apr '11 Apr '12 Apr '13 Apr'14 Apr'15
$0.00$0.50$1.00$1.50$2.00$2.50$3.00$3.50$4.00$4.50
Apr '11 Apr '12 Apr ' 13 Apr '14 Apr '15
Mill
ions
of D
olla
rs
CT Receipts from HTF (Federal Apportionments)
Additional Federal Funds (Non-HTF)
CT Payments to HTF (Federal Gas Taxes Collected in CT)
0
200
400
600
8002009-2013 Averages
2025 Fuel Economy Targets9c
Rule of Thumb: A 1¢ increase in the federal gas tax generates about $1.5 B for the HTF
FundinG and projecTsFundinG and projecTs
FullsizeCar
MidsizeCar

Total Population10a 3,583,561
Estimated Growth Over the Next 10 Years10b 4.5%
10 11
10aU.S. Census Bureau, American Community Survey, 2009-2013. 10b CT State Data Center at the University of CT, 2012. 10cMeasure of America, A Project of the Social Science Research Council, 2013-2014 Data Set10dBureau of Labor Statistics, Employment Status, States and Selected Areas, July 2015
PlannInG
Age Composition10a
Planning OverviewIn order to accommodate the State’s transportation needs, CTDOT must understand the population that it serves. The collection and analysis of demographic, economic, social, and housing information enables CTDOT to plan for projects and investments that will meet present and future needs.
17 & Younger
18 - 24
25 - 54
55-65
65 & Older
41%
Age
s
22%
9%
13%
15%
Population
Employment StatusCIVILIAN POPULATION 16 YEARS AND OVER10d 2,880,551
In Labor Force 66.3%Employed (Percentage of Labor Force) 94.6%Unemployed (Percentage of Labor Force) 5.4%
Not in Labor Force 33.7%
11aCenter for Neighborhood Technology’s Housing and Transportation (H+T) Affordability Index11bU.S. Census Bureau, OnTheMap Application and LEHD Origin-Destination Employment Statistics, 2011
planninG
Commuting
The average travel time to work in Connecticut is 24.8 minutes.10a
COMMUTING BY MODE10a
Drove Alone 79%Carpooled 8%Public Transportation 5%Worked at Home 4%Walked 3%Other Means (including bicycle) 1%
Housing and IncomeHOUSING AND INCOME10a
Total Number of Households 1,355,849Owner Occupied 68%Renter Occupied 32%
Median Household Income $69,461Mean Household Income $97,650Per Capita Income $37,892
COUNTY HOUSING TRANSPORTATION REMAINING INCOME
Fairfield 36% 16% 48%Hartford 29% 19% 52%Litchfield 31% 21% 48%Middlesex 34% 21% 45%New Haven 34% 21% 45%New London 30% 21% 49%Tolland 31% 22% 47%Windham 28% 23% 49%
Income Spent on Housing and Transportation(County Percentages Based on Median Household Income from Core Based Statistical Areas)11a
Jobs by Distance from Home11b
52%
30%
13%
5%
Less than 10
10 - 24
25 - 50
Greater than 50
Mile
s
Connecticut’s life expectancy at birth is 80.8 years, the 3rd highest in the nation.10c Over the next 20 years, the 65 and older population will increase by 55%, making it the fastest growing segment of the State’s population.

12 13HIGHway system
Û
Û
Û
Û
Û
Û
%
%
%
%
%%
%
%
%% %
% %
%%
% %
%%
%
%%
%%
% %
%%
%%% %
!
!
!
!
!
!
!
!
!
!
!
!
!
!
!
!
!
!!
!
!
!
!
!
!
!
!
!
!!
!
!
!
! !
!
!
!
!
!
!
!
!
!!
!
$
$
$
$
Mas
sach
uset
ts
Rho
deIs
land
New
Yor
k
Lo
ng
Is
lan
d S
ou
nd
£ ¤202
£ ¤44 £ ¤6
£ ¤44
£ ¤1
£ ¤5
£ ¤7
£ ¤44
£ ¤5
£ ¤6
£ ¤5
£ ¤1
£ ¤6
£ ¤202
£ ¤7
§̈ ¦84
§̈ ¦95
§̈ ¦84
§̈ ¦395
§̈ ¦91
§̈ ¦291
§̈ ¦384
§̈ ¦691 §̈ ¦91
§̈ ¦395
§̈ ¦84
§̈ ¦95
¬ «9
¬ «8
¬ «2
¬ «15
£ ¤1
¬ «8
¬ «8
¬ «15
¬ «9
¬ «2
Connecticu
t Rive
r
Connecticut River
£ ¤1§̈ ¦68
4
±0
1020
5M
iles
Conn
ectic
utH
ighw
ay S
yste
mM
ap P
repa
red
by C
TDO
TA
pril
13th
, 201
5G
ener
al R
efer
ence
Onl
y
Lege
nd$
Mai
nten
ance
Dis
trict
HQ
s
!M
aint
enan
ce G
arag
es
%R
est A
reas
/Ser
vice
Pla
zas
ÛTr
uck
Wei
gh S
tatio
ns
CT
Inte
rsta
tes
CTD
OT
Mai
ntai
ned
Lim
ited
Acc
ess
CTD
OT
Mai
ntai
ned
Roa
ds
N
Sources of Highway and Bridge Capital Funding
Highway System Overview
HiGHway sysTem
CTDOT is responsible for all aspects of the planning, development, maintenance, and improvement of the state roadway transportation system.
SOURCES OF FUNDS (In Millions) FY11 FY12 FY13 FY14 FY15
Federal Apportionments [1] $493 $473 $470 $468 $468Federal "Special" Funds [2] $8 $52 $10 $2 $2State Bonds & Authorizations $178 $336 $392 $398 $307
State Highways [3] $167 $167 $259 $277 $167State Soil Remediation $11 $13 $11 $5 $21Fix-It-First - $155 $122 $116 $115Special Authorizations - - - - $3
“Local” Bonds* $30 - $30 $120 $115State Town Aid Road [4] $30 - $30 $60 $60LOTCIP - - - $45 $45Local Bridge - - - $15 $10
Total $709 $861 $903 $988 $891
estimated
NOTE: The funding amounts reflected here represent new funds made available to CTDOT each year, whereas CTDOT’s Capital Plan (not shown) represents funds programmed by year for projects. [1] For FY15 it is assumed funds will be level with FY14, including a $12 million additional ceiling that will be received at year-end as a result of the annual August Redistribution. ARRA Funds are not included.[2] Includes apportionment amounts for federal earmarks, Emergency Relief funds and other allocated federal funds.[3] State Highways (Bonds Authorized) includes: Bridge, Urban, Interstate, Intrastate, and Resurfacing bonds.[4] In FY12, Town Aid Road program was funded out of appropriated funds.
Mill
ions
of D
olla
rs
State Bonds & Authorizations
Federal “Special”Funds
Federal Apportionments
Total Funds
“Local” Bonds*$709
$861$903
$988$891
0
100
200
300
400
500
600
700
800
900
1,000
FY11 FY12 FY13 FY14 FY15(est.)
* “Local” bonds are State bonds used for local projects
Inte
rsta
tes
Oth
er N
HS
Rou
tes
MA
P-2
1 P
rinci
pal A
rteria
ls
STR
AH
NE
T R
oute
Inte
rmod
al C
onne
ctor
s
Lege
nd: C
onne
ctic
ut N
atio
nal H
ighw
ay S
yste
m (N
HS)
84
84
395
95
95
9568
4
84
691
91
91
91
384
291

14 15HiGHway sysTem HiGHway sysTem
Highway SafetyMotor Vehicle Crash Data
Top Causes of All Auto Accidents
2014* 2012-2014AVERAGE
Total Crashes 96,592 95,978Fatal15a 232 247Injury 22,795 23,245Property Damage Only 73,565 72,486Work Zone 901 911
Fatalities15a** 246 265Rate (per 100 Million VMT) 0.79 0.86Unrestrained Passenger 67 66Involving Driver with BAC > .08g/dL*** 49 88Speeding Related 61 63Motorcyclist 54 52Un-Helmeted Motorcyclist 34 28Involving Drivers 20 Years or Younger 21 28Single Vehicle 143 157Roadway Departures 143 146Intersection Related 47 60
Injuries 31,842 32,517Serious Injuries 1,357 1,553Serious Injury Rate (per 100 Million VMT) 4.36 5.00
Observed Seatbelt Usage in Passenger Vehicle (Front Seat) 85% 86%*All 2014 numbers are preliminary until all pending cases are closed by December 31, 2015.**Fatalities may be attributed to more than one crash type***BAC = Blood Alcohol Concentration
31%
13%
13%
7%
Following Too Close
Failed to Grant Right of Way
Driver Lost Control
Speed Too Fast for Conditions
Use of Operations and Maintenance Funding
USE OF FUNDS (In Millions) FY11 FY12 FY13 FY14 FY15
CTDOT Appropriated Expenditures
Personal Services $94 $82 $92 $96 $106Snow $19 $6 $17 $20 $24Non-snow maintenance $75 $76 $75 $76 $82
Other Expenses $42 $31 $44 $48 $50Snow $16 $6 $15 $19 $23Non-snow maintenance $26 $24 $29 $28 $27
Highway & Bridge Renewal Equip. $7 $9 $15 $6 $0Pay-as-you-Go Projects $11 $14 $15 $13 $11
Highway Operation Centers & CHAMP $1 $1 $1 $2 $1Maintenance Overload $6 $7 $5 $7 $6Tree Cutting $0 $0 $1 $1 $1Bridge Repairs $4 $6 $7 $4 $2Miscellaneous $0 -$1 $0 $0 $0
Subtotal - Appropriated Funds $154 $135 $166 $164 $166CTDOT Bond Expenditures
Highway & Bridge Renewal Equipment - - - - $3Capital Resurfacing $55 $59 $51 $58 $68State Bridge and Fix-it-First Roads/Bridges $1 $4 $17 $22 $34Subtotal - Bond Funds $56 $63 $67 $80 $105TOTAL $210 $198 $233 $244 $271
Mill
ions
of D
olla
rs
Highway & BridgeRenewal Equip.
Other Expenses
Personal Services
Total Expenses
Pay-as-you-Go
Bonds$210 $198
$233$244
$271
0
50
100
150
200
250
300
FY11 FY12 FY13 FY14 FY15
15aFARS Annual Report File, Preliminary for 2014
Note: Percentages are based on 2012-2014 averages

16 17
17aConnecticut Transportation by the Numbers, TRIP, Dec. 2014
HiGHway sysTem HiGHway sysTem
Note: “Approaching or Over Capacity” is defined as greater or equal to 80% of 2011 volume-to-capacity ratios.
Driver StatisticsFY2014 LICENSE & REGISTRATION INFORMATION16a
Total Licensed Drivers in CT (Includes CDL and Non-CDL) 2,534,090As a Percentage of Total Driving Age Population 87%
Total Registered Vehicles in CT 2,825,191
Automobiles 2,286,489
Motorcycles 89,332Buses 12,444Trucks 436,926
Number of Vehicles Per CT Household16b
Vehicle Miles Traveled (VMT)2014 VMT
Total Annual VMT 31.1 BillionAnnual VMT Per Vehicle 11,022
Total Daily VMT 85.3 MillionDaily VMT Per Vehicle 30
Percent of Total Households
6%
14%
38%
33%
9%
+
Trips and Traffic
Highway Congestion on Interstates
Percentage of “Through State” Vehicles
INTERSTATE/EXPRESSWAY TOWN ADT
I-84 Hartford 172,500I-95 Bridgeport 162,500I-91 Hartford 152,200Rt. 8 Bridgeport 106,300
Rt. 15 Milford 80,400
Highest Average Daily Traffic (ADT) Volumes by Route
Perc
enta
ge A
ppro
achi
ng o
r O
ver C
apac
ity
16aConnecticut Department of Motor Vehicles, FY2014
16bU.S. Census Bureau, American Community Survey, 2009-2013
INTERSTATE TOWN PERCENTAGE
I-95 Greenwich 19%I-95 North Stonington 36%I-84 Danbury 26%I-84 Union 40%I-91 Enfield 14%
I-395 Thompson 7%
Annually, the average motorist in Connecticut spends 40 hours stuck in traffic, which costs residents and businesses over $1.6 billion in lost time and wasted fuel.17a
Billi
ons
of V
MT
Annual Total VMT
63%59%
81%
69%
4%
13%
0%
25%
0%
20%
40%
60%
80%
100%
I-84 I-91 I-95 I-291 I-384 I-395 I-684 I-691
30.0
30.5
31.0
31.5
32.0
32.5

18 19
Data listed is as of June 2015
Roadway Mileage
*NHS = National Highway System
HiGHway sysTem
CLASSIFICATION MILES
Grand Total Roadway Mileage (Federal, State, Town) 21,508Total State (and Federal) Road Miles 4,143
State (and Federal) Non-NHS* 2,751State Routes 2,329State Park Roads 72State Forest Roads 179State Institution Roads 56U.S. Defense, Federal Service, and Indian Roads 115
State NHS 1,392Interstate 346Other NHS* 1,046
Total Town Road Miles 17,366NHS* 50Non-NHS* 17,316
Lane MileageCLASSIFICATION MILES
Total Lane Mileage: Without Ramps or Connectors 45,115State Lane Miles: Without Ramps 9,836Town Lane Miles 35,279
Total Lane Mileage: With Ramps or Connectors 45,594Additional State Lane Miles: Ramps 479
Other MileageCLASSIFICATION MILES
Limited Access Highway 659Unpaved Town Roads 521High Occupancy Vehicle (HOV) 19Ramps Serving as Mainline 14Ramps, Turning Roadways, and Connectors 426
HiGHway sysTem
Various Highway Components (State Roads)
CTDOT INVENTORY
Traffic Signals 2,500Flashing Beacons 233Signs With Flashers 291Controlled Intersections 850Traffic Signs 263,000Miles of Pavement Markings 16,000Individual Highway Lights 25,000Miles of Guiderail 21,431
Signals, Signage, Markings, Lighting, and Guiderail
Intelligent Transportation Systems (ITS)
ITS PHYSICAL COMPONENTS
Closed Circuit Television Cameras (CCTV) 324Traffic Flow Monitoring (TFM) Detectors 256Variable Message Signs (VMS) 137Highway Advisory Radio (HAR) Stations 11Roadway Weather Information Systems (RWIS) 14Computerized Traffic Signals 944
TRAFFIC MONITORING PROGRAM
Weigh-in-Motion Sites 36Traffic Monitoring System (TMS) Classification Sites 67Automatic Traffic Recorder (ATR) Stations 40
Roadway with ITS - Interstates: 84, 91, 95, 384, 395 / Routes: 2, 3, 8, 9, 15
Rest Areas and Service PlazasTotal Rest Areas (no fuel or food) 7Total Service Plazas (fuel and food) 23
NON-RAIL COMMUTER PARKING FACILITIES
Parking Facilities for Carpoolers, Vanpoolers, and Bus Riders 178Parking Lots Exclusively For Carpooling and Vanpooling 42Parking Lots For Express Bus Service 49Parking Lots For Local Bus Service 87
Total Parking Spaces 16,200
Commuter Parking Facilities
Note: Approximately 75% of Vehicle Miles Traveled (VMT) in CT occurs on State roads and 25% occurs on Town roads.
20 21
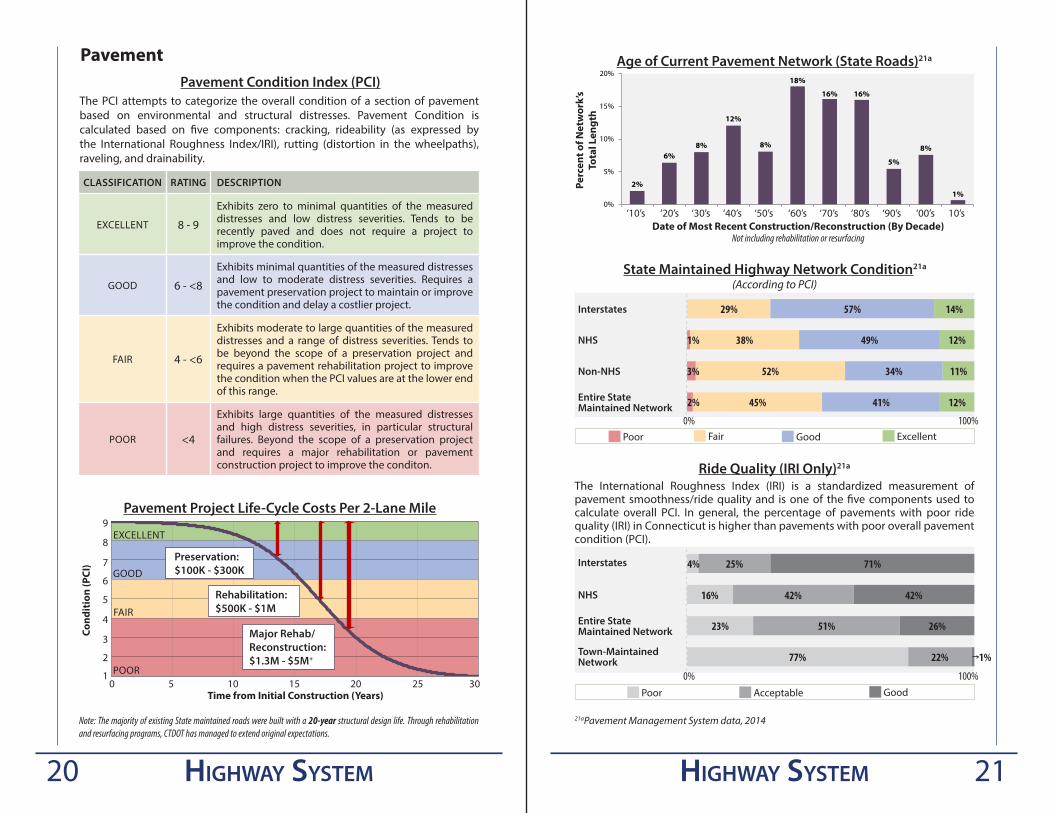
Pavement Condition Index (PCI)
Pavement
The PCI attempts to categorize the overall condition of a section of pavement based on environmental and structural distresses. Pavement Condition is calculated based on five components: cracking, rideability (as expressed by the International Roughness Index/IRI), rutting (distortion in the wheelpaths), raveling, and drainability.
HiGHway sysTem
CLASSIFICATION RATING DESCRIPTION
EXCELLENT 8 - 9
Exhibits zero to minimal quantities of the measured distresses and low distress severities. Tends to be recently paved and does not require a project to improve the condition.
GOOD 6 - <8
Exhibits minimal quantities of the measured distresses and low to moderate distress severities. Requires a pavement preservation project to maintain or improve the condition and delay a costlier project.
FAIR 4 - <6
Exhibits moderate to large quantities of the measured distresses and a range of distress severities. Tends to be beyond the scope of a preservation project and requires a pavement rehabilitation project to improve the condition when the PCI values are at the lower end of this range.
POOR <4
Exhibits large quantities of the measured distresses and high distress severities, in particular structural failures. Beyond the scope of a preservation project and requires a major rehabilitation or pavement construction project to improve the conditon.
HiGHway sysTem
Age of Current Pavement Network (State Roads)21a
Pavement Project Life-Cycle Costs Per 2-Lane Mile
Cond
itio
n (P
CI)
0 5 10 15 20 25 30Time from Initial Construction (Years)
5
7
8
9
2
6
4
3
1
EXCELLENT
GOOD
FAIR
POOR
Preservation:$100K - $300K
Rehabilitation:$500K - $1M
Major Rehab/Reconstruction:$1.3M - $5M+
Note: The majority of existing State maintained roads were built with a 20-year structural design life. Through rehabilitation and resurfacing programs, CTDOT has managed to extend original expectations.
Perc
ent o
f Net
wor
k’s
Tota
l Len
gth
Date of Most Recent Construction/Reconstruction (By Decade)Not including rehabilitation or resurfacing
‘10’s ‘20’s ‘30’s ‘40’s ‘50’s ‘60’s ‘70’s ‘80’s ‘90’s ‘00’s 10’s
2%
6%8%
12%
8%
18%
16% 16%
5%
8%
1%0%
5%
10%
15%
20%
State Maintained Highway Network Condition21a
(According to PCI)
Interstates
NHS
Non-NHS
41% 12% 45% 2%
34% 11% 52% 3%
49% 12% 38%1%
57% 14% 29%
ExcellentGoodPoor Fair
Entire State Maintained Network
0% 100%
Ride Quality (IRI Only)21a
Town-MaintainedNetwork
Entire State Maintained Network
NHS
Interstates
0% 100%GoodAcceptablePoor
4% 25% 71%
16% 42% 42%
23% 51% 26%
The International Roughness Index (IRI) is a standardized measurement of pavement smoothness/ride quality and is one of the five components used to calculate overall PCI. In general, the percentage of pavements with poor ride quality (IRI) in Connecticut is higher than pavements with poor overall pavement condition (PCI).
22%77% 1%
21aPavement Management System data, 2014

22 23
22aMichigan Department of Transportation
Bridge InspectionsAll bridges having spans greater than 20 feet, whether state or town-maintained, are included in the National Bridge Inventory (NBI). Federal law requires all states to inspect roadway bridges greater than 20 feet every two years. However, structures that are in poor condition can be inspected as frequently as every month. CTDOT reports on the condition of the NBI to the Federal Highway Administration (FHWA) on an annual basis.
CTDOT also collects “Element Level” bridge inspection data that is now included with the annual report to FHWA. Element level data provides quantities of varying condition states. This information will be used to improve deterioration modeling and planning of preservation/rehabilitation work.
Bridge RatingsComponents of a Typical Highway Bridge22a
DECK
SUPERSTRUCTURE
SUBSTRUCTURE
HiGHway sysTem
BridgesTotal Number of Roadway Bridges and Structures 7,406
Routinely Inspected by CTDOT* 5,286Maintained by CTDOT 3,998Maintained by Others, Greater Than 20ft Long 1,288
Not Routinely Inspected by CTDOT and Maintained by Others** 2,120
The three major components (deck, superstructure, and substructure) are comprised of a number of elements. Each major component is evaluated based on an aggregate of its elements and then assigned a numerical rating from zero to nine. The lowest rating among the three main components becomes the bridge’s overall rating.
23aFHWA Bridge Condition Rating System
Structural Condition Ratings23a
HiGHway sysTem
CLASSIFICATION RATING DESCRIPTION
GOOD
9 Excellent New
8 Very Good No problems noted.
7 Good Some minor problems.
FAIR
6 Satisfactory Structural elements show some minor deterioration.
5 FairAll primary structural elements are sound, but may have minor section loss, cracking, spalling, or scour.
POOR
4 Poor Advanced section loss, deterioration, spalling, or scour.
3 Serious
Section loss, deterioration, spalling or scour have seriously affected primary structural components. Local failures are possible. Fatigue cracks in steel or shear cracks in concrete may be present.
2 Critical
Advanced deterioration of primary structural elements. Fatigue cracks in steel or shear cracks in concrete may be present or scour may have removed substructure support. Unless closely monitored it may be necessary to close the bridge until corrective action is taken.
1 “Imminent” Failure
Major deterioration or section loss present in critical structural components or obvious vertical or horizontal movement affecting structure stability. Bridge is closed to traffic, but corrective action may put back in light service.
0 Failed Out of service, beyond corrective action.
*2014 Inventory Data (NBI Submittal to FHWA in April 2015)**Inventory approximate as of April 1, 2015. CTDOT inspected these bridges 1991-1992 and will inspect again 2015-2016.

1 31 3686
289
421
229
644
1,048
340 363307
126
59 180
200
400
600
800
1,000
1,200
22
47
23
48
129
70
226
116 111
204
137
116
39
0
50
100
150
200
250
24 25
Bridges Maintained by CTDOT (Inspected by CTDOT)24a
HiGHway sysTem
Age Distribution
A majority of existing bridges were built with an expected 50-year structural design life. Bridges built today have a 75-year structural design life.
Bridge Conditions
Num
ber o
f Bri
dges
Year Built
24a2014 Inventory Data (NBI Submittal to FHWA in April 2015) * ”Poor” bridges continue to be inspected and maintained, and are safe for the traveling public while CTDOT develops plans for their rehabilitation or replacement.
70% of bridges maintained by CTDOT are 50 years or older
HiGHway sysTem
Bridges Maintained by Others (Inspected by CTDOT)25a
Age Distribution
Bridge Conditions
Num
ber o
f Bri
dges
Year Built
25a2014 Inventory Data (NBI Submittal to FHWA in April 2015) * ”Poor” bridges continue to be inspected and maintained, and are safe for the traveling public while CTDOT develops plans for their rehabilitation or replacement.
53% of bridges maintained by others are 50 years or older
CTDOT routinely inspects all bridges having spans greater than 20 feet, whether state, town, or privately maintained.
Good
Fair
Poor*
29%
64%
7%
Good
Fair
Poor*
38%
49%
13%

26 27transIt and rIdesHarInG
Transit and Ridesharing OverviewCTDOT oversees and financially supports public bus, paratransit, and ridesharing services and assets.
InventoryFLEET AND FACILITIES
Fixed, Express, and Shuttle Route Vehicles 700Paratransit Vehicles 400Bus Maintenance Facilities 10
Age of Bus Fleet
SIZE OF BUS TYPICAL EXPECTED SERVICE LIFE
35 - 40 feet 12 years30 feet 10 - 12 yearsUnder 30 feet 7 - 10 years
Condition of Bus FleetThe average number of miles between service road calls is 13,009.*
Sources of Capital Funding
The average age of the existing fleet is between 7 and 9 years old.
TransiT and ridesHarinG
Mill
ions
of D
olla
rs State Bonds
Federal Earmarks/New Starts
Federal Apportionments
Total Funds
$33 $33 $36 $37 $37
$46$64 $55 $59 $62
$13
$30 $45 $30
$47
$92
$126
$137
$125
$146
0
20
40
60
80
100
120
140
160
FY11 FY12 FY13 FY14 FY15
*Based on 4-quarter rolling averages from January 2014 through March 2015.

T
Local Service
CTfastrak.com
HARTFORD
NEW BRITAIN
CCSU
UConnHealth
SIGOURNEY
STREET
PARKVILLE
KANESTREET
FLATBUSH
AVENUE
ELMW
OOD
NEWINGTON
JUNCTION
CEDARSTREET
EAST MAIN
STREET
UNION
STATION
BRISTOL
WATERBURY
CHESHIRE
Manchester
Community
College
T
CapitolAvenue
Route 101: Hartford/New Britain
Shuttle Service
All CTfastrak stations
Express Service
Route 923: Bristol Express
Route 924: Southington–Cheshire Express
Route 925: Waterbury Express
Route 121: MCC/Hartford/UConn Health
Route 102: Hartford/New Britain-Bristol
Limited Service
Limited local stops at CTfastrak stations
Route 128: Hartford/Westfarms-New Britain via Stanley St.
CTfastrak stations
Major Parking Facilities
Rail ConnectionTransfer available to local transportation
T
Key Destinations
WestfarmsMall
Routes based on
Service PlanMarch 2015
All Routes
Loop Downtown
Future Parking Facilities
SOUTHINGTON
TMain
Stre
et
EASTSTREET
DOWNTOW
N
NEW BRITAIN
T
Local Service
CTfastrak.com
HARTFORD
NEW BRITAIN
CCSU
UConnHealth
SIGOURNEY
STREET
PARKVILLE
KANESTREET
FLATBUSH
AVENUE
ELMW
OOD
NEWINGTON
JUNCTION
CEDARSTREET
EAST MAIN
STREET
UNION
STATION
BRISTOL
WATERBURY
CHESHIRE
Manchester
Community
College
T
CapitolAvenue
Route 101: Hartford/New Britain
Shuttle Service
All CTfastrak stations
Express Service
Route 923: Bristol Express
Route 924: Southington–Cheshire Express
Route 925: Waterbury Express
Route 121: MCC/Hartford/UConn Health
Route 102: Hartford/New Britain-Bristol
Limited Service
Limited local stops at CTfastrak stations
Route 128: Hartford/Westfarms-New Britain via Stanley St.
CTfastrak stations
Major Parking Facilities
Rail ConnectionTransfer available to local transportation
T
Key Destinations
WestfarmsMall
Routes based on
Service PlanMarch 2015
All Routes
Loop Downtown
Future Parking Facilities
SOUTHINGTON
TMain
Stre
et
EASTSTREET
DOWNTOW
N
NEW BRITAIN
Uconn Health
Westfarms Mall
CCSU
ManchesterCommunity
College
Bristol
Waterbury
Chesire
Southington
HartfordNew Britain
CTfastrak Conceptual Map
28 29
1NuRide, as of 9/10/2015
TransiT and ridesHarinG
Operational Funding
Bus Operational Funding
TransiT and ridesHarinG
BUS RAPID TRANSIT BETWEEN HARTFORD AND NEW BRITAIN
Average Weekday Ridership in Corridor (passengers)* 14,000Length of Guideway (miles) 9.4Stations Along Guideway 10Number of Routes Using Guideway 12
CTfastrak
CTrides Ridesharing
SINCE JANUARY 20051...
Participants 33,407Shared Rides (Carpool and Vanpool) 2,801,844Transit Trips 2,224,695
CTrides is an incentive-based program that provides information on commuting options in the State, including all travel modes and telework.
Transit Services
Service Providers
URBAN, RURAL, AND ADA PARATRANSIT SERVICES
CTTRANSIT Divisions 8Local Transit Districts 14Paratransit Operators 12
Paratransit Operational Funding
FY 14
Ridership (Passenger Trips) 42 MillionFare Box Recovery per Dollar $0.21Bus Hours 2 MillionMiles 25 Million
Mill
ions
of D
olla
rs
Fare & Other Revenue
Expenses
State & Other Subsidies
Mill
ions
of D
olla
rs
Fare & Other Revenue
Expenses
State & Other Subsidies
FY 14
Ridership (Passenger Trips) 1 MillionFare Box Recovery per Dollar $0.05Bus Hours 567 ThousandMiles 8 Million
Note: Federal law requires paratransit service to be provided within a half mile of every fixed route transit service.
$42 $43 $49 $49 $48
$116 $121 $125 $131 $141
$158$165
$174 $180 $189
0
20
40
60
80
100
120
140
160
180
200
FY10 FY11 FY12 FY13 FY14
$2 $2 $2 $2 $2
$25 $27 $29 $31 $33
$27$29
$31 $33$35
0
5
10
15
20
25
30
35
40
FY10 FY11 FY12 FY13 FY14
*CTfastrak service added approximately 6,000 new riders to the corridor.

! (
! (! (
! (
! (
! (! (! (! (
! (
! (! (
! (
! (! (
! (! (
! (
! (! (
! (
! (! (
! (! (
! (
! (! (! (
! (
! (! (! (
! (! (
! (
! (
! (! (
! (! (
! (
! (
! (
! (
! (
! (
! (
! (
! (
! (
! (
! (
Mas
sach
uset
ts
Rho
deIs
land
New
Yor
k
Lo
ng
Is
lan
d S
ou
nd
Connecticu
t Rive
r
Connecticut River k
k
k
k
k
k ±0
1020
5M
iles
Conn
ectic
utH
ighw
ay S
yste
mM
ap P
repa
red
by C
TDO
TA
pril
13th
, 201
5G
ener
al R
efer
ence
Onl
y
Lege
nd! (
Exis
ting
Rai
lroad
Sta
tions
Shor
e Li
ne E
ast
New
Hav
en L
ine
Har
tford
Lin
eH
artfo
rd L
ine
30 31PassenGer raIl servIces
NPassenger Rail Services OverviewCTDOT oversees and financially supports the provision of two commuter rail services: the New Haven Line (NHL) and the Shore Line East (SLE). In late 2016, CTDOT will open and support a third commuter line - the Hartford Line. Additional intercity service is provided by Amtrak.
passenGer rail services
Sources of Capital Funding
Ownership and Mileage (CT Portions)PASSENGER RAIL RAIL INFRASTRUCTURE
OWNERSERVICE
OPERATORROUTE MILES
NHL & Branches CTDOT Metro-North RR 105Shore Line East Amtrak Amtrak 67Hartford Line Amtrak TBD 54Total 226
Rolling StockOWNED BY CTDOT OWNED BY
OTHERS TOTALNHL SLE
Push/Pull Coaches 50 33 - 83EMU* Cars 250 24 131 405Locomotives 10 14 - 24
*EMU = Electric Multiple Unit
Maintenance FacilitiesRAIL FACILITIES OWNED BY CTDOT
New Haven Line 3Shore Line East 1
Mill
ions
of D
olla
rs
Federal Earmarks/New Starts
Federal Apportionments
Total Funds
State Bonds and Special Authorizations
Mystic
New London
Old Saybrook
Westbrook
Clinton
Madison
Guilford
Greenwich
Berli
n
Mer
iden
Wal
lingf
ord
Har
tfor
d
Win
dsor
Win
dsor
Loc
ks
Wat
erbu
ry
Nau
gatu
ck
Beac
on F
alls
Seym
our
Ans
onia
Der
by/
She
lton
Branford
Dan
bury
Beth
el
Redd
ing
Bran
chvi
lle
Cann
onda
leW
ilton
Mer
ritt 7
New
Can
aan
Talm
adge
Hill
Sprin
gdal
eG
lenb
rook
Cos CobRiversideOld Greenwich
StamfordNoroton Heights
DarienRowaytonSouth Norwalk
East Norwalk
WestportGreen’s Farms
SouthportFairfieldFairfield MetroBridgeportStratford
Milford
State Street
New Haven
West Haven
Com
mut
er S
ervi
ce
Inte
rcity
Ser
vice
--- o
wne
d by
CTD
OT
NY
C
Springfield
Prov
iden
ce
Bos
ton
$111 $111 $112 $115 $115
$81$126
$170$27
$133
$122 $113
$148
$219
$370
$234 $229
$434
0
50
100
150
200
250
300
350
400
450
500
FY11 FY12 FY13 FY14 FY15
Am
trak
Win
dsor
Lock
s
Wes
t Har
tford
Futu
re S
tatio
ns
New
ingt
on
Nor
th H
aven
Orange
Barnum
(futu
re)

77
59
92
6 6 3 3 61
147 10
0
10
20
30
40
50
60
70
80
90
32 33passenGer rail services passenGer rail services
Year Built
NHL PASSENGER RAILROAD BRIDGE INVENTORY
Total Number of Bridges 203Fixed Structures 198Movable Structures* 5
All passenger railroad bridges along the New Haven Line are owned, inspected, and maintained by CTDOT.
New Haven Line Railroad Bridges
Age Distribution
Bridge Conditions
Num
ber o
f Bri
dges
*4 moveable structures are more than 120 years old (draw, swing, or lift bridges)
The average age of passenger rail bridges
is 93 years old
Operational Funding
New Haven Line
Mill
ions
of D
olla
rs
MTA Subsidy
State Subsidy
Fare & Other Revenue
Expenses
Shore Line East
Mill
ions
of D
olla
rs
State Subsidy
Fare Revenue
Expenses
CTDOT sets the fares and service levels on the CT portions of its commuter rail lines: the New Haven Line (NHL) and the Shore Line East (SLE). Amtrak sets the fares and service levels on Amtrak’s intercity service routes.
FY 14Ridership (Passenger Trips) 39 MillionFare Box Recovery per Dollar $0.69
FY 14Ridership (Passenger Trips) 660 ThousandFare Box Recovery per Dollar $0.07
Good
Fair
Poor
22%
57%
21%
Note: New Haven Line bridge age and condition data is as of July 2015. Note: In 2014, Amtrak transported 2 million passengers on the Northeast Corridor (NEC) in Connecticut.
$2 $2 $2 $2 $3
$19$23
$26$29
$32
$21
$25
$29$31
$35
0
5
10
15
20
25
30
35
40
FY10 FY11 FY12 FY13 FY14
$260 $269 $289 $302 $310
$70 $71$69
$75$98$31 $28 $22
$24$32
$361 $368$379 $402
$440
0
50
100
150
200
250
300
350
400
450
500
FY10 FY11 FY12 FY13 FY14

34 35
Sources: This information would go here
state ferry servIce sTaTe Ferry service
CTDOT operates the Connecticut State Ferry Service comprised of two separate, seasonal ferry services across the Connecticut River: the Chester to Hadlyme Ferry and the Rocky Hill to Glastonbury Ferry. The latter of the two services is the nation’s oldest continuously running ferry service. Both services provide some of the safest links across the Connecticut River for bicyclists and pedestrians.
State Ferry Service Overview
Operating Season Apr 1st - Nov 30th
Weekday Hours 7:00 am - 6:45 pmWeekend Hours 10:30 am - 5:00 pm
Ferry Operations
CHESTER-HADLYME ROCKY HILL-GLASTONBURY
Carrying Capacity
Per Trip 49 passengers8 autos
19 passengers3-5 autos
Weekday Total Vehicles 1,000 500Weekend Total Vehicles 540 250
Load CapacityPer Vehicle 5 tons 5 tons
Ferry Capacity
The Chester to Hadlyme Ferry links state route 148. Named Selden III, it is 65 feet long and 30 feet wide.
Chester - Hadlyme Ferry
Rocky Hill - Glastonbury Ferry
The Rocky Hill to Glastonbury Ferry links state route 160. It consists of a flatboat named Hollister III (70 ft by 18 ft) pulled by a towboat named Cumberland.

$106 $106 $106 $116$171
$237$279 $255 $245
$198
$344
$385$361 $360 $370
0
50
100
150
200
250
300
350
400
FY10 FY11 FY12 FY13 FY14
36 37
Annual Ridership
Tota
l Tra
nspo
rted
Chester-Hadlyme Ferry
Operational Funding
State Subsidy Fare Revenue Expenses
Thou
sand
s of
Dol
lars
sTaTe Ferry service
Annual Ridership
Tota
l Tra
nspo
rted
Rocky-Hill Glastonbury Ferry
Operational Funding
Thou
sand
s of
Dol
lars
sTaTe Ferry service
State Subsidy Fare Revenue Expenses
$44 $43 $32 $54 $67
$176$204
$151
$225$245
$220$247
$183
$279
$312
0
50
100
150
200
250
300
350
400
FY10 FY11 FY12 FY13 FY14
41,661
22,349
41,203
29,043 36,033
16,909
7,472
16,241 13,582 15,991
0
10,000
20,000
30,000
40,000
50,000
60,000
70,000
80,000
90,000
2010 2011 2012 2013 2014
Note: Totals based on calendar year. Passengers Vehicles Note: Totals based on calendar year. Passengers Vehicles
73,471 73,757
81,233 78,484
84,686
35,256 34,163 37,809 37,616
41,453
0
10,000
20,000
30,000
40,000
50,000
60,000
70,000
80,000
90,000
2010 2011 2012 2013 2014

38 39BIcyclIsts and PedestrIans bicyclisTs and pedesTrians
Bicyclists and Pedestrians OverviewNon-motorized facilities are an integral part of the Connecticut transportation system. In an effort to reflect the routine accommodation of all users, CTDOT has developed and continues to develop best practice policies and design guidelines that support the creation of infrastructure and programs for all users, including bicyclists, pedestrians, and persons with disabilities. CTDOT’s vision for non-motorized transportation can be found in the Connecticut Statewide Bicycle and Pedestrian Transportation Plan (2009).
Capital Funds Awarded*
FY10 FY11 FY12 FY13 FY14
Bike/Ped Funds Awarded (Millions) $8 $18 $11 $14 $7
Percent of Total Funds Awarded 1% 3% 2% 5% 1%
Number of Projects Awarded With Bike/Ped Elements 42 46 41 46 38
Note: CTDOT is required to report the amount spent on bicycle and pedestrian accommodations, which should not equal less than 1% of the total amount of any funds received in a fiscal year.
* Funds noted are estimates and may not reflect all bike/ped elements.
Mill
ions
of D
olla
rs
$8
$18
$11$14
$7
0
5
10
15
20
FY10 FY11 FY12 FY13 FY14
40 41
CLASSIFICATION ADT*(NO. OF VEHICLES)
SHOULDER WIDTH(IN FT)
PERCENT OF STATE ROADS**
MOST SUITABLELess than 2,500 3 to 6
7%Less than 10,000 Greater than 6
MORE SUITABLE
Less than 2,500 1 to 333%2,500 to 7,500 3 to 6
Greater than 10,000 Greater than 6
SUITABLE2,500 to 5,000 1 to 3
32%Greater than 7,500 3 to 6
LESS SUITABLE Greater than 5,000 1 to 3 27%
LEAST SUITABLE -- 0 <1%
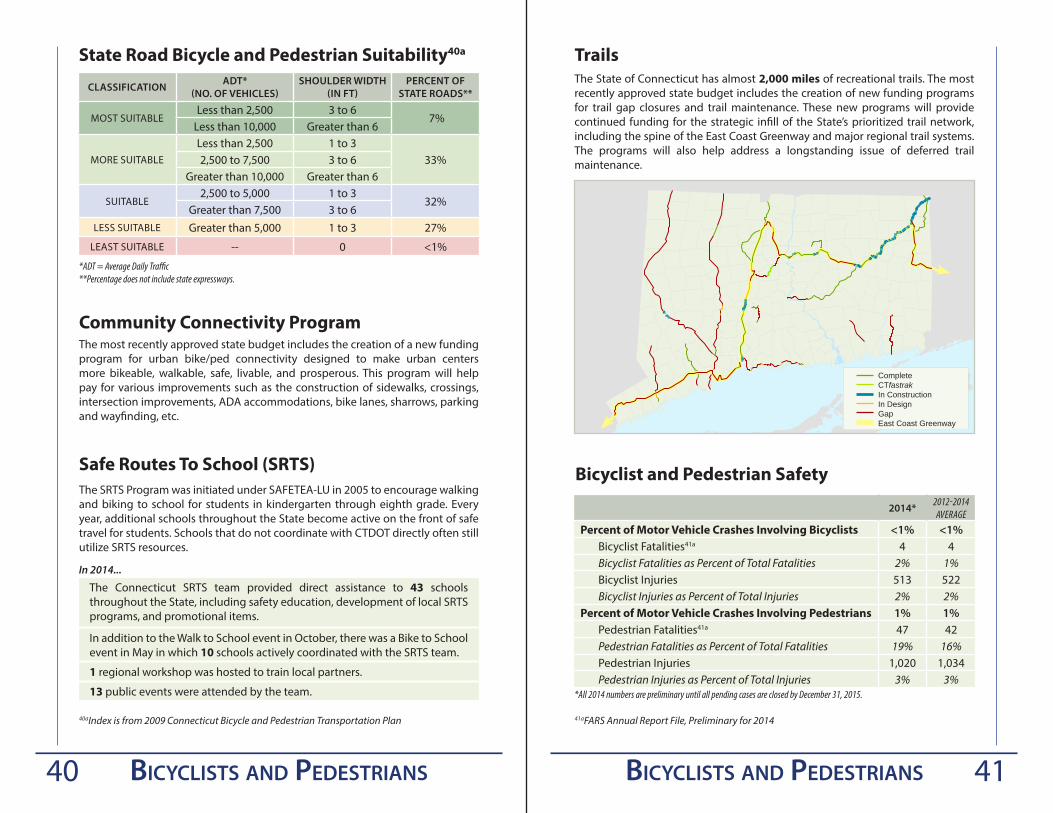
State Road Bicycle and Pedestrian Suitability40a Trails
*ADT = Average Daily Traffic**Percentage does not include state expressways.
bicyclisTs and pedesTrians
The State of Connecticut has almost 2,000 miles of recreational trails. The most recently approved state budget includes the creation of new funding programs for trail gap closures and trail maintenance. These new programs will provide continued funding for the strategic infill of the State’s prioritized trail network, including the spine of the East Coast Greenway and major regional trail systems. The programs will also help address a longstanding issue of deferred trail maintenance.
Safe Routes To School (SRTS)The SRTS Program was initiated under SAFETEA-LU in 2005 to encourage walking and biking to school for students in kindergarten through eighth grade. Every year, additional schools throughout the State become active on the front of safe travel for students. Schools that do not coordinate with CTDOT directly often still utilize SRTS resources.
The Connecticut SRTS team provided direct assistance to 43 schools throughout the State, including safety education, development of local SRTS programs, and promotional items.
In addition to the Walk to School event in October, there was a Bike to School event in May in which 10 schools actively coordinated with the SRTS team.
1 regional workshop was hosted to train local partners.
13 public events were attended by the team.
Bicyclist and Pedestrian Safety±0 10 205Miles
ConnecticutHighway System
Map Prepared by CTDOTApril 13th, 2015
General Reference Only
bicyclisTs and pedesTrians
Community Connectivity ProgramThe most recently approved state budget includes the creation of a new funding program for urban bike/ped connectivity designed to make urban centers more bikeable, walkable, safe, livable, and prosperous. This program will help pay for various improvements such as the construction of sidewalks, crossings, intersection improvements, ADA accommodations, bike lanes, sharrows, parking and wayfinding, etc.
40aIndex is from 2009 Connecticut Bicycle and Pedestrian Transportation Plan
In 2014...
2014* 2012-2014AVERAGE
Percent of Motor Vehicle Crashes Involving Bicyclists <1% <1%Bicyclist Fatalities41a 4 4Bicyclist Fatalities as Percent of Total Fatalities 2% 1%Bicyclist Injuries 513 522Bicyclist Injuries as Percent of Total Injuries 2% 2%
Percent of Motor Vehicle Crashes Involving Pedestrians 1% 1%Pedestrian Fatalities41a 47 42Pedestrian Fatalities as Percent of Total Fatalities 19% 16%Pedestrian Injuries 1,020 1,034Pedestrian Injuries as Percent of Total Injuries 3% 3%
41aFARS Annual Report File, Preliminary for 2014
*All 2014 numbers are preliminary until all pending cases are closed by December 31, 2015.
CompleteCTfastrakIn ConstructionIn DesignGapEast Coast Greenway

42 43freIGHt FreiGHT
Freight OverviewConnecticut’s transportation network must meet the needs of businesses and individuals by supporting the efficient movement of goods throughout the State. Federal and State law encourages transportation strategies that improve access to regional, national, and global economies. Facilitating interstate and intrastate commerce is vital to enhancing Connecticut’s economic competitiveness and regional synergy. The State strives to accommodate a multimodal freight system that allows for seamless connections between land, air, and water.
Economic Snapshot (Domestic Trade)43a
INBOUND VALUE
New Jersey $12.47 BMassachusetts $12.31 BNew York $11.67 BTexas $ 7.32 BPennsylvania $ 6.75 B
OUTBOUND VALUE
New York $18.38 BMassachusetts $12.33 BPennsylvania $ 7.70 BNew Jersey $ 6.63 BTexas $ 5.18 B
Top Trading Partners
Top Commodities
EXPORTS VALUE
Base Chemicals $1.93 BMachinery $ .91 BElectronics $ .82 BCereal Grains $ .58 BPlastics/Rubber $ .56 B
IMPORTS VALUE
Misc. Mfg. Products $2.20 BNewsprint/Paper $1.87 BElectronics $1.62 BBase Metals $1.41 BGasoline $1.23 B
43aU.S. Department of Transportation, Federal Highway Administration, Office of Freight Management and Operations, Freight Analysis Framework, version 3.4, 2012

77.0%
6.5%0.8% 0.1%
8.9% 6.8%
0%
15%
30%
45%
60%
75%
90%
Truck Rail Air Pipeline MultipleModes & Mail
Other andUnkown
60.4%
8.4%2.7% 0.7%
8.6%
19.2%
0%
10%
20%
30%
40%
50%
60%
70%
Truck Rail Air Pipeline MultipleModes & Mail
Other andUnkown
94.3%
0.3% 0.0% 0.0% 4.2% 1.2%0%
20%
40%
60%
80%
100%
Truck Rail Air Pipeline MultipleModes & Mail
Other andUnkown
!!
!
!
!
!!
±0 20 4010Miles
ConnecticutHighway System
Map Prepared by CTDOTApril 13th, 2015
General Reference Only
Note: Major flows include domestic and international freight moving by truck on highway segments with more than 25 Freight Analysis Framework (FAF) trucks per day and between places typically more than 50 miles apart. 2010
44 45FreiGHT
Freight By Mode (Domestic Trade)44a
Imports to ConnecticutPe
rcen
tage
of T
otal
Dol
lar
Valu
e
Exports from Connecticut
Perc
enta
ge o
f Tot
al D
olla
r Va
lue
Trade Within Connecticut
Perc
enta
ge o
f Tot
al D
olla
r Va
lue
45aUSDOT, FHWA, Freight Analysis Framework, Data Tabulation Tool, 201545bATRI, Freight Performance Measures Analysis of Freight - Significant Highway Locations, 2013
Truck Freight (Domestic Trade)
FreiGHT
Major Truck Flows To, From, and Within Connecticut44a
State-to-State Flows(Million Tons/Year)
0 1 5 10+
Volume Scale(Freight Trucks/Day)
1,250 2,500 5,000
TONS TON-MILE VALUE
IMPORTS 98.88 M 11,856 $124.83 BEXPORTS 94.78 M 11,606 $130.79 B
Top Commodities (by Value): machinery, mixed freight, base metals, textiles/leather, fuel oils, precision instruments
Truck Summary45a
44aU.S. Department of Transportation, Federal Highway Administration, Office of Freight Management and Operations, Freight Analysis Framework, version 3.4, 2012
Major Truck Bottlenecks in Connecticut
Hartford, CT: I-84 at I-91New Haven, CT: I-95 at I-91Stamford, CT: I-95Norwalk, CT: I-95Bridgeport, CT: 1-95 at Rt. 8Waterbury, CT: I-84 at Rt. 8Charter Oak Bridge, CT: I-913
45
2
6
17 1.2.3.4.5.6.7.
Rankings45b
(In order according to National Ranking by Congestion Index)

±0 10 205Miles
ConnecticutHighway System
Map Prepared by CTDOTApril 13th, 2015
General Reference Only
46 47FreiGHT
Rail Freight
OWNER Route MilesFederal (Amtrak) 121State of CT 246Municipal (City of Bristol) 2Private 247
Total 616
There are ten privately owned freight railroad companies operating in Connecticut. These companies own a large portion rail freight infrastructure and all of the rail freight equipment operating within the State.
Mileage
Deep Water PortsRecent legislation enabled Connecticut to establish a statewide port authority as early as October 1, 2015. The goal of the Port Authority will be to increase public and private investments for port development, pursue federal and state money for dredging in order to increase cargo movements through Connecticut’s ports, and market the ports to domestic and international shipping companies.
47aConnecticut’s Deep Water Port Strategy Study, Sept. 2012
FreiGHT
State Pier Facility in New London47a
The State Pier Facility is located on the Thames River in New London approximately 3.8 miles north of Long Island Sound. The facility has access to Interstates 95 and 395, as well as a railroad connection which extends as far as Canada. The facility contains two piers: the Admiral Harold E. Shear State Pier and the Central Vermont Railroad (CVRR) Pier. The facility incorporates six primary structures consisting of warehouses (3), a garage, an administration building and other supporting structures.
TOTAL WAREHOUSE SPACE (SQ FT) 106,200
FACILITY SPECIFICATIONS
Length 1,000 ftBerths Along Pier 2
East Berth Controlling Depth (MLW*) 35 ftWest Berth Controlling Depth (MLW*) 30 ft
Admiral Harold E. Shear State PierWhile primarily used for break bulk and bulk cargo, the facility is also capable of handling containerized cargo. Lumber, steel, copper, salt, sand and other products such as chemicals, wood pellets and wood pulp are all principal water-borne commodities targeted to move in and out of the Facility.
*MLW = Mean Low Water
CVRR PierThe pier accepts various types of shallow draft vessels such as barges, fishing vessels, and pilot boats,
FEDERAL CHANNEL
Controlling Depth (MLW*) 40 ftWidth 500 ft
BERTHING DEPTHS
Minimum 16-23 ftMaximum 26 ft
TONS TON-MILE VALUE
IMPORTS 1.34 M 1,635 $728 MEXPORTS .96 M 539 $538 M
Top Commodities (by Value): plastics/rubber, wood products, fuel oils, basic chemicals, base metals, waste/scrap
Rail Summary46a
46aU.S. Department of Transportation, Federal Highway Administration, Office of Freight Management and Operations, Freight Analysis Framework, Data Tabulation Tool, 2015
FederalState of CTMunicipalPrivate
Railroad Owner

NE
-1, 13 NO
V 2014 to 11 D
EC
2014
NE
-1, 1
3 N
OV
201
4 to
11
DE
C 2
014
48 49
48aConnecticut’s Deep Water Port Strategy Study, Sept. 2012
FreiGHT
Port of New Haven48a
The Port of New Haven is located on New Haven Harbor at the junction of I-95 and I-91. The port is served by freight rail and several of its terminals are connected to an extensive pipeline network. Freight rail service to the port is provided by the Providence & Worcester Railroad with connections to nine additional rail lines. The port is comprised of a cluster of privately owned terminals such as Gateway, Gulf, Magellan Midstream Partners, Motiva, R&H, and New Haven Terminal. All of the terminals handle liquid bulk cargo (petroleum, asphalt). Two of the terminals handle dry cargo, bulk (cement, sand, stone and salt); break bulk products such as steel and lumber; as well as project cargo.
Port of Bridgeport48a
The Port of Bridgeport located off of I-95, is on the north shore of Long Island Sound. The majority of commercial waterfront facilities in Bridgeport are privately owned and operated, although the Bridgeport Port Authority owns the Bridgeport Regional Maritime Complex (BRMC). Other major commercial facilities include the PSE&G power plant, the former CILCO Terminal and Motiva (Shell) fuel terminal. The port mostly accommodates liquid bulk petroleum products, coal, and general cargo. Without maintenance dredging, the channel’s actual controlling depth has dropped to less than its authorized depth.
MAIN CHANNEL
Authorized Controlling Depth (MLW) 35 ftLast Dredged 2014
Width 400-800 ft
MAIN CHANNEL
Authorized Controlling Depth (MLW) 35 ftLast Dredged 1964
49aAir Carrier Activity Information System (ACAIS), Calendar Year 201449bConnecticut Airport Authority, 2014 data 49cAirport IQ 5010, Information as of July 7, 2015
Airports Overview
aIrPorts
The Connecticut Airport Authority (CAA) was established in July 2011 to own, develop, improve, and operate Bradley International Airport (BDL), as well as five other state general aviation (GA) airports (Danielson, Groton-New London, Hartford-Brainard, Waterbury-Oxford, and Windham). The CAA strives to make Connecticut’s airports more attractive to new airlines, establish new routes, and support Connecticut’s overall economic development and growth strategy. For more information, please contact CAA Executive Director, Kevin Dillon, at 860-292-2054 or [email protected].
Bradley International Airport/ BDL
BASED AIRCRAFT49c
Total 67Total Fixed Wing 42
Single Engine 4Multi Engine 4Jet 34
Helicopters 5Military 20
60%
22%
15%
3%
Air Carrier
Air Taxi
GA
Military
Total Operations:96,33749b
AIR CARGO49b
Freight 113,575 tonsMail 2,561 tons
Second largest airport in New England49a
Ranked 53 out of 509 commercial services airports49a
Economic output of $4 billion, including 18,000 full-time jobs49b
Number of Acres49c 2,432Number of Runways49c 3
FAA Diagram of BDL
Total Passengers (Enplanements & Deplanements)49b 5,875,801Year-Over-Year Passenger Growth49b 8.4%
Number of Airlines49b 6Number of Nonstop Destinations49b 29
50 airporTs
Other Airports
AIR
PORT
OW
NER
50b
ROLE
50b
ACR
ES50
b
TOTA
L O
PERA
TIO
NS50
c
TOTA
L BA
SED
A
IRCR
AFT
S50b
RUN
WAY
S50b
State Airports
HFD Hartford-Brainard CAA R 201 81,474 136 2GON Groton-New London CAA GA 489 35,803 53 2OXC Waterbury-Oxford CAA GA 424 46,018 168 1IJD Windham CAA GA 280 14,250 68 2LZD Danielson CAA GA 257 22,602 36 1
Municipal AirportsBDR Sikorsky Memorial Bridgeport GA 800 67,951 190 2DXR Danbury Municipal Danbury R 248 69,424 293 2HVN Tweed-New Haven New Haven P 394 33,551 49 2MMK Meriden-Markham Meriden GA 157 * 65 14B8 Robertson Field Plainville R 39 * 57 1
50aConnecticut Airport Authority, 2014 data 50bAirport IQ 5010, Information as of July 7, 201550cAir Traffic Activity System (ATADS), Calendar Year 2014
State and Municipal Airport Information
Notes: Airport roles are listed according to Federal Aviation Administration categories of activity: primary (P), reliever (R), and general aviation (GA). Airport operations equals the number of arrivals and departures. Total based aircrafts include single engine, multi-engine, jets, gliders, helicopters, and military. *No reported data
CAA Airports: Economic Contribution50a
AIRPORT JOBS ECONOMIC OUTPUT (In Millions)
Hartford-Brainard 368 $44.8Groton-New London 909 $119.5Waterbury-Oxford 1,675 $235.4Windham 65 $7.5Danielson 25 $2.0
Total 3,042 $409.2
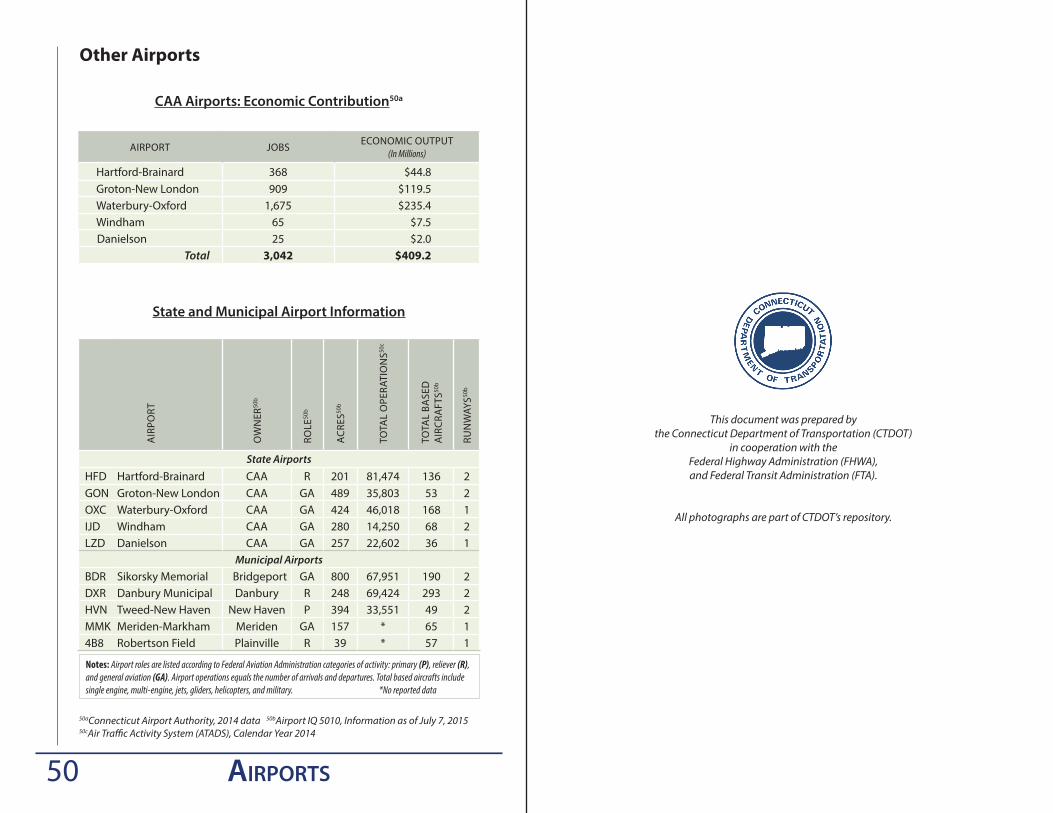
This document was prepared by the Connecticut Department of Transportation (CTDOT)
in cooperation with the Federal Highway Administration (FHWA), and Federal Transit Administration (FTA).
All photographs are part of CTDOT’s repository.


