DISCLOSURE APPENDIX AT THE BACK OF THIS REPORT CONTAINS IMPORTANT DISCLOSURES, ANALYST CERTIFICATIONS, AND THE STATUS OF NON-US ANALYSTS. US Disclosure: Credit Suisse does and seeks to do business with companies covered in its research reports. As a result, investors should be aware that the Firm may have a conflict of interest that could affect the objectivity of this report. Investors should consider this report as only a single factor in making their investment decision. CREDIT SUISSE SECURITIES RESEARCH & ANALYTICS BEYOND INFORMATION ® Client-Driven Solutions, Insights, and Access 23 July 2015 Global Equity Research Battery industry Connections Series Tesla Gigafactory: heightened LiB competition from ESS market entry Figure 1: Price comparison of Home ESS sold by each manufacturer 0 100 200 300 400 500 600 700 800 Tesla Motors (Planned) Panasonic BYD Kyocera Nichicon Sharp Toshiba Nayuta Inaba Denki Sangyo GS Yuasa Eliiy Power IMT (k¥) Lowest per-kWh prices for Home ESS for each manufacturer US China Japan Tesla Motors Planned, est. price including inverter Australian average (AUS$3,000, ¥290k) European average (€2,000, ¥280k) Source: Company specification sheets, ITmedia, Credit Suisse calculations ■ Tesla charging into ESS: In April, US electric vehicle (EV) maker Tesla Motors announced it will enter the commercial and residential energy storage systems (ESS) market. With this, we believe the likelihood of significantly lower costs for both EVs and ESS rises, due to the increased production volume and associated economies of scale to be achieved at the Gigafactory (Tesla’s massive lithium-ion battery (LiB) integrated production facility). In this report we assess the implications of Tesla’s entry into the ESS market and look at changes in the battery space that have taken place since the release of our 28 February 2014 report, Supply chain implications of Tesla's Gigafactory. Teaming up with fellow Credit Suisse analysts around the world (in Japan, Korea, the Americas, Europe and Australia), we have also summarized the implications for companies in related sectors. ■ Four main implications: (1) New market entrants will flood into the ESS business, in anticipation of lower prices driving market expansion; (2) Tesla's low-cost LiB ESS hitting the market will dramatically lower the benchmark price at which products are competitive, increasing pressure on rival battery makers; (3) The potential growth rate of materials / lithium makers will begin to diverge, depending on their level of exposure to Tesla’s partner Panasonic; (4) Automakers will expand their sales efforts beyond simply selling EV/PHEVs to selling comprehensive vehicle-to-home (V2H) ecosystems. ■ Stock calls: We like Tesla Motors (TSLA) and Hitachi Chemical (4217). GS Yuasa (6674) would be negatively affected, in our view. The Credit Suisse Connections Series leverages our exceptional breadth of macro and micro research to deliver incisive cross-sector and cross-border thematic insights for our clients. Research Analysts Jun Yamaguchi 81 3 4550 9789 [email protected]Dan Galves 212 325 9274 [email protected]
Transcript
DISCLOSURE APPENDIX AT THE BACK OF THIS REPORT CONTAINS IMPORTANT DISCLOSURES, ANALYST CERTIFICATIONS, AND THE STATUS OF NON-US ANALYSTS. US Disclosure: Credit Suisse does and seeks to do business with companies covered in its research reports. As a result, investors should be aware that the Firm may have a conflict of interest that could affect the objectivity of this report. Investors should consider this report as only a single factor in making their investment decision.
CREDIT SUISSE SECURITIES RESEARCH & ANALYTICS BEYOND INFORMATION®
Client-Driven Solutions, Insights, and Access
23 July 2015
Global
Equity Research
Battery industry Connections Series
Tesla Gigafactory: heightened LiB competition
from ESS market entry
Figure 1: Price comparison of Home ESS sold by each manufacturer
0
100
200
300
400
500
600
700
800T
esl
a M
oto
rs(P
lan
ned
)
Pa
na
son
ic
BY
D
Kyo
cera
Nic
hic
on
Sh
arp
To
shib
a
Na
yuta
Ina
ba
De
nki
Sa
ng
yo
GS
Yu
asa
Elii
y P
ow
er
IMT
(k¥)Lowest per-kWh prices for Home ESS for each manufacturer
US
China
Japan
Tesla MotorsPlanned, est. price including inverter
Australian average (AUS$3,000, ¥290k)
European average (€2,000, ¥280k)
Source: Company specification sheets, ITmedia, Credit Suisse calculations
■ Tesla charging into ESS: In April, US electric vehicle (EV) maker Tesla Motors announced it will enter the commercial and residential energy storage systems (ESS) market. With this, we believe the likelihood of significantly lower costs for both EVs and ESS rises, due to the increased production volume and associated economies of scale to be achieved at the Gigafactory (Tesla’s massive lithium-ion battery (LiB) integrated production facility). In this report we assess the implications of Tesla’s entry into the ESS market and look at changes in the battery space that have taken place since the release of our 28 February 2014 report, Supply chain implications of Tesla's Gigafactory. Teaming up with fellow Credit Suisse analysts around the world (in Japan, Korea, the Americas, Europe and Australia), we have also summarized the implications for companies in related sectors.
■ Four main implications: (1) New market entrants will flood into the ESS business, in anticipation of lower prices driving market expansion; (2) Tesla's low-cost LiB ESS hitting the market will dramatically lower the benchmark price at which products are competitive, increasing pressure on rival battery makers; (3) The potential growth rate of materials / lithium makers will begin to diverge, depending on their level of exposure to Tesla’s partner Panasonic; (4) Automakers will expand their sales efforts beyond simply selling EV/PHEVs to selling comprehensive vehicle-to-home (V2H) ecosystems.
■ Stock calls: We like Tesla Motors (TSLA) and Hitachi Chemical (4217). GS Yuasa (6674) would be negatively affected, in our view.
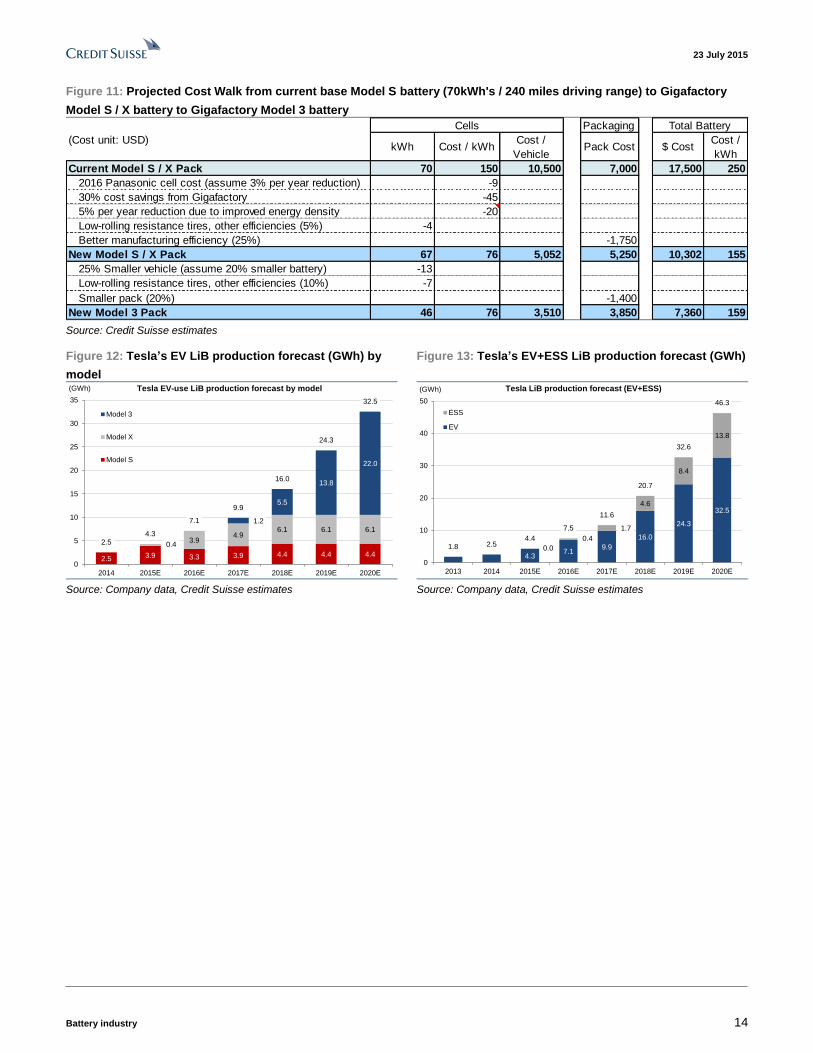
Focus charts Figure 2: Tesla’s EV LiB production forecast (GWh) by
model
Figure 3: Tesla’s EV+ESS LiB production forecast (GWh)
2.5 3.9 3.3 3.9 4.4 4.4 4.40.4
3.94.9
6.1 6.1 6.11.2
5.5
13.8
22.0
2.54.3
7.1
9.9
16.0
24.3
32.5
0
5
10
15
20
25
30
35
2014 2015E 2016E 2017E 2018E 2019E 2020E
(GWh) Tesla EV-use LiB production forecast by model
Model 3
Model X
Model S
4.3 7.1 9.916.0
24.3
32.5
0.00.4
1.7
4.6
8.4
13.8
1.8 2.54.4
7.5
11.6
20.7
32.6
46.3
0
10
20
30
40
50
2013 2014 2015E 2016E 2017E 2018E 2019E 2020E
(GWh) Tesla LiB production forecast (EV+ESS)
ESS
EV
Source: Company data, Credit Suisse estimates Source: Company data, Credit Suisse estimates
Figure 4: Price comparison of Home ESS sold by each manufacturer
0
100
200
300
400
500
600
700
800
Te
sla
Mo
tors
(Pla
nn
ed
)
Pa
na
so
nic
BY
D
Kyo
ce
ra
Nic
hic
on
Sh
arp
To
sh
iba
Na
yu
ta
Ina
ba
De
nki
Sa
ng
yo
GS
Yu
asa
Elii
y P
ow
er
IMT
(k¥)Lowest per-kWh prices for Home ESS for each manufacturer
US
China
Japan
Tesla MotorsPlanned, est. price including inverter
Australian average (AUS$3,000, ¥290k)
European average (€2,000, ¥280k)
Source: Company specification sheets, ITmedia, Credit Suisse estimates
Figure 5: Cross-industry battery-related business alliance trends expansion of business scope
Examples of alliances Expansion of
Purpose of alliance business scope
Auto + Battery = Honda + GS Yuasa; Nissan + NEC
Auto LiB
Parts + Battery = Bosch + GS Yuasa (+Mitsubishi Corp)
Auto LiB
Auto + Battery + Materials = Tesla + Panasonic + various material suppliers
Auto + Energy storage system LiB
Battery + Heavy = Samsung SDI + ABB
Energy storage system
Auto + Utility = MMC/PSA + EDF (+Mitsubishi Corp. etc)
Energy storage system, Auto LiB recycle
Auto + Trading cos = Nissan + Sumitomo Corp.
Energy storage system, Auto LiB recycle
Heavy / Utility /
Trading industryAuto industry
Battery / Materials
industry
Automotive
+ESS
+ LiBrecycle
Source: Company data, Nikkan Kogyo Shimbun and other articles, Credit Suisse
23 July 2015
Battery industry 4
Table of contents Contributors 2 Focus charts 3 Overview 6
Significant impacts from Tesla’s aggressive ESS pricing strategy 6 It’s a free-for-all: existing players expand their business scope and new market
entrants flood in 6 Entry by industry outsiders 6 Battery makers to face intensified competition, both direct and indirect 6 Battery material makers’ fortunes hinge on composition of their customer bases 7 Automakers expanding beyond EV/PHEV to capture value added in V2H 7
Implications for individual sectors and companies (summary) 8 Home ESS price comparison 9
Tesla Powerpack is less than half the price of existing rival products 9 Competitors’ prices are lower than before, but the difference is stark 10
Update on the Tesla Gigafactory 11 Progress of the construction process 11
To date, construction progress appears ahead of schedule and the planned capacity
of the plant appears to be growing 11 Background behind Tesla's entry into Energy Storage Systems 12
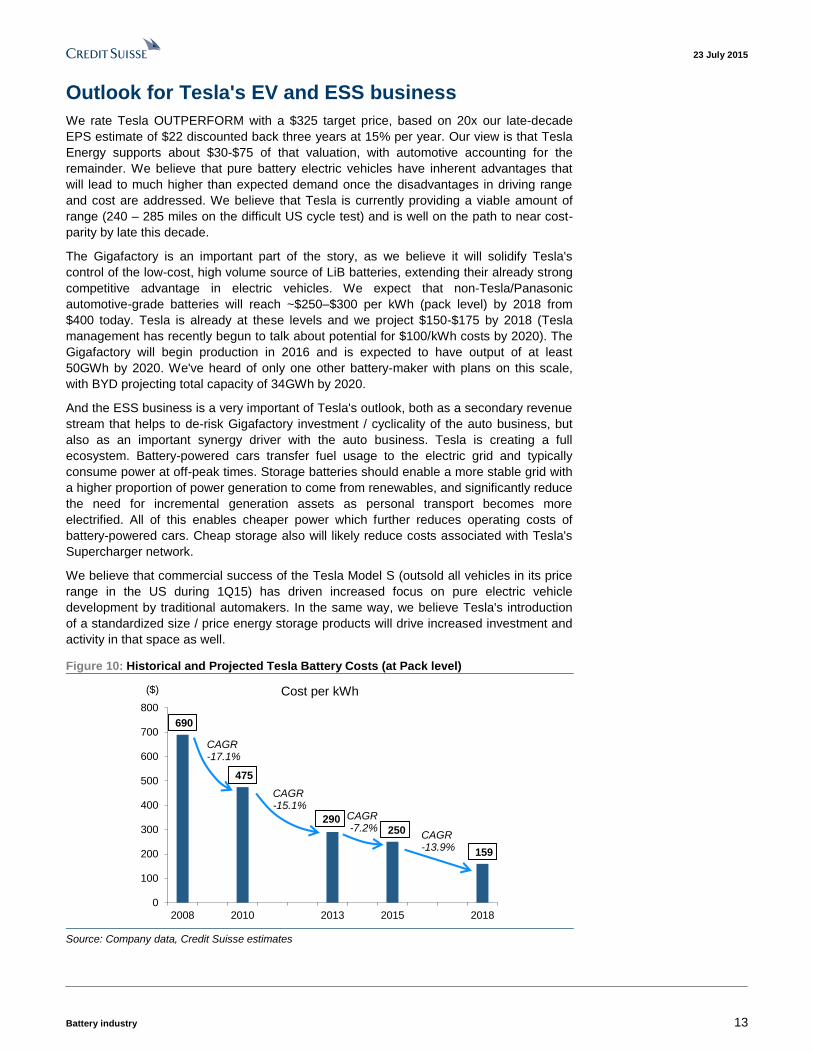
Initial indications of interest were outstanding 12 Outlook for Tesla's EV and ESS business 13
Changes and analysis of the evolving battery-related industries 15 Growth in demand for EV/PHEVs has missed expectations 15 Background: EVs are still not economically rational 15 Existing players expanding their business scope and companies from other sectors
jumping in 16 Business areas are expanding, evolving from Auto LiB to ESS LiB to recycling 16 Many companies from different sectors entering 17 Increasing number of companies only entering assembly, not manufacturing 17 Tesla: Diversifying risk via integrated production all the way from materials,
economies of scale, and development of both EVs and ESS products 18 Implications for battery makers 20
Japan 20 Panasonic (6752, Not Rated) 20 GS Yuasa Corporation (6674, NEUTRAL, TP ¥520) 21
South Korea 21 Samsung SDI (006400.KS, NEUTRAL, TP W132,000) 21 LG Chem Ltd. (051910.KS, OUTPERFORM, TP W330,000) 22
Europe 23 Johnson Matthey (JMAT.L, NEUTRAL, TP £33.00) 23
Overview Significant impacts from Tesla’s aggressive ESS
pricing strategy
It’s a free-for-all: existing players expand their business scope and new market
entrants flood in
Tesla Motors announced it will enter the energy storage systems (ESS) market on 30 April,
2015. The 10kWh system that was unveiled will sell for $3,500 ($350/kWh), a price level
well below anything seen to date. This announcement will likely precipitate a much faster
expansion of the market than previously anticipated. At the same time, with demand for
battery packs used in electric vehicles (EV) and plug-in hybrid vehicles (PHEV) growing at
a slower rate than originally expected (back in 2009–10), related companies (battery
makers, materials suppliers, automakers) are now jumping into the ESS arena, and
entrants from other industries are also joining the fray. These new developments can be
expected to prompt some manufacturers to accelerate their business expansion plans in
this area.
Entry by industry outsiders
The current influx of new market entrants from other industries constitutes a major change
in the battery industry. Automakers are already active in the Home ESS and V2H
businesses, heavy machinery manufacturers have expressed interest in the Electrical Grid
ESS market, and a number of previously-rare tie-ups between battery makers and heavy
machinery manufacturers have also been announced. With sales of EV/PHEV running
below original expectations, there appears to be a drive among related companies to
expand the scope of their business domains in a bid to reap volume gains and capture
value added.
Battery makers to face intensified competition, both direct and indirect
Meanwhile, established battery makers (apart from Panasonic) will face increased
competition from two directions:
■ In both automotive batteries and ESS, established makers will find themselves in
direct competition with Tesla, who has committed itself to ambitious mass production
plans aimed at dramatically lowering costs, and will face a significant intensification of
price competition in both the EV/PHEV and ESS businesses as a result. Obviously,
both of these application areas could see accelerated growth in the future, but there
remains a risk that fallout from price deterioration will outpace any gains from market
growth.
■ There are countless ESS makers, but not all systems makers are battery makers.
Many procure their batteries from outside sources, then assemble them in-house into
ESS. Tesla’s move will significantly reduce benchmark price levels for batteries, in turn
strengthening the hand of systems makers in price negotiations with their suppliers.
Although indirect in nature, this could to lead to a deterioration in the price
environment.
Seeking to capture value
added by moving beyond
automotive batteries and
into ESS and V2H
Batteries: Competition set to
heat up both directly and
indirectly from Tesla
23 July 2015
Battery industry 7
Battery material makers’ fortunes hinge on composition of their customer bases
On the materials side, the best-positioned companies are those that are either (1) already
part of Panasonic’s supply chain, or (2) handle materials that are in relative short supply
globally / there are limited number of suppliers / have pricing power (e.g. lithium).
Automakers expanding beyond EV/PHEV to capture value added in V2H
Back in the initial heady days of 2009–10 when EV/PHEV expectations were running high,
automakers’ primary focus was on selling EV/PHEV. However, companies are now looking
beyond just EV/PHEV and into V2H systems that allow excess power stored in EV
batteries to be transferred in and out of Home ESS. Behind this move is the disappointing
EV/PHEV sales which have not seen the sort of growth originally anticipated, undermining
progress in bringing down battery costs. Automakers are reacting by entering the
V2H/ESS business as a means to increase the economies of scale (adding ESS to
existing automotive battery volume) and, as opposed to just selling cars, to acquire know-
how and intellectual property by integrating cars into comprehensive home energy
ecosystems. In Japan, disaster prevention-related energy storage needs were expected to
grow after the March 2011 Tohoku earthquake, giving further momentum in this area.
Materials: Panasonic
suppliers and companies
handling tight-demand items
in best position
Autos: Expanding from
sales of EV/PHEV to full
V2H systems aimed at
capturing home power
needs
23 July 2015
Battery industry 8
Implications for individual sectors and companies
(summary)
When Tesla’s Gigafactory comes online, the company’s battery production volume and
price competitiveness will both increase. We believe materials makers are in a relatively
favorable position in the value chain to benefit from the coming developments. Particularly
well-positioned are Japanese companies already supplying Panasonic, and lithium
suppliers who have global oligopolistic control of this key material. In contrast, with the
exception of Tesla partner Panasonic, we see little benefit for battery makers apart from
indirect gains related to growth in the EV and ESS markets. The operating environment for
battery makers should grow only more severe as competition, both direct and indirect,
ratchets up. For this reason, we expect the impact on battery makers like GS Yuasa
(Japan), Samsung SDI and LG Chem (both South Korea) to be largely negative.
Figure 6 shows the battery-related sales exposure and the potential impacts from the ESS
market expansion and the Tesla battery production expansion for major battery-related
companies.
Figure 6: Battery business exposure, impact from the expansion in the ESS market/Tesla Gigafactory for each company
Industry Region Company
Battery-
related
business as
% of revenue
Description of business
Potential
impact from
ESS market
expansion
Tesla-
related?
Effect of Tesla's
expansionRelationship with Tesla
Panasonic 5.1%Produces a full lineup of small-scale/EV/ESS
LiBMedium Yes Positive
Main supplier for Tesla; produces Tesla
batteries in Japan and in the Gigafactory
GS Yuasa 12.4%Produces Auto & Industrial LiB; batteries
(incl. lead) makes up more than half of salesMedium No Negative
Directly competes with Tesla in multiple
fields incl. Auto LiB and ESS
Europe Johnson Matthey 2.6%
Design and manufactures batteries and
recently acquired a LFP cathode materials
business
Medium No Neutral Supports market growth and investment
LG Chem 14%Produce lithium ion batteries for IT devices,
EV; ESSMedium No Negative
No known relationship; competitor in both EV
batteries / ESS
Samsung SDI
> 60% (small
size + large
size)
LiB manufacturer High Yes NegativeDirectly competes with Tesla as SDI is an EV
ESS battery manufacturer
Sumitomo Chemical 0.5%Manufactures heat-resistant separators,
rapid expansion in shipments to TeslaMedium Yes Positive Supplies separators
Mitsubishi Chemical 0.4%
Manufactures cathodes, anodes and
electrolytes; has high market share in
anodes and electrolytes
Medium Yes Positive Supplies electrolytes
Ube Industries 2.0%No.1 manufacturer of electrolytes worldwide,
also produces separatorsMedium Yes Positive Supplies electrolytes
Hitachi Chemical 3.3%
Global #1 share of anodes (30%); anodes
(including energy storage devices) makes up
20% of sales
Medium Yes Positive Supplies anodes
Kureha 3.9% 70% global share in binder production Medium Yes Positive Supplies binders
Sumitomo Metal Mining 3.0%Miner of lithium nickel oxide, used in
cathodesHigh Yes Positive Supplies cathodes to Tesla
Umicore 9.3%Produces cathode materials (NMC/LCO) for
EV batteries and electronicsHigh Maybe Positive
Not a direct supplier but have expertise in
NCA materials used by Tesla
BASF 0.3%Produces cathode materials (NCM/LFP),
electrolytes and separators for EV-LiBLow No Neutral Supports market growth and investment
Australia Syrah ResourcesPotentially
50%
Planned graphite miner and coated spherical
graphite producer for the LiB marketHigh Yes Positive
Potential supplier of coated spherical
graphite for LiB anodes
Ecopro <50% LiB material provider High Yes Negative
Negative as of now; it provides NCA
(cathode material) to Samsung SDI, a direct
competitor. However, if the company were to
supply to Tesla in the future, its expansion
would be positive.
L&F Co. 100% LiB material provider High Yes NegativeSupplies cathode materials to Samsung SDI,
a direct competitor
FMC 5.0% Major producer of lithium Medium Maybe Positive
In talks now for potential lithium supply; has
the ability to upgrade lithium carbonate to
lithium hydroxide
Albemarle 14% Major producer of lithium High Maybe Positive
Limited talks with Tesla; has the ability to
upgrade lithium carbonate to lithium
hydroxide
L. America SQM 10% Major producer of lithium Medium No/Maybe Positive Potential supplier of lithium
N. America
Battery
Japan
S. Korea
Battery
materials
Japan
Europe
S. Korea
Lithium
Source: Company data, Credit Suisse estimates
23 July 2015
Battery industry 9
Home ESS price comparison
Tesla Powerpack is less than half the price of existing rival products
Figure 7 is a comparison of the per-kWh price of Tesla's Home ESS product (Powerwall)
and competing products currently being sold by rivals (excluding manufacturers that have
not released their manufacturer’s suggested retail prices (MSRPs)). The price of the
Powerwall (10kWh, $3,500; $350/kWh, or ¥42,000/kWh) does not include the price of the
inverter, but even after taking it into account (broadly double the price, or roughly
$700/kWh, or ¥84,000/kWh) is still less than half that of Panasonic's ¥180,000/kWh and
BYD's ¥247,000/kWh.
Figure 7: Price comparison of Home ESS sold by each manufacturer
0
100
200
300
400
500
600
700
800
Te
sla
Mo
tors
(Pla
nn
ed
)
Pa
na
so
nic
BY
D
Kyo
ce
ra
Nic
hic
on
Sh
arp
To
sh
iba
Na
yu
ta
Ina
ba
De
nki
Sa
ng
yo
GS
Yu
asa
Elii
y P
ow
er
IMT
Lowest per-kWh prices for Home ESS for each manufacturer(k¥)
Note: Actual capacity may be less than nameplate capacity as the Depth of Discharge andDischarge Efficiency differs by product. Operating life (# of charge/discharge cycles) andrate of battery capacity deterioration also differs by product.
US
China
Japan
Australian average (AUS$3,000, ¥290k)
Tesla MotorsPlanned est. price including inverter
European average (€2,000, ¥280k)
Source: Company specification sheets, ITmedia, Credit Suisse calculations
23 July 2015
Battery industry 10
Competitors’ prices are lower than before, but the difference is stark
Figure 8 compares the prices of Home ESS announced by Japanese battery makers in
July 2011, right after the March 2011 Tohoku earthquake, and prices of models being
currently sold. Although prices have been falling for all manufacturers, the difference
between their prices and the price of Tesla's new products remain substantial.
Figure 8: Current prices of Home ESS sold by each manufacturer compared with prices from July 2011
0
100
200
300
400
500
600
700
800
900
Te
sla
Mo
tors
(Pla
nn
ed
)
Te
sla
Mo
tors
(Pla
nn
ed
, w
/ in
ve
rte
r)
Pa
na
so
nic
BY
D
Kyo
ce
ra
Nic
hic
on
Sharp
To
sh
iba
Na
yu
ta
Ina
ba
De
nki
Sa
ng
yo
GS
Yu
asa
Elii
y P
ow
er
IMT
So
ny
Sa
nyo
(n
ow
pa
rt o
fP
ana
so
nic
)
Ed
iso
n P
ow
er
(k¥)Lowest per-kWh prices for Home ESS for each manufacturer:
Comparison with July 2011 prices
Note: Assumed forex rate: 1 USD = 120 JPYActual capacity may be less than nameplate capacity as the Depth of Dischargeand Discharge Efficiency differs by product. Operating life (# of charge/dischargecycles) and rate of battery capacity deterioration also differs by product.
US
China
Japan (2015/07)
Japan (2011/07)
Source: Company specification sheets, ITmedia, Credit Suisse calculations
23 July 2015
Battery industry 11
Update on the Tesla Gigafactory Tesla currently purchases approximately 3.8GWh of LiB battery cells from Panasonic on
an annualized basis (based on current ~48k annual production run-rate of Tesla Model S,
at avg 80kWh's per unit). These cells are produced in Japan and then shipped to Tesla's
automotive assembly factory in Fremont, California, USA where Tesla assembles the cells
into full battery packs. We expect Tesla to ramp vehicle assembly to approx. 100k unit run-
rate by early 2016 which would require cell supply in the 8GWh annualized range.
On February 26, 2014, in order to secure incremental battery supply, Tesla announced
that it would build a fully vertically-integrated battery production facility in the US that
would be capable of producing 35GWh of cells and 50GWh of packs by 2020. This plant is
named Gigafactory. Tesla would continue to purchase ~15GWh of cells produced outside
the Gigafactory, from existing Panasonic facilities in Japan and potentially from a second
battery source. The Gigafactory will be "owned" by Tesla with supply chain partners
manufacturing inside the building but not having any equity stake (think of it as a Just-in-
Time supply chain system, but with the entire supply chain under one roof).
Start of production was originally planned for early 2017 with full production capacity to be
achieved in 2020. Expected total investment cost was announced as $4bn-$5bn, with
Tesla directly investing $2bn and supplier partners investing the remainder (news reports
peg Panasonic's contribution at ~$1.5bn or 30%-40% of total). Approximately 70% of Pack
production would be used to produce 500k Tesla automobiles per year with the remaining
30% used primarily for energy storage products.
Due to substantially lower cost of logistics, power, water, and labor relative to Japan, and
economies of scale from raw materials through to final pack production, Tesla projects an
"at least 30%" reduction in cell cost vs the 2016 Panasonic Japan cell prices. In our view,
this will result in automotive battery pack costs in the $150 / kWh range which would
support a 200-mile+ (322-km+) driving range for Tesla's next-generation vehicle, Model 3,
in the $6,500-$7,000 range. This would get Tesla very close to cost parity with internal
combustion powertrain costs for the low luxury segment (i.e. BMW 3-Series, Mercedes C-
Class, etc).
Progress of the construction process
After the February announcement, Panasonic signed an agreement to participate on July
30, 2014, Tesla broke ground on several sites in Summer 2014, and Tesla announced
final decision on a site outside Reno, Nevada on September 4, 2014.
To date, construction progress appears ahead of schedule and the planned capacity
of the plant appears to be growing
In late 2014, Tesla updated the start of production date to late 2016 (from early 2017) and
then in May 2015 mentioned that Pack production at Gigafactory (using Panasonic Japan
cells) would commence in 1st Quarter of 2016 with cell production to follow in 2H 2016. So,
we believe construction progress is somewhat ahead of schedule. From 3Q14 through
1Q15, Tesla spent $118MM of capex on Gigafactory which appears on track, assuming a
5 year phased construction cycle (i.e. factory will be built in standalone blocks of about
10GWh each).
And the ultimate size of the plant appears to be increasing. After initial interest in Tesla's
energy storage products was much higher than expected, CEO Elon Musk mentioned
(early May 2015) that Tesla was studying a potential 50% increase to capacity (i.e.
75GWh vs original 50GWh) and recently (July 7, 2015) a Nevada local official mentioned
that Tesla was now planning a 24MM square foot facility, up from 10MM square feet
HEV Battery Size (kWh) 1.6 INITIAL purchase cost differential ($) vs. Diesel $ (1,200) $ (6,000) $ (6,000)
PHEV Battery Size (kWh) 10
EV Battery Size (kWh) 20 Lifetime total cost differential ($) vs. Gasoline $ (1,868) $ (6,829) $ (7,159)
Lifetime total cost differential ($) vs. Diesel $ (1,741) $ (6,702) $ (7,032)
Electricity Price ($/kWh) 0.10$
Battery mileage (km/kWh) 6.4 Max Battery Cost ($/KW), vs. Gasoline $ (417) $ (83) $ 142
Discount Rate 4% Max Battery Cost ($/KW), vs. Diesel $ (338) $ (70) $ 148
Source: Credit Suisse estimates
Existing players expanding their business scope and
companies from other sectors jumping in
Business areas are expanding, evolving from Auto LiB to ESS LiB to recycling
Due to these circumstances, we believe battery makers and automakers have also
started to focus on ESS market development (concerns about electricity supplies after the
March 2011 Tohoku earthquake helped boost awareness of energy storage needs).
Automakers are also expanding operations from simply selling EV/PHEVs to Home ESS,
V2H, and automotive LiB recycling. In other words, the scope of the battery business,
which we thought would mostly consist of automotive-use, has expanded to ESS, and has
further spread to encompass the entire battery life cycle, including battery recycling. We
believe car makers have thus moved to tap volume growth and added-value, and not rely
solely on EV/PHEVs.
Figure 15: Cross-industry battery-related business alliance trends expansion of business scope
Examples of alliances Expansion of
Purpose of alliance business scope
Auto + Battery = Honda + GS Yuasa; Nissan + NEC
Auto LiB
Parts + Battery = Bosch + GS Yuasa (+Mitsubishi Corp)
Auto LiB
Auto + Battery + Materials = Tesla + Panasonic + various material suppliers
Auto + Energy storage system LiB
Battery + Heavy = Samsung SDI + ABB
Energy storage system
Auto + Utility = MMC/PSA + EDF (+Mitsubishi Corp. etc)
Energy storage system, Auto LiB recycle
Auto + Trading cos = Nissan + Sumitomo Corp.
Energy storage system, Auto LiB recycle
Heavy / Utility /
Trading industryAuto industry
Battery / Materials
industry
Automotive
+ESS
+ LiBrecycle
Source: Company data, Nikkan Kogyo Shimbun and other articles, Credit Suisse
23 July 2015
Battery industry 17
Many companies from different sectors entering
Furthermore, due to the growing potential need for electrical grid and household energy
storage arising from the growth in solar power, companies in sectors that previously had
little involvement in LiB-related business are starting to enter the business (including
through teaming up with battery makers). They include heavy machinery manufacturers,
utilities (electric, gas), and trading companies.
Figure 16: Battery-related tie-ups between automakers / battery makers and companies in other industries
Business Format Companies involved Remarks
Samsung SDI/ABB Signed an MOU to develop and market microgrids in March 2015
BYD/ABBAnnounced strategic partnership to develop smartgrid and EV charging
technologies in September 2014
Mitsubishi Motors / Mitsubishi
Corp / PSA Peugeot Citroen
(France) / EDF (French power
company) / Other
Attempting to create an ESS system using multiple types of batteries,
including used auto-LiBs from Mitsubishi Motors and PSA and currently
operating EVs
BMW (Germany) / PG&E (US
power company)
Started a program that pays incentives to EV owners that refrain from
charging their EVs during peak demand hours
Pilot program
(Gas utility + Automaker)Osaka Gas / Honda / Toshiba
Uses EV battery to store electricity produced by fuel cells, and depletes it
when fuel cells don't produce enough electricity
Partnership
(Heavy machinery +
Battery / Automaker )
Pilot program
(Electric utility + Automaker)
Source: Company data, Nikkan Kogyo Shimbun and other articles, Credit Suisse
Increasing number of companies only entering assembly, not manufacturing
The number of ESS manufacturers who are entering the market, betting that ESS demand
will increase, is growing. We suspect many only assemble and market the ESS system
and source the batteries externally. Battery makers who supply the batteries and ESS
system manufacturers negotiate battery prices individually. We think that the indirect effect
of Tesla setting substantially lower prices for ESS batteries than previous industry
standards might be ESS system makers demanding lower prices for batteries. In such a
scenario, we would expect positive outcomes to come from the acceleration in the pace of
expansion in the ESS market due to the lower prices. However, this would not be entirely
good news as battery makers might be subjected to substantial pressure to cut their prices.
Figure 17: ESS manufactures that buys batteries from other sources
PanasonicTabuchi Electric
Edison PowerYamada Denki
+ West HD
KyoceraSamsung SDI
Toshiba
Samsung SDISamsung SDI Nichicon
YAMABISHI
Note: Solid line represents battery supply only, dotted line represents OEM of entire ESS system
Source: Company data, Credit Suisse
23 July 2015
Battery industry 18
Tesla: Diversifying risk via integrated production all the way from materials,
economies of scale, and development of both EVs and ESS products
Amid these changes in the industry, Tesla's business model—concentrated manufacturing
from battery materials all the way through to battery cells and packs in a single factory like
the Gigafactory, reducing costs by maximizing economies of scale, and developing both
EVs and ESS products to diversify demand risk—is truly unique and looks likely to give the
company a competitive edge.
Figure 18: Relationship between automakers and battery makers set to change: Tesla will be first to integrate
production from materials to battery packs, now targeting both Auto LiB and Home ESS markets
Relationship:
=>If the sales of Tesla ESS products grow, competing battery/ESS makers could be heavily impacted
Main companies: Tesla Motors, Panasonic, battery material makers
Timeframe: Powerwall is planned to be shipped from Summer 2015; Gigafactory is planned to start its operations one year earlier than the original plan, in 2016
In addition to EVs like the Model S/X/3, ESS products like the Powerwall and the Powerpack provide an additional venue for battery cell demand, leading to lower costs
through increased production
PanasonicTesla
Material suppliers
Model S/X/3
PowerwallPowerpack
Home/BusinessESS
Source: Company data, Credit Suisse
23 July 2015
Battery industry 19
Figure 19: Companies from industries like auto parts, heavy machinery and trading companies have already entered the
Auto LiB/ESS market
Bosch
Hyundai
Heavy
Toshiba
ABB
Honda
Mitsubishi
Motors
BYD
Tesla
Samsung
SDI
GS Yuasa
Panasonic
LG
Chem
Sekisui
Chemical
Mitsubishi
Corp
PG&E
EDF
Osaka
Gas
Auto parts makers
Heavy machinery
Auto LiB
ESS
(Home/
Industrial/
Grid
manage-
ment)
Mitsubishi
Heavy
PSA
Peugeot
Citroen
BMWAutomakers
Battery makers
Chemicals
Trading companies
Power utilities
Gas utilities
Nissan
Motors
Sumitomo
Corp
Note: Dotted lines on the left side of the chart (Auto LiB side) represent joint ventures.
Dotted lines on the right side (ESS side) represent joint grid management projects, except for Mitsubishi Heavy which produces industrial LiBs.
Source: Company data, Credit Suisse
23 July 2015
Battery industry 20
Implications for battery makers Assuming that Panasonic will continue to be the only battery maker directly involved in
Tesla’s Gigafactory, we believe the implications are basically negative for other battery
makers.
■ Increased price competition in both automotive and ESS batteries: In both
automotive and stationary batteries, established makers will find themselves in direct
competition with Tesla, who has committed itself to ambitious mass production plans
aimed at dramatically lowering costs, and will face a significant intensification of price
competition in both the EV/PHEV and ESS businesses as a result. Obviously, both of
these application areas could see accelerated growth in the future, but there remains a
risk that fallout from price deterioration will outpace any gains from market growth.
■ Risk of increased price pressure from energy storage system makers: There are
countless ESS makers, but not all systems makers are battery makers. Many procure
their batteries from outside sources, then assemble them in-house into ESS. Tesla’s
move will significantly reduce benchmark price levels for batteries, in turn
strengthening the hand of systems makers in price negotiations with their suppliers.
Although indirect in nature, this could to lead to a deterioration in the price
environment.
■ There is a positive side from growth in scope of market and industry: Assuming
Tesla does succeed in boosting sales of both EV and ESS battery, other battery
makers would likely benefit from accelerated growth in electric vehicle and home
battery system markets and increased public awareness. But in the short term, the
negative impact from intensified competition would likely overwhelm any such gains.
Japan
Panasonic (6752, Not Rated)
Panasonic supplies cylindrical LiBs to Tesla. The company officially announced its
participation in Tesla’s Gigafactory in October 2014 and has established a LiB production
subsidiary within the Gigafactory. In addition to cells it currently produces in Japan, it plans
to begin mass production of batteries at the Gigafactory in 2016.
The company undertook a comprehensive group-wide reorganization in April 2015 that
merged its small rechargeable battery business and its automotive battery business with
the aim of creating a single unified technology platform to boost competitiveness.
Management targets for FY3/16 include total rechargeable battery sales of ¥406bn (+7%
YoY) and OP of ¥22.7bn (+210%). In the automotive-related area, which includes vehicle-
mounted batteries, power sources, and charging devices, it targets FY3/19 sales of
¥700bn (compared to FY3/16 guidance of ¥420bn), with car batteries serving as the main
driver. In the stationary storage battery business, in addition to supplying batteries to Tesla
the company plans to expand sales of ESS used in base stations and residential
applications.
The company budgets ¥1tn in strategic investments for the four years FY3/16–19, with
¥200bn earmarked for FY3/16. About ¥60bn of these investments will be spent in
automotive and industrial businesses, with slightly more than half going to the Gigafactory.
23 July 2015
Battery industry 21
GS Yuasa Corporation (6674, NEUTRAL, TP ¥520)
GS Yuasa’s automotive LiB business is focused on two joint venture consolidated
subsidiaries: Blue Energy (BEC), which supplies batteries for Honda HEVs, and Lithium
Energy Japan (LEJ), which supplies batteries mainly for Mitsubishi Motors’ PHEVs. It has
also established a third joint venture in the LiB field called Lithium Energy & Power (LE&P)
with Bosch and Mitsubishi Corp in February 2014.
With Tesla fully entering the field of battery manufacturing, GS Yuasa may have to
compete with another company for automotive battery orders, and the LiB cost benchmark
could drop substantially. LE&P is aiming to boost LiB performance two-fold by 2020. That
kind of dramatic step-up in battery technology may give GS Yuasa a competitive edge
against other battery makers, including Tesla, but it is difficult to tell at this point whether it
will be successful. In the near term, we think GS Yuasa needs to remain focused on
narrowing losses in its automotive LiB business by boosting output of batteries for Honda’s
HEV lineup and by improving productivity and costs for batteries used in Mitsubishi
Motors’ Outlander PHEV model.
In addition to automotive LiB, the company is also working to expand its industrial LiB
business (which currently generates an estimated ¥5–6bn in sales). Although focused
more on industrial and power generation applications than residential batteries, there is a
possibility that this business will end up competing against Tesla’s ESS business in the
future, particularly in overseas markets.
South Korea
Samsung SDI (006400.KS, NEUTRAL, TP W132,000)
Description of company's business: Samsung SDI (SDI) is a leading Li-ion battery (LiB)
manufacturer. After entering the market in 2000, the company has maintained its global
number one position in small size LiBs since 2010. Up to 2014, SDI maintained more than
25% market share in the small size LiB market. In the large size LiB market, SDI is
currently the sole supplier of battery cells to BMW's i3 and i8 with a long term contract
while also supplying to other major auto OEMs such as Chrysler, Audi, Volkswagen and
Porsche. SDI acquired Magna Steyr's battery pack business in February for around
W100bn to develop its own battery pack business. SDI is also a global leader in the LiB
ESS market with a 24% market share in 2014. The company is active in both the
residential and commercial ESS markets with supply contacts from various customers
around the world.
Competitiveness, strategy and future outlook: SDI's battery cell manufacturing
capability is globally competitive given its track record and experience from small size LiB.
The weakness has been in the cell packaging on the xEV battery side, which it tried to
strengthen through formation of a JV with Bosch in the past. Disagreements ended the JV
relationship and SDI attempted to go alone in developing a competitive packaging
business without much success. This led to the acquisition of Magna Steyr's battery pack
business in February 2015 which was a strategic move to gain immediate access into the
packaging business, related IPs and buyout of existing customer contracts. Access to
customers on xEV battery packaging included VW, BMW, Daimler, and Volvo. Acquisition
included all employees, existing customer contracts, and production and development
sites. Fully integrating cell production and packaging is seen as an important strategic
move in becoming competitive in the xEV battery segment.
SDI's ESS is a derivative of its successful xEV battery manufacturing. ESS business
started in 2012. Main cells are of same quality as its xEV battery specifications, so
performance such as safety and charge acceptance is high. Main areas of focus for ESS
products are in the residential and commercial power storage, base transceiver stations,
uninterrupted power system for factories and buildings and power plant/utility/renewable
103590.KS Iljin Electric - KRW n.a. 6,090 - 195 7.4 x 5.8 x 0.6 x 0.6 x - - 8.8% 10.4%
* ROE = net profit / common equity for global comparison purposes Note: Share prices as of 22 July close
Source: Company data, I/B/E/S, Credit Suisse estimates
Figure 29: Company valuations: Lithium makers CS Px Target Current Market P/E (x) P/B (x) EV/EBITDA (x) ROE (%) *
Ticker Company Rating CCY Px (LC) Px (LC) (Diff.) Cap (mn $) FY1 E FY2 E FY1 E FY2 E FY1 E FY2 E FY1 E FY2 E
[ MATERIAL MAKERS]
Lithium
ALB Albemarle Corporation - USD n.a. 51.71 - 5,801 13.3 x 12.4 x 2.7 x 2.4 x 8.9 x 8.5 x 21.6% 19.7%
FMC FMC Corporation O/P USD 69.00 48.83 41% 6,520 15.1 x 12.2 x 3.9 x 3.1 x 10.5 x 8.6 x 26.3% 27.3%
SQM.N Soquimich U/P USD 27.00 13.52 100% 5,124 11.2 x 10.1 x 1.3 x 1.3 x 9.6 x 8.8 x 12.0% 12.5%
* ROE = net profit / common equity for global comparison purposes Note: Share prices as of 22 July close
Source: Company data, I/B/E/S, Credit Suisse estimates
23 July 2015
Battery industry 35
Reference charts / figures
Figure 30: Auto LiB-related tie-ups Business Format Battery cell / system supplier Investor / investment ratio Remarks
Tesla Motors / Panasonic
Integrated manufacturing from materials to packing at Gigafactory;
In addition to EV uses (Model S, X, 3), LiBs are also used for ESS
systems like the Powerwall
DaimlerWholly-owned subsidiary Deutsche ACCUmotive produces LiB for
Daimler's EV, PHV and Home/Industrial ESS products
Primearth EV Energy Toyota (80.5%), Panasonic (19.5%) Mainly supplies HEV Ni-MH; also supplies Li-ion for HEV
Automotive Energy Supply (AESC) Nissan (51%), NEC Group (49%)AESC will supply battery modules/packs, NEC Group will supply
cathodes to AESC
Lithium Energy JapanGS Yuasa (51%), Mitsubishi Corp.
(40.7%), Mitsubishi Motor (8.3%)Supply EV battery modules to MMC, PSA, others
Blue Energy GS Yuasa (51%), Honda (49%) Supply HEV battery packs to Honda
JV among Battery
makersHitachi Vehicle Energy (HVE)
Hitachi (64.9%), Shin-Kobe Electric
(25.1%), Hitachi Maxell Energy (10%)
Split responsibilities among group cos: HVE for auto, Shin-Kobe
Electric for industrial, etc.
Compact Power (US) LG Chem (Korea) (100%)Compact Power will produce systems (LG Chem will supply LIB
cells)
Lithium Energy and PowerBosch (Germany) (50%), GS Yuasa
(25%), Mitsubishi Corp (25%)
Aim to boost LiB performance 2x by 2020; combine GS Yuasa's
cell tech + Bosch's packaging/control tech
HL Green Power Co.Hyundai Mobis (Korea) (51%), LG Chem
(Korea) (49%)
JV will produce battery packs for Hyundai Motors' HEVs (cells
from LGC)
Johnson Controls-Saft (US)Johnson Controls (US) (51%), Saft
(France) (49%)JV will produce the battery system (note: JV dissolved in Sep'11)
SB LiMotiveBosch (Germany) (50%), Samsung SDI
(Korea) (50%)JV will produce battery packs, BMS etc. (JV dissolved in Sep'12)
SK Innovation-Continental JVSK Innovation (Korea) (51%), Continental
(Germany) (49%)JV will assemble LiB packs (JV agreement signed Jan'12)
Mahy E-CellMagna Int'l (Canada) (60%), Hyundai
Heavy (Korea) (40%)
JV will engineer, design, and develop LiB cells/packs for the
xEV/ESS; target 400k unit sales in 2018
Johnson Controls / Hitachi (?)MOU for motive / non-motive advanced energy storage
collaboration in R&D, procurement, production etc.
Zhejiang Wanxiang Ener1 Power SystemWanxiang (China) (60%), Ener1 (US)
(40%)
JV to produce LIB cells / packs for Wanxiang's existing local
automaker customer base
Samsung-ARN (Xi'an) Battery GroupSamsung SDI(50%)、Anqing Ring New
Group (中)(50%)
Supply HEV battery packs (40,000 vehicles eq. / year) starts
producing in Oct 15
Panasonic (Sanyo Electric) Former Sanyo taking initiative marketing to global automakers
ToshibaAnnounced joint development of EV LIB / motor with VW in Feb
'09; will also supply MMC, Honda
BYD Company (China)Tie-up for R&D tie-up for HEVs/EVs with VW (annc'd May '09); tie-
up with Daimler; supply battery packs to BYD Auto
LG Chem (Korea) Produces and supplies battery cells
Auto maker + Battery
maker + Material maker
Integrated
manufacturing
Battery maker solo
supply
Auto maker + Battery
maker JV
JV among Battery, auto
parts / systems makers
Source: Company data, The Korea Times and other articles, Credit Suisse
Figure 31: Battery-related tie-ups between automakers / battery makers and companies in other industries
Business Format Companies involved Remarks
Samsung SDI/ABB Signed an MOU to develop and market microgrids in March 2015
BYD/ABBAnnounced strategic partnership to develop smartgrid and EV charging
technologies in September 2014
Mitsubishi Motors / Mitsubishi
Corp / PSA Peugeot Citroen
(France) / EDF (French power
company) / Other
Attempting to create an ESS system using multiple types of batteries,
including used auto-LiBs from Mitsubishi Motors and PSA and currently
operating EVs
BMW (Germany) / PG&E (US
power company)
Started a program that pays incentives to EV owners that refrain from
charging their EVs during peak demand hours
Pilot program
(Gas utility + Automaker)Osaka Gas / Honda / Toshiba
Uses EV battery to store electricity produced by fuel cells, and depletes it
when fuel cells don't produce enough electricity
Partnership
(Heavy machinery +
Battery / Automaker )
Pilot program
(Electric utility + Automaker)
Source: Company data, Nikkan Kogyo Shimbun and other articles, Credit Suisse
23 July 2015
Battery industry 36
Figure 32: Relationship between automakers and battery makers set to change: Tesla will be first to integrate
production from materials to battery packs, now targeting both Auto LiB and Home ESS markets Relationship: Automakers sought to secure captive battery suppliers (build relationships based on equity stakes) to avert battery supply shortages
Main companies: Japanese automakers, Japanese battery makers
Timeframe: -2008
Relationship:
Main companies: Foreign automakers, Japanese/foreign battery makers
Timeframe: 2009-
Relationship:
Main companies: Japanese/foreign automakers, Japanese/foreign battery makers
Timeframe: 2011-
OEM supply: Commercial EV "MINICAB-MiEV
HV, FCV technology to BMW ⇔ diesel engines to Toyota
HV battery
PHV battery
HV technology supplied by Toyota
Relationship:
=>If the sales of Tesla ESS products grow, competing battery/ESS makers could be heavily impacted
Main companies: Tesla Motors, Panasonic, battery material makers
Timeframe: Powerwall is planned to be shipped from Summer 2015; Gigafactory is planned to start its operations one year earlier than the original plan, in 2016
In addition to EVs like the Model S/X/3, ESS products like the Powerwall and the Powerpack provide an additional venue for battery cell demand, leading to lower costs
through increased production
Companies capable of mass-producing batteries emerged earlier than initially anticipated, prompting automakers to build alliances/supply relationships with multiple battery
makers while conducting cost/technology comparisons
While automakers have many options in terms of technologies for complying with emissions and fuel-efficiency standards, few have all-around development capabilities.
Automakers are consequently building reciprocal supply/OEM relationships with each other, focusing on their respective technological fortes.
=> As a result, automakers that produce battery-equipped eco-cars benefit from economies of scale while battery makers face a decrease in automaker customers (i.e.,
the number of automakers that develop battery-equipped eco-cars in-house).
PEVEToyota Panasonic
Lithium Energy Japan
Mitsubishi Motors
GS Yuasa
Blue EnergyHonda Motor GS Yuasa
Mitsubishi Corporation
Volkswagen
Panasonic (Sanyo)
ToshibaBYD
SBLimotive
Daimler
AESC
LG ChemBYD
Johnson Controls
A123 Systems
SK Innovation
Mitsubishi Motors
Lithium Energy Japan
Toshiba
Other?
Nissan
Suzuki
Toyota
PEVE BMW
Fuji Heavy / Mazda
Panasonic / Sanyo
PanasonicTesla
Material suppliers
Model S/X/3
PowerwallPowerpack
Home/BusinessESS
Source: Company data, Credit Suisse
23 J
uly
201
5
Batte
ry in
du
stry
3
7
Figure 33: Overview of relationships between xEV makers and their battery suppliers Battery Cell / Pack Supplier Auto OEM Customer (includes estimates)
Battery technologies Japan Korea US Europe China
Cathode
materialCell format Features Toyota Nissan Honda M'bishi Fuji
Hyundai
/ KiaGM Ford Chrysler Tesla
VW
/ AudiBMW
Daimler
/ M.FusoRenault PSA BYD Kandi Chery SAIC Dongfeng
PEVE LNO PrismaticEnergy density high, but issues still remain with safety and mass-
production technology.1 ○
Nissan/AESC LNMO LaminateSafety enhanced by patented spinel structure. Laminate format with high
level of heat dispersal used.5 ○ ○ ○ ○ ○
Panasonic
(Sanyo Electric)NMC Prismatic Sanyo has developed an improved NMC cathode. 8 ○ ○ ○ ○ ○ ○ ○ ○
LEJ LMO Prismatic One of first to begin mass production of EV batteries. 3 ○ ○ ○
BE NMC Prismatic Will begin by supplying batteries for Honda HEVs. 1 ○
HVE LMO
Cylindrical /
Prismatic /
laminate?
Aims to supply batteries as package with Hitachi inverters, motors. 2 ○ ○
Toshiba LMO PrismaticLTO anode with high I/O power density used. Also safer than graphite
anode, and has better cycle characteristic.4 ○ ○ ○ ○
LG Chem
/ LG Chem PowerLMO Laminate
Experienced in manufacturing laminate-type batteries as producer of
small LIBs. Cathode materials and electrolyte solutions largely made in-
house.
12 ○ ○ ○ ○ ○ ○ ○ ○ ○ ○ ○ ○
Samsung SDI LMO PrismaticWith expertise in small LIBs, SDI is responsible for battery cell
production.5 ○ ○ ○ ○ ○
SK Innovation LMO LaminateHas proprietary separator technology, but no experience in mass-
producing small LIBs.3 ○ ○ ○
Johnson
ControlsLNO One of first to start mass producing batteries for HEVs (for BMW). 6 ○ ○ ○ ○ ○ ○
Tesla LCO/NCA**
Cylindrical for
consumer
electronics
Strength lies in technology for pack control of several thousand small LIB
cells.3 ○ ○ ○
BYD LFP Manufacturers LFP cathodes in-house; also has own auto brand. 4 ○ ○ ○ ○
Hitachi N/A Prismatic Produces battery cells for the new Chevrolet Malibu Hybrid 2 ○ ○
Tianneng Group LMO Prismatic Largest battery maker in China; Supplies LiB for Kandi, Geely 2 ○ ○
Electrovaya LMO LaminateHas proprietary technology that lets the company produce LiB
without using NMP (toxic solvent that causes health hazards)1 ○
Wanxiang-Ener1 LMO N/AAims to market to existing customers of Wanxiang, China's largest
Base car price ($) Annual driving distance (km/yr)
Gaso
lin
e P
rice (
$/L
)
Gaso
lin
e P
rice (
$/L
)
Source: Credit Suisse estimates
23 July 2015
Battery industry 40
Figure 38: Comparison of PHV/EV base car costs with impact on costs from change in
gasoline and electricity prices (assuming five-year useful life for PHV/EVs): "If gasoline /
electricity prices are higher/lower by Y% over the lifetime of the car, total lifetime running
cost increase / decrease is equivalent to X% of the initial purchase cost of the car."
PHEV EV PHEV EV
$30,000 $35,000 $30,000 $35,0000% 0% 0% 0%
40% $1.63 4.6% 3.9% -40% $0.06 0.5% 0.7%
30% $1.52 3.5% 3.0% -30% $0.07 0.4% 0.5%
20% $1.40 2.3% 2.0% -20% $0.08 0.3% 0.4%
10% $1.28 1.2% 1.0% -10% $0.09 0.1% 0.2%
- $1.17 - - - $0.10 - -
-10% $1.05 -1.2% -1.0% 10% $0.11 -0.1% -0.2%
-20% $0.93 -2.3% -2.0% 20% $0.12 -0.3% -0.4%
-30% $0.82 -3.5% -3.0% 30% $0.13 -0.4% -0.5%
-40% $0.70 -4.6% -3.9% 40% $0.14 -0.5% -0.7%
Gaso
lin
e P
rice (
$/L
)
Ele
ctr
icit
y p
rice (
$/k
Wh
)
Source: Credit Suisse estimates
Figure 39: Battery / Battery materials-related investment news over the next few years 2015 2016 2017 18 19 20
Toda Kogyo/BASF Sumitomo Metal Mining
Asahi Kasei
☆※Ube Industries
※Morita Chemical Industries
※Morita Chemical Industries
(none) Japan More than 100 billion yen
☆ United States 10 billion to 100 billion yen
※ China
〇 Taiwan
# South Korea
・ Other/Undisclosed
Electrolyte
Solution
※Stella Chemifa Mitsubishi Chemical
※Central Glass
Mitsubishi Chemical
※TDK
Battery
Other☆Toshiba/Sumitomo Corp
〇Mitsui Chemicals
・Samsung SDI
Murata Manufacturing
・☆Panasonic
☆Tesla/Panasonic
※Samsung SDI
Sumitomo Chemical
#Sumitomo Chemical
Cathode
MaterialHitachi Chemical
〇China Steel Chemical
Showa Denko
・Mitsubishi Chemical
☆Hitachi Chemical
Japan Vilene #Toray Industries
#W-Scope Asahi Kasei Chemicals
TosohSeparator
Anode
Material
Source: Company data, The Nikkei, The Chemical Daily and other articles, Credit Suisse
23 July 2015
Battery industry 41
Companies Mentioned (Price as of 23-Jul-2015)
Albemarle Corporation (ALB.N, $51.71) BASF (BASFn.DE, €82.73) Clariant (CLN.VX, SFr19.25) FMC Corporation (FMC.N, $48.83) GS Yuasa (6674.T, ¥490, NEUTRAL, TP ¥520) Hitachi Chemical (4217.T, ¥2,155, OUTPERFORM, TP ¥3,200) Honda Motor (7267.T, ¥3,913) Hyundai Motor Company (005380.KS, W138,000) Johnson Matthey (JMAT.L, 2900.0p) Kureha (4023.T, ¥472) LG Chem Ltd. (051910.KS, W271,000) Mitsubishi Chemical Holdings (4188.T, ¥817) Nissan Motor (7201.T, ¥1,224) Panasonic Corporation (6752.T, ¥1,570) Samsung SDI (006400.KS, W99,600) Soquimich (SQM.N, $13.52) Sumitomo Chemical (4005.T, ¥723) Sumitomo Metal Mining (5713.T, ¥1,732) Syrah Resources (SYR.AX, A$3.78) Tesla Motors Inc. (TSLA.OQ, $267.87, OUTPERFORM[V], TP $325.0) Toyota Motor (7203.T, ¥8,278) Ube Industries (4208.T, ¥227) Umicore (UMI.BR, €40.36)
Disclosure Appendix
Important Global Disclosures
Jun Yamaguchi and Dan Galves, each certify, with respect to the companies or securities that the individual analyzes, that (1) the views expressed in this report accurately reflect his or her personal views about all of the subject companies and securities and (2) no part of his or her compensation was, is or will be directly or indirectly related to the specific recommendations or views expressed in this report.
3-Year Price and Rating History for GS Yuasa (6674.T)
6674.T Closing Price Target Price
Date (¥) (¥) Rating
31-Aug-12 296 380 O
21-Nov-12 309 360
05-Mar-13 402 360 N
14-Jun-13 404 370
25-Nov-13 604 500 U
10-Feb-14 554 520 N
05-Jun-14 600 550
04-Aug-14 671 610
20-Nov-14 561 560
16-Feb-15 508 550
26-May-15 547 520
* Asterisk signifies initiation or assumption of coverage.
O U T PERFO RM
N EU T RA L
U N D ERPERFO RM
3-Year Price and Rating History for Hitachi Chemical (4217.T)
4217.T Closing Price Target Price
Date (¥) (¥) Rating
01-Aug-12 1,189 1,760 O
18-Oct-12 1,067 1,560
22-Jan-13 1,327 1,640
30-Jan-13 1,264 1,630
05-Jun-13 1,582 2,160
02-Sep-13 1,620 1,960
25-Oct-13 1,503 1,930
28-Jan-14 1,490 1,620 N
12-Aug-14 1,837 2,250 O
11-Mar-15 2,612 3,200
* Asterisk signifies initiation or assumption of coverage.
O U T PERFO RM
N EU T RA L
23 July 2015
Battery industry 42
3-Year Price and Rating History for Tesla Motors Inc. (TSLA.OQ)
TSLA.OQ Closing Price Target Price
Date (US$) (US$) Rating
13-Aug-14 260.31 325.00 O *
12-Feb-15 202.88 290.00
28-Jun-15 267.09 325.00
* Asterisk signifies initiation or assumption of coverage.
O U T PERFO RM
The analyst(s) responsible for preparing this research report received Compensation that is based upon various factors including Credit Suisse's total revenues, a portion of which are generated by Credit Suisse's investment banking activities
As of December 10, 2012 Analysts’ stock rating are defined as follows:
Outperform (O) : The stock’s total return is expected to outperform the relevant benchmark*over the next 12 months.
Neutral (N) : The stock’s total return is expected to be in line with the relevant benchmark* over the next 12 months.
Underperform (U) : The stock’s total return is expected to underperform the relevant benchmark* over the next 12 months.
*Relevant benchmark by region: As of 10th December 2012, Japanese ratings are based on a stock’s total return relative to the analyst's coverage universe which consists of all companies covered by the analyst within the relevant sector, with Outperforms representing the most attractive, Neutrals the less attractive, and Underperforms the least attractive investment opportunities. As of 2nd October 2012, U.S. and Canadian as well as European ratings are based on a stock’s total return relative to the analyst's coverage universe which consists of all companies covered by the analyst within the relevant sector, with Outperforms representing the most attractive, Neutrals the less attractive, and Underperforms the least attractive investment opportunities. For Latin American and non -Japan Asia stocks, ratings are based on a stock’s total return relative to the average total return of the relevant country or regional benchmark; prior to 2nd October 2012 U.S. and Canadian ratings were based on (1) a stock’s absolute total return potential to its current share price and (2) the relative attractiveness of a stock’s total return potential within an analyst’s coverage universe. For Australian and New Zealand stocks, the expected total return (ETR) calculation includes 12-month rolling dividend yield. An Outperform rating is assigned where an ETR is greater than or equal to 7.5%; Underperform where an ETR less than or equal to 5%. A Neutral may be assigned where the ETR is between -5% and 15%. The overlapping rating range allows analysts to assign a rating that puts ETR in the context of associated risks. Prior to 18 May 2015, ETR ranges for Outperform and Underperform ratings did not overlap with Neutral thresholds between 15% and 7.5%, which was in operation from 7 July 2011.
Restricted (R) : In certain circumstances, Credit Suisse policy and/or applicable law and regulations preclude certain types of communications, including an investment recommendation, during the course of Credit Suisse's engagement in an investment banking transaction and in certain other circumstances.
Volatility Indicator [V] : A stock is defined as volatile if the stock price has moved up or down by 20% or more in a month in at least 8 of the past 24 months or the analyst expects significant volatility going forward.
Analysts’ sector weightings are distinct from analysts’ stock ratings and are based on the analyst’s expectations for the fundamentals and/or valuation of the sector* relative to the group’s historic fundamentals and/or valuation:
Overweight : The analyst’s expectation for the sector’s fundamentals and/or valuation is favorable over the next 12 months.
Market Weight : The analyst’s expectation for the sector’s fundamentals and/or valuation is neutral over the next 12 months.
Underweight : The analyst’s expectation for the sector’s fundamentals and/or valuation is cautious over the next 12 months.
*An analyst’s coverage sector consists of all companies covered by the analyst within the relevant sector. An analyst may cover multiple sectors.
Credit Suisse's distribution of stock ratings (and banking clients) is:
Global Ratings Distribution
Rating Versus universe (%) Of which banking clients (%)
Outperform/Buy* 48% (25% banking clients)
Neutral/Hold* 36% (44% banking clients)
Underperform/Sell* 13% (38% banking clients)
Restricted 3%
*For purposes of the NYSE and NASD ratings distribution disclosure requirements, our stock ratings of Outperform, Neutral, an d Underperform most closely correspond to Buy, Hold, and Sell, respectively; however, the meanings are not the same, as our stock ratings are determined on a relative basis. (Please refer to definitions above.) An investor's decision to buy or sell a security should be based on investment objectives, current holdings, and other individual factors.
23 July 2015
Battery industry 43
Credit Suisse’s policy is to update research reports as it deems appropriate, based on developments with the subject company, the sector or the market that may have a material impact on the research views or opinions stated herein.
Credit Suisse's policy is only to publish investment research that is impartial, independent, clear, fair and not misleading. For more detail please refer to Credit Suisse's Policies for Managing Conflicts of Interest in connection with Investment Research: http://www.csfb.com/research-and-analytics/disclaimer/managing_conflicts_disclaimer.html
Credit Suisse does not provide any tax advice. Any statement herein regarding any US federal tax is not intended or written to be used, and cannot be used, by any taxpayer for the purposes of avoiding any penalties.
Price Target: (12 months) for GS Yuasa (6674.T)
Method: Our ¥520 target price for GS Yuasa is based on a FY3/16-17 average EPS estimate of ¥39.9 and a fair-value P/E of 13.1x (average multiple for periods below 17.5x, the average of 12-month-forward consensus P/E since 2005).
Risk: Upside/downside risks to our ¥520 target price for GS Yuasa include stronger-than-anticipated improvements or erosion for earnings at the auto LiB business, shifts in lead prices, and changes to the pace of growth at overseas units.
Price Target: (12 months) for Hitachi Chemical (4217.T)
Method: We base our ¥3,200 target price for Hitachi Chemical on a fair-value P/E of 14.8x applied to estimated FY3/17 EPS of ¥216.1. Fair-value P/E is the TOPIX-average P/E (16.6x) for the integrated chemical sector times the sector average P/E relative to TOPIX of the past 10 years (0.89x).
Risk: Risks to our ¥3,200 target price for Hitachi Chemical include: upside: stronger-than-expected monthly sales of electronics materials and automotive parts, and recovery in demand for touch panel materials and expanded takeup of automotive LiB anode materials; downside: yen restrengthening and a slowdown in demand for electronic materials including die bonding materials.
Price Target: (12 months) for Tesla Motors Inc. (TSLA.OQ)
Method: Our $325 target price for Tesla is based on 20x our late-decade estimate of $22 EPS, discounted back 3 years at 15%. Our late-decade volume estimate represents 0.5% of global market share; therefore, we still expect investors would assume substantial long-term growth potential, thus a 20x multiple is reasonable.
Risk: Risks to our $325 target price for Tesla Motors Inc. include: 1.) Battery Durability 2.) Vehicle Quality / Warranty Risk 3.) Currency 4.) Key Man Risk 5.) Residual Values
Please refer to the firm's disclosure website at https://rave.credit-suisse.com/disclosures for the definitions of abbreviations typically used in the target price method and risk sections.
See the Companies Mentioned section for full company names
The subject company (TSLA.OQ, 4217.T, BASFn.DE, 005380.KS, FMC.N, 051910.KS, SYR.AX, ALB.N, 006400.KS) currently is, or was during the 12-month period preceding the date of distribution of this report, a client of Credit Suisse.
Credit Suisse provided investment banking services to the subject company (005380.KS, FMC.N, SYR.AX, 006400.KS) within the past 12 months.
Credit Suisse provided non-investment banking services to the subject company (005380.KS) within the past 12 months
Credit Suisse has managed or co-managed a public offering of securities for the subject company (005380.KS) within the past 12 months.
Credit Suisse has received investment banking related compensation from the subject company (005380.KS, FMC.N, SYR.AX, 006400.KS) within the past 12 months
Credit Suisse expects to receive or intends to seek investment banking related compensation from the subject company (TSLA.OQ, 6674.T, 4217.T, 5713.T, BASFn.DE, 005380.KS, UMI.BR, 4005.T, 4208.T, FMC.N, 051910.KS, SQM.N, SYR.AX, ALB.N, 006400.KS) within the next 3 months.
Credit Suisse has received compensation for products and services other than investment banking services from the subject company (005380.KS) within the past 12 months
As of the date of this report, Credit Suisse makes a market in the following subject companies (TSLA.OQ, FMC.N, ALB.N).
As of the end of the preceding month, Credit Suisse beneficially own 1% or more of a class of common equity securities of (BASFn.DE, JMAT.L, 4188.T, 4208.T, FMC.N, SYR.AX).
For other important disclosures concerning companies featured in this report, including price charts, please visit the website at https://rave.credit-suisse.com/disclosures or call +1 (877) 291-2683.
Important Regional Disclosures
Singapore recipients should contact Credit Suisse AG, Singapore Branch for any matters arising from this research report.
23 July 2015
Battery industry 44
The analyst(s) involved in the preparation of this report have not visited the material operations of the subject company (TSLA.OQ, 6674.T, 4217.T, 5713.T, BASFn.DE, 005380.KS, JMAT.L, UMI.BR, 4023.T, 4188.T, 4005.T, 4208.T, FMC.N, 051910.KS, SQM.N, SYR.AX, ALB.N, 006400.KS) within the past 12 months
Restrictions on certain Canadian securities are indicated by the following abbreviations: NVS--Non-Voting shares; RVS--Restricted Voting Shares; SVS--Subordinate Voting Shares.
Individuals receiving this report from a Canadian investment dealer that is not affiliated with Credit Suisse should be advised that this report may not contain regulatory disclosures the non-affiliated Canadian investment dealer would be required to make if this were its own report.
For Credit Suisse Securities (Canada), Inc.'s policies and procedures regarding the dissemination of equity research, please visit https://www.credit-suisse.com/sites/disclaimers-ib/en/canada-research-policy.html.
The following disclosed European company/ies have estimates that comply with IFRS: (BASFn.DE, JMAT.L).
Credit Suisse has acted as lead manager or syndicate member in a public offering of securities for the subject company (BASFn.DE, 005380.KS, SYR.AX) within the past 3 years.
As of the date of this report, Credit Suisse acts as a market maker or liquidity provider in the equities securities that are the subject of this report.
Principal is not guaranteed in the case of equities because equity prices are variable.
Commission is the commission rate or the amount agreed with a customer when setting up an account or at any time after that.
To the extent this is a report authored in whole or in part by a non-U.S. analyst and is made available in the U.S., the following are important disclosures regarding any non-U.S. analyst contributors: The non-U.S. research analysts listed below (if any) are not registered/qualified as research analysts with FINRA. The non-U.S. research analysts listed below may not be associated persons of CSSU and therefore may not be subject to the NASD Rule 2711 and NYSE Rule 472 restrictions on communications with a subject company, public appearances and trading securities held by a research analyst account.
Credit Suisse Securities (Japan) Limited ......................................................................................................................................... Jun Yamaguchi
For Credit Suisse disclosure information on other companies mentioned in this report, please visit the website at https://rave.credit-suisse.com/disclosures or call +1 (877) 291-2683.
23 July 2015
Battery industry 45
References in this report to Credit Suisse include all of the subsidiaries and affiliates of Credit Suisse operating under its investment banking division. For more information on our structure, please use the following link: https://www.credit-suisse.com/who-we-are This report may contain material that is not directed to, or intended for distribution to or use by, any person or entity who is a citizen or resident of or located in any locality, state, country or other jurisdiction where such distribution, publication, availability or use would be contrary to law or regulation or which would subject Credit Suisse AG or its affiliates ("CS") to any registration or licensing requirement within such jurisdiction. All material presented in this report, unless specifically indicated otherwise, is under copyright to CS. None of the material, nor its content, nor any copy of it, may be altered in any way, transmitted to, copied or distributed to any other party, without the prior express written permission of CS. All trademarks, service marks and logos used in this report are trademarks or service marks or registered trademarks or service marks of CS or its affiliates. The information, tools and material presented in this report are provided to you for information purposes only and are not to be used or considered as an offer or the solicitation of an offer to sell or to buy or subscribe for securities or other financial instruments. CS may not have taken any steps to ensure that the securities referred to in this report are suitable for any particular investor. CS will not treat recipients of this report as its customers by virtue of their receiving this report. The investments and services contained or referred to in this report may not be suitable for you and it is recommended that you consult an independent investment advisor if you are in doubt about such investments or investment services. Nothing in this report constitutes investment, legal, accounting or tax advice, or a representation that any investment or strategy is suitable or appropriate to your individual circumstances, or otherwise constitutes a personal recommendation to you. CS does not advise on the tax consequences of investments and you are advised to contact an independent tax adviser. Please note in particular that the bases and levels of taxation may change. Information and opinions presented in this report have been obtained or derived from sources believed by CS to be reliable, but CS makes no representation as to their accuracy or completeness. CS accepts no liability for loss arising from the use of the material presented in this report, except that this exclusion of liability does not apply to the extent that such liability arises under specific statutes or regulations applicable to CS. This report is not to be relied upon in substitution for the exercise of independent judgment. CS may have issued, and may in the future issue, other communications that are inconsistent with, and reach different conclusions from, the information presented in this report. Those communications reflect the different assumptions, views and analytical methods of the analysts who prepared them and CS is under no obligation to ensure that such other communications are brought to the attention of any recipient of this report. Some investments referred to in this report will be offered solely by a single entity and in the case of some investments solely by CS, or an associate of CS or CS may be the only market maker in such investments. Past performance should not be taken as an indication or guarantee of future performance, and no representation or warranty, express or implied, is made regarding future performance. Information, opinions and estimates contained in this report reflect a judgment at its original date of publication by CS and are subject to change without notice. The price, value of and income from any of the securities or financial instruments mentioned in this report can fall as well as rise. The value of securities and financial instruments is subject to exchange rate fluctuation that may have a positive or adverse effect on the price or income of such securities or financial instruments. Investors in securities such as ADR's, the values of which are influenced by currency volatility, effectively assume this risk. Structured securities are complex instruments, typically involve a high degree of risk and are intended for sale only to sophisticated investors who are capable of understanding and assuming the risks involved. The market value of any structured security may be affected by changes in economic, financial and political factors (including, but not limited to, spot and forward interest and exchange rates), time to maturity, market conditions and volatility, and the credit quality of any issuer or reference issuer. Any investor interested in purchasing a structured product should conduct their own investigation and analysis of the product and consult with their own professional advisers as to the risks involved in making such a purchase. Some investments discussed in this report may have a high level of volatility. High volatility investments may experience sudden and large falls in their value causing losses when that investment is realised. Those losses may equal your original investment. Indeed, in the case of some investments the potential losses may exceed the amount of initial investment and, in such circumstances, you may be required to pay more money to support those losses. Income yields from investments may fluctuate and, in consequence, initial capital paid to make the investment may be used as part of that income yield. Some investments may not be readily realisable and it may be difficult to sell or realise those investments, similarly it may prove difficult for you to obtain reliable information about the value, or risks, to which such an investment is exposed. This report may provide the addresses of, or contain hyperlinks to, websites. Except to the extent to which the report refers to website material of CS, CS has not reviewed any such site and takes no responsibility for the content contained therein. Such address or hyperlink (including addresses or hyperlinks to CS's own website material) is provided solely for your convenience and information and the content of any such website does not in any way form part of this document. Accessing such website or following such link through this report or CS's website shall be at your own risk. This report is issued and distributed in Europe (except Switzerland) by Credit Suisse Securities (Europe) Limited, One Cabot Square, London E14 4QJ, England, which is authorised by the Prudential Regulation Authority and regulated by the Financial Conduct Authority and the Prudential Regulation Authority. This report is being distributed in Germany by Credit Suisse Securities (Europe) Limited Niederlassung Frankfurt am Main regulated by the Bundesanstalt fuer Finanzdienstleistungsaufsicht ("BaFin"). This report is being distributed in the United States and Canada by Credit Suisse Securities (USA) LLC; in Switzerland by Credit Suisse AG; in Brazil by Banco de Investimentos Credit Suisse (Brasil) S.A or its affiliates; in Mexico by Banco Credit Suisse (México), S.A. (transactions related to the securities mentioned in this report will only be effected in compliance with applicable regulation); in Japan by Credit Suisse Securities (Japan) Limited, Financial Instruments Firm, Director-General of Kanto Local Finance Bureau (Kinsho) No. 66, a member of Japan Securities Dealers Association, The Financial Futures Association of Japan, Japan Investment Advisers Association, Type II Financial Instruments Firms Association; elsewhere in Asia/ Pacific by whichever of the following is the appropriately authorised entity in the relevant jurisdiction: Credit Suisse (Hong Kong) Limited, Credit Suisse Equities (Australia) Limited, Credit Suisse Securities (Thailand) Limited, regulated by the Office of the Securities and Exchange Commission, Thailand, having registered address at 990 Abdulrahim Place, 27th Floor, Unit 2701, Rama IV Road, Silom, Bangrak, Bangkok 10500, Thailand, Tel. +66 2614 6000, Credit Suisse Securities (Malaysia) Sdn Bhd, Credit Suisse AG, Singapore Branch, Credit Suisse Securities (India) Private Limited (CIN no. U67120MH1996PTC104392) regulated by the Securities and Exchange Board of India (registration Nos. INB230970637; INF230970637; INB010970631; INF010970631), having registered address at 9th Floor, Ceejay House, Dr.A.B. Road, Worli, Mumbai - 18, India, T- +91-22 6777 3777, Credit Suisse Securities (Europe) Limited, Seoul Branch, Credit Suisse AG, Taipei Securities Branch, PT Credit Suisse Securities Indonesia, Credit Suisse Securities (Philippines ) Inc., and elsewhere in the world by the relevant authorised affiliate of the above. Research on Taiwanese securities produced by Credit Suisse AG, Taipei Securities Branch has been prepared by a registered Senior Business Person. Research provided to residents of Malaysia is authorised by the Head of Research for Credit Suisse Securities (Malaysia) Sdn Bhd, to whom they should direct any queries on +603 2723 2020. This report has been prepared and issued for distribution in Singapore to institutional investors, accredited investors and expert investors (each as defined under the Financial Advisers Regulations) only, and is also distributed by Credit Suisse AG, Singapore branch to overseas investors (as defined under the Financial Advisers Regulations). By virtue of your status as an institutional investor, accredited investor, expert investor or overseas investor, Credit Suisse AG, Singapore branch is exempted from complying with certain compliance requirements under the Financial Advisers Act, Chapter 110 of Singapore (the "FAA"), the Financial Advisers Regulations and the relevant Notices and Guidelines issued thereunder, in respect of any financial advisory service which Credit Suisse AG, Singapore branch may provide to you. This information is being distributed by Credit Suisse AG, Dubai Branch, duly licensed and regulated by the Dubai Financial Services Authority (DFSA), and is directed at Professional Clients or Market Counterparties only, as defined by the DFSA. The financial products or financial services to which the information relates will only be made available to a client who meets the regulatory criteria to be a Professional Client or Market Counterparty only, as defined by the DFSA, and is not intended for any other person. This research may not conform to Canadian disclosure requirements. In jurisdictions where CS is not already registered or licensed to trade in securities, transactions will only be effected in accordance with applicable securities legislation, which will vary from jurisdiction to jurisdiction and may require that the trade be made in accordance with applicable exemptions from registration or licensing requirements. Non-U.S. customers wishing to effect a transaction should contact a CS entity in their local jurisdiction unless governing law permits otherwise. U.S. customers wishing to effect a transaction should do so only by contacting a representative at Credit Suisse Securities (USA) LLC in the U.S. Please note that this research was originally prepared and issued by CS for distribution to their market professional and institutional investor customers. Recipients who are not market professional or institutional investor customers of CS should seek the advice of their independent financial advisor prior to taking any investment decision based on this report or for any necessary explanation of its contents. This research may relate to investments or services of a person outside of the UK or to other matters which are not authorised by the Prudential Regulation Authority and regulated by the Financial Conduct Authority and the Prudential Regulation Authority or in respect of which the protections of the Prudential Regulation Authority and Financial Conduct Authority for private customers and/or the UK compensation scheme may not be available, and further details as to where this may be the case are available upon request in respect of this report. CS may provide various services to US municipal entities or obligated persons ("municipalities"), including suggesting individual transactions or trades and entering into such transactions. Any services CS provides to municipalities are not viewed as "advice" within the meaning of Section 975 of the Dodd-Frank Wall Street Reform and Consumer Protection Act. CS is providing any such services and related information solely on an arm's length basis and not as an advisor or fiduciary to the municipality. In connection with the provision of the any such services, there is no agreement, direct or indirect, between any municipality (including the officials, management, employees or agents thereof) and CS for CS to provide advice to the municipality. Municipalities should consult with their financial, accounting and legal advisors regarding any such services provided by CS. In addition, CS is not acting for direct or indirect compensation to solicit the municipality on behalf of an unaffiliated broker, dealer, municipal securities dealer, municipal advisor, or investment adviser for the purpose of obtaining or retaining an engagement by the municipality for or in connection with Municipal Financial Products, the issuance of municipal securities, or of an investment adviser to provide investment advisory services to or on behalf of the municipality. If this report is being distributed by a financial institution other than Credit Suisse AG, or its affiliates, that financial institution is solely responsible for distribution. Clients of that institution should contact that institution to effect a transaction in the securities mentioned in this report or require further information. This report does not constitute investment advice by Credit Suisse to the clients of the distributing financial institution, and neither Credit Suisse AG, its affiliates, and their respective officers, directors and employees accept any liability whatsoever for any direct or consequential loss arising from their use of this report or its content. Principal is not guaranteed. Commission is the commission rate or the amount agreed with a customer when setting up an account or at any time after that.
Investment principal on bonds can be eroded depending on sale price or market price. In addition, there are bonds on which investment principal can be eroded due to changes in redemption amounts. Care is required when investing in such instruments. When you purchase non-listed Japanese fixed income securities (Japanese government bonds, Japanese municipal bonds, Japanese government guaranteed bonds, Japanese corporate bonds) from CS as a seller, you will be requested to pay the purchase price only.