20
Conservation Scores BNFO 602/691 Biological Sequence Analysis Mark Reimers, VIPBG
| Date post: | 25-Dec-2015 |
| Category: |
Documents |
| Upload: | johnathan-henry |
| View: | 217 times |
| Download: | 1 times |
Conservation Scores
BNFO 602/691Biological Sequence Analysis
Mark Reimers, VIPBG

Conservation and Function: what kinds of DNA regions get conserved?
• Core coding regions are usually conserved across hundreds of millions of years (Myr)
• Active sites of enzymes and crucial structural elements of proteins are highly conserved
• Untranslated regions of genes are conserved over tens but not over hundreds of Myr
• Some regulatory regions evolve ‘quickly’ – over a time scale of tens of Myr

Conservation and Function: what kinds of DNA regions get conserved?
• Many splice sites and splice regulators are conserved between mouse and human
• Most promoters (70%) conserved between mouse and human
• Majority (~70%) of enhancers not conserved, but a significant minority are highly conserved
Approaches to Scoring Conservation
• Base-wise: PhyloP, GERP• Small regions: PhastCons• Small regions, tracking bias: SiPhy• Regulatory conservation within exons may be
detected by any of these methods• Key regulatory regions are harder to see

DEMO: UCSC Alignment & Conservation Tracks

Genomic Alignment
• Alignment is crucial (and not trivial)– Common alignment algorithms may misplace
ambiguous bases, leading to artifactual gaps– Inversions are often badly handled
• Issue: incomplete alignments are not reflected in scores of any current algorithm– Conservation scores computed on aligned genomes
only• Alignments of 46 placental mammals to human
genome in MultiZ format at UCSC– Subset of primate alignments also

Alignment Issues
• When studying protein-coding regions, substitutions are most common
• Most genome evolution happens through insertions or deletions– Human chimp alignable genome is 97% identical– Only 91% of genome is alignable
• Regions may acquire regulatory function in some lineages but have no function in most
UCSC Alignment Symbols
• Single line ‘-’: No bases in the aligned species.– May reflect insertion in the human genome or deletion
in the aligning species.• Double line ‘=‘: Aligning species has unalignable
bases in the gap region. – Many mutations or independent indels in between the
aligned blocks in both species.• Pale yellow coloring: Aligning species has Ns in the
gap region.– Sequencing problems in aligning species

Conservation Across Mammals Differs from Conservation Across Primates
• Many regions conserved across mammals are also conserved across primates – a few appear not to be
• Some regions appear to be conserved (insofar as can be measured) in primates but not across all mammals
• What is the diagonal? Are these regions conserved?

How to Assess Conservation?
• If all bases in one position are identical, while others around it vary over all possibilities
• Over what lineage?• How to improve power with modest chance of
variation at any one site?– Look to neighboring sites’ conservation
• How to identify constraint, if not complete identity?
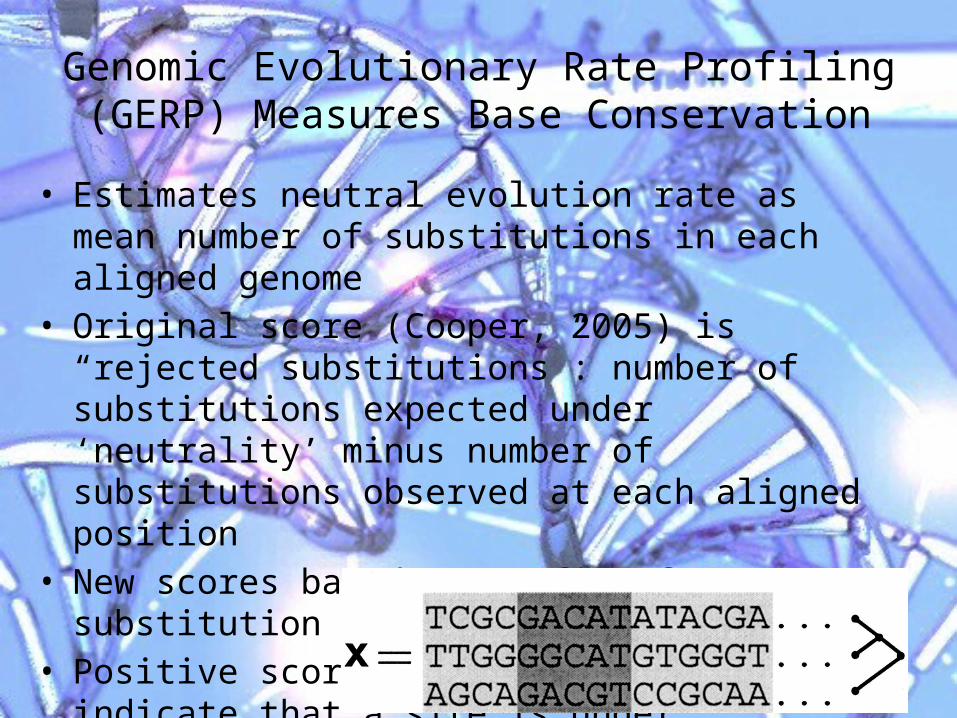
Genomic Evolutionary Rate Profiling(GERP) Measures Base Conservation
• Estimates neutral evolution rate as mean number of substitutions in each aligned genome
• Original score (Cooper, 2005) is “rejected substitutions”: number of substitutions expected under ‘neutrality’ minus number of substitutions observed at each aligned position
• New scores based on ML fit of substitution rate at base• Positive scores (fewer than expected) indicate that a site is
under evolutionary constraint. – Negative scores may be weak evidence of accelerated rates of
evolution
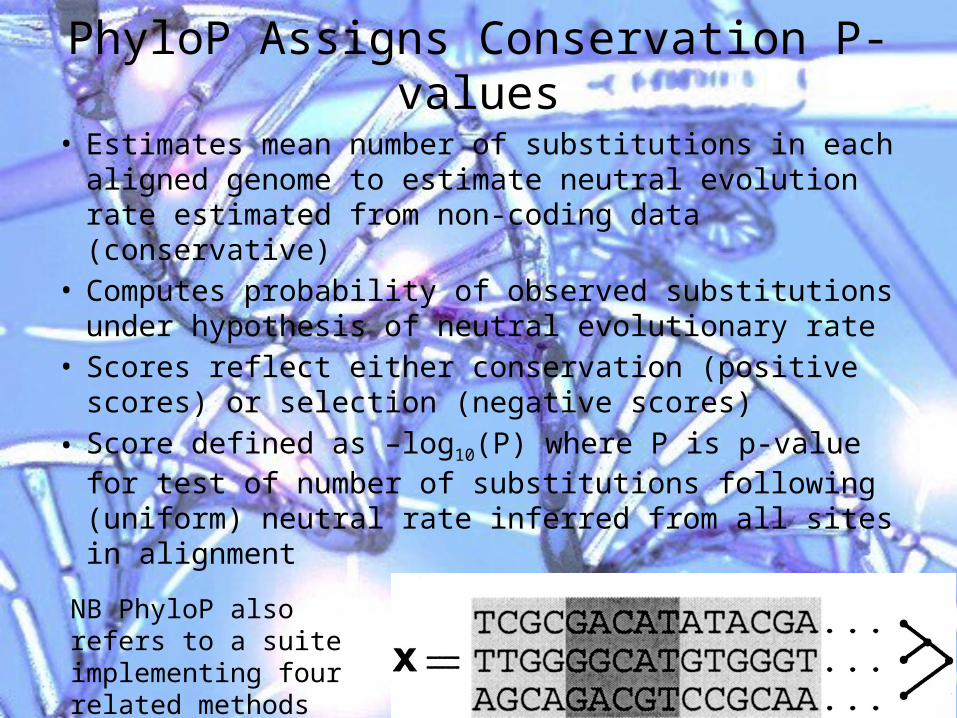
PhyloP Assigns Conservation P-values• Estimates mean number of substitutions in each
aligned genome to estimate neutral evolution rate estimated from non-coding data (conservative)
• Computes probability of observed substitutions under hypothesis of neutral evolutionary rate
• Scores reflect either conservation (positive scores) or selection (negative scores)
• Score defined as –log10(P) where P is p-value for test of number of substitutions following (uniform) neutral rate inferred from all sites in alignment
NB PhyloP also refers to a suite implementing four related methods (Pollard et al, Gen Res 2010)

PhastCons Fits a Hidden Markov Model
• PhastCons fits HMM with states ‘conserved’ and ‘not conserved’
• Neutral substitution rates estimated from data as for PhyloP
• Tunable parameter m represents inverse of expected length of ‘conserved’ regions
• Parameter n sets proportion of conserved regions
Siepel et al. Genome Res. 2005;15:1034-1050

PhastCons Fits a Hidden Markov Model
• Scaling parameter ρ (0 ≤ ρ ≤ 1) represents the average rate of substitution in conserved regions relative to average rate in non-conserved regions and is estimated from data
• Originally developed to detect moderate-sized sequences such as non-coding RNA
• Can be adapted to shorter sequences but not as powerful
• Not designed for disconnected conserved regions –e. g. binding sites for multi-finger TF

SiPhy is Sensitive to Biased Substitution• SiPhy models the pattern of substitutions,
rather than just the rate, as do most others. – Biased substitutions (e.g. conserved lysine: AAA <-> AAG only) will be identified as constrained– Some TFBS have similar degeneracy in evolution– This is a more refined approach than rate models,
but requires a fairly deep (or wide) phylogeny• SiPhy uses a Bayesian approach and needs two
parameters (like PhastCons): – the fraction of sequence conserved– typical length of a conserved region.

Two Versions of SiPhy: w and p
• SiPhy-w estimates a global bias pattern R
• SiPhy-p estimates each bias pattern
• Generally done with short regions (e.g. 12 nt)

SiPhy Applied to Mammalian GenomesIdentification of four NRSF-binding sites in NPAS4.
K Lindblad-Toh et al. Nature (2011)

Comparison of Methods
• PhyloP and GERP give fairly similar results over deep phylogenies (e.g. vertebrates)
• Differ substantially over bushes (e.g. primates)• PhastCons is faster to run than SiPhy• SiPhy is more sensitive over moderately deep
phylogenies (e.g. mammals)– Cannot be implemented for primates because of
insufficient substitutions

Issues With Conservation Scores
• Most scores are misleading about gaps in alignments: they don’t distinguish between contig gaps (incomplete genomes) and inserted or deleted regions– This information is often available, but
inconvenient– Older genomes had many gaps– Modern model organism genomes are fairly
complete– Alignment is still an issue
Issues With Conservation Scores
• Each model was devised with a particular kind of conserved element in mind, and may not be adaptable to all kinds of elements– Short constrained sequences vs. exons– Multi-finger TF binding sites are not done well
• No method tests for constraint over a specific lineage


