56
Considerations regarding modeling of MW-scale IG-SOFC Hybrid Power System Jakub Kupecki

Considerations regarding modeling of MW-scale IG-SOFC Hybrid Power System
Jakub Kupecki
CONSIDERATIONS REGARDING MODELING OF MW-SCALE IG-SOFC HYBRID POWER SYSTEM
Jakub Kupecki
A 30 credit units Master´s thesis
Supervisor:
Robert Braun Colorado School of Mines
A Master’s thesis done at
RES │ the School for Renewable Energy Science
in affiliation with
University of Iceland &
the University of Akureyri
Akureyri, February 2009

Considerations regarding modeling of MW-scale IG-SOFC Hybrid Power System
A 30 credit units Master’s thesis
© Jakub Kupecki, 2009
RES │ the School for Renewable Energy Science
Solborg at Nordurslod
IS600 Akureyri, Iceland
telephone: + 354 464 0100
www.res.is
Printed in 14/05/2009
at Stell Printing in Akureyri, Iceland
iii
ABSTRACT
The main objective of this thesis is to evaluate various modeling approaches for large
systems employing high temperature fuel cell (particularly SOFC) modeling. It also
includes a brief discussion of current trends and various designs. This thesis will review
recently published papers investigating the hundred MWe scale SOFC hybrid Brayton-
Rankine power systems. It goes into details discussing the crucial parameters influencing
the cycle‟s operation and performance. For better understanding, the basics of the fuel cell
operation, involved processes and all phenonena are provided in Chapter 2.
In the next chapter the SOFC based systems with integrated gasification reactors are
widely described. Current state-of-the-art trends and their background are presented. Finaly
the desired system configuration is proposed and investigated.
These particular arragements correspond to the U.S. Department of Energy (DoE) baseline
for systems employing high temperature fuel cells, hence certain design solutions are
involved. The SOFC stack feedstock is provided by the gasification of coal, however
different fuel can also be gasified (biomass for example).
In the last chapter, the modeling and optimisation in the software are extensively
described. Because of the fact that ASPEN Plus and Hysys are comonly used in the
majority of cases when cycles involing high temperature fuel cells are analyzed, the
attention will be focused on these two programs. Both of them have built-in tools allowing
the modeling of heat exchangers, compressors and expanders (i.e. gas and steam turbines)
by available units. ASPEN Plus is Fortran based software and the SOFC stack can be
modeled as a user unit using this programming code. The modeling approach to the
electrochemical and chemical processes within the SOFC stack will be delivered, since it is
important for the modeling of the entire power cycle. Analysis of the whole system with
the proposed tools allows the determination of the overall system thermal efficiency with
high fidelity, thus the biggest effort must be made to correctly determine all input
parameters and define the proper assumptions as well as simplifications. The final
discussion emphasises the most crucial parameters.
The proposed system represents a clean energy source, which substantialy reduces the
polutants flow associated with the power generation. Desulphurisation and gases clean-up
processes are also involved in the cycle, therefore it meets all environmental requirements.

iv
PREFACE
In the 21st century our civilization is running out of cheap, easily extractable energy
carriers. The current pollutant levels in the atmosphere are extremely high and the real
threat of unexpected environmental changes in next decades has emerged.
Among other ways to change the situation in the coming decades, increasing the efficiency
of power generating units and diminishing the environmental burdens associated with
power generation, especially when talking about large scale systems (hundreds of MWe),
is being considered.
Solutions proposed in this thesis take advantage of the advent of new technologies.
Basically the idea is based on substituting coal firing in a furnace with coal gasification.
The produced synthesis gas is then directed to the solid oxide fuel cell stack operating at
high temperatures in a range from 600 oC to 1000
oC. Such a system is carbon capture and
sequestration (CCS) ready, and allows for clean-up processes for the removal of sulphur
and other pollutants. Membrane reactors (MR) will be employed as the most convenient
concept to separate the CO2 stream for compression and sequestration.
SOFC hybrid systems have large potential to exceed conventional power generating
systems‟ efficiency. With high operating temperature, atmospheric pressure, and hydrogen
at the anode and oxygen at the cathode site, the efficiency of the cell alone is at least 50%.
Pressurizing the cell and employing the other components (i.e. turbines, recuperating heat
exchangers) into the system leads to a significant efficiency increase.
The thesis work was done at the Colorado School of Mines Fuel Cell Center as a part of
the U.S. Department of Energy (DoE) project focused on large scale high temperature fuel
cell based systems employing the gasification process (i.e. integrated gasification reactor)
to generate syngas for the fuel cell stack feed.

v
TABLE OF CONTENTS
1 INTRODUCTION 9
2 BACKGROUND 10
2.1 Fuel cells 10
2.1.1 Thermodynamics of fuel cells 10
2.1.2 Temperature and composition variations during fuel cell operation 12
2.1.3 Fuel Cell efficiency 13
2.1.4 Performance of a fuel cell 13
2.1.5 Solid oxide fuel cell (SOFC) 16
2.2 System 17
2.2.1 SOFC based system 17
2.2.2 Thermodynamic cycles 17
2.3 Selected hybrid system configurations 19
2.3.1 Pressurized SOFC based system 19
2.3.2 Multi-stage SOFC based system 21
2.3.3 Fuel processing in SOFC based systems 22
2.3.4 Feed gas constituents 23
3 MODELING 24
3.1 Solid oxide fuel cell modeling 24
3.1.1 Modeling of processes within the fuel cell 25
3.2 System modeling 24
3.2.1 SOFC hybrid systems modeling 26
4 THE INTEGRATED GASIFICATION SOFC SYSTEM 27
4.1 Membrane reactors for CO2 sequestration 27

vi
4.2 Simultaneous reactions within the SOFC 31
5 MODELING OF COMPONENTS 34
5.1 ASPEN Plus and Hysys 35
5.2 Gibbs reactors 38
5.3 Heat exchangers 39
5.4 Gas and steam turbine 41
5.5 Coolers 43
5.6 Compressors 44
5.7 Pumps 45
6 CONCLUSIONS 46
REFERENCES 50

vii
LIST OF FIGURES
Figure 2.1 Net fuel cell performance (or j-V curve) 14
Figure 2.2 Activation (or recation) loss 14
Figure 2.3 Ohmic loss 15
Figure 2.4 Concentration loss 15
Figure 2.5 Reversible cell voltage 15
Figure 2.6 Microscopic photograph of the electrolyte supported cell (ESC)
presenting high anode and cathode porosity 16
Figure 2.7 Thermodynamics of Brayton and Rankine cycles 17
Figure 2.8 Pressure ratio influence on the Nernst voltage 20
Figure 2.9 Pressurized SOFC Siemens-Westinghouse sustem (4,5 MW) 21
Figure 2.10 Multi-stage Solid State Power Plant System – 4 MW class 22
Figure 2.11 500 MW pressurized multi-stage SOFC power plant 22
Figure 4.1 Pre-fuel cell CO2 capture concept 28
Figure 4.2 Post-fuel cell CO2 capture concept 28
Figure 4.3 SOFC-GT with post-fuel cell hydrogen oxidation 29
Figure 4.4 SOFC-GT with OCM-afterburner proposed by Shell 29
Figure 4.5 WGSMR-afterburner operation principle 29
Figure 4.6 Hybrid cycle employing WGSMR-afterburner 30
Figure 4.7 Principle of the SOFC operation 33
Figure 5.1 ASPEN Plus and Hysys start up windows 35
Figure 5.2 ASPEN Plus units toolbar 36
Figure 5.3 Part of the ASPEN Plus side menu 36
Figure 5.2.1 Comparison of the unit specification in Hysys and ASPEN Plus 39
Figure 5.3.1 Baseline IGFC System configuration by U.S. DoE NETL 39
Figure 5.3.2 Heat exchanger specification window in Hysys and ASPEN Plus 40
Figure 5.4.1 Gas turbine specification window in Hysys and ASPEN Plus 42
Figure 5.4.2 Steam turbine specification window in Hysys and ASPEN Plus 43
Figure 5.5.1 Cooler specification window in Hysys and ASPEN Plus 44
Figure 5.6.1 Compressor specification window in Hysys and ASPEN Plus 44
Figure 5.7.1 Pump specification window in Hysys and ASPEN Plus 46

viii
LIST OF TABLES
Table 2-1 Advantages of gas, steam and combined gas and steam cycles 18
Table 2-2 Disadvantages of gas, steam and combined gas and steam cycles 19
Table 5-1 Comparison of selected units‟ icons in Hysys and ASPEN Plus 37

9
1 INTRODUCTION
Fuel cells are expected to be one of the most promising power sources for the future in
various applications ranging from small-mobile energy supply systems for laptop
computers, mobile phones, marine and army devices, to vehicle applications, and finally
power generating units in size of hundreds of MWe due to the ultra low emissions of
environmentally harmful gases.
Among other types, high temperature fuel cells such as the solid oxide (SOFC) and the
molten carbonate (MCFC) are considered extremely suitable for electric power plants and
combined heat and power applications. Solid oxide fuel cells are particularly interesting
due to the high operating temperature, allowing the employment of waste heat for various
purposes.
Combining high temperature fuel cells with the Brayton and/or the Rankine cycles in
different designs, allows increasing the overall system efficiency substantially. Various
authors claim the efficiency of such systems to be from over 40% (first-law HHV based)
up to even 75,5% depending on the design [1,3,4,5]. It must be emphasized here that there
are different types of system efficiencies used in the literature (i.e. first-law HHV or LHV
based, second-law, thermal and electrical), thus results must be normalized to provide a
reliable outlook.
The first theoretical studies on high temperature fuel cells combined with a gas turbine
were conducted in the early 1990‟s [1]. During the last decade many articles focused on
such systems have been published. In every case, the proposed system design depends on
the scale. For stationary or small vehicle applications (multi-kW scale), the system is
expected to be simple, cheap and its efficiency, as well as emissions, are not so crucial
contpared to the large scale units. For the centralized electricity generation in units of tens
or hundreds of MWe, the emphasis is placed on efficiency, fuel costs and the
environmental burdens associated with power generation.
SOFC with integrated gasification is believed to be less polluting compared to the same
scale unit directly firing the same type of fuel [2].
Design of a pressurized hybrid system meets all essential requirements for power
generating units:
limited emissions;
carbon capture and sequestration (CCS) ready system allowing for separation of
fairly pure CO2 stream;
high efficiency, low fuel consumption;
compact design.
Costs and reliability of the proposed systems are the bottleneck of any analysis due to the
fact that there are only a few units in operation and many concerns arise, thus those issues
will not be covered in this thesis. Further information about the cost-benefit analysis can be
found in the literature [6], including complex system costs modeling [7]. Usually the
optimal power is expected to occur at the minimum electricity cost [8,9].
10
2 BACKGROUND
2.1 Fuel cells
A fuel cell is an electrochemical conversion device. Its production of electricity is based on
an electrochemical reaction within the cell. To understand the physics of the fuel cell it is
essential to look at the design, components and processes.
A fuel cell consists of three layers:
anode - porous electrode on which the oxidation reaction occurs;
cathode - porous electrode on which the reduction reaction occurs;
electrolyte - ionic conductive but not electrically conductive dense material
separating anode and cathode gases.
A fuel cell works with the presence of a catalyst. Electrons and protons of the reactant fuel
are separated and forced to travel through a circuit, generating electrical power. A fuel cell
can operate continuously as long as necessary flows are maintained and the reactant is
consumed, which must be replenished.
The governing reaction, both for burning fuel in a combustion engine and a fuel cell, is:
H2 + ½ O2 ↔ H2O (1)
In a fuel cell two electrochemical half reactions occur at the anode (2) and the cathode (3)
site. In the case of SOFC the half reactions are the following:
2H2 + 2O2-
↔ 2H2O +4e-
(2)
O2 + 4e- ↔ 2O
2- (3)
Separation of these reactions allows for the electron transfer from the fuel through an
external circuit before completing the reaction. The mentioned separation is done by
placing the electrolyte which is, as was said earlier, a charged atoms conductor but does
not allow for electron flow-through.
NOTE: General reaction (1) applies for each type of fuel cell but the half reactions differ.
2.1.1 Thermodynamics of fuel cell
To understand the operation of fuel cells it is important to investigate the crucial
parameters and relations between them. The following section provides general
information about the thermodynamics of fuel cells and the possibilities of employing them
to generate electricity and heat in a power system.
The most important parameters during FC operation are change of the enthalpy, and
change of the Gibbs free energy (∆H and ∆G respectively).
The enthalpy of any reaction can be written in the general form (4):
where:
hf denotes the enthalpy of formation,
is the stoichiometric coefficient for each component,

11
subscripts PROD and REACT correspond to the reaction‟s products and reactants.
For a hydrogen/oxygen fuel cell, the reaction can be written:
(5)
where 0 corresponds to the standard temperature and pressure (STP: 1 bar and 298,15K).
STP values of the enthalpy of formation can be found in tables:
= –285,83 [kJ/mole]; = 0; = 0, so taking this data into account it is
obvious that = –285,83 [kJ/mole] (HHV) and –241,83
[kJ/mol] (LHV).
To determine the work potential of a reaction, the Gibbs free energy calculation is needed.
It can be performed using the two methods presented below.
Method 1. Explicit calculation using data available in tables:
=
–306,69 – (–38,96 + (–61,12)) = –237,17 [kJ/mole]
Method 2. Using Van‟t Hoff formula:
(eq. 6) which employs entropy calculation using once again proper data
from tables:
[kJ/mole]
Placing the calculated value of in equation (6) finally value is obtained:
kJ/mole K kJ/mole/K = 237,20 kJ/mole, which
is almost equal to the one obtained using method 1.
After these simple calculations, cell voltage can be determined. The change of the Gibbs
free energy for an ideal FC is equal to the work potential of a fuel: , where
the electrical work corresponds to moving the charge Q through the potential difference E
(given in volts, which is also an ideal thermodynamic cell voltage):
(7)
Knowing that the charge is equal to the number of moles of electrons times the Faraday‟s
constant (assumed to be equal 96 500 C/mole):
Both equations can be merged together in the form:
nFE or (8)
Eq. 8 allows calculating the ideal H2/O2 fuel cell voltage:

12
, which is a thermodynamics limit, and the maximum
voltage for STP for the H2/O2 fuel cell.
2.1.2 Temperature and composition variations during fuel cell operation
Due to the fact that fuel cells rarely operate at the STP, the cell voltage should be adjusted
to the change in a temperature, as well as in the composition. The following section will
briefly discuss the approach for both issues.
Recalled Van‟t Hoff eq. 6 will be used to derive an equation for a new voltage at the new
temperature.
Assume that change of enthalpy is temperature independent:
(9)
Taking into account that , equation (9) can be rewritten:
After the sequence of mathematical transformations, and finally integration, the equation
for the new temperature is obtained:
(10)
Analysis of this equation leads to the conclusion that the lower the temperature the better
the performance. Theoretically this statement is correct, but there are also kinetics and
friction problems at lower temperatures which must be taken into account in the dynamic
analysis.
To include the composition influence on the Gibbs free energy calculations, the following
formula was proposed and is commonly used [10]:
(11)
where:
is the chemical potential that allows taking into account composition variations.
Employing species activity and the ideal gas law in eq. 11 leads to the form called the
Nernst equation:
(12)
Combining equations (10), (11) and (12) leads to the most comprehensive form of equation
for the fuel cell voltage adjusted to the temperature and pressure (composition effects)
change:
(13)

13
2.1.3 Fuel Cell efficiency
The efficiency of a fuel cell is defined as a useful energy divided by the total energy; in
other words the work provided by the cell divided by the energy provided by the fuel,
which is equal to the Gibbs free energy over the enthalpy.
(14)
Using and values from the paragraph 1.1.2 and eq. (14) it can be easily calculated
that the thermal efficiency of the ideal H2/O2 fuel cell at STP is 83%.
It is also important to emphasize that fuel cells are not limited by the Carnot efficiency
( ). Generally those devices have higher efficiency compared to Carnot
engines, besides very high temperatures levels (starting from about 900 0C), in which
Carnot efficiency is higher.
Of course in the real world there are losses, hence the real fuel cell efficiency is lower than
the ideal one. Generally two types are distinguished: voltage and fuel (associated with fuel
utilization) losses.
When a cell operates at a constant flow rate, a lot of fuel is wasted, which is why operation
at constant stoichiometry is always favoured. In the fuel cell operation there are defined
two stoichiometric ratios with values in the certain ranges:
Fuel stoichiometric coefficient:
Air stoichiometric coefficient: 1
Taking into account all listed issues, the overall efficiency of the real fuel cell can be
written in the comprehensive form:
where:
V is the measured cell voltage and E is the voltage calculated using eq.(13).
NOTE: in literature, fuel utilization (FU) is oftenly used instead of FU is defined as
2.1.4 Performance of a fuel cell
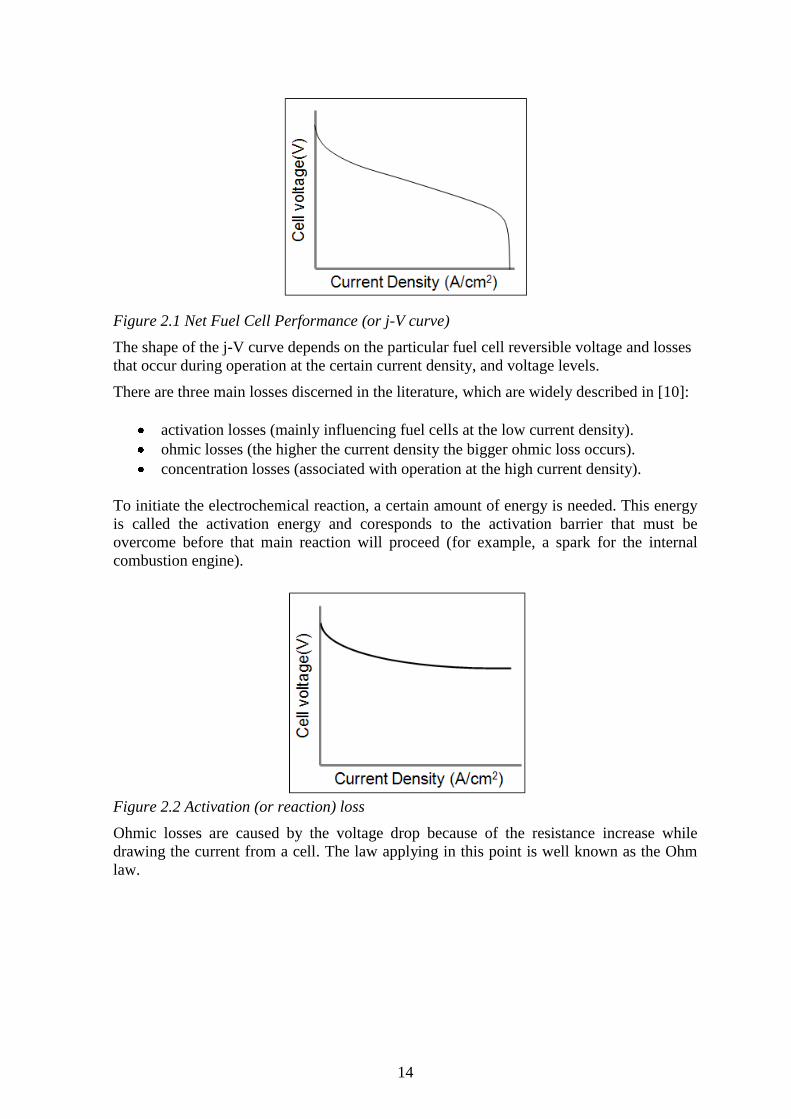
Fuel cell power output depends on the operating current and voltage. For each type of fuel
cell, the characteristic is given by j-V curves presenting the cell performance in terms of
voltage vs. current, or more often the current density. An example of such a curve is
presented in Fig. 2.1.
1 In the literature, various values of air and fuel stoichiometric coefficients can be found. Both can vary
significantly, for a certain design even 0,3 is used [11].
14
Figure 2.1 Net Fuel Cell Performance (or j-V curve)
The shape of the j-V curve depends on the particular fuel cell reversible voltage and losses
that occur during operation at the certain current density, and voltage levels.
There are three main losses discerned in the literature, which are widely described in [10]:
activation losses (mainly influencing fuel cells at the low current density).
ohmic losses (the higher the current density the bigger ohmic loss occurs).
concentration losses (associated with operation at the high current density).
To initiate the electrochemical reaction, a certain amount of energy is needed. This energy
is called the activation energy and coresponds to the activation barrier that must be
overcome before that main reaction will proceed (for example, a spark for the internal
combustion engine).
Figure 2.2 Activation (or reaction) loss
Ohmic losses are caused by the voltage drop because of the resistance increase while
drawing the current from a cell. The law applying in this point is well known as the Ohm
law.

15
Figure 2.3 Ohmic loss
Concentration losses can be explained by the fact that reactants are being depleted and this
leads to the limitation of the current density.
Figure 2.4 Concentration loss
Figure 2.5 Reversible cell voltage
Putting all these losses together graphically (Fig. 2.2, 2.3 and 2.4) and substracting them
from the reversible cell voltage (Fig. 2.5), as proposed by O‟Hayre et al. [10], vividly
presents how the reversible cell voltage drops because of the different losses. By this
means the j-V curve of a fuel cell is obtained (Fig. 2.1).
A more detailed discussion on the fuel cell losses can be found in the literature [4,12,13].

16
2.1.5 Solid oxide fuel cell (SOFC)
Solid oxide fuel cells employ a thin ceramic membrane as an electrolyte. Oxygen ions
( ) are the ionic charge carriers in the SOFC membrane. As mentioned in section 1.1.1,
each fuel cell is described by a set of different half reactions. For this particular fuel cell
type, the reactions are as follows:
SOFC represents the group of so called high temperature fuel cells. Its operating
temperature is above 600 0C and can go even higher, up to 1000
0C depending on the
design. Such a high temperature range is determined by the electrolyte type, which is
mostly yttria stabilized zirkonia (YSZ) or gadolinium doped ceria (GDC), and allows the
kinetics of oxygen ion transport to be sufficient for a good cell performance.
The most significant advantages of solid oxide fuel cells are the high efficiency, long term
stability, low emissions and fuel flexibility. Because of the high operating temperature
SOFCs have a long start-up time, which limits their applications for all systems requiring
dynamic load changes.
On the other hand, the high operating temperature of this fuel cell type opens a path for
stationary applications and implementation of hybrid systems based on a SOFC, allowing
the utilization of high temperature waste heat.
As in other types of fuel cells, SOFC consist of the three layers with specific requirements:
Anode – porous electron conducting ceramic layer. The common material used is
cermet made up of nickel or cobalt, and mixed with ceramic material of the same
type as that used for the electrolyte (Ni-YSZ or Co-YSZ respectively).
Electrolyte – dense oxygen conducting ceramic. As mentioned earlier, YSZ
(especially the 8% form: Y8SZ) or GDC are the most popular materials.
Cathode – must be electronically conductive and because of its compatibility with
electrolytes materials (i.e. doped zirconia electrolytes), commercially the
lanthanum strontium manganite (LSM) is used.
Microscopic photographs of the anode, the electrolyte, and the cathode material are
presented in the Fig. 2.6.
Figure 2.6 Microscopic photographs of the electrolyte supported cell (ESC) presenting
high anode and cathode porosity [14]

17
2.2 System
2.2.1 SOFC based system
The general idea of a system with a SOFCs is based on the fact that these fuel cells are
operating at high temperature and the waste heat can be used for gas and then for the
bottoming steam cycle. Fuel cell stack outlet gases can also be fired in a combustor
(commonly called afterburner or tail-gas burner) and then can run the gas turbine. Various
system designs have been investigated in recent years.
Configuration of a system mainly depends on its size. If the cycle is a large scale (tens or
hundreds MWe) then the efficiency, fuel consumption and operation parameters are
crucial. This thesis is mainly focused on large scale stationary units, thus only such
systems will be investigated. Small scale auxiliary and stationary systems based on the
SOFC are discussed in the literature [15,16,17].
2.2.2 Thermodynamic cycles
To take advantage of the fuel cell operating parameters, gas and/or steam cycles should be
employed. Generally saying there are three possibilities (or configurations) considered for
the SOFC based system:
Brayton (gas) regenerative cycle;
Rankine (steam) cycle;
combined Brayton-Rankine cycle.
To understand differences between both cycles and the advantage of combining them
together it is important to see their thermodynamics and what orders or parameters
characterize them. Such a comparison can be done easily using temperature-entropy (T-s)
plots.
Figure 2.7 Thermodynamics Brayton and Rankine cycles
However, Fig. 2.7 does not have scale, theoretically the Brayton cycle operates at higher
temperatures. It is reflected in the turbine inlet temperature (TIT), i.e. the gas turbine
always has higher TIT than the steam turbine. In the Rankine cycle the evaporation,
superheating, expansion in the turbine, and condensation take place.
When going into details, it can be observed that the Brayton cycle heat rejection takes
place between points 6-7 in the plot. For the Rankine cycle, heat is delivered between
points II and V (where III to IV is just evaporation). Employing both cycles in one system
18
allows taking the advantage of the high heat rejection temperature of the gas cycle, and the
high heat delivery temperature for the steam cycle.
The described idea leads to an increase of the overall system efficiency but on the other
hand the complexity is also higher (i.e. more components involved, bigger system,
reliability changes). Each cycle has a number of advantages, and some disadvantages while
being used in a hybrid system with the high temperature fuel cell. All pros and cons [2] are
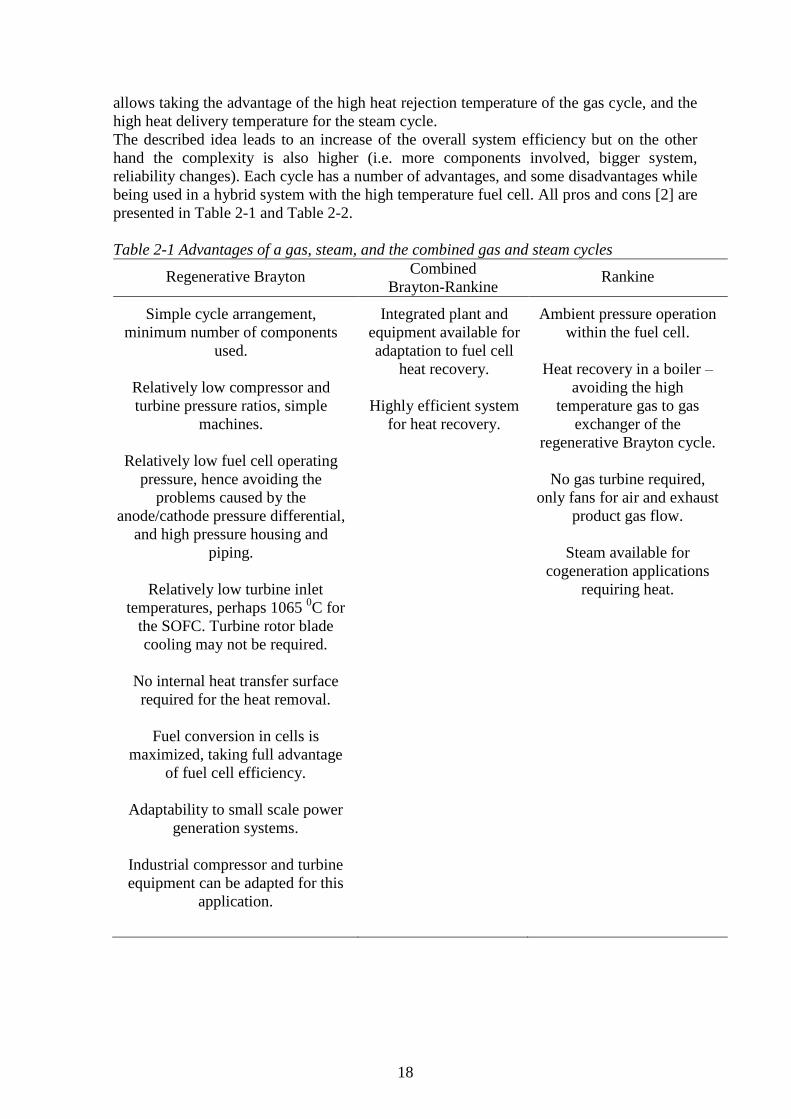
presented in Table 2-1 and Table 2-2.
Table 2-1 Advantages of a gas, steam, and the combined gas and steam cycles
Regenerative Brayton Combined
Brayton-Rankine Rankine
Simple cycle arrangement,
minimum number of components
used.
Relatively low compressor and
turbine pressure ratios, simple
machines.
Relatively low fuel cell operating
pressure, hence avoiding the
problems caused by the
anode/cathode pressure differential,
and high pressure housing and
piping.
Relatively low turbine inlet
temperatures, perhaps 1065 0C for
the SOFC. Turbine rotor blade
cooling may not be required.
No internal heat transfer surface
required for the heat removal.
Fuel conversion in cells is
maximized, taking full advantage
of fuel cell efficiency.
Adaptability to small scale power
generation systems.
Industrial compressor and turbine
equipment can be adapted for this
application.
Integrated plant and
equipment available for
adaptation to fuel cell
heat recovery.
Highly efficient system
for heat recovery.
Ambient pressure operation
within the fuel cell.
Heat recovery in a boiler –
avoiding the high
temperature gas to gas
exchanger of the
regenerative Brayton cycle.
No gas turbine required,
only fans for air and exhaust
product gas flow.
Steam available for
cogeneration applications
requiring heat.

19
Table 2-2 Disadvantages of a gas, steam, and the combined gas and steam cycles
Regenerative Brayton Combined
Brayton-Rankine Rankine
Tailoring of a compressor and
the turbine equipment to the
fuel cell temperature and
cycle operating pressure.
Large gas to gas exchanger
for high temperature heat
recuperation required.
Efficiency and work output of
the cycle sensitive to the cell,
compressor and turbine
efficiencies; pressure losses;
and temperature differentials.
Complex, multi-component,
large scale system for heat
recovery.
Adaptation of existing gas
turbine required to provide
for air take off and return of
the hot depleted air and
partially burned fuel.
High pressure operation of
the bulky fuel cell system
required.
Precise balancing of anode
and the cathode pressures
required to prevent rupture of
the fuel cell electrolyte.
Indirect heat removal
required from the fuel cell
stack with compressed air,
initially at low temperature to
enable significant conversion
of the fuel flow in the cells.
Inherently lower efficiency,
compared to the
regenerative Brayton and the
combined Brayton-Rankine
cycles.
Requirement for cooling and
feed water.
Higher complexity than the
regenerative Brayton cycle
arrangement.
2.3 Selected configurations of hybrid system
In the last decade different SOFC based hybrid systems were investigated. Transition from
the academia analyses into real product manufacturing has begun. Currently many teams
all over the world work on different scale systems employing high temperature fuel cells
(especially SOFCs), and many manufacturers are introducing more and more developed
and varied system configurations.
In the field of hybrid stationary systems design, many different approaches and system
configurations can be found. In this section a few of the most significant will be briefly
described with an examination of the major benefits corresponding to each particular
arrangement. In the last sub-chapter fuel processing will be discussed.
2.3.1 Pressurized SOFC
In the pressurized system the fuel cell is located between the compressor and the expander
of the turbine part. Because of the stack‟s location, the air pressure is raised prior to
supplying it to the cathode compartments. Pressurized systems offer more potential for

20
increased efficiency and possibly reduced costs [19]. Because of efficiency increase and
cost reduction mentioned, this cycle will be extensively described in the forthcoming
analysis.
The main advantages of pressurizing the system are associated with the Nernst voltage
change, improvement in the thermodynamic performance, transport of reactants, kinetics
of reactants and others. Unfortunately, pressurization may cause material problems, since
the high pressure between the anode and cathode sides leads to a certain influence on the
electrolyte. This is the main reason for setting the highest pressure suggested for the SOFC
stack at 15 bars.
After having eq. (13) recalled it can be easily deduced that the increase of pressure leads to
the increase in cell voltage. The pressure‟s effect is logarithmic according to the square
root of pressure. By repeated calculations of the Nernst voltage for different pressure
ratios, the curve presented in Fig. 2.8 was obtained. It is obvious that for the higher PRs,
the Nernst voltage increases.
Figure 2.8 Pressure ratio influence on the Nernst voltage
The main benefits of pressurizing the fuel cell stack are:
the increase of pressure leads to a cell voltage increase [2,19];
such a system is ready for gaseous fuel clean-up processes with CCS [18];
system employs a turbine for additional electricity generation.
There are of course some disadvantages of pressurizing the system. The main disadvatage
is the potential for faster cell degradation. There is also a need to increase the thickness of
the pressurized vessels, which leads to an increase in capital costs.
In the literature, different pressurized system designs were suggested as a pathway to an
overall efficiency increase. For instance Bove and Ubertini [20] suggested a system
schematic involving an intercooled (within the recuperator) turbine with supplementary
fuel added for the turbine combustor. A pressurized system without intercooling, but with
additional fuel delivered to the turbine combustor, was also proposed by Milewski and
Miller [21] for 300kWe unit fueled by natural gas. For a comparison, in Fig. 2.9 an
example of a pressurized two-stage cycle is presented. With such a design, heat
0,86
0,88
0,90
0,92
0,94
0,96
0,98
1,00
0 10 20 30 40 50
Ner
nst
volt
age
[V]
Pressure ratio (PR)

21
recuperation and fuel preheating take place in a pressurized heat exchanger. Exhaust gases
exiting the pressurized SOFC are directed to the low pressure SOFC stack. At the same
time, this is an example of a pressurized and multi-stage fuel cell stack. A moderate
combustor design temperature of 860 0C leads to NOx levels of less than 4 ppmv to be
expected in this particular design [2].
Figure 2.9 Pressurized SOFC Siemens-Westinghouse system (4,5MW)
2.3.2 Multi-stage SOFC cycle
The idea of networking (or cascading) fuel cell stacks enables the overall fuel utilization
(FU) to be over 90-95%.
The current state-of-the-art SOFC fuel utilization is about 85%. For two cascaded fuel cells
operating with utilization of 85% the overall value will be 1-(1-0,85)2 = 0,98 = 98[%]. For
FCs, higher fuel utilization leads to performance improvement; but on the other hand it
must be emphasized that for the whole system, high fuel utilization means less fuel exiting
the SOFC stacks, and because of that the TIT is also lower. In this case the system with
very high fuel utilization will need additional fuel delivery to the combustor before the fuel
cell‟s exhaust gases can be directed to the gas turbine. A cost-benefit analysis should be
performed to determine which factors are the most important in terms of the overall
system´s initial and operation costs.
The main advantages of multi-staged fuel cells are:
no heat exchangers between FC modules;
lower complexity;
cheaper system;
higher efficiency of FC modules.
In Fig. 2.10 an example of multi-stage MWe scale system is presented.
22
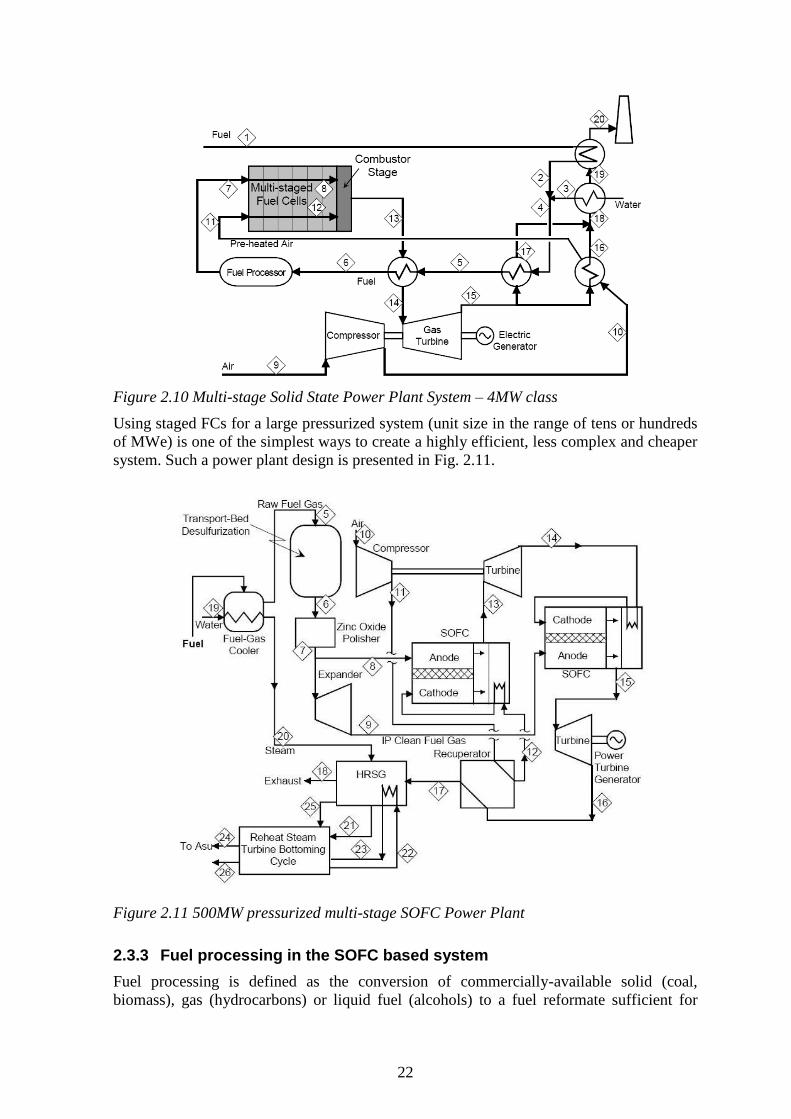
Figure 2.10 Multi-stage Solid State Power Plant System – 4MW class
Using staged FCs for a large pressurized system (unit size in the range of tens or hundreds
of MWe) is one of the simplest ways to create a highly efficient, less complex and cheaper
system. Such a power plant design is presented in Fig. 2.11.
Figure 2.11 500MW pressurized multi-stage SOFC Power Plant
2.3.3 Fuel processing in the SOFC based system
Fuel processing is defined as the conversion of commercially-available solid (coal,
biomass), gas (hydrocarbons) or liquid fuel (alcohols) to a fuel reformate sufficient for
23
serving the fuel cell anode reactions. Fuel processing includes the removal of harmful
contaminants, such as sulphur, from the raw fuel, the generation of a hydrogen-rich gas
stream and heating (or cooling) the reformate to the prescribed inlet temperature of the fuel
cell stack.
Sulphur-bound fuels include gasoline, coal-gas, heating oil, and even natural gas. However
in the last one, sulphur is not indigenous to the fuel mixture but is added as an odorant to
help with detecting leaks. In general, sulphur is poisonous to all fuel cells‟ electrocatalytic
sites and must be removed from the fuel feedstock before it is admitted to the fuel cell. It
must be emphasized that different fuel cells have different sulphur tolerance levels, above
which substantial electrode performance degradation is realized. Different allowable
sulphur concentrations for the SOFC can be found in the literature, ranging from 1-10
ppmv for nickel-ceria anode [22] to even 450 ppmv for the copper-ceria anode operating at
1073K [23], which are actually not in the scope of this paper but present unique parameters
to operate with feed gases having significant sulphur content.
SOFC based systems differ from the conventional power generating systems in a single
distinctive way: their operation requires a relatively pure hydrogen fuel supply. Fuel cell
systems typically generate hydrogen from an alcohol- or hydrocarbon-based fuel source.
The only one of the few processes generating hydrogen that does not rely on a fossil fuel
source is the electrolysis of water. However this process is highly energy intensive, and is
envisioned primarily for fuel cell systems incorporating solar photovoltaics.
Alcohols (i.e. methanol or ethanol) and hydrocarbons (such as natural gas) are usually
reformed into the hydrogen-rich synthesis gas (or syngas) by several methods:
catalytic steam reforming (CSR);
partial oxidation (POX);
autothermal reforming (ATR).
The raw fuel can be converted and reformed either externally in a reactor or internally in
the SOFC anode compartments.
Most concepts for stationary applications with external fuel reforming favour CSR for
hydrogen generation from alcohols as well as from light hydrocarbons. The process yields
the highest amount of hydrogen, which results in the highest system efficiency.
Partial oxidation has a fast start-up time and rapid dynamic response, but has lower fuel
conversion efficiency, therefore it is not consider for large scale power systems.
Autothermal reforming is a CSR and POX processes combination. The major difference
between all three conversion technologies listed above is the mechanism of providing the
thermal energy required for the endothermic reforming reactions [24].
2.3.4 Feed gas constituents
As was mentioned in section 2.3.5, SOFC syngas has different composition depending on
the fuel from which it was obtained. Some of the feed gas constituents may have a negative
impact on the cell performance, eventually leading to permanent performance degradation.
Some of them might have minor or even neutral influence.

24
Coal syngas typically contains major species: CO, H2, CO2, CH4, N2 and H2S as well as
trace impurities2: Arsine (AsH3), Thiophene (C4H4S), Chlorine (Cl), Methyl Fluoride
(CH3F), Methyl Chloride (CH3Cl), Hydrogen Chloride (HCl), Fe(CO)5, Ni(CO)5,
CH3SCN, Phosphene (PH3), Antimony (Sb), Cadmium (Cd), Chromium (Cr), Mercury
(Hg), Selenium (Se), Vanadium (V), Lean (Pd) and Zinc (Zn).
Besides the sulphur discussed in 2.3.3, other components (especially poisonous traces) are
often neglected in the analysis because of their slight influence on the performance and
life-time. Studies undertaken by Cayan et al. [25] investigate in detail the effects of coal
syngas impurities on the SOFC operation.
3 MODELING
In order to investigate the overall system performance, study certain parameters, and
determine the system efficiency, modeling is being employed. In recent years many
different studies focused on hybrid SOFC systems modeling and optimization have been
undertaken. Various approaches can be found in the literature ranging from simplified
semi-empirical equations [31], models taking into account the geometry of the system‟s
physical components, models analyzing media transport processes [32-35], micro- and
macro-scale models [36] to even detailed 3-D CFD models describing the stack
performance and its influence on the entire system [37,38].
A recognized paper by Bove and Ubertini [37] presents a detailed three-dimensional time
dependent model considering phenomena occurring in each component of the fuel cell. All
equations have a partial differential form, thus the model is independent from the cell
geometry and can be employed to model tubular, planar or monolithic cell design. This
paper can be used as a guideline for a detailed and high fidelity model.
In the following chapter the general approach and modeling techniques will be described.
Zero dimensional model characterization will be widely discussed, since such an approach
can be easily adapted for the hybrid system being analyzed.
3.1 Solid oxide fuel cell modeling
As was mentioned in the chapter 3 introduction, there are three generic types of solid oxide
fuel cell designs:
tubular [2,40];
planar [2,41];
monolithic: a combination of the planar and the tubular design in an early stage of
development [42].
Depending on how detailed the considered model is supposed to be, the approach should
take into account different parameters and correlations between them. For instance: if the
mathematical representation of the cell only determines the real cell voltage influenced by
overpotentials, products and reactant compositions, the model does not need to take the
geometry into account. Varied approaches are used for detailed modeling including
2 Gas trace impurities vary depending on the country, region and geological deposit.

25
elaborate mass and heat transfer processes within the cell, the temperature distribution
alongside flow channels and detailed electrochemical reactions. In this particular case the
cell design must be taken into account (i.e. cell geometry). The next subsections provide
general information about modeling methods and emphasize the difference between a
single cell and the entire system.
3.1.1 Modeling of processes within a fuel cell
In section 2.1 it was mentioned that fuel cells generate electricity through an
electrochemical reaction. The electrochemical process takes place as long as reactants are
supplied to the anode and cathode sides (fuel and oxygen respectively). Having said this,
there are already the following phenomena involved in the FC operation:
1. Electrochemical reaction – the main process within the fuel cell.
2. Mass transport – supply of fuel and oxygen.
3. Energy transport, since reactants carry a certain amount of energy in the form of
molecular bonds.
4. Heat transfer – feedstock must be heated up to 700–800 0C, as the SOFC can
operate properly only at high temperature. Additionaly, heat exchange takes place
between the FC stack and other system components.
All of the four listed processes require specific mathematical descriptions dependent on the
desired fidelity.
The electrochemical reaction takes place at the triple phase boundaries (TPB) – specific
regions where at the same time electrolyte, gas, and catalyst particles contact. The overall
electrochemical behaviour of such a system is determined by an intimate convolution of
fundamental materials‟ properties and the microstructure geometry. It is often difficult or
even impossible to deconvolute these factors, however a good understanding of both the
geometry and chemical effects allows for precise modeling. A mathematical description of
the electrochemical processes is often tied with the real cell measurements and empirical
correlations, notwithstanding it allows the creation of a good and precise model [43]. Deng
and Petric [44] proposed geometrical modeling of TPBs for solid oxide fuel cells,
especially investigating correlations between the available reaction sites and grain size,
pore size, and porosity.
Other parametric studies of the SOFC‟s electrochemical reactions presenting different
approaches can be found in the literature [45,46].
Mass and energy transport are essential for fuel cell operation. Improper fuel management
affects peculiar cell functioning. Arpino and Massarotti [47] proposed the detailed
numerical model of the mass and energy phenomena in SOFC. Their approach also
accounts for the correlation between mass-energy flows and electrochemical processes.
Before the model is created, a few principal questions should be answered:
What are the objectives of the modeling?
How detailed should the model be?
Does it adress any certain process/phenomenon?
When one knows the answers for the listed questions, the appropriate mathematical
description with correct assumptions, as well as the needed simplifications can be
generated.

26
3.2 System modeling
Chapter 2.3 provides different examples of SOFC based hybrid systems. Each of them
have some different components utilized. Adapted designs were introduce to meet various
requirements, sometimes utterly different system arrangements have been employed. For
this reason the modeling approach must be adjusted for each system and take into account
the units‟ operating properties and parameters (i.e. fuel preparation and supply, stack
design, turbomachinery, heat exchangers and others). Similarly to the stand alone SOFC,
modeling of the different phenomena can be considered and investigated. Of course
formation of a mathematical description of the whole process is much more complicated
and can never be done entirely without certain assumptions and simplifications.
In the literature such attributes as the design, geometry, material properties, and unit sizing
are rarely investigated. General simplification is based on using data taken from the
existing units of the similar parameters and employing them into the numerical description
(i.e. turbines, combustors and pumps efficiencies, heat exchangers pressure and
temperature drops, and others). Examples can be found in [3-6,8-9]. Model validation is
done mainly through comparison of the available data presented in the literature (with
respect to the scale and design similarities).
Theory of the zero dimensional steady-state design-point modeling of the hybrid SOFC
hybrid system will be within the scope of this paper; therefore attention will mainly be
given to this approach. Neither costs nor material issues will be taken into account.
3.2.1 SOFC hybrid system modeling
The most simplified approach that is widely used for hybrid system optimization is based
on the zero dimensional (OD) model. The main assumption made states that the process
does not need to be continuous (in one, two or three dimensions); calculations can be
performed for the discretized components. Generally speaking, the idea is to transfer
continuous real system behavior into a discrete description of each counterpart by proper
sets of the governing equations.
An adequate mathematical description allows the characterization of each component‟s
performance, allows for a thermodynamic analysis and can take into account typical design
parameters by using semi-empirical or empirical formulas. Reactions taking place within
the gasifier, electrochemical reactions inside the fuel cell stack, steam generation and
further expansion, heat exchange processes, pumping and others can be fairly enclosed in a
set of equations.
In a majority of cases the described approach is used to model systems at the design point
of operation, although it can be used for the part-load (or off-design operation) as done in
the detailed paper by Costamagna et al. [48]. There have been numerous steady-state
models of a single solid oxide fuel cell stack [e.g., 49-54].
In the SOFC literature various feasibility studies for different fuels have been performed. A
system fed by methane was simulated by Chan and Ding [55]. Additionally, they have
investigated in detail the gas dynamics in the flow channels and heat transfer associated
with thermal equipment of a simple SOFC power system. Douvartzides et al. [56]
proposed exergy analysis of the system fed either by methane or by ethanol to optimize the
stack inlet and outlet gases composition for the power generation.
The main objectives of the present study and the subsequent work are to answer the
following questions:

27
1. Is the design concept feasible and could it be considered as the optimal system
configuration? Are there any suggestions for design rearangements?
2. What is the optimal design operating point of the fuel cell for the electricity
generating system?
3. What should be the operating cell voltage and temperature, whilst the fuel
utilization is not a variable?
4. In general, what advantages might the SOFC based system possess for electricity
generation?
5. Does the baseline clean-up process meet the system requirements?
6. What are the shortcomings of the particular system (if there are any)?
4 THE INTEGRATED GASIFICATION SOFC SYSTEM
In this chapter the chosen system configuration will be introduced. All components
building up the system as well as relations between them will be discussed.
The particular system arrangements were determined by the National Renewable Energy
Laboratory according to the U.S. Department of Energy directives, and have been
investigated by the Colorado School of Mines Fuel Cell Center as a baseline system for the
large scale SOFC based power generating unit with integrated coal gasification and carbon
capture and sequestration processes. The CCS in this particular system will be pursued in
two ways, both of which utilize membrane reactors (MR). With higher overall efficiency,
better thermal integration of the whole system and lower installation costs, membrane
reactors are believed to be a convenient technology for CO2 emission reductions.
4.1 Membrane Reactors for CO2 sequestration
Membranes offer the potential for a high-efficient gas separation. Ceramic and metallic
membranes have the benefit of high operating temperature and pressure. They can be used
for separation only, but can also be integrated with chemical reactors [26]. A drawback in
many membrane applications is that the sweep gas is required to obtain a sufficient driving
force for the permeation phenomenon. A concept involving a water gas shift membrane
reactor (WGSMR) has been investigated by Alderliesten and Bracht [27].
They have proposed a WGSMR for syngas (from a coal gasifier) conversion to hydrogen
gas, which is then used for a gas turbine. The more complex system is also viable.
Integration of reforming, shift, and membrane separation in one module can be done in the
gas turbine cycle. Technologies employing oxygen-conducting membranes (OCM) [28]
and using a hydrogen selective membrane (HSM) have been described [29].
For a SOFC system two basic ideas of CO2 capture are considered: pre- and post-fuel cell.
Both concepts are depicted in Fig. 4.1 and Fig. 4.2 respectively.

28
Figure 4.1 Pre-fuel cell CO2 capture concept (after Haines [30])
Figure 4.2 Post-fuel cell CO2 capture concept (after Haines [30])
In the pre-fuel cell concept the first step is to convert a fuel into syngas using steam
reforming (SR). Afterwards, CO2 is separated from the main stream, and eventually is
exported for compression and storage. The remaining stream consists of hydrogen and
water. The H2 rich stream is directed to the SOFC anode compartments.
For pre-fuel cell capture another option is possible: shift can be integrated with the H2
separation in the water gas shift membrane reactor, which is used instead of the shift
reactor and separator step in Fig. 4.1. This concept has been investigated by Alderliesten
[27].
For post-fuel cell CO2 capture, a different off-gas treatment was proposed. The treatment
section always separates CO2 steam. The remaining gas consists of H2 and, depending on
the type of treatment, CO and other components.
CO2 separation and compression can also be done with so called post-fuel cell oxidation,
where anode exhaust gas has a high CO2 content, but also contains H2O, CO and H2
(because the whole fuel is not utilized). Oxidation of hydrogen and carbon monoxide from
the SOFC anode with air will result in too much dilution of the stream with nitrogen.
Instead of using air, pure oxygen can be used (Fig. 4.3), but this concept will probably
result in significant additional costs and energy consumption if oxygen is not available on
site. A different concept is currently being developed by Shell [30]. Their patent solution is
based on the oxygen-conducting membrane reactor (OCMR) placed after the SOFC. As
can be seen in Fig. 4.4 the anode off-gas is fed to one side of the membrane, cathode off-
gas is feed to the other side. Oxygen is selected by the permeation phenomenon from the
cathode off-gas to the anode off-gas stream. In the membrane H2 and CO are oxidized.
After this process water can be removed using conventional techniques, and carbon
dioxide gas is eventually directed for compression and storage. This concept is believed to
29
have good efficiency and be easy to implement into systems employing tubular as well as
planar SOFCs.
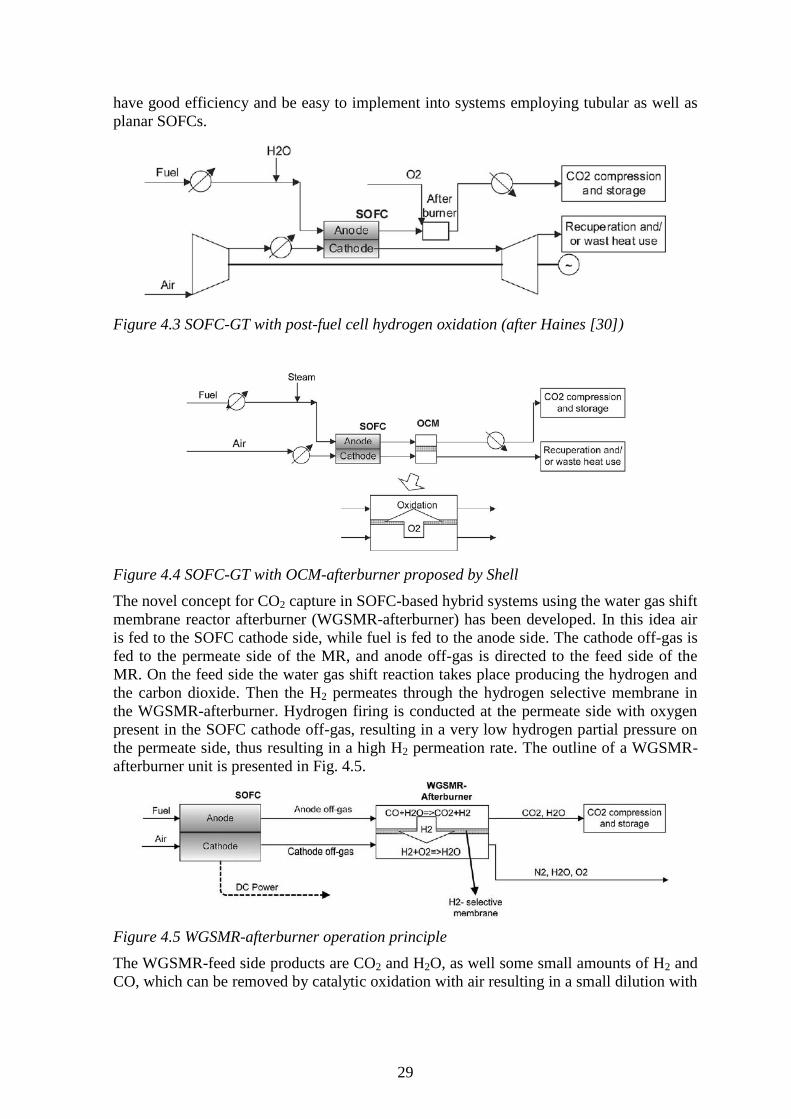
Figure 4.3 SOFC-GT with post-fuel cell hydrogen oxidation (after Haines [30])
Figure 4.4 SOFC-GT with OCM-afterburner proposed by Shell
The novel concept for CO2 capture in SOFC-based hybrid systems using the water gas shift
membrane reactor afterburner (WGSMR-afterburner) has been developed. In this idea air
is fed to the SOFC cathode side, while fuel is fed to the anode side. The cathode off-gas is
fed to the permeate side of the MR, and anode off-gas is directed to the feed side of the
MR. On the feed side the water gas shift reaction takes place producing the hydrogen and
the carbon dioxide. Then the H2 permeates through the hydrogen selective membrane in
the WGSMR-afterburner. Hydrogen firing is conducted at the permeate side with oxygen
present in the SOFC cathode off-gas, resulting in a very low hydrogen partial pressure on
the permeate side, thus resulting in a high H2 permeation rate. The outline of a WGSMR-
afterburner unit is presented in Fig. 4.5.
Figure 4.5 WGSMR-afterburner operation principle
The WGSMR-feed side products are CO2 and H2O, as well some small amounts of H2 and
CO, which can be removed by catalytic oxidation with air resulting in a small dilution with

30
nitrogen. Water removal can be pursued by cooling and condensing the vapour. The
resulting carbon dioxide stream can be easily sequestrated without further treatment.
Three types of hydrogen selective membranes have been considered for the WGSMR-
afterburner concept:
Microporous membranes operating at low temperatures with high flux densities;
Paladium membranes operating at moderate temperatures, being very selective, and
having high flux densities;
Proton conducting (pervoskite) membranes which can operate at the highest
temperature, but unfortunatelly are far less developed than the other types of
membranes.
Advantages of the WGSMR-afterburner systems are the same as for the OCM-afterburner
investigated by Haines [30]: a fairly pure CO2 stream is available after water knock-out,
without the requirement of large, complex and steam-consuming CO2 scrubbing
equipment. This system is believed to be feasible because of some additional advantages:
1. Mass flow through the expander is increased (higher power production possible)
because of the flux through the membrane towards the gas turbine inlet.
2. CO2Dilution with water is reduced.
3. With projected membrane materials, higher fluxes may be achieved without the
necessity of imposing a current on the membrane material as might be required
with OCM membranes.
4. This concept is feasible for the pressurised hybrid cycles (scheme depicted in Fig.
4.6) with both pressurised and atmospheric WGSMR-afterburner.
Figure 4.6. Hybrid cycle employing WGSMR-afterburner (after Haines [30])
It must be emphasised that all systems utilizing membrane reactors are favourable as a path
to mitigate emissions. They meet CO2 Capture R&D project goals, inter alia the European
Union 5th Framework Programme Projects:
1. Advanced Zero Emission Power Plant (AZEP).
2. Grangemouth Advanced CO2 Capture Project (GRACE).
3. Assess the European Capacity for Geological Storage of Carbon Dioxide (EU
GeoCapacity).
4. CASTOR "CO2 from Capture to Storage".
5. CO2STORE.
6. Saline Aquifer CO2 Storage (SACS).
7. Great Plains Synfuels Plant (GPSP) – CO2 Capture and Compression.
8. Weyburn II – CO2 Storage Project.
31
9. Natural Analogues for the Geological Storage of CO2 (NASCENT).
4.2 Simultaneous reactions within the SOFC
During the operation of a SOFC there are simultaneous reactions occurring. The main two
are the water gas shift and steam reforming. Among other ways to calculate the
equilibrium, the Minimum Gibbs Free Energy (MGFE) approach is widely used in
simplified models. This method allows determining the equilibrium composition when
multiple chemical reactions occur. For the SOFC there are two simultaneous reactions
considered in the fuel channel: the water gas shift and the steam reforming, with the
assumption that the gas mixture reaches its equilibrium in the SOFC and the composition is
then calculated using MGFE approach for the mixture of reactants and products.
To understand the method here is a look at the generic reaction:
aA + bB ↔ dD + eE
Initially there are , moles of species s. At equilibrium (at temperature T)
the notation will be used. Minimizing the Gibbs free energy can be mathematically
written as:
where is the Gibbs free energy of species s at temperature T.
Subject to , which is a constrain followed by the mass
conservation law.
In the discussed case, there are five species involved in the WGS and SR reactions: CH4,
CO2, CO, H2O and H2. Since the amount of carbon element is invariant before and after the
reactions considered in the fuel channel, the MGFE method for the SOFC‟s fuel flow can
be formulated in terms of ratios of the chemical species.
Where is the amount of in the fuel channel, given in moles. To reduce the number of
variables that have to be considered to determine the mixture‟s composition, a
normalization process is beneficial.
To distinguish the value of at the equilibrium of the WGS and SR reactions, the
notation is used. . By the MGFE method, given
and the fuel flow temperature ( , satisfies the following:
(Eq. 4.2.1)
Subject to:
(Eqns. 4.2.2)

32
Set of eqns. 4.2.2 corresponds to the mass conservation law in terms of individual species
involved in the reactions.
(the fuel temperature) can be determined from the energy balance dynamics of the fuel
flow. Having the fuel inlet conditions and current density, the and in fuel flow
can be calculated. In this case the fuel accumulation must be neglected. As can be easily
deducted, the depends only on the inlet fuel composition, while oxygen ions migrate
from the cathode to the anode and enter the fuel flow through electrochemical reactions.
Defining as a sum of the methane, carbon di- and monoxide, and hydrogen (eq. 4.2.3)
and can be written in the new form (eq. 4.2.4 and eq. 4.2.5 respectively):
(eq. 4.2.3)
(eq. 4.2.4)
(eq. 4.2.5)
After and are calculated, the MGFE results for can be represented as the
function of only three independent variables: and . The minimization of the
(involved in eq. 4.2.1) can be done off-line using different computer codes. Results
are saved as the look-up tables. These tables are then used for the on-line simulation [57].
When the is determined, the molar fraction of individual species in the fuel flow
channel can be computed the following way:
(eq. 4.2.6)
(eq. 4.2.7)
Xi [57] proposed the reduced-order SOFC model using MGFE method. His idea was to
disregard the dynamic mass balance equation for each species in the fuel flow, as was
presented earlier. Instead of this, he claimed that the equation for the total mass of the bulk
flow in the fuel channel can be derived (eq. 4.2.8):
(eq. 4.2.8)
The accounts for the oxygen ions‟ migration from the cathode to the anode. Then
the linear orifice flow relation can be assumed, which can be expressed as
where is the downstream pressure of the SOFC.
(the total pressure of the bulk flow) in the fuel channel can be calculated using the
following formula:
, and consequently the partial pressure of species is give by
, where is determined using eqns. 4.2.6 and 4.2.7.

33
A different method based on the mass balance can be used for calculations when
simultaneous reactions occur within the SOFC. For better understanding, a graphical
representation of the SOFC operation principle is helpful (Fig. 4.7).
Figure 4.7 Principle of the SOFC operation
Generally speaking there are three reactions taking place at the same time:
1. The electrochemical reaction H2 + 0,5O2 → H2O
2. The steam reforming of methane CH4 + H2O ↔ 3H2 + CO
3. The water gas shift reaction CO + H2O ↔ H2 + CO2
The fuel utilization (FU or UF), introduced in the SOFC basics of this thesis, can now be
written in respect to the molar flows in the form:
(eq. 4.2.9)
Where subscripts 1 and 2 denote positions in the fuel cell (inlet and outlet respectively –
both indicated in Fig. 4.7).
Mass balances can be written in the following forms (observe that there is 2‟ introduced
between inlet and outlet, and it corresponds to the state inside the SOFC).
, where (eqns. 4.2.10)
As said earlier, reactions 1-3 listed above are taking place simultaneously. Each of them
has a corresponding reaction rate, which provides the information for how does the
reaction proceeds. Rates are appropriately:
34
for the electrochemical reaction
for the water gas shift reaction
for the steam reforming3
At this point it can be added that is defined as
Using reaction rates, eqns. 4.2.10 can be rewritten into the new form. Adequate equations
for hydrogen, carbon monoxide, and nitrogen have been added.
(eqns. 4.2.11)
This set of equations provides a clear outlook for how these three reactions are dependent
one on each other. It can be seen that when one process generates a certain molar flow of
species, it is consumed by the other reaction.
Example 1:
An electrochemical reaction generates a certain amount of water (in the gaseous phase) and
then it is partially consumed by the water gas shift reaction (usually at equilibrium) and
steam reforming.
Example 2:
CO as the steam reforming product reacts with water in the water gas shift reaction.
The method presented above allows the application of different calculation modes. Eqns.
4.2.11 may be employed for numerical calculations, where information is passed between
nodes. In this case subscripts 1 and 2 should be substituted with n-1 and n respectively. Mass
balances apply for a certain amount of numerical calculation steps. Moreover, when fuel
utilization is defined, it determines the amount of hydrogen consumed, i.e. in eq.
4.2.9, hence calculations are simple and can be performed using different tools.
5 MODELING OF COMPONENTS
To optimize and investigate the SOFC hybrid cycles, such a system must first be created in
the software. Every single component must be represented by a proper unit, and relations
between the system‟s constituents must be defined. Depending on the system complexity
and the scope of a particular research, different approaches can be involved (as described
in Chapter 3.).
3 All three reaction rates have the unit. For example: .
35
For the advanced SOFC based Brayton-Rankine cycle gas and steam turbine, at least the
following components must be included:
Heat exchangers (for various temperature levels);
Gas turbine;
Steam turbine (can be staged);
Coolers;
Compressors;
Pumps;
Boiler (evaporator).
It must be emphasized that there are some units employed in the cycle that need to be
represented in a different way (for example Fortran programming code can be used to
create user defined units in ASPEN Plus). When compatible, the Excel spread sheet can be
utilized as an alternative to the built-in software units. The SOFC stack is comonly
modeled as such a unit, called the user unit.
In this section the crucial parameters for each component will be discussed, followed by
the unit‟s operation basis. Since Hysys and ASPEN Plus are the most commonly used
programs for SOFC system modeling and optimization, in this chapter the attention will be
focused on these two tools. The common features as well as differences between the same
units represented in both codes will be briefly discussed.
In order to calculate desired parameters, flows, heat duties and others using each of the
units, some input data are required. For each component, the most important and needed
inputs will be given.
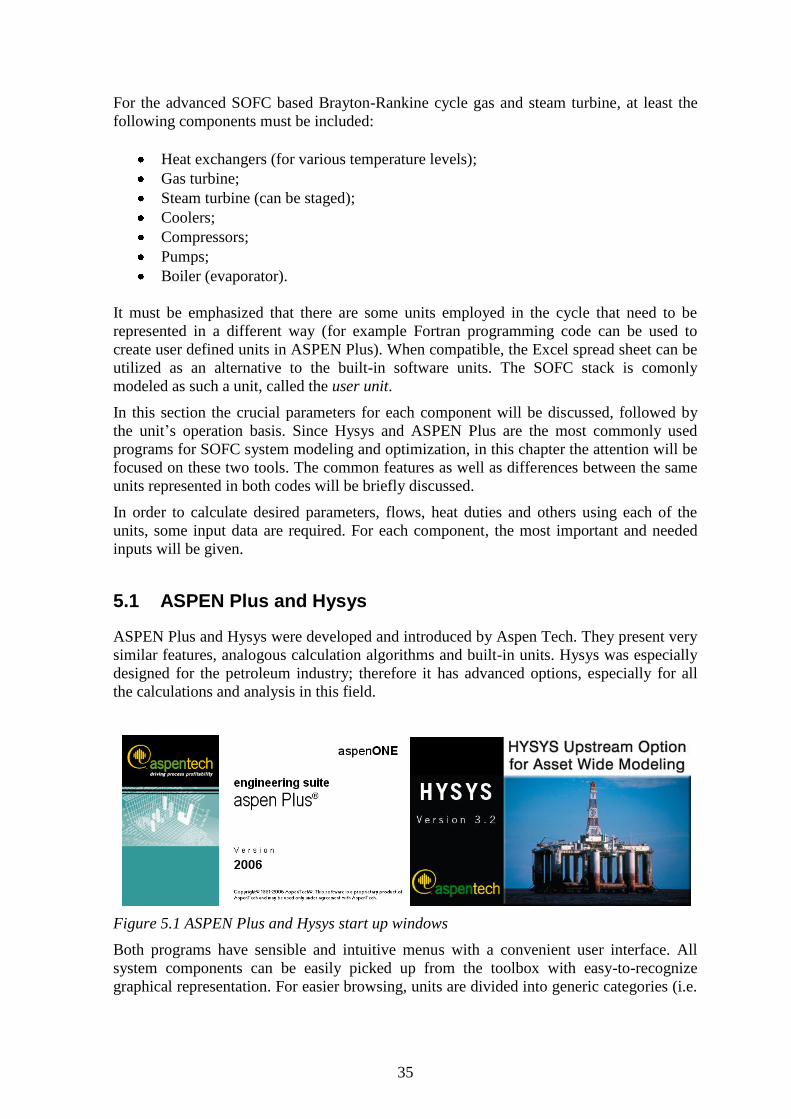
5.1 ASPEN Plus and Hysys
ASPEN Plus and Hysys were developed and introduced by Aspen Tech. They present very
similar features, analogous calculation algorithms and built-in units. Hysys was especially
designed for the petroleum industry; therefore it has advanced options, especially for all
the calculations and analysis in this field.
Figure 5.1 ASPEN Plus and Hysys start up windows
Both programs have sensible and intuitive menus with a convenient user interface. All
system components can be easily picked up from the toolbox with easy-to-recognize
graphical representation. For easier browsing, units are divided into generic categories (i.e.

36
mixers, separators, heat exchangers, reactors, pressure changers and others). An example
of the ASPEN Plus toolbar is presented in the Fig. 5.2.
According to the industry and academic experts [58] Hysys is believed to be easier and
more intuitive, however it has lower property capability. Furthermore, ASPEN Plus is the
industry standard and is used by the national laboratories.
Figure 5.2. ASPEN Plus unit’s toolbar
In Hysys, each unit specification can be seen after double-clicking on each component
included in the flowsheet. In ASPEN Plus, specifications are given in the menu, which is
always available in the software on the left hand side of the user interface. This menu
includes all streams and component properties/parameters, and additionaly allows the user
to check if each component specification is completed (Fig. 5.3). This feature is not
available in Hysys; notwithstanding it can be looked up in each unit‟s properties. The
green bar in Fig. 5.2.1 indicates that all needed inputs for the Gibbs reactor were given.
Figure 5.3 Part of the ASPEN Plus side menu. Elements indicated with blue tick are
completely specified for calculations
In Table 5-1 icons of the same selected units in both programs are compared to visualize
the differences in the graphical representation.
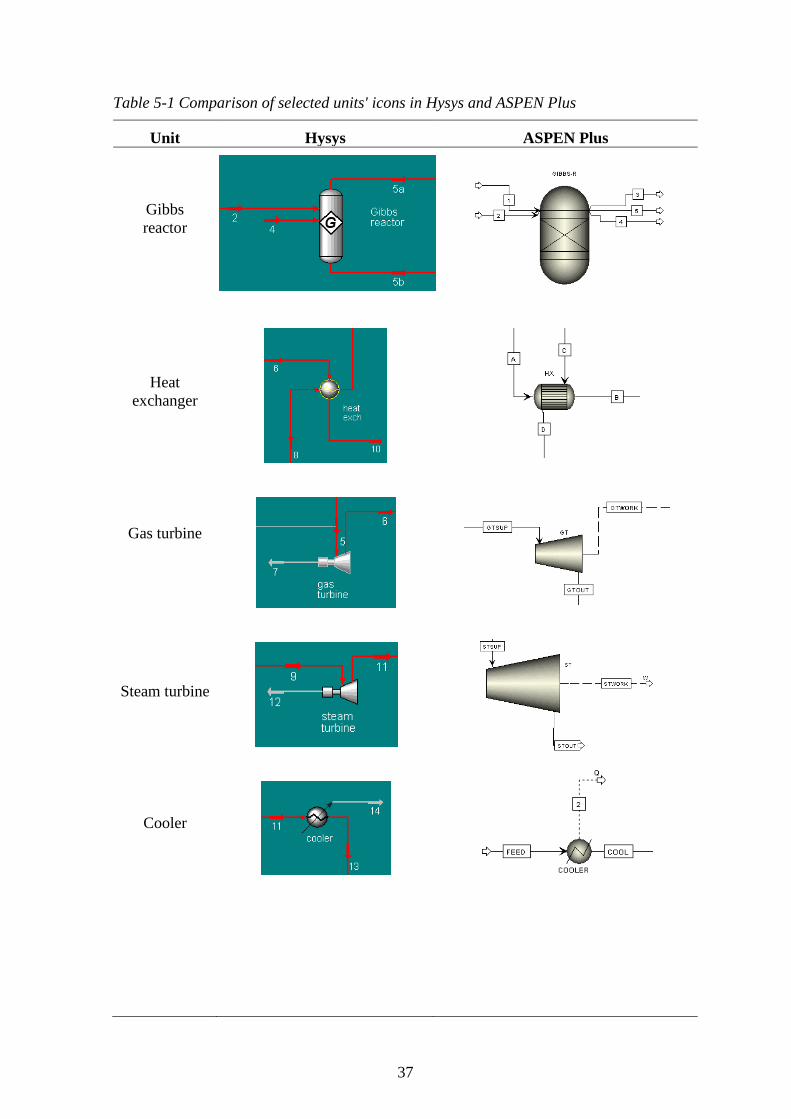
37
Table 5-1 Comparison of selected units' icons in Hysys and ASPEN Plus
Unit Hysys ASPEN Plus
Gibbs
reactor
Heat
exchanger
Gas turbine
Steam turbine
Cooler
38
Compressor
Pump
5.2 Gibbs reactors
The Gibbs reactor (GR) has the advantage that stoichiometric equations are not required.
Equilibrium is determined from the free energy and the heat of the reaction is calculated
automatically. The method is completely general and predictive. Processes which come to
equilibrium or close to equilibrium may be modeled with this technique. The unit is
beneficial, because generally speaking the user does not need to know what reactions are
taking place within. It can be compared to “the black box” – inputs and outputs are
defined, then software determines the composition with the MGFE method.
If the model is created in the Hysys or ASPEN Plus modeling environment, then MGFE
calculations presented in Chapter 4.2 can be done in this one unit (i.e. reforming and shift
reactions can be solved using two Gibbs reactors).
Hysys as well as ASPEN Plus GRs have an unlimited number of inlets. The first one
always has two outlets (one for the vapor and one for the liquid fraction). ASPEN Plus GR
can have more than two outlets. To specify this unit the following parameters are needed:
inlet and outlet streams must be specified and connected;
operating pressure and temperature4;
calculation option must be selected;
in Hysys information specifying reactions can be added.
4 Heat duty (or energy) might also be specified, but generally it is calculated. See Fig. 5.2.1

39
Figure 5.2.1 Comparison of the unit specification in Hysys and ASPEN Plus
5.3 Heat exchangers
In the large scale gas and steam cycles with SOFCs many heat exchange phenomena occur.
For better visualization of this, the baseline IGFC System configuration by the U.S. DoE
will be recalled and discussed in terms of the heat exchange (Fig. 5.3.1).
Figure 5.3.1 Baseline IGFC System configuration by U.S. DoE NETL [57]

40
Hot gas exiting the gasifier has a temperature of 1200 0C and it must be cooled down to
650 0C prior to entering the stack. Anode gas removes part of the energy in the form of
heat from the syngas stream. Fuel utilization of the SOFC stack is 0,85, thus the anode
outlet mixture is in the flammability range, hence it is fired in the combustor. The
combustion process raises the temperature. Part of the heat is then removed from the flue
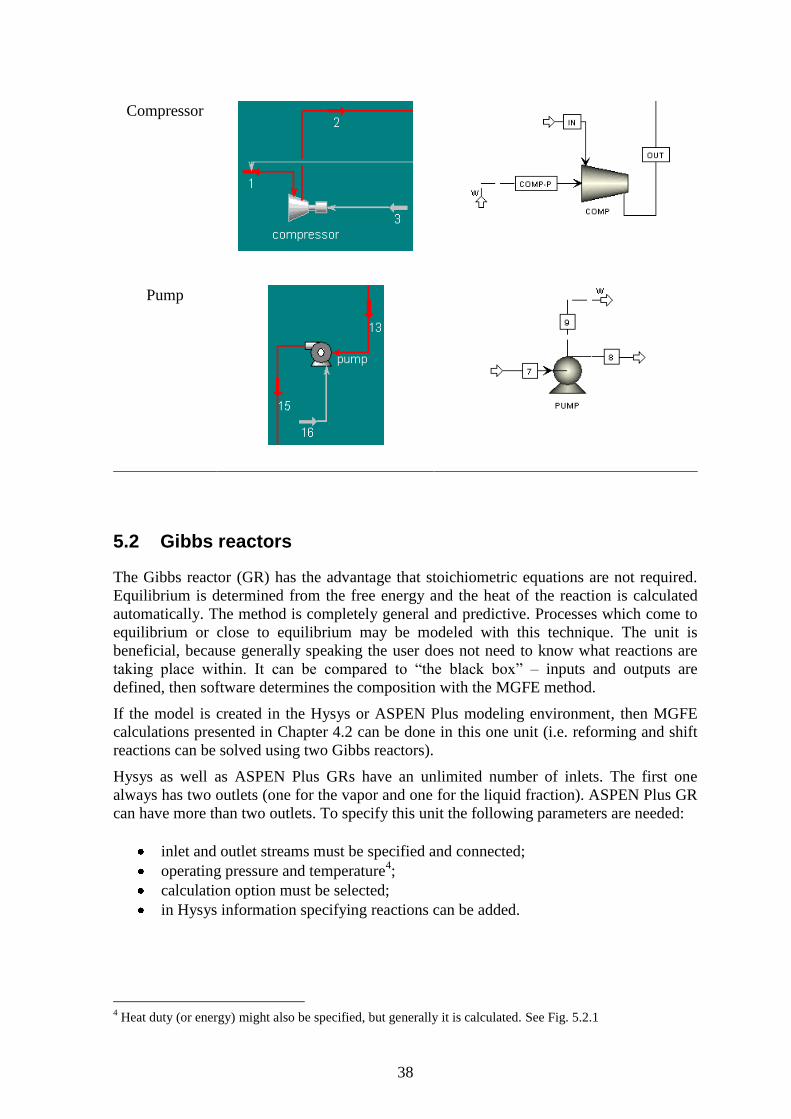
gas by the cathode gas and finally it can be expanded in the gas turbine. After cooling the
combustor gases there is still a fairly high temperature level that allows placing the second
heat exchanger (HSRG in the scheme) for recovery steam generation for the bottoming
steam cycle. As can be seen in Fig. 5.3.1, expanded in the gas turbine gases are still hot
enough to be directed to the steam generator.
The above example shows how complex heat transfer processes occur in the cycle. There
are different mass flows, different temperature levels and changes. In every single point
where heat is exchanged, the proper exchanger must be employed.
In Hysys/ASPEN Plus the most advanced is the tube-shell heat exchanger. In this unit the
user can specify the pressure and temperature drops, design (co- or counterflow),
calculation method and other parameters. Unit specification in both programs is presented
in Fig. 5.3.2.
Figure 5.3.2 Heat exchanger specification window in Hysys and ASPEN Plus
41
To fully specify the heat exchanger for the simplest calculations, at least the following
parameters are needed:
connections (i.e. inlet stream must deliver the information about the temperature,
pressure, and mass or molar flow);
pressure drop within the unit;
flow direction (i.e. co- or counterflow).
If desired, calculations can be carried out to compute the outlet temperature of the shell or
tube side. The user can also determine the particular stream outlet temperature, if it must
be at a certain level for the next device following the heat exchanger (for example gas
turbine TIT). Various configurations corresponding to the particular cycle arrangements
can be set and can help to correctly approach all heat exchange processes in the system.
Heat exchangers can also be used in modeling as a unit simulating the boiler/steam
generator, since the phase change can occur within, and neither deteriorates nor disables
the calculations.
5.4 Gas and steam turbine
The first step in utilizing the high temperature waste heat from the SOFC stack is the
Brayton cycle (as described in Chapter 2.2). In Fig. 5.3.1 it can be seen that the gas turbine
runs on the cathode outlet gas. Its temperature is boosted by the combustor heat exchanger,
hence the TIT can be ≥ 1000 0C. Hysys and ASPEN Plus turbine units are simplified and
the specification is mainly based on the data from the turbine performance maps, which are
input by the user.
The basic turbine (both the gas and steam) specification involves the following data:
the isentropic efficiency;
the mechanical efficiency;
inlet and outlet streams;
pressure ratio (or discharge pressure);
power can be either caclulated or given by user.
If the system„s turbine has the certain number of extractions, then such a unit is modeled
by the corresponding number of single turbine units in the series (i.e. turbine with two
extraction is represented by three turbine units; turbine with four extraction, by five turbine
units).
Both programs are user friendly and will inform the user if he or she has comitted a
mistake in the turbine specification. For example, the most comon problem is with
condensation (especially for steam turbines) during expansion – Hysys will not calculate
the turbine when the liquid phase occures within the unit. ASPEN Plus will give a warning
that the phase has changed; Fig. 5.4.1 and 5.4.2 depict gas and steam turbine specification.
Observe that this is exactly the same unit in terms of the operation principle, specification,
efficiency deffinition. Only the temperature and pressure ratios change. TIT is higher by
far for the gas turbine (≥1000 0C), while the best available technology (BAT) steam turbine
has TIT not higher than 580 – 600 0C.

42
Figure 5.4.1 Gas turbine specification window in Hysys and ASPEN Plus

43
Figure 5.4.2 Steam turbine specification window in Hysys and ASPEN Plus
5.5 Coolers
A cooler allow simplification of the heat exchange processes. Basically it assumes that
there is some kind of device which cools down the inlet stream by the certain ∆T or to the
certain outlet temperature with some energy involved. This unit can either calculate the
outlet temperature when energy is defined or can calculate the energy needed to cool down
the stream to the determined temperature value. The second situation is common in steam
cycles, when the condenser must be cooled down to the exact temperature, and the coolant
stream must be precisely adjusted to remove heat from the steam to condense it. The
coolant‟s heat is then removed in the cooling tower or, if the coolant is the river water, the
hot water is dumped back into the river (its temperature is limited because of
environmental issues, but generally speaking it cannot be higher than 28-30 0C). ASPEN
Plus allows approaching the cooler unit in more ways than Hysys. Both programs can
calculate when the phase change within the cooler occurs.

44
Figure 5.5.1 Cooler specification window in Hysys and ASPEN Plus
5.6 Compressors
Since the proposed system is pressurized, compressors must be employed. In the system
scheme (Fig. 5.3.1) the air and oxygen compression is indicated. The first unit is on the
same shaft with the gas turbine. It reduces the amount of power produced by the three-
phase generator, but the compressed air is sent to the air separation unit (ASU) where the
oxygen stream can be separated. The second compressor raises the pressure of oxygen fed
to the gasifier.
In ASPEN Plus both the compressor and turbine are included in the same unit – the
pressure changer. In the specification the user must select either compressor or turbine (see
Fig. 5.6.1).
Figure 5.6.1 Compressor specification in Hysys and ASPEN Plus
45
In both programs compressors are calculated precisely. The User can determine the type of
efficiency (i.e. isentropic or polytropic in ASPEN Plus, and adiabatic or polytropic in
Hysys). Additionally, information about operation mode can be given – compressor can be
centrifugal or reciprocating. As was stated previously, the duty can be either specified or
calculated.
Compressor specification includes:
inlet stream temperature and pressure
5, and additionally the desired outlet pressure
can be given;
mass or molar flow throughout;
efficiency;
duty6.
Both programs enable easily linking the compressor with an expander. This feature is
useful for modeling the system, which employs these two units connected to the same
shaft. The expander drives the compressor, hence the power output of these coupled
devices is a result of the overall performance.
5.7 Pumps
Analogically to a turbine, a pump also needs to be selected in the unit´s window. Pump
specifications include:
inlet and outlet streams (mass or molar flows, temperatures, pressure in the inlet
and the outlet streams);
efficiency;
supplied energy or duty;
Once again, calculations can be performed to determine the energy needed to increase the
pressure by a certain value or to the desired value. Usually the user determines the outlet
pressure (or pressure increase) because of the cycle„s particular arrangements and needed
parameters. At this point, it must be emphasized that pumps, turbines, and compressor
pressure changes influence the outlet stream temperature. In case the turbine temperature
decreases, it is associated with the isentropic expansion. The pump and compressor always
increase the temperature while operating in the power cycle7. For pumps, temperature rise
can be neglected because the change is insignificant, while a compressor temperature rise
can be hundreds of degrees celsius.
5 If the compressor is characterized by a pressure increase then only the inlet stream temperature and pressure
are needed. 6 If the inlet and outlet streams are fully specified (i.e. both temperature and pressure are determined by the
user), and the efficiency is given, then duty can be calculated. Efficiency is rarely calculated, however it is
possible to do so. 7 Outlet temperature for both mentioned devices is higher than the inlet temperature; however some specific
fluids can be found, which compression leads to the temperature drop.

46
Figure 5.7.1 Pump specification window in Hysys and ASPEN Plus
6 CONCLUSIONS
As was presented in this paper, SOFC based cycles open a wide pathway for large scale
power generation systems. At the same time there are many concerns, open questions and
difficulties. The most important problem is that there are no commercially available units
in the size of hundreds of MW, since every modeling is based on literature data. The only
components employed in the cycle that are available off-shelf are turbines, compressors,
pumps and some of heat exchangers. At this point it must be emphasized that heat
exchange processes are much different in the proposed cycle compared to the conventional
coal or natural gas based power generating units.
All advantages and difficulties encountered during previous analysis will be discussed as
the final conclusions of the current work.

47
Pros
This particular U.S. DoE system employing a coal gasifier encounters the problem of very
limited data about the large coal gasifiers. Luckily, such units were investigated [2,30] and
some numbers can be adopted.
Different systems modeled in programs can be investigated in terms of the overall
efficiency, power output, thermal integration and other parameters. Both modeling codes
(Hysys and ASPEN Plus) can indirectly provide information about design rearrangements,
i.e. performed calculations can suggest if the proposed approach is correct and efficient.
Exact information about the streams‟ parameters help the user to pinpoint inefficient points
(or solutions) in the system. Analysis can indicate energy and exergy losses.
SOFC based systems present a unique solution for large scale power generating units in
terms of CO2 capture and sequestration. These cycles are being analyzed all over the world;
however, they are not believed to be commercially available in the coming decade. All
system arrangements described in this thesis yield the most efficient way to capture and
sequestrate carbon dioxide. It has been proven by Kvamsdal‟s group at the SIN TEF
Energy Research in Norway [59] that SOFCs combined with gas turbines present the best
performance for CCS. They have discussed both the pre- and post-SOFC clean up
processes. Their final conclusion is that hybrid systems with fuel cells exceed the
efficiency of conventional combined cycles. An Employed bottoming steam cycle can
additionally increase the system‟s efficiency by a few percent points.
Consequently, modeling and optimization performed in Hysys or ASPEN Plus provide a
clear view, highlighting the complex relations between all parameters. Finally, the
modeling tool should allow creating a kind of performance map of the entire system. This
map, likewise the compressor or turbine performance map, indicates the power output and
system efficiency for design and off-design operation.
Various modeling approaches (widely described in chapter 3.2) can be employed for
precise analysis. In many cited papers, steady-state model construction was addressing
particular questions regarding thermal issues, materials durability and a system‟s life time,
costs, and performance. A wide range of available tools is beneficial and has been used by
researchers in many countries, providing comparable results.
Sizing of the system can be done in two ways. The first one is to determine the desired gas
and steam turbine power output. When the output is know, then the available off-shelf
turbines can be employed in the cycle and all components, including the SOFC stack, will
be sized to fit the system (i.e. flows, temperature drops in heat exchangers, pumps‟ power,
etc.). This method allows creating the new system with initially determined power output,
based on the availability in the market of the components. In this case a system can be
created in a way that satisfies the exact need; hence every component was adjusted to fit
the predefined power output. The second way of sizing the system can be based on the
components‟ performance, depending on each particular unit size. Generally speaking, the
bigger the system is, the better its performance will be. If the model has been created in a
modeling environment (such as the previously mentioned Hysys or ASPEN Plus) scaling-
up can be done by changing certain parameters. Estimated values of the bigger
components‟ efficiencies should be provided by the user, and in this way the new and
larger system model may be obtained; however it will consist of components fitting the
cycle, which may not be available in the market. In this case optimization will be needed to
calculate all crucial factors with respect to the fixed parameters (turbines inlet temperatures
and pressure discharges, pressure drops in HXs, ect.)
48
In the SOFC-based hybrid system most of the attention is focused on the turbines. While
heat exchangers fitting the system can be easily found in various power cycles, turbines
(especially the gas one) able to stand the extremely high inlet temperatures cannot. One of
the biggest advantages of the SOFC-based power unit is the presence of the high
temperature source, which is the gasifier. An additional heat exchanger can be employed to
boost the gas turbine inlet temperature up to even 1500 0C, similar to an afterburner (or
combustor). Such an arrangement means that an advance gas turbine with blade thermal
barrier coating will be needed. In this case, temperature higher by 300-500 0C means a
further efficiency increase by an additional 4 to 6 (depending on the source) percent points.
Modeling is also beneficial since it provides answers to questions regarding thermal
integration. First of all, the orders of parameters can be the explicit information. The model
can indicate points when parameter convergences are not accurate, for example system
arrangements can limit or lead to the exceeding of parameters. The most remarkable
problem occurs when a change of the gas turbine inlet temperature leads to the change of
the expanded gases temperature, which enables proper operation of the bottoming steam
cycle. Finally the incorrect adjustment of the Brayton cycle TIT entails the drop of both
turbine efficiencies and finally the overall system efficiency and power output.
Such examples can be found in many referenced papers and are typical for particular
designs.
Cons
Because of the lack of units in operation, model validation cannot be performed. The only
way to exercise the model is to compare its performance with the most similar one
presented in the available literature. This approach is commonly used, and generally
speaking provides a fairly accurate outlook.
The most difficult step in the whole modeling process is data acquisition. While finding
turbines‟, pumps‟ and compressors‟ performance maps is not a big problem, when it comes
to reactions parameters, gasifier and fuel cell stack data, the matter becomes much more
complicated. The best way to find performance curves for all mentioned devices is to
review recently published papers covering the topic. Some of them elaborate on the
parameters, some assume certain values and slightly correct them through iteration steps.
Generally, modeling with high fidelity is possible as long as all inputs are correctly set by
the model creator, with full understanding of processes taking place within the cycle.
Thermal integration of the entire system is very complicated – even for steady-state
modeling. There are various fluid streams with substantially different mass flow, and
sometimes with large temperature differences. It cannot be explicitly answered if the
particular system arrangement is optimal. Such a question can be handled only by a person
possessing a complete understanding of the system‟s operation.
Unfortunately, the proposed IG-SOFC hybrid system‟s parameters must be placed in the
hierarchy before the optimization begins. Crucial parameters must be defined and/or fixed
(for example turbine inlet temperature and pressure). Parameters to be adjusted by the
program must be left as variables with or without constrains, which means that some can
be fully determined by the code, and some of them must stay in the predefined range.

49
Open questions
When the model has been constructed, the main challenge is to correctly adjust constrains
for each component. For example: it is known that stand alone solid oxide fuel cell optimal
operation pressure is between 5 and 15 bars, however for the steam and gas cycles,
pressure in range of 100-200 bars is desirable for the turbines‟ expansion processes. In this
case all pros and cons must be analyzed to answer the question. Is it better to compromise
the fuel cell stack to increase the net power produced, or is it better to operate steam and
gas turbines off-design? Unfortunately, in this newest high-tech cycle there are many
points at which it is very difficult to decide which parameters are crucial and must be
fixed, and which can be easily adjusted for correct functioning. Moreover, because there
are no units in operation, these essential questions can be answered only through
theoretical modeling.
During the literature review the author observed that the biggest variations in approaches
were associated with the SOFC stack. It has been assumed that there are always three
reactions taking place simultaneously (i.e. steam reforming, water gas shift reaction, and
electrochemical reaction). Each of those listed has a few parameters influencing the
reaction rate. In chapter 4.2 governing equations are provided. They can be solved after
providing necessary input data, which can be found in various papers, especially the
recognized papers by Achenbach and Riensche from Institute of Energy Process
Engineering, Jűlich, Germany. Correct step-by-step data selection can be found in Xi‟s
dissertation [57].
It has been said that IG-SOFC hybrid cycle capital and operation and maintenance (O&M)
costs can be lower compared to the same scale power as well combined heat and power
units. This is the biggest uncertainty, and this question will be answered after such systems
are in the commercial operation, which is expected to happen in a very distant future
perspective.
50
REFERENCES
1. Harvey S.P. and Richter H.J. (1994) Gas turbine cycles with solid oxide fuel cells.
Part I: improved gas turbine power plant efficiency by use of recycled exhaust
gases and fuel cell technology. Tans. ASME K. Energy Resour. Techno. 116, pp.
305-311.
2. EG&G Technical Services, Inc. (2004) Fuel Cell Handbook 7th
edition. U. S.
Department of Energy - Office of Fossil Energy, NETL.
3. Dunbar W.R., Lior N. and Gaggioli R.A. (1991) Combining Fuel Cells with Fuel-
Fired Power Plants for Improved Exergy Efficiency. Energy vol. 16 (4), pp. 1259-
1274, Pergamon Press.
4. Bedringas K.W. et al. (1997) Exergy Analysis of Solid-Oxide Fuel Cell (SOFC)
Systems. Energy vol. 22 (4), pp. 403-412, Elsevier Science Ltd.
5. Chan S.H., Ho H.K. and Tian Y. (2002) Modelling of simple hybrid solid oxide
fuel cell and gas turbine power plant. Journal of Power Sources 109, p. 111-120,
Elsevier Science Ltd.
6. Stiegel G.J. and Maxwell R.C. (2001) Gasification technologies: the path to clean,
affordable energy in the 21st century. Fuel Processing Technology 71, pp. 79-97,
Elsevier Science Ltd.
7. Braun R.J. (2002) Optimal Design and Operation of Solid Oxide Fuel Cell Systems
for Small-scale Stationary Applications. Ph.D. dissertation at University of
Wisconsin-Madison.
8. Song T.W. (2006) Performance characteristics of a MW-class SOFC/GT hybrid
system based on a commercially available gas turbine. Journal of Power Sources
158, pp. 361-367, Elsevier Science Ltd.
9. Verma A., Rao A.D., Samuelsen G.S. (2006) Sensitivity analysis of a Vision 21
coal based zero emission power plant. Journal of Power Sources 158, pp. 417-427,
Elsevier Science Ltd.
10. O‟Hayre R. et al. (2006) Fuel Cells Fundamentals. John Wiley & Sons, Inc.
11. Kuchonthara P., Bhattacharya S. and Tsutsumi A. (2003) Energy recuperation in
solid oxide fuel cell (SOFC) and gas turbine (GT) combined system. Journal of
Power Sources 117, pp. 7-13, Elsevier Science Ltd.
12. Mench M.M. (2008) Fuel Cell Engines. John Wiley & Sons, Inc.
13. Srinivasan S. (2006) Fuel Cell From Fundamentals to Applications. Springer
Verlag.
14. Dvorak D. (2008) SOFC: Science, Technology and Applications. Metal Hydride
2008 Conference Proceedings, Reykjavik, Iceland.
15. Parise J.A.R. et at. (2008) Fuel Cell and Cogeneration Journal of Fuel Cell
Science and Technology vol. 5, Elsevier Science Ltd.
16. Draper R., DiGiuseppe G. (2008) High Power Density Solid Oxide Fuel Cells for
Auxiliary Power Unit Applications. Journal of Fuel Cell Science and Technology
vol 5.

51
17. Inagaki T., Nishiwaki F. et al. (2007) Intermediate Temperature SOFC Based on
Lanthanum Gallate Electrolyte. Proceedings of Tenth Grove Fuel Symposium.
London, UK.
18. Buchanan T.L. et al. (1994) Carbon Dioxide Capture in Fuel Cell Power Systems.
G/C Report 2981.
19. Liese E., Ferrari M. et al. (2008) Modeling of Combined SOFC and Turbine Power
Systems. Springer Science and Business Media B.V.
20. Bove R. and Ubertini S. (eds) (2008) Modeling Solid Oxide Fuel Cell – Methods,
Procedures and Techniques. Springer Science and Business Media, B.V.
21. Milewski J. and Miller A. (2006) Influences of the Type and Thickness of
Electrolyte on Solid Oxide Fuel Cell Hybrid System Performance. Journal of Fuel
Cell Science and Technology vol. 3, pp. 396–402, ASME.
22. Maskalick N. (1992). Contaminant Effects in Solid Oxide Fuel Cells. Proceedings
of the Fourth Annual Fuel Cells Contractor‟s Review Meeting. U.S. DOE/METC,
Minh. N. et al. (1998). High Performance Reduced-Temperature Solid Oxide Fuel
Cell Technology. 1998 Fuel Cell Seminar Abstracts, Palm Springs, p.263.
23. He H.P., Gorte R.J., Vohs J.M. (2005). Electrochem and Solid-State Lett 8 (6)
A279.
24. Litle A.D. (1994). Multi-fuel Reformers for Fuel Cell Used in Transportation.
Phase 1 Final Report prepared for the U.S. DoE, DOE/CE/50343-2.
25. Cayan F.N. et al. (2008). Effects of coal syngas impurities on anodes of solid oxide
fuel cells. Journal of Power Sources vol. 185, pp. 595-602
26. Dijkstra J.W., Jansen D. (2004). Novel concepts for CO2 capture. Energy vol. 29,
pp. 1249-1257, Elsevier Science Ltd.
27. Alderliesten P.T., Bracht M. (1997). An attractive option for CO2 control in IGCC
system: water gas shift with integrated H2/CO2 separation (WIHYS) process;
Phase 1: Proof of Principle. Final report CEC Project JOU2-CT92-0158. ECN-C-
97-097. Petten, ECN, The Netherlands Energy Research Foundation.
28. Mortisuka H. (1998). Hydrogen decomposed turbine systems for carbon dioxide
recovery. Greenhouse Gas Control Technologies. Proceedings of the Fourth
International Conference on Greenhouse Gas Control Technologies GHGT-4,
Interlaken Switzerland.
29. Griffin T., Bill A., Marion J.L., Nsakala Ny. (2002). CO2 control technologies: the
ALSTOM power approach. Proceedings of the 6th
Conference on Greenhouse Gas
Control Technologies GHGT-6, Kyoto, Japan.
30. Haines M.R. (1999). Producing electrical energy from natural gas using a solid
oxide fuel cell. Patent (WO 99/10945), pp. 1-14.
31. Suwanwarangkul R., Zhang W. (2002) Solid Oxide Fuel Cell Research at the
University of Waterloo. Dep. of Chemical Engineering, University of Waterloo.
32. Yuan J., Sunden B. (2005) Analysis of intermediate temperature solid oxide fuel
cell transport processes and performance. Journal of Heat Transfer vol. 127, pp.
1380-1390.

52
33. Jonsson M. (2008). Transport in the porous electrodes in SOFC’s. MVK160 Heat
and Mass Transport Project Report, Lund University, Sweden.
34. Calise F., Dentice d‟Accadia M., Palombo A. (2007). A Detailed One Dimensional
Finite-Volume Simulation Model of a Tubular SOFC and a Pre-Reformer.
International Journal of Thermodynamics. Vol. 10 (No. 3), pp. 87-96.
35. Pramuanjaroenkij A., Kakac S., Zhou X.Y. (2008). Mathematical analysis of
planar solid oxide fuel cells. International Journal of Hydrogen Energy vol. 33, pp.
2547-2565, Elsevier Science Ltd.
36. Kakac S., Pramuanjaroenkij A., Zhou X. Y. (2007). A review of numerical
modeling of solid oxide fuel cells. International Journal of Hydrogen Energy vol.
32, pp. 761-786, Elsevier Science Ltd.
37. Bove R., Ubertini S. (2006). Modeling solid oxide fuel cell operation: Approaches,
techniques and results. Journal of Power Sources vol. 159, pp. 543-559, Elsevier
Science Ltd.
38. Hwang JJ., Chen CK., Lai DY. (2005) Computational analysis of species transport
and electrochemical characteristics of a MOLB-type SOFC. Journal of Power
Sources vol. 140 pp. 235-242.
39. Mulas M., Murgia G. et al (2005) A quasi-3D computer model of a planar solid-
oxide fuel cell stack. In: The third international energy conversion engineering
conference, San Francisco, USA.
40. Dollard W.J. (1992). Journal of Power Sources vol. 30, pp. 133.
41. Drenckhahn W. (1999). Journal of European Ceramic Society vol. 19, pp. 861.
42. Liu M. (2007). Solid Oxide Fuel Cells – The Power for the 21st Century. Research
and modeling at Georgia Institute of Technology, Atlanta, USA.
43. O‟Hayre R., Prinz F.B. (2004). The Air/Platinum/Nafion Triple-Phase Boundary:
Characteristics, Scaling, and Implications for Fuel Cells. Journal of The
Electrochemical Society vol. 151, pp. 756-762.
44. Deng X., Petric A., (2005). Geometrical modeling of the triple-phase-boundary in
solid oxide fuel cells. Journal of Power Sources vol. 140, pp. 297-303.
45. Ni M., Leung D.Y.C. et al (2009). Electrochemical modeling and parametric study
of methane fed solid oxide fuel cells. Energy Conversion and Management vol. 50,
pp. 268-278, Elsevier Science Ltd.
46. O‟Hayre R., Barnett D.M., Prinz F.B. (2005). The Triple Phase Boundary – A
Mathematical Model and Experimental Investigations for Fuel Cells. Journal of
The Electrochemical Society vol. 152 (2), pp. 439-444.
47. Arpino F., Massarotti N. (2008). Numerical simulation of mass and energy
transport phenomena in solid oxide fuel cells. Article in Press, Energy, pp. 1-9,
Elsevier Science Ltd.
48. Costamagna P., Magistri L., Massardo A.F. (2001). Design and part-load
performance of a hybrid system based on a solid oxide fuel cell reactor and a
micro turbine. Journal of Power Sources vol. 96, pp. 352-368, Elsevier Science
Ltd.

53
49. Debendetti P.G., Vayenas C.G. (1983). Steady-state analysis of high temperature
fuel cells. Chemical Engineering Science vol. 38(11), pp. 1817-1829.
50. Wepfer W.J., Woolsey M.H. (1985). High Temperature Fuel Cells for Power
Generation. Energy Conversion vol. 25(4), pp. 477-486, Mgmt.
51. Ahmed S., McPheeters C., Kumar R. (1991). Thermal-hydraulic model of
monolithic solid oxide fuel cell. Journal of Electrochemical Society, vol. 138(9).
52. Achenbach E. (1994). Three-dimensional and time dependent simulation of a
planar solid oxide fuel cell stack. Journal of Power Sources vol. 49, pp. 333-348.
53. Hendriksen P. (1996). SOFC modeling 2: Unit cell. Materials Department, Riso
National Laboratory, Denmark.
54. Costamagna P., Honnegger K. (1998). Modeling of solid oxide heat exchanger
integrated stacks and simulation at high fuel utilization. Journal of
Electrochemical Society vol. 145(11), pp. 3995-4007.
55. Chan S.H., Ding O.L. (2005). Simulation of a solid oxide fuel cell power system
fed by methane. International Journal of Hydrogen Energy vol. 30, pp. 167-179.
56. Douvartzides S., Coutelieris F., Tsiakaras P. (2004). Exergy analysis of a solid
oxide fuel cell power plant fed by either ethanol or methane. Journal of Power
Sources vol. 131, pp. 224-230.
57. Xi H. (2007). Dynamic Modeling and Control of Planar SOFC Power Systems.
Ph.D. dissertation, Michigan.
58. Braun R. (30th
October 2008). Modeling, Analysis, and Optimization of IGFC
Systems (Task I-C). U.S. Department of Energy NETL Project Review Meeting.
59. Kvamsdal H.M., Jordal K., Bolland O. (2007). A quantitative comparison of gas
turbine cycles with CO2 capture. Energy vol. 32, pp. 10-24, Elsevier Science Ltd.

TH
E S
CH
OO
L F
O
R R E N E W A B L E E NE R
GY
SC
IE
NC
E
I C E L A N D
© 2009RES | the School for Renewable Energy Science, Iceland

A - 1


![INDUSTRIAL PNEUMATICS - fittings€¦ · MW-2007003 6 MW-2L07004 8 MW-2007005 10 MW-2007006 12 MW-2007007 14 Tee adapter, brass R 5 code hose O.D. [mm] MW-2005A02 3 MW-2005A01 3.17](https://static.documents.pub/doc/80x56/6020b0177745f5137a1d1da5/industrial-pneumatics-fittings-mw-2007003-6-mw-2l07004-8-mw-2007005-10-mw-2007006.jpg)
