72
TM TECHNOLOGY SOLUTIONS LIMITED CONSOLIDATED AND SEPARATE ANNUAL FINANCIAL STATEMENTS 2018 REACH NEW HORIZONS BY FORGING JOURNEYS OF GROWTH

TM
TECHNOLOGY SOLUTIONS LIMITED
CONSOLIDATED AND SEPARATE ANNUAL FINANCIAL STATEMENTS 2018
REACH NEW HORIZONSBY FORGING JOURNEYS
OF GROWTH

AYO Technology Solutions Limited (previously Sekunjalo Technology Solutions Limited)(Registration number: 1996/014461/06)Consolidated and separate annual financial statements for the year ended 31 August 2018
These consolidated and separate annual financial statements were internally prepared by:Chwayita Peter CA(SA)Group financial manager
Auditors BDO Cape Inc. (formerly Grant Thornton Cape Inc.)Chartered Accountants (SA)Registered AuditorsRegistration number: 1995/002310/21
SecretaryR Nock

2 Directors’ responsibilities and approval
4 Independent auditor’s report
9 Directors’ report
12 Statement of financial position
13 Statements of profit or loss and other comprehensive income
14 Statement of changes in equity
16 Statement of cash flows
17 Notes to the consolidated and separate annual financial statements
68 Analysis of shareholder information
69 Shareholders’ diary
Contents

AYO Technology Solutions Limited I CONSOLIDATED AND SEPARATE ANNUAL FINANCIAL STATEMENTS 20182
TM
TECHNOLOGY SOLUTIONS LIMITED
DIRECTORS’ RESPONSIBILITIES AND APPROVAL
The directors are required in terms of the Companies Act of South Africa to maintain adequate accounting records and are responsible for the content and integrity of the consolidated and separate annual financial statements and related financial information included in this report. It is their responsibility to ensure that the consolidated and separate annual financial statements fairly present the state of affairs of the Group as at the end of the financial year and the results of its operations and cash flows for the period then ended, in conformity with International Financial Reporting Standards. The external auditors are engaged to express an independent opinion on the consolidated and separate annual financial statements.
The consolidated and separate annual financial statements are prepared in accordance with International Financial Reporting Standards (‘IFRS’) as issued by the International Accounting Standards Board (‘IASB’), the Financial Reporting Guides as issued by the South African Institute of Chartered Accountants (‘SAICA’) Accounting Practices Committee, Financial Pronouncements as issued by the Financial Reporting Standards Council, the JSE Listings Requirements and the requirements of the Companies Act of South Africa, as amended, and are based upon appropriate accounting policies consistently applied and supported by reasonable and prudent judgements and estimates.
The directors acknowledge that they are ultimately responsible for the system of internal financial control established by the Group and the Company and place considerable importance on maintaining a strong control environment. To enable the directors to meet these responsibilities, the Board of Directors sets standards for internal control aimed at reducing the risk of error or loss in a cost-effective manner. The standards include the proper delegation of responsibilities within a clearly defined framework, effective accounting procedures and adequate segregation of duties to ensure an acceptable level of risk. These controls are monitored throughout the Group and all employees are required to maintain the highest ethical standards in ensuring the Group’s business is conducted in a manner that in all reasonable circumstances is above reproach. The focus of risk management in the Group is on identifying, assessing, managing and monitoring all known forms of risk across the Group. While operating risk cannot be fully eliminated, the Group endeavours to minimise it by ensuring that appropriate infrastructure, controls, systems and ethical behaviour are applied and managed within predetermined procedures and constraints.
The directors are of the opinion, based on the information and explanations given by management, that the system of internal control provides reasonable assurance that the financial records may be relied on for the preparation of the consolidated and separate annual financial statements. However, any system of internal financial control can provide only reasonable, and not absolute, assurance against material misstatement or loss.
The directors have reviewed the Group’s cash flow forecast for the next 12 months and, in light of this review and the current financial position, they are satisfied that the Group has or had access to adequate resources to continue in operational existence for the foreseeable future.
The external auditors are responsible for independently auditing and reporting on the Group’s consolidated and separate annual financial statements. The consolidated and separate annual financial statements have been examined by the Group’s external auditors and their report is presented on pages 4 to 8.
The consolidated and separate annual financial statements set out on page 12 to 67, which have been prepared on the going concern basis, were approved by the Board of Directors on 7 November 2018 and were signed on their behalf by:
Dr Wallace Amos Mgoqi Naahied Gamieldien

CONSOLIDATED AND SEPARATE ANNUAL FINANCIAL STATEMENTS 2018 3
DIRECTORS’ INTEREST IN CONTRACTSDuring the period under review, no director had any material interest in any contract of significance with AYO Technology Solutions Limited, any of its subsidiaries, associate or joint venture that would give rise to a conflict of interest in the ordinary course of business other than those disclosed in the related party notes. Related party transactions with the directors are disclosed in note 39 of the financial statements.
GROUP SECRETARIAL CERTIFICATIONIn terms of section 88(2)(e) of the Companies Act, as amended, I certify that the Company has lodged with the Commissioner all such returns as are required of a Public Company in terms of the Companies Act and that all such returns are true, correct and up to date.
All directors have access to the advice and services of the Company secretary who provides guidance to the Board as a whole and to individual directors with regard to corporate governance and how they should discharge their responsibilities in the best interests of the Group and Company.
Dr Wallace Amos MgoqiIndependent non-executive chairman
Cape Town
DIRECTORS’ RESPONSIBILITIES AND APPROVAL (CONTINUED)
AYO Technology Solutions Limited I CONSOLIDATED AND SEPARATE ANNUAL FINANCIAL STATEMENTS 20184
TM
TECHNOLOGY SOLUTIONS LIMITED
INDEPENDENT AUDITOR’S REPORTto the shareholders of AYO Technology Solutions
OPINION We have audited the consolidated and separate financial statements of AYO Technology Solutions Limited (the “Group”) set out on pages 12 to 67, which comprise the consolidated and separate statement of financial position as at 31 August 2018, and the consolidated and separate statement of profit or loss and other comprehensive income, consolidated and separate statement of changes in equity and consolidated and separate statement of cash flows for the year then ended, and notes to the financial statements, including a summary of significant accounting policies.
In our opinion, the consolidated and separate financial statements present fairly, in all material respects, the financial position of AYO Technology Solutions Limited as at 31 August 2018 and its financial performance and cash flows for the year then ended in accordance with the International Financial Reporting Standards (“IFRS”) and the requirements of the Companies Act of South Africa.
BASIS FOR OPINION We conducted our audit in accordance with International Standards on Auditing (ISAs). Our responsibilities under those standards are further described in the Auditor’s Responsibilities for the Audit of the Financial Statements section of our report. We are independent of the company in accordance with the Independent Regulatory Board for Auditors Code of Professional Conduct for Registered Auditors (IRBA Code) and other independence requirements applicable to performing audits of financial statements in South Africa. We have fulfilled our other ethical responsibilities in accordance with the IRBA Code and in accordance with other ethical requirements applicable to performing audits in South Africa. The IRBA Code is consistent with the International Ethics Standards Board for Accountants Code of Ethics for Professional Accountants (Parts A and B). We believe that the audit evidence we have obtained is sufficient and appropriate to provide a basis for our opinion.
KEY AUDIT MATTERS Key audit matters are those matters that, in our professional judgement, were of most significance in our audit of the financial statements of the current period. These matters were addressed in the context of our audit of the financial statements as a whole, and in forming our opinion thereon, and we do not provide a separate opinion on these matters.

CONSOLIDATED AND SEPARATE ANNUAL FINANCIAL STATEMENTS 2018 5
INDEPENDENT AUDITOR’S REPORT (CONTINUED)to the shareholders of AYO Technology Solutions
Key audit matter How our audit addressed the key audit matterValuation of subsidiaries (Separate annual financial statements)Investment in subsidiaries are carried at fair value through profit or loss. The valuation of these investments are based on an entity discounted cash flow valuation technique.
The use of a discounted cash flow valuation requires the estimation of a number of significant inputs, including the future expected cash flows and the weighted average cost of capital used to perform the discounting.
In determining the fair value of the subsidiary companies, which are not traded in an active market, valuation techniques which require significant judgement and estimates are applied by management.
These are in accordance with Level 3 inputs as per International Financial Reporting Standard 13 Fair Value Measurement (IFRS 13). The judgements are based on existing market conditions, determined at the end of each reporting period to determine the fair value of these financial instruments.
Accordingly, the valuation of investment in subsidiaries at fair value through profit or loss was considered to be a key audit matter, due to the significant contribution to results of the separate financial statements as well as the significance of the assumptions, estimates and the level of judgement involved.
The disclosures relating to investment in subsidiaries are contained in note 1 (accounting policies) and notes 6 and 38 (financial disclosures).
In assessing the fair value of the unlisted investments, we obtained an understanding of the overall control environment as well as the processes which have been implemented by management and which have been overseen by the board of directors.
Our audit procedures included an assessment of the reasonability of the forecast which was done by performing the following:
• Tested the mathematical accuracy of the valuation models, by performing a recalculation of each valuation;
• Assessed the budgeting process, and confirming reasonability of the forecasts;
• Agreed management forecast to the approved budgets;• Compared the actual performance to that of previous years
forecast; and• Compared the prior year valuation to this year’s valuation
to assess the reasonableness of management’s estimate.
We have assessed the key inputs in the valuation models by performing the following procedures:
• Compared the inputs to the weighted average cost of capital discount rate to independently obtained data such as the cost of debt, risk free rates in the market, market risk premiums, debt/equity ratios as well as the beta of comparable companies.
• We utilised our internal valuation experts, who have assessed the reasonableness and appropriateness of the key inputs.
We have assessed managements’ qualifications, experience and expertise with respect to the valuation performed.
We inspected the disclosures in the financial statements in relation to the valuation of unlisted investments for compliance with International Financial Reporting Standards.

AYO Technology Solutions Limited I CONSOLIDATED AND SEPARATE ANNUAL FINANCIAL STATEMENTS 20186
TM
TECHNOLOGY SOLUTIONS LIMITED
INDEPENDENT AUDITOR’S REPORT (CONTINUED)to the shareholders of AYO Technology Solutions
Key audit matter How our audit addressed the key audit matterValuation of goodwill and intangible assets(Consolidated annual financial statements)Under IFRSs, the Group is required to annually test goodwill and intangible assets with an indefinite useful life for impairment. The test will compare the carrying amount of the asset with its recoverable amount, which is the higher of its value if sold (if known) and its value in use.
We have determined this is a key audit matter due to the judgement required by management in preparing a ‘value-in-use’ model to satisfy the impairment test. Forecasting future cash flows and applying an appropriate discount rate, inherently involves a high degree of estimation and judgement by management. Refer to note one (accounting policies) as well as notes 4 and 5.
Our audit procedures focused on evaluating and challenging the key assumptions used by management in conducting the impairment review. These procedures included, amongst others, the following:
• Reviewed the model for compliance with IAS 36 Impairment of Assets;
• Verified the mathematical accuracy and methodology appropriateness of the underlying model calculations;
• Evaluated the cash flow projections and the process by which they were developed, comparing the cash flows to the latest budgets, assessing the historical accuracy of the budgeting process;
• Assessed the key growth rate assumptions by comparing them to historical results, economic and industry forecasts, and assessing the discount rate by reference to the cost of capital of the Group; and
• Performed sensitivity analysis of the key assumptions in model.
We have also assessed whether disclosures made relating to the goodwill and intangible assets impairment was in accordance with International Financial Reporting Standards.
Completeness of related party disclosure(Consolidated annual financial statements)There are significant and complex transactions between the company and its’ subsidiaries and other related entities. Significant audit effort was required for testing the completeness of related party disclosures, as disclosed in note 26 of the Annual Financial Statements, resulting in this being regarded as a key audit matters.
Our procedures included, amongst others, the following:
• Identification of related parties through review of shareholder records, minutes of meetings, director’s registers, group structure and other records;
• Reviewed the prior year working papers for names of known related parties and compared to current year list of related parties;
• Obtained the list of known affiliations of those charged with governance and officers with other entities and compared this to client schedules;
• For related party transactions identified agreed the transactions to disclosure included in related entities financial statements or to the company’s general ledger as applicable; and
• Reviewed related party disclosures in the financial statements to determine if it is in accordance with IFRS.
• Obtained signed declarations of directors interests in contracts
• The general ledger was scanned for known related parties and:
• Ensured that all material recorded entries were included in the related party disclosure in the financials;
• Obtained an understanding of the transaction to determine whether it is within the scope of the entity’s ordinary business; and
• Agreed material transactions to supporting documents and board approvals where applicable

CONSOLIDATED AND SEPARATE ANNUAL FINANCIAL STATEMENTS 2018 7
INDEPENDENT AUDITOR’S REPORT (CONTINUED)to the shareholders of AYO Technology Solutions
OTHER INFORMATIONThe directors are responsible for the other information. The other information comprises the Directors’ Report, the Audit Committee’s Report and the Company Secretary’s Certificate as required by the Companies Act of South Africa, which we obtained prior to the date of this report, and the Annual Report, which is expected to be made available to us after that date. Other information does not include the consolidated and separate financial statements and our auditor’s report thereon.
Our opinion on the consolidated financial statements does not cover the other information and we do not express an audit opinion or any form of assurance conclusion thereon.
In connection with our audit of the consolidated financial statements, our responsibility is to read the other information and, in doing so, consider whether the other information is materially inconsistent with the consolidated financial statements or our knowledge obtained in the audit, or otherwise appears to be materially misstated. If, based on the work we have performed on the other information obtained prior to the date of this auditor’s report, we conclude that there is a material misstatement of this other information, we are required to report that fact. We have nothing to report in this regard.
RESPONSIBILITIES OF THE DIRECTORS FOR THE CONSOLIDATED FINANCIAL STATEMENTSThe directors are responsible for the preparation and fair presentation of the consolidated financial statements in accordance with International Financial Reporting Standards and the requirements of the Companies Act of South Africa, and for such internal control as the directors determine is necessary to enable the preparation of consolidated financial statements that are free from material misstatement, whether due to fraud or error.
In preparing the consolidated financial statements, the directors are responsible for assessing the group’s ability to continue as a going concern, disclosing, as applicable, matters related to going concern and using the going concern basis of accounting unless the directors either intend to liquidate the group or to cease operations, or have no realistic alternative but to do so.
AUDITOR’S RESPONSIBILITIES FOR THE AUDIT OF THE CONSOLIDATEDOur objectives are to obtain reasonable assurance about whether the consolidated financial statements as a whole are free from material misstatement, whether due to fraud or error, and to issue an auditor’s report that includes our opinion. Reasonable assurance is a high level of assurance, but is not a guarantee that an audit conducted in accordance with ISAs will always detect a material misstatement when it exists. Misstatements can arise from fraud or error and are considered material if, individually or in the aggregate, they could reasonably be expected to influence the economic decisions of users taken on the basis of these consolidated and separate financial statements.
As part of an audit in accordance with ISAs, we exercise professional judgement and maintain professional scepticism throughout the audit. We also:
• Identify and assess the risks of material misstatement of the consolidated financial statements, whether due to fraud or error, design and perform audit procedures responsive to those risks, and obtain audit evidence that is sufficient and appropriate to provide a basis for our opinion. The risk of not detecting a material misstatement resulting from fraud is higher than for one resulting from error, as fraud may involve collusion, forgery, intentional omissions, misrepresentations, or the override of internal control.
• Obtain an understanding of internal control relevant to the audit in order to design audit procedures that are appropriate in the circumstances, but not for the purpose of expressing an opinion on the effectiveness of the group’s internal control.
• Evaluate the appropriateness of accounting policies used and the reasonableness of accounting estimates and related disclosures made by the directors.
• Conclude on the appropriateness of the directors’ use of the going concern basis of accounting and based on the audit evidence obtained, whether a material uncertainty exists related to events or conditions that may cast significant doubt on the group’s and the company’s ability to continue as a going concern. If we conclude that a material uncertainty exists, we are required to draw attention in our auditor’s report to the related disclosures in the consolidated financial statements or, if such disclosures are inadequate, to modify our opinion. Our conclusions are based on the audit evidence obtained up to the date of our auditor’s report. However, future events or conditions may cause the group to cease to continue as a going concern.
• Evaluate the overall presentation, structure and content of the consolidated financial statements, including the disclosures, and whether the consolidated financial statements represent the underlying transactions and events in a manner that achieves fair presentation.
• Obtain sufficient appropriate audit evidence regarding the financial information of the entities or business activities within the group to express an opinion on the consolidated financial statements. We are responsible for the direction, supervision and performance of the group audit. We remain solely responsible for our audit opinion.
We communicate with the directors regarding, among other matters, the planned scope and timing of the audit and significant audit findings, including any significant deficiencies in internal control that we identify during our audit.

AYO Technology Solutions Limited I CONSOLIDATED AND SEPARATE ANNUAL FINANCIAL STATEMENTS 20188
TM
TECHNOLOGY SOLUTIONS LIMITED
INDEPENDENT AUDITOR’S REPORT (CONTINUED)to the shareholders of AYO Technology Solutions
We also provide the directors with a statement that we have complied with relevant ethical requirements regarding independence, and to communicate with them all relationships and other matters that may reasonably be thought to bear on our independence, and where applicable, related safeguards
From the matters communicated with the directors, we determine those matters that were of most significance in the audit of the consolidated financial statements of the current period and are therefore the key audit matters. We describe these matters in our auditor’s report unless law or regulation precludes public disclosure about the matter or when, in extremely rare circumstances, we determine that a matter should not be communicated in our report because the adverse consequences of doing so would reasonably be expected to outweigh the public interest benefits of such communication.
REPORT ON OTHER LEGAL AND REGULATORY REQUIREMENTSIn terms of the IRBA Rule published in Government Gazette Number 39475 dated 4 December 2015, we report that BDO Cape Inc. has been the auditor of AYO Technology Solutions Limited for 21 years.
BDO CAPE INCORPORATEDRegistered AuditorsPractice number: 970879-0000
Stephan CilliéDirectorRegistered AuditorChartered Accountant (SA)
14 December 2018
6th Floor, BDO House,123 Hertzog Boulevard, ForeshoreCape Town

CONSOLIDATED AND SEPARATE ANNUAL FINANCIAL STATEMENTS 2018 9
DIRECTORS’ REPORT
The directors have pleasure in submitting their report on the consolidated and separate annual financial statements of AYO Technology Solutions Limited and the Group for the year ended 31 August 2018.
1. NATURE OF BUSINESSAYO Technology Solutions Limited was incorporated in South Africa with interests in the information technology and communications industry. The activities of the Group are undertaken through the Company and its principal subsidiaries. The Group primarily operates in South Africa.
During the current year, the Group listed on the Johannesburg Stock Exchange (“JSE”) with effect from 21 December 2017. Further to the listing, the operating model of the Company was changed from being purely an investment holding Company to also being an operating Company. The Company provides managed services in the information and communication technology industry.
OVERVIEWAYO is a leading Broad-Based Black Economic Empowerment (“B-BBEE”) information and communications technology (“ICT”) company, servicing customers in Southern and Northern Africa, Europe and Mauritius.
AYO is fully compliant in terms of the new B-BBEE Act, 53 of 2002 as amended, ICT Sector Codes, and has exceeded the minimum ownership requirements of the new codes by having more than about 75% black ownership and more than 35% black female ownership. AYO’s empowerment is one of many key competitive advantages and has positioned itself well for the acquisition of large multinational customers, based locally in various sectors where the empowerment codes for procurement have been amended and have become significantly more onerous but advantageous for AYO. This was evidenced by the organic growth in revenues of 33% from R479 million to R639 million which includes the procurement of a major oil and gas multinational contract during the latter part of the year under review. The full benefit thereof will flow over future years.
AYO has a clear strategic roadmap, which includes building products and services both organically and through acquisitions. The strategy is driven by the “Go to Market” strategy focusing on offering customers platforms via on-premises, hybrid and cloud-based models (AYO Platforms) as well as innovative digital offerings (AYO Digital).These offerings are then presented to the market. The organic build-up and acquisitions strategy has been enabled through the capital raised during its listing in December 2017, with AYO holding significant growth capital planned for the deployment of its strategy in future. Since listing, AYO has shown progress in delivering on the strategy presented in its Pre-listing Statement (“PLS”). While certain key projects and transactions are still being finalised, numerous processes and timelines have been delayed and the variance in the results compared to the forecasted profits are mainly attributable to the following:
• A contract with a multinational company was scheduled to commence earlier in the reporting period which was delayed and only commenced in the latter part of the financial year. Since its inception this contract has been doing well.
• Preparation work was done for the implementation of the above contract whereby the Company incurred significant once-off contract costs.
• Significant costs have been absorbed in the operating costs line which are as a result of further once-off costs of the listing and capital raised.
• Acquisitions were not concluded within the expected timelines; however, one of the planned acquisitions was subsequently announced on SENS on 11 September 2018. Zaloserve Proprietary Limited (“Zaloserve”), being the acquiree, has revenues in excess of R1 billion, generates positive cash from operations of R75 million and an EBITDA of R70 million.
Extensive market engagement and a positive reception to AYO’s strategy by customers and acquisition targets have now seen continued growth in customers and the target pipeline which is expected to come to fruition during the 2019 financial year.
One of AYO’s major competitive advantages is that it has no legacy business or overhead structures preventing it from building a market-leading ICT provider with digital capability for its customers, thereby creating broad-based stakeholder value.
As a result of the listing, the ordinary issued share capital increased from 244 342 539 to 344 125 194 ordinary shares.
2. REVIEW OF FINANCIAL RESULTS AND ACTIVITIESThe consolidated and separate annual financial statements have been prepared in accordance with International Financial Reporting Standards (“IFRS”) as issued by the International Accounting Standards Board (“IASB”), the Financial Reporting Guides as issued by the South African Institute of Chartered Accountants (“SAICA”) Accounting Practices Committee, Financial Pronouncements as issued by the Financial Reporting Standards Council, the JSE Listing Requirements and the requirements of the Companies Act of South Africa, as amended. The accounting policies have been applied consistently compared to the prior year, except for the application of the new disclosure initiative in IAS 7.44A-44E.
FINANCIAL HIGHLIGHTS • Revenue increased by 33% from R479m to R639m.• Profit before tax increased by 390% from R40m to R196m.• Earnings per share increased from 7.86 cents to 47.20 cents.• Total assets increased from R292m to R4 671m.• Net asset value increased from R67m to R4 469m.• Net cash generated from operating activities increased by 243% from R40m to R137m.

AYO Technology Solutions Limited I CONSOLIDATED AND SEPARATE ANNUAL FINANCIAL STATEMENTS 201810
TM
TECHNOLOGY SOLUTIONS LIMITED
DIRECTORS’ REPORT (CONTINUED)
GROUP PERFORMANCEThe Group delivered satisfactory organic revenue and profit growth as a result of the strong contributions from all its underlying operations and investment activities for the year under review. Group revenue increased organically by 33% from R479m to R639m compared to the prior year, with all divisions starting to benefit from the Group’s synergies, empowerment credentials and excellent management expertise as well as gaining significant clients in various sectors.
The Group incurred significant once-off costs for its expansion of operational activities and listing costs. Note 9 has a detailed breakdown of the costs.
Profit before tax for the period increased by 390% from R40m to R196m, as a result of organic revenue growth and investment income from the capital raised on listing.
Cash generated from operations decreased from R53m in 2017 to an outflow of R59m in 2018, due to significant once-off costs for its expansion of operational activities and listing costs; however, net cash generated from operating activities increased by 243% from R40m to R137m.
Headline earnings per share (“HEPS”) increased from 5.66 cents to 48.32 cents and earnings per share (“EPS”) increased from 7.86 cents to 47.20 cents for the year under review.
The Group’s asset base increased from R292m to R4 671m, which includes the capital raised from the listing.
Net asset value (“NAV”) increased from R67m to R4 469m due to the capital raised from the listing and the asset growth of the underlying investments. The NAV per share increased from 15.23 cents to 1 292.75 cents.
As AYO embarked on the execution of its strategy, various costs increased to cater for the expected growth and the operational activities which commenced during the year under review.
SOFTWARE, CONSULTING AND SUPPORTThe software, consulting and support division focused mainly on digital consulting engagements and transformation projects, with revenue increasing by 3% from R71m to R73m.
HEAD OFFICERevenue improved significantly due the investment holding company becoming operational in the latter part of the financial year.
SECURITY SOLUTIONSThe security division focused on offering information technology security solutions to enterprises, with the key focus mainly on Identity and Access Governance Management. Revenue increased by 34% from R251m to R335m mainly due to new contracts based on improved and competitive B-BBEE credentials.
UNIFIED COMMUNICATIONSThe unified communications division is a reseller of telecommunications and gaming equipment from globally recognised brands. Revenue increased by 12% from R67m to R76m as a result of better alignment and leverage with its principal supplier and customer requirements. This division incurred initial setup costs relating to the establishment of a Mauritian subsidiary which will be utilised to service the rest of Africa in the future.
HEALTHCARE AND SUPPORTThe healthcare segment provides software and support in the healthcare industry having clients ranging from the private sector to government. Revenue increased from R91m to R101m as a result of the ever-improving products offered by this division.
Full details of the financial position, results of operations and cash flows of the Group are set out in these consolidated and separate annual financial statements.
3. SIGNIFICANT EVENTS DURING THE REPORTING PERIODEQUITY BASED SHARE PAYMENTAYO issued 31 960 000 shares at an issue price of R1,50 per share to a B-BBEE Consortium prior to its listing.
LISTING ON THE JSEAYO listed on the JSE on 21 December 2017, resulting in the issued share capital increasing from 244 342 539 to 344 125 194.
CHANGES IN THE BOARD OF DIRECTORS AND COMPANY SECRETARYMessrs. Kevin Hardy and Siphiwe Nodwele resigned as executive directors of the Company during the current financial year, following which Ms. Naahied Gamieldien was appointed as acting chief executive officer.
Dr. Wallace Mgoqi, Dr. Dennis George, Mr. Sello Rasethaba and Ms. Rosemary Mosia were appointed as independent non-executive directors to the Board of AYO, following the resignation of Messrs. Khalid Abdulla, Walter Madzonga, Telang Ntsasa and Ms. Mbuso Khoza from the Board. Mr. Salim Young has stepped down as the independent non-executive chairman of the Board but remains an independent non-executive director. The Board subsequently approved the appointment of Dr. Mgoqi as the Independent non-executive chairman of the Board.

11CONSOLIDATED AND SEPARATE ANNUAL FINANCIAL STATEMENTS 2018
DIRECTORS’ REPORT (CONTINUED)
Ms. Nobulungisa Mbaliseli resigned as the company secretary of AYO on 20 August 2018. Ms. Rodanchia Nock was appointed as the company secretary of AYO on 12 November 2018.
4. SHARE CAPITALAYO Technology Solutions Limited listed on the JSE on 21 December 2017 at an issue price of R43,00 per share, thereby raising R4,2 billion. Prior to the listing, 31 960 000 shares were issued to a B-BBEE Consortium at a price of R1,50 per share. Refer to note 15 of the consolidated and separate annual financial statements for detail of the movement in authorised and issued share capital.
5. DIVIDENDSThe Company’s dividend policy is to consider an interim and a final dividend in respect of each financial year. At its discretion, the Board of Directors may consider a special dividend, where appropriate. Depending on the perceived need to retain funds for expansion or operating purposes, the Board of Directors may pass on the payment of dividends.
After the reporting date the Board of Directors approved and declared a gross dividend of 30 cents per share for the year ended 31 August 2018 from income reserves. The dividend amount, net of South African dividend tax of 20%, which equates to 6 cents per share, is therefore 24 cents per share for those shareholders that are not exempt from dividend tax.
6. DIRECTORATEThe directors in office at the date of this report are as follows:
DIRECTORS DESIGNATION TERMCF Hendricks Non-executive
K Abdulla Non-executive Resigned 20 August 2018AB Amod Non-executiveN Gamieldien ExecutiveGW Madzonga Non-executive Appointed 10 November 2017 Resigned 20 August 2018 KAW Hardy Executive Appointed 17 November 2017 Resigned 23 August 2018 S Nodwele Executive Appointed 10 November 2017 Resigned 23 August 2018 S Young Non-executive Appointed 10 November 2017TM Ntsasa Non-executive Appointed 10 November 2017 Resigned 20 August 2018MF Khoza Non-executive Appointed 10 November 2017 Resigned 20 August 2018Dr W Mgoqi Chairman and non-executive Appointed 20 August 2018Dr D George Non-executive Appointed 20 August 2018R Mosia Non-executive Appointed 21 August 2018S Rasethaba Non-executive Appointed 24 August 2018N Ramathlodi Non-executive Appointed 7 March 2018
7. INTERESTS IN SUBSIDIARIES, ASSOCIATE AND JOINT ARRANGEMENTSDetails of material interests in subsidiary companies, associate and joint arrangements are presented in the consolidated and separate financial statements in notes 6, 7 and 8.
8. EVENTS AFTER THE REPORTING PERIODOn 21 August 2018, the Board of Directors approved the Company entering into a binding offer with Loxisource (Pty) Ltd and Alexisource (Pty) Ltd to acquire 55% of the share capital of Zaloserve (Pty) Ltd. Zaloserve is an investment holding Company that holds a 100% shareholding in Opiwize (Pty) Ltd, which in turn holds 100% shareholding in Sizwe Africa IT (Pty) Ltd. The investment will be purchased for R165 million. A payment of 90% of the Purchase Price will be settled upfront with the balance being settled upon the achievement of warranted profits for a 3-year period.
On 21 August 2018, the Board of Directors approved the Company entering into a joint venture with the Vunani Group an independent managed diversified financial services group. The formation of a R100 million fintech joint venture to expand the fintech platform and financial services activities of Vunani further diversifying the portfolio of AYO.
On 7 November 2018, the Board of Directors approved an amount of R1.5 billion to be invested with various asset managers to diversify their investment, with no one asset manager holding more than R400 million. Due to this the Company invested R400 million in 3 Laws Capital Proprietary limited.
9. GOING CONCERNThe directors believe that the Group and the Company have adequate financial resources to continue in operation for the foreseeable future and accordingly the consolidated and separate annual financial statements have been prepared on a going concern basis. The directors have satisfied themselves that the Group and the Company is in a sound financial position and that it has access to sufficient cash reserves to meet its foreseeable cash requirements. The directors are not aware of any new material changes that may adversely impact the Group and the Company. The directors are also not aware of any material non-compliance with statutory or regulatory requirements or of any pending changes to legislation which may affect the Group and the Company.

AYO Technology Solutions Limited I CONSOLIDATED AND SEPARATE ANNUAL FINANCIAL STATEMENTS 201812
TM
TECHNOLOGY SOLUTIONS LIMITED
STATEMENT OF FINANCIAL POSITIONfor the year ended 31 August 2018
Group Company
Figures in Rand Notes2018
R’0002017
R’0002018
R’0002017
R’000
ASSETSNon-current assetsProperty, plant and equipment 3 7 169 7 118 2 777 11Goodwill 4 35 248 43 410 – –Intangible assets 5 17 743 12 506 1 997 –Investments in subsidiaries 6 – – 414 974 477 646Investment in joint venture 7 33 33 – –Investment in associate 8 – – – –Loans to group companies 9 1 989 4 552 1 1Financial assets 10 6 890 747 6 127 –Deferred tax 11 3 710 10 034 – –
72 782 78 400 425 876 477 658Current assetsInventories 12 12 378 9 702 6 696 –Trade and other receivables 13 183 222 110 428 101 050 4 723Financial assets 10 93 390 19 266 92 304 3 024Current tax receivable 662 384 – –Cash and cash equivalents 14 4 308 698 74 229 4 246 813 2 269
4 598 350 214 009 4 446 863 10 016Total assets 4 671 132 292 409 4 872 739 487 674
EQUITY AND LIABILITIESEquityShare capital 15 4 444 410 184 130 4 444 410 184 130Reserves 16 11 777 (4) 11 809 –Retained earnings (7 501) (151 787) 216 876 126 517
4 448 686 32 339 4 673 095 310 647Non-controlling interest 20 294 34 752 – –
4 468 980 67 091 4 673 095 310 647
LIABILITIESNon-current liabilitiesLoans from shareholders 9 – 80 597 – 80 596Financial liabilities 17 – 50 – –Finance lease liabilities 18 575 2 549 – –Deferred tax 11 – – 79 094 85 833
575 83 196 79 094 166 429Current liabilitiesTrade and other payables 19 132 925 108 502 53 230 1 396Loans from shareholders 9 5 001 69 5 000 –Financial liabilities 17 1 133 5 692 – 4 724Finance lease liabilities 18 389 259 – –Operating lease liability 47 305 – –Deferred income 20 – 2 981 – –Current tax payable 41 636 8 372 55 653 –Provisions 21 15 390 12 473 6 667 4 478Bank overdraft 14 5 056 3 109 – –
201 577 141 762 120 550 10 598Liabilities on disposal groups held-for-sale 22 – 360 – –Total liabilities 202 152 225 318 199 644 177 027Total equity and liabilities 4 671 132 292 409 4 872 739 487 674
Net asset value per share (cents) 1,292.75 15.23 1,357.96 146.27Net tangible asset value per share (cents) 1,277.35 (11.10) 1,357.38 146.27
13CONSOLIDATED AND SEPARATE ANNUAL FINANCIAL STATEMENTS 2018
Group Company
Figures in Rand Notes2018
R’0002017
R’0002018
R’0002017
R’000
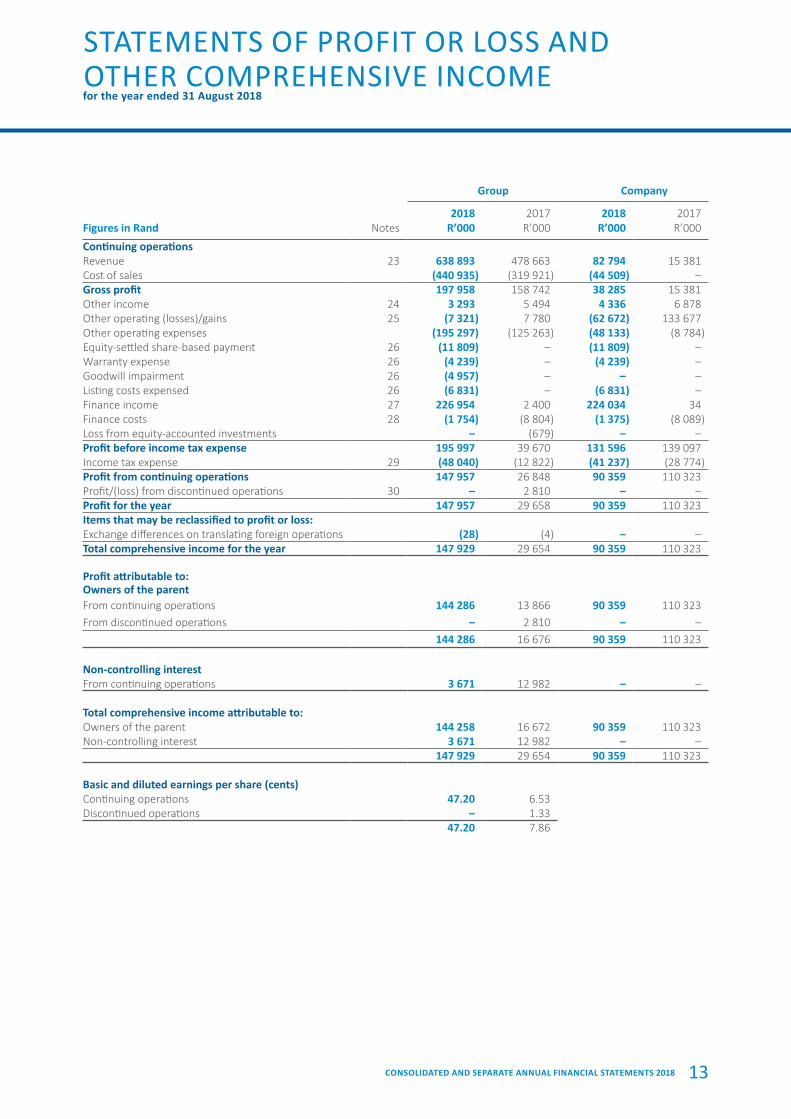
Continuing operationsRevenue 23 638 893 478 663 82 794 15 381Cost of sales (440 935) (319 921) (44 509) –Gross profit 197 958 158 742 38 285 15 381Other income 24 3 293 5 494 4 336 6 878Other operating (losses)/gains 25 (7 321) 7 780 (62 672) 133 677Other operating expenses (195 297) (125 263) (48 133) (8 784)Equity-settled share-based payment 26 (11 809) – (11 809) –Warranty expense 26 (4 239) – (4 239) –Goodwill impairment 26 (4 957) – – –Listing costs expensed 26 (6 831) – (6 831) –Finance income 27 226 954 2 400 224 034 34Finance costs 28 (1 754) (8 804) (1 375) (8 089)Loss from equity-accounted investments – (679) – –Profit before income tax expense 195 997 39 670 131 596 139 097Income tax expense 29 (48 040) (12 822) (41 237) (28 774)Profit from continuing operations 147 957 26 848 90 359 110 323Profit/(loss) from discontinued operations 30 – 2 810 – –Profit for the year 147 957 29 658 90 359 110 323Items that may be reclassified to profit or loss:Exchange differences on translating foreign operations (28) (4) – –Total comprehensive income for the year 147 929 29 654 90 359 110 323
Profit attributable to:Owners of the parentFrom continuing operations 144 286 13 866 90 359 110 323From discontinued operations – 2 810 – –
144 286 16 676 90 359 110 323
Non-controlling interestFrom continuing operations 3 671 12 982 – –
Total comprehensive income attributable to:Owners of the parent 144 258 16 672 90 359 110 323Non-controlling interest 3 671 12 982 – –
147 929 29 654 90 359 110 323
Basic and diluted earnings per share (cents)Continuing operations 47.20 6.53Discontinued operations – 1.33
47.20 7.86
STATEMENTS OF PROFIT OR LOSS AND OTHER COMPREHENSIVE INCOMEfor the year ended 31 August 2018

AYO Technology Solutions Limited I CONSOLIDATED AND SEPARATE ANNUAL FINANCIAL STATEMENTS 201814
TM
TECHNOLOGY SOLUTIONS LIMITED
STATEMENTS OF CHANGES IN EQUITYfor the year ended 31 August 2018
Share capital
Sharepremium
Total sharecapital
Foreigncurrency
translationreserve
Share-basedpayment
reserveTotal
reservesRetained
income
Totalattributable
to equityholders of
the Group/Company
Non-controlling
interestTotal
equity
GroupBalance at 1 September 2016 809 168 020 168 829 – – – (169 578) (749) 17 852 17 103Profit for the year – – – – – – 16 676 16 676 12 982 29 658Other comprehensive income – – – (4) – (4) – (4) – (4)Total comprehensive income for the year – – – (4) – (4) 16 676 16 672 12 982 29 654Dividends – – – – – – – – (5 985) (5 985)Share issue on acquisition of subsidiary 41 15 260 15 301 – – – – 15 301 – 15 301Acquisition of subsidiary with non-controlling interest – – – – – – 1 115 1 115 9 903 11 018Total contributions by and distributions to owners of Company recognised directly in equity 41 15 260 15 301 – – – 1 115 16 416 3 918 20 334Balance at 1 September 2017 850 183 280 184 130 (4) – (4) (151 787) 32 339 34 752 67 091Profit for the year – – – – – – 144 286 144 286 3 671 147 957Other comprehensive income – – – (28) – (28) – (28) – (28)Total comprehensive income for the year – – – (28) – (28) 144 286 144 258 3 671 147 929Issue of shares 4 338 594 – 4 338 594 – – – – 4 338 594 – 4 338 594Capitalised listing costs (78 314) – (78 314) – – – – (78 314) – (78 314)Equity-settled share-based payment – – – – 11 809 11 809 – 11 809 – 11 809Dividends – – – – – – – – (17 646) (17 646)Changes in ownership – disposal of subsidiary – – – – – – – – (483) (483)Total contributions by and distributions to owners of Company recognised directly in equity 4 260 280 – 4 260 280 – 11 809 11 809 – 4 272 089 (18 129) 4 253 960Balance at 31 August 2018 4 261 130 183 280 4 444 410 (32) 11 809 11 777 (7 501) 4 448 686 20 294 4 468 980Note 15 15 15 16 16
CompanyBalance at 1 September 2016 809 168 020 168 829 – – – 16 194 185 023 – 185 023Profit for the year – – – – – – 110 323 110 323 – 110 323Total comprehensive income – – – – – – 110 323 110 323 – 110 323Share issue on acquisition of subsidiary 41 15 260 15 301 – – – – 15 301 – 15 301Total contributions by and distributions to owners of Company recognised directly in equity 41 15 260 15 301 – – – – 15 301 – 15 301Balance at 1 September 2017 850 183 280 184 130 – – – 126 517 310 647 – 310 647Profit for the year – – – – – – 90 359 90 359 – 90 359Total comprehensive income for the year – – – – – – 90 359 90 359 – 90 359Issue of shares 4 338 594 – 4 338 594 – – – – 4 338 594 – 4 338 594Capitalised listing costs (78 314) – (78 314) – – – – (78 314) – (78 314)Equity-settled share-based payment – – – – 11 809 11 809 – 11 809 – 11 809Total contributions by and distributions to owners of Company recognised directly in equity 4 260 280 – 4 260 280 – 11 809 11 809 – 4 272 089 – 4 272 089Balance at 31 August 2018 4 261 130 183 280 4 444 410 – 11 809 11 809 216 876 4 673 095 – 4 673 095Note 15 15 15 16

15CONSOLIDATED AND SEPARATE ANNUAL FINANCIAL STATEMENTS 2018
STATEMENTS OF CHANGES IN EQUITY (CONTINUED)for the year ended 31 August 2018
Share capital
Sharepremium
Total sharecapital
Foreigncurrency
translationreserve
Share-basedpayment
reserveTotal
reservesRetained
income
Totalattributable
to equityholders of
the Group/Company
Non-controlling
interestTotal
equity
GroupBalance at 1 September 2016 809 168 020 168 829 – – – (169 578) (749) 17 852 17 103Profit for the year – – – – – – 16 676 16 676 12 982 29 658Other comprehensive income – – – (4) – (4) – (4) – (4)Total comprehensive income for the year – – – (4) – (4) 16 676 16 672 12 982 29 654Dividends – – – – – – – – (5 985) (5 985)Share issue on acquisition of subsidiary 41 15 260 15 301 – – – – 15 301 – 15 301Acquisition of subsidiary with non-controlling interest – – – – – – 1 115 1 115 9 903 11 018Total contributions by and distributions to owners of Company recognised directly in equity 41 15 260 15 301 – – – 1 115 16 416 3 918 20 334Balance at 1 September 2017 850 183 280 184 130 (4) – (4) (151 787) 32 339 34 752 67 091Profit for the year – – – – – – 144 286 144 286 3 671 147 957Other comprehensive income – – – (28) – (28) – (28) – (28)Total comprehensive income for the year – – – (28) – (28) 144 286 144 258 3 671 147 929Issue of shares 4 338 594 – 4 338 594 – – – – 4 338 594 – 4 338 594Capitalised listing costs (78 314) – (78 314) – – – – (78 314) – (78 314)Equity-settled share-based payment – – – – 11 809 11 809 – 11 809 – 11 809Dividends – – – – – – – – (17 646) (17 646)Changes in ownership – disposal of subsidiary – – – – – – – – (483) (483)Total contributions by and distributions to owners of Company recognised directly in equity 4 260 280 – 4 260 280 – 11 809 11 809 – 4 272 089 (18 129) 4 253 960Balance at 31 August 2018 4 261 130 183 280 4 444 410 (32) 11 809 11 777 (7 501) 4 448 686 20 294 4 468 980Note 15 15 15 16 16
CompanyBalance at 1 September 2016 809 168 020 168 829 – – – 16 194 185 023 – 185 023Profit for the year – – – – – – 110 323 110 323 – 110 323Total comprehensive income – – – – – – 110 323 110 323 – 110 323Share issue on acquisition of subsidiary 41 15 260 15 301 – – – – 15 301 – 15 301Total contributions by and distributions to owners of Company recognised directly in equity 41 15 260 15 301 – – – – 15 301 – 15 301Balance at 1 September 2017 850 183 280 184 130 – – – 126 517 310 647 – 310 647Profit for the year – – – – – – 90 359 90 359 – 90 359Total comprehensive income for the year – – – – – – 90 359 90 359 – 90 359Issue of shares 4 338 594 – 4 338 594 – – – – 4 338 594 – 4 338 594Capitalised listing costs (78 314) – (78 314) – – – – (78 314) – (78 314)Equity-settled share-based payment – – – – 11 809 11 809 – 11 809 – 11 809Total contributions by and distributions to owners of Company recognised directly in equity 4 260 280 – 4 260 280 – 11 809 11 809 – 4 272 089 – 4 272 089Balance at 31 August 2018 4 261 130 183 280 4 444 410 – 11 809 11 809 216 876 4 673 095 – 4 673 095Note 15 15 15 16

AYO Technology Solutions Limited I CONSOLIDATED AND SEPARATE ANNUAL FINANCIAL STATEMENTS 201816
TM
TECHNOLOGY SOLUTIONS LIMITED
STATEMENT OF CASH FLOWSfor the year ended 31 August 2018
Group Company
Figures in Rand Notes2018
R’0002017
R’0002018
R’0002017
R’000
Cash flows from operating activitiesCash receipts from customers 306 388 459 785 196 044 5 445Cash paid to suppliers and employees (365 318) (406 615) (254 562) 14 515Cash generated from operations 32 (58 930) 53 170 (58 518) 19 960Finance income 215 243 2 579 205 207 34Finance costs (2 220) (8 804) (1 375) (8 089)Tax paid 33 (16 735) (6 954) – –Net cash from operating activities 137 358 39 991 145 314 11 905
Cash flows from investing activitiesAcquisition of property, plant and equipment 3 (4 636) (3 380) (2 943) (11)Proceeds on disposal of property, plant and equipment 3 58 92 – 5Proceeds from sale of assets held for sale 827 – 824 –Costs incurred on internally generated intangible assets 5 (3 823) (1 205) – –Acquisition of intangible assets 5 (2 230) – (2 230) –Net cash outflow on disposal of subsidiary 35 (314) – – –Acquisition of subsidiary, net cash acquired – (1 559) – (14 525)Proceeds from disposal of subsidiary 35 – 17 140 – –Proceeds from loans from group companies 3 029 10 483 – –Proceeds from disposal of financial assets 38 415 728 – 400 000 –Acquisition of financial assets 38 (479 560) (13 612) (479 560) (266)Net cash to investing activities (70 921) 7 959 (83 909) (14 797)
Cash flows from financing activities –Proceeds on share issue 15 4 338 594 – 4 338 594 –Transaction costs related to share issue 15 (78 314) – (78 314) –Proceeds from financial liabilities – 265 – –Repayment of financial liabilities (4 583) – (4 724) (3 160)Proceeds from loans from shareholder 6 950 – 5 000 8 208Repayment of loans from group companies (77 424) – (77 417) –Advance of staff loan(s) (108) – – –Repayment of shareholders loan – (530) – –Purchase of financial assets – (3 256) – –Finance lease payments (1 384) (886) – –Dividends paid (17 646) (5 985) – –Net cash to financing activities 4 166 085 (10 392) 4 183 139 5 048
Total cash movement for the year 4 232 522 37 558 4 244 544 2 156Cash at the beginning of the year 71 120 33 562 2 269 113Total cash at the end of the year 14 4 303 642 71 120 4 246 813 2 269

CONSOLIDATED AND SEPARATE ANNUAL FINANCIAL STATEMENTS 2018 17
1. SIGNIFICANT ACCOUNTING POLICIESThe principal accounting policies applied in the preparation of these consolidated and separate annual financial statements are set out below.
1.1 BASIS OF PREPARATIONThe consolidated and separate annual financial statements are prepared in accordance with International Financial Reporting Standards (“IFRS”), the SAICA Financial Reporting guides as issued by the Accounting Practices Committee, the Financial Reporting Pronouncements as issued by the Financial Reporting Standards Council, the Companies Act of 2008, as amended, and the JSE Listings Requirements.
These accounting policies are consistent with the previous period, except for application of the new disclosure initiative in IAS 7.44A-44E.
ADOPTION OF NEW AND REVISED STANDARDSNo standards, interpretations and amended standards not yet effective at reporting date have been adopted during the year, except for application of the new disclosure initiative in IAS 7.44A-44E.
1.2 SEGMENTAL REPORTINGOperating segments are reported in a manner consistent with the internal reporting provided to the chief operating decision maker. The chief operating decision-maker, who is responsible for allocating resources and assessing performance of the operating segments, has been identified as the executive management.
Business segments comprise the following, which are aggregated upon consolidation:
• Head office relates to the operations of the Company.
• Software and consulting relates to Software Tech Holdings Group.
• Healthcare and support relates to Health Systems Technologies Proprietary Limited.
• Security relates to Puleng Technologies Proprietary Limited.
• Unified communications relates to Kalula Communications Proprietary Limited.
Segment results include revenue and expenses directly attributable to a segment and the relevant portion of enterprise revenue and expenses that can be allocated on a reasonable basis to a segment, whether from external transactions with other Group segments.
Segment assets and liabilities comprise the operating assets and liabilities that are directly attributable to the segment or can be allocated to the segment on a reasonable basis. Segment assets are determined after deducting related allowances that are reported as direct offsets in the Group’s statement of financial position. Capital expenditure represents the total costs incurred during the period to acquire segment assets that are expected to be used during more than one period, namely property, plant and equipment, and intangible assets other than goodwill.
The basis of segmental reporting has been set out in note 36.
1.3 SIGNIFICANT JUDGEMENTSThe preparation of consolidated and separate annual financial statements in conformity with the International Financial Reporting Standards requires management, from time to time, to make judgements, estimates and assumptions that affect the application of policies and reported amounts of assets, liabilities, income and expenses. Use of available information and the application of judgements are inherent in the formation of estimates. Actual results in the future could differ from these estimates which may be material to the annual financial statements. The estimates and underlying assumptions are reviewed on an ongoing basis. Revisions to accounting estimates are recognised in the period in which the estimates are revised and in any future periods affected. Significant judgements include:
• the estimation of the useful lives of property, plant and equipment is based on historic performance as well as expectations about future use of and therefore require a significant degree of judgement to be applied by management. These depreciation rates represent management’s current best estimate of the useful lives of the assets.
APPLICATION OF METHODOLOGYFree cash flow (FCF) forecasts are prepared year-by-year for a minimum of a three-year period and for a period of five to ten years for high-growth companies.
NOTES

AYO Technology Solutions Limited I CONSOLIDATED AND SEPARATE ANNUAL FINANCIAL STATEMENTS 201818
TM
TECHNOLOGY SOLUTIONS LIMITED
1. SIGNIFICANT ACCOUNTING POLICIES (CONTINUED)1.3 SIGNIFICANT JUDGEMENTS (CONTINUED)
FAIR VALUE ESTIMATIONThe fair value of financial instruments that are not traded in an active market is determined by using valuation techniques. The Group uses a variety of methods and makes assumptions that are based on market conditions existing at each reporting date. Discounted cash flows are used to determine fair value for the investments in subsidiary companies. The use of discounted cash flow analysis requires the estimation of a number of significant components, including the future expected cash flows, and the weighted average cost of capital used to perform the discounting. Many of these factors may have a material impact on the valuation.
TERMINAL VALUE GROWTH RATESWhen calculating the terminal value, growth rates in excess of the current inflation rate are not utilised. Real growth beyond ten years is not likely, and even if likely, is difficult to forecast with any certainty. The growth rates used are between 4.5% and 6% for the Group.
TERMINAL VALUESWhen calculating the terminal value, care is taken regarding the level of net capital investment assumed. This is assumed to be lower than during the specific forecast for high-growth companies. For mature, stable companies net capital investment during the specific forecast period and beyond is assumed to be the same.
DISCOUNT RATESFree cash flows are discounted at the Group’s weighted average cost of capital (WACC), being the weighted cost of equity as determined using the capital asset pricing model (CAPM) and the weighted after-tax cost of debt and/or any other non-equity form of financing. The discount rates used are between 15% and 26% within the divisions in the Group.
RISK-FREE RATEThe risk-free rate utilised is the yield on ten-year government bonds. These yields were obtained from the financial press at the time of preparing the valuations. Where no ten-year SA bonds are in issue, the nearest long-term SA bond rate should be used. The risk-free rate used was in the range of 7.5% and 8.5%.
BETAThe equally weighted average of the relevant industry betas are used. The betas are calculated over a five-year period (where possible). This is assumed to provide a fair estimate of the Group’s recent market price. The beta used for the Group was in the range of 0.68 and 1.4.
MARKET RISK PREMIUMA market risk premium was utilised in all valuations. The market risk premium used was in the range of 4% and 8%.
VALUE OF EQUITYThe value of equity will be equal to the free cash flow value of the entity, less the carrying values (at the valuation date) of debt and any other form of financing, plus cash on hand (per the financial position) which is in excess of normal working capital requirements.
TRADE RECEIVABLES AND LOANS AND RECEIVABLESThe Group assesses its trade receivables and loans and receivables for impairment at the end of each reporting date. In determining whether an impairment loss should be recognised in profit or loss, the Group makes judgements as to whether there is observable data indicating a measurable decrease in the estimated future cash flows from the financial asset.
IMPAIRMENT TESTINGAssets are subject to regular impairment reviews as required. Impairments are measured as the difference between the cost (or amortised cost) of a particular asset and the recoverable amount which is the greater of the fair value less cost to sell and value in use of the asset. Impairments are recorded in the statement of comprehensive income in the period in which the occur. The Group’s policy in relation to impairment testing in respect of goodwill is detailed below.
The recoverable amount of the cash-generating units has been determined based on a value-in-use calculation. Key assumptions applied to determine the recoverable amount of the cash-generating units, using the value in-use calculation relating to sales growth rates, working capital requirements and capital expenditure. Cash flow projections were based on historical information and financial budgets approved by senior management covering a five-year period.
NOTES (CONTINUED)

CONSOLIDATED AND SEPARATE ANNUAL FINANCIAL STATEMENTS 2018 19
1. SIGNIFICANT ACCOUNTING POLICIES (CONTINUED)1.3 SIGNIFICANT JUDGEMENTS (CONTINUED)
IMPAIRMENT TESTING (CONTINUED)The following assumptions were utilised:
Pre-tax discount rates 15% – 26%Number of years 5Growth rate 4.5% – 6%
TAXATIONJudgement is required in determining income taxes due to the complexity of legislation. The Group recognises liabilities for anticipated tax audit issues based on estimates of whether additional taxes will be due. Where the final tax outcome of these matters is different from the amounts that were initially recorded, such differences will impact the income tax and deferred tax provisions in the period in which such determination is made.
The Group recognises the net future tax benefit related to deferred income tax assets to the extent that it is probable that the deductible temporary differences will reverse in the foreseeable future. Assessing the recoverability of deferred income tax assets requires the Group to make significant estimates related to expectations of future taxable income. Estimates of future taxable income are based on forecast cash flows from operations and the application of existing tax laws in each jurisdiction. To the extent that future cash flows and taxable income differ significantly from estimates, the ability of the Group to realise the net deferred tax assets recorded at the reporting date could be impacted.
INVESTMENT IN EQUITY-ACCOUNTED INVESTMENTSLosses from equity-accounted investments in excess of the Group’s interest are recognised only to the extent that the Group has incurred a legal or constructive obligation to make payments on behalf of the investments held in equity-accounted investments. Additionally, an investment in an associate is recognised when the Group has the power to participate in the financial and operating policy decisions of the investee over those policies.
When the Group obtains significant influence of an investment previously held at fair value through profit and loss, the Group accounts for investments in associates at fair value in line with business combinations, which is deemed to be the cost. This deemed cost is adjusted for post-acquisition changes in the Group’s share of net assets of the associate, less any impairment losses.
1.4 PROPERTY, PLANT AND EQUIPMENTProperty, plant and equipment items are measured at cost less accumulated depreciation and any accumulated impairment losses.
Subsequent expenditure is capitalised only if it is probable that the future economic benefits associated with the expenditure will flow to the Group.
The useful lives of items of property, plant and equipment have been assessed as follows:
ITEM USEFUL LIVES
Plant and machinery 1 – 6 yearsFurniture and fixtures 2 – 10 yearsMotor vehicles 1 – 6 yearsOffice equipment 3 – 5 yearsIT equipment 1 – 3 yearsComputer software 2 – 4 yearsLeasehold improvements 5 – 8 yearsElectronic equipment 2 – 3 years
The residual value, useful life and depreciation method of each asset are reviewed at each reporting date, and adjusted if appropriate.
The depreciation charge for each year is recognised in profit or loss unless it is included in the carrying amount of another asset.
Any gain or loss from the derecognition of an item of property, plant and equipment is recognised in profit or loss when the item is derecognised.
NOTES (CONTINUED)

AYO Technology Solutions Limited I CONSOLIDATED AND SEPARATE ANNUAL FINANCIAL STATEMENTS 201820
TM
TECHNOLOGY SOLUTIONS LIMITED
1. SIGNIFICANT ACCOUNTING POLICIES (CONTINUED)1.5 GOODWILL
Goodwill arising on the acquisition of subsidiaries is measured at cost less any accumulated impairment losses. Goodwill is tested for impairment annually and whenever there is an indication of impairment and is not amortised.
1.6 INTANGIBLE ASSETSIntangible assets which are separately acquired are recognised at cost less accumulated amortisation and any accumulated impairment losses.
Software development costs, which are generated internally, are measured at cost less any accumulated amortisation and accumulated impairment losses.
Subsequent expenditure is capitalised only if it is probable that the future economic benefits associated with the expenditure will flow to the Group. Costs associated with maintaining software programmes are recognised as an expense as incurred. Expenditure on research (or on the research phase of an internal project) is recognised as an expense when it is incurred.
Amortisation is calculated on the intangible assets using the straight-line method over their useful lives to their residual values. The amortisation method, useful lives and residual values are reviewed at each reporting date and adjusted if appropriate.
The useful life of the billing system was assessed by management at the reporting date. Based on the terms of the service contract to which the intangible asset relates, a notice period of 1 year is required to terminate the contract. As the contract has not been terminated, the intangible asset is assumed to have an additional year of use.
Management has assessed that the useful life of the eCCR system is 3 years. This judgement is used on the market and trading conditions for the Group.
Management will assess the useful life of the software under development once it is ready for use.
Management has assessed that the distribution rights have an indefinite useful life, based on the distribution agreement. Further to the assessment, the distribution rights continue to generate economic benefits for the Group.
1.7 INVESTMENTS IN SUBSIDIARIESCOMPANY ANNUAL FINANCIAL STATEMENTSIn the Company’s consolidated and separate annual financial statements, investments in subsidiaries are carried at fair value through profit or loss.
The fair value of the investments in subsidiaries is determined by using discounted cash flow analysis.
1.8 FINANCIAL INSTRUMENTSINITIAL RECOGNITIONFinancial assets and financial liabilities are recognised when the Group becomes a party to the contractual provisions of the financial instruments.
Financial assets (unless it is a trade receivable without a significant financing component) and financial liabilities are initially measured at fair value. A trade receivable without a significant financing component is initially measured at the transaction price.
The Group’s principal financial assets are various investments, long term loans receivable, trade and other current receivables and bank and cash balances. The Group’s financial liabilities are long-term interest-bearing and non-interest-bearing loans payable and trade and other payables.
OFFSETTINGFinancial assets and financial liabilities are only offset if there is a legally enforceable right to offset the recognised amounts and there is an intention to either settle on a net basis or realise the asset and settle the liability simultaneously.
SUBSEQUENT MEASUREMENTFinancial instruments at fair value through profit or loss are subsequently measured at fair value, with gains and losses arising from changes in fair value being included in profit or loss for the period.
Loans and receivables are subsequently measured at amortised cost, using the effective interest method, less accumulated impairment losses.
Financial liabilities at amortised cost are subsequently measured at amortised cost, using the effective interest method.
NOTES (CONTINUED)

CONSOLIDATED AND SEPARATE ANNUAL FINANCIAL STATEMENTS 2018 21
1. SIGNIFICANT ACCOUNTING POLICIES (CONTINUED)1.8 FINANCIAL INSTRUMENTS (CONTINUED)
DERECOGNITIONFinancial assets are derecognised when the rights to receive cash flows from the investments have expired or have been transferred and the Group has transferred substantially all risks and rewards of ownership. Financial liabilities are derecognised when the obligation is discharged, cancelled or expired.
FINANCIAL ASSETSThese include investments with various asset managers, such as 3 Laws Capital Proprietary Limited and Cadiz Life Investment Enterprise Development Fund.
Subsequently these financial assets are measured at fair value through profit and loss.
LOANS TO/(FROM) GROUP COMPANIESThese include loans to and from shareholders, fellow subsidiaries, subsidiaries, joint ventures and associates.
Subsequently the loans to Group companies are measured at amortised cost using the effective interest method, less any impairment loss recognised to reflect irrecoverable amounts.
Loans from Group companies are classified as financial liabilities measured at amortised cost using the effective interest method.
TRADE AND OTHER RECEIVABLESTrade receivables are subsequently measured at amortised cost using the effective interest rate method. Appropriate allowances for estimated irrecoverable amounts are recognised in profit or loss when there is objective evidence that the asset is impaired. Significant financial difficulties of the debtor, probability that the debtor will enter bankruptcy or financial reorganisation, and default or delinquency in payments (more than 30 days overdue) are considered indicators that the trade receivable is impaired. The allowance recognised is measured as the difference between the asset’s carrying amount and the present value of estimated future cash flows discounted at the effective interest rate computed at initial recognition.
The carrying amount of the asset is reduced through the use of an allowance account, and the amount of the loss is recognised in profit or loss within operating expenses. When a trade receivable is uncollectible, it is written off against the allowance account for trade receivables. Subsequent recoveries of amounts previously written off are credited against operating expenses in profit or loss.
Trade and other receivables are classified as loans and receivables.
TRADE AND OTHER PAYABLESTrade payables are subsequently measured at amortised cost, using the effective interest method.
CASH AND CASH EQUIVALENTSCash and cash equivalents comprise cash on hand and demand deposits, and other short-term highly liquid investments that are readily convertible to a known amount of cash and are subject to an insignificant risk of changes in value. These are subsequently recognised at amortised cost.
BANK OVERDRAFT AND BORROWINGSBank overdrafts and borrowings are subsequently measured at amortised cost, using the effective interest method.
1.9 INCOME TAXTax expense recognised in profit or loss comprises the sum of deferred tax and current tax not recognised in other comprehensive income or directly in equity.
Calculation of current tax is based on tax rates and tax laws that have been enacted or substantively enacted by the end of the reporting period. Deferred income taxes are calculated using the balance sheet liability method.
Deferred tax assets are recognised to the extent that it is probable that the underlying tax loss or deductible temporary differences will be utilised against future taxable income. This is assessed based on the Group’s forecast of future operating results, adjusted for significant non-taxable income and expenses and specific limits on the use of any unused tax loss or credit.
Deferred tax liabilities are generally recognised in full, although IAS 12 ‘Income Taxes’ specifies limited exemptions. As a result of these exemptions the Group does not recognise deferred tax on temporary differences relating to goodwill.
NOTES (CONTINUED)

AYO Technology Solutions Limited I CONSOLIDATED AND SEPARATE ANNUAL FINANCIAL STATEMENTS 201822
TM
TECHNOLOGY SOLUTIONS LIMITED
1. SIGNIFICANT ACCOUNTING POLICIES (CONTINUED)1.10 LEASES
A lease is classified as a finance lease if it transfers substantially all the risks and rewards incidental to ownership. A lease is classified as an operating lease if it does not transfer substantially all the risks and rewards incidental to ownership.
FINANCE LEASES – LESSEEFinance leases are recognised as assets and liabilities in the statement of financial position at amounts equal to the fair value of the leased asset or, if lower, the present value of the minimum lease payments. The corresponding liability to the lessor is included in the statement of financial position as a finance lease obligation.
The lease payments are apportioned between the finance costs and reduction of the outstanding liability. The finance cost is allocated to each period during the lease term so as to produce a constant periodic rate on the remaining balance of the liability.
OPERATING LEASES – LESSEEOperating lease payments are recognised as an expense in profit or loss on a straight-line basis over the lease term. The difference between the amounts recognised as an expense and the contractual payments are recognised as an operating lease asset or liability.
1.11 INVENTORIESInventories are measured at the lower of cost and net realisable value. Costs are assigned to individual items of inventory on the basis of weighted average costs.
The Group’s inventory comprises of headsets sold by Kalula Communications Proprietary Limited and work in progress in the Company. Work in progress relates to capitalised project costs which will be amortised over the term of the contract and management will assess whether the costs can be realised within the next financial year.
1.12 PROVISIONSThe amount of a provision is the present value of the expenditure expected to be required to settle the obligation, using a pre-tax rate that reflect current market assessments of the time value of money and the risks. The unwinding of the discount rate is recognised as a finance cost.
1.13 REVENUERevenue is recognised to the extent that it is probable that the economic benefits will flow to the Group and the revenue can be reliably measured, regardless of when the payment is to be made. Revenue is measured at the fair value of the consideration received or receivable, taking into account contractually defined terms of payment and excluding taxes.
Revenue comprises sale of goods, services rendered, dividend income and management fees.
SALE OF GOODSThe Group sells headsets in the telecommunications and consumer electronic markets. Revenue from the sale of goods is recognised when control of the headsets has transferred to the buyer, being on delivery.
SERVICES RENDEREDThe Group provides information technology management, security, software design, implementation and support services. Revenue from providing services is recognised in the reporting period in which the services are rendered by reference to the stage of completion of the transaction at the reporting date.
Stage of completion is determined as follows:
• For time and material contracts, revenue is recognised based on the contractual rates as labour hours and direct expenses are incurred.
• Where a contract includes multiple deliverables, such as the sale of hardware and related installation services. Each deliverable is accounted for separately based on expected cost-plus margin.
NOTES (CONTINUED)

CONSOLIDATED AND SEPARATE ANNUAL FINANCIAL STATEMENTS 2018 23
1. SIGNIFICANT ACCOUNTING POLICIES (CONTINUED)1.13 REVENUE (CONTINUED)
SERVICES RENDERED (CONTINUED)• If contracts include the installation of hardware, revenue for the hardware is recognised at a point in time when the
hardware is delivered, the legal title has passed, and the customer has accepted the hardware.• For long term projects, stage of completion is measured relative to the milestones achieved as specified in the contract.• For maintenance contracts, revenue is measured on a straight-line basis over the maintenance period.
MANAGEMENT FEESManagement fees are recognised on an accrual basis in accordance with the substance of the relevant agreements.
DIVIDEND INCOMEDividend revenue relates to the Company is recognised, in profit or loss, when the Company’s right to receive payment has been established.
1.14 FINANCE INCOMEFinance income is recognised, in profit or loss, using the effective interest rate method.
1.15 FINANCE COSTSFinance costs are recognised as an expense in the period in which they are incurred.
1.16 TRANSLATION OF FOREIGN CURRENCIESFOREIGN CURRENCY TRANSACTIONSA foreign currency transaction is recognised, on initial recognition in Rands, by applying to the foreign currency amount the spot exchange rate between the functional currency and the foreign currency at the date of the transaction.
At the reporting date:
• foreign currency monetary items are translated using the closing rate;• non-monetary items that are measured in terms of historical cost in a foreign currency are translated using the exchange
rate at the date of the transaction; and• non-monetary items that are measured at fair value in a foreign currency are translated using the exchange rates at the
date when the fair value was determined.
Exchange differences arising on the settlement of monetary items or on translating monetary items at rates different from those at which they were translated on initial recognition are recognised in profit or loss in the period in which they arise.
Cash flows arising from transactions in a foreign currency are recognised in Rands by applying to the foreign currency amount the exchange rate between the Rand and the foreign currency at the date of the cash flow.
FOREIGN OPERATIONSThe assets and liabilities of foreign operations, including goodwill and fair value adjustments arising on acquisition, are translated into Rands at the exchange rates at the reporting date. The income and expenses of foreign operations are translated into Rands at the exchange rates at the dates of the transactions.
Foreign currency differences are recognised in OCI and accumulated in the translation reserve.
1.17 CONSOLIDATIONBASIS OF CONSOLIDATIONThe consolidated annual financial statements incorporate the annual financial statements of the Company and all subsidiaries. Subsidiaries are entities (including structured entities) which are controlled by the Group.
The Group has control of an entity when it is exposed to or has rights to variable returns from involvement with the entity and it has the ability to affect those returns through its power over the entity.
The results of subsidiaries are included in the consolidated and separate annual financial statements from the effective date of acquisition to the effective date of disposal.
All inter-company transactions, balances, and Unrealised gains on transactions between Group companies are eliminated in full on consolidation. Unrealised losses are also eliminated unless the transaction provides evidence of an impairment of the asset transferred.
NOTES (CONTINUED)

AYO Technology Solutions Limited I CONSOLIDATED AND SEPARATE ANNUAL FINANCIAL STATEMENTS 201824
TM
TECHNOLOGY SOLUTIONS LIMITED
1. SIGNIFICANT ACCOUNTING POLICIES (CONTINUED)1.17 CONSOLIDATION (CONTINUED)
BASIS OF CONSOLIDATION (CONTINUED) Non-controlling interests in the net assets of consolidated subsidiaries are identified and recognised separately from the Group’s interest therein and are recognised within equity. Losses of subsidiaries attributable to non-controlling interests are allocated to the non-controlling interest even if this results in a debit balance being recognised for non-controlling interest.
The difference between the carrying amount of non-controlling interest and the non-controlling interest’s proportionate share of the net assets of the subsidiary is represented by goodwill.
Transactions with non-controlling interests that do not result in loss of control are accounted for as equity transactions.
BUSINESS COMBINATIONSThe Group accounts for business combinations using the acquisition method of accounting. The cost of the business combination is measured as the aggregate of the fair values of assets given, liabilities incurred or assumed and equity instruments issued. Costs directly attributable to the business combination are expensed as incurred, except the costs to issue debt which are amortised as part of the effective interest and costs to issue equity which are included in equity.
Contingent consideration is included in the cost of the business combination at fair value as at the date of acquisition. Subsequent changes to the assets, liability or equity which arise as a result of the contingent consideration are not affected against goodwill, unless they are valid measurement period adjustments.
Contingent liabilities are only included in the identifiable assets and liabilities of the acquiree where there is a present obligation at acquisition date.
Non-controlling interests in the acquiree are measured on an acquisition-by-acquisition basis either at fair value or at the non-controlling interests’ proportionate share in the recognised amounts of the acquiree’s identifiable net assets. This treatment applies to non-controlling interests which are present ownership interests and entitle their holders to a proportionate share of the entity’s net assets in the event of liquidation. All other components of non-controlling interests are measured at their acquisition date fair values, unless another measurement basis is required by IFRS.
In cases where the Group held a non-controlling shareholding in the acquiree prior to obtaining control, that interest is measured to fair value as at acquisition date. The measurement to fair value is included in profit or loss for the year. Where the existing shareholding was classified as an available-for-sale financial asset, the cumulative fair value adjustments recognised previously in other comprehensive income and accumulated in equity are recognised in profit or loss as a reclassification adjustment.
Goodwill is determined as the consideration paid, plus the fair value of any shareholding held prior to obtaining control, plus non-controlling interest and less the fair value of the identifiable assets and liabilities of the acquiree.
Goodwill is not amortised but is tested on an annual basis for impairment. If goodwill is assessed to be impaired, that impairment is not subsequently reversed.
Any excess of the cost of the investment over the Group’s share of net fair value of an associate’s identifiable assets, liabilities and contingent liabilities over the cost of the business combination is immediately recognised in profit or loss.
On disposal of a subsidiary, associate or joint venture to which goodwill was allocated on acquisition, the amount attributable to such goodwill is included in the determination of the profit or loss for the period in which the relevant investment is disposed.
1.18 SHARE CAPITALSHARE CAPITALOrdinary share capital represents the par value of ordinary shares issued.
SHARE PREMIUMShare premium represents the excess consideration received by the Company over the par value of ordinary shares issued and classified as equity.
Incremental costs directly attributable to the issue of new shares are recognised as a deduction from equity.
SHARE-BASED PAYMENT RESERVEThe share-based payment reserve is used to recognise the value of equity-settled share-based payments. Refer to note 16 for further details.
NOTES (CONTINUED)

CONSOLIDATED AND SEPARATE ANNUAL FINANCIAL STATEMENTS 2018 25
1. SIGNIFICANT ACCOUNTING POLICIES (CONTINUED)1.19 EMPLOYEE BENEFITS
SHORT-TERM EMPLOYEE BENEFITSThe cost of short-term employee benefits, those payable within 12 months after the service is rendered, such as paid vacation leave and sick leave, bonuses, are recognised in profit or loss in the period in which the service is rendered and are not discounted.
The expected cost of profit sharing and bonus payments is recognised as an expense when there is a legal or constructive obligation to make such payments as a result of past performance.
1.20 ASSETS HELD FOR SALENon-current assets, or disposal groups comprising assets and liabilities, are classified as held-for if it is highly probable that they will be recovered primarily through sale rather than through continuing use.
Such assets, or disposal groups, are generally measured at the lower of their carrying amount and fair value less costs to sell.
Any impairment loss on a disposal group is allocated first to goodwill, and then to the remaining assets and liabilities on a pro rata basis, except that no loss is allocated to inventories, financial assets, deferred tax assets, employee benefit assets, investment property or biological assets, which continue to be measured in accordance with the Group’s other accounting policies. Impairment losses on initial classification as held-for-sale or held-for distribution and subsequent gains and losses on remeasurement are recognised in profit or loss.
Once classified as held-for-sale, intangible assets and property, plant and equipment are no longer amortised or depreciated, and any equity-accounted investee is no longer equity accounted. Costs include costs incurred initially and costs incurred subsequently to add to, or to replace a part of, or service a property.
1.21 INVESTMENTS IN EQUITY-ACCOUNTED INVESTMENTSThe Group’s interests in equity-accounted investments comprise interests in associates and a joint venture.
Associates are those entities in which the Group has significant influence, but not control or joint control, over the financial and operating policies. A joint venture is an arrangement in which the Group has joint control, whereby the Group has rights to the net assets of the arrangement, rather than rights to its assets and obligations for its liabilities.
Interests in associates and the joint venture are accounted for using the equity method. They are initially recognised at cost, which includes transaction costs. Subsequent to initial recognition, the consolidated financial statements include the Group’s share of the profit or loss and OCI of equity accounted investees, until the date on which significant influence or joint control ceases.
1.22 DISCONTINUED OPERATIONSA discontinued operation is a component of the Group’s business, the operations and cash flows of which can be clearly distinguished from the rest of the Group and which:
• represents a separate major line of business or geographic area of operations;• is part of a single coordinated plan to dispose of a separate major line of business or geographic area of operations; or• is a subsidiary acquired exclusively with a view to resale.
Classification as a discontinued operation occurs at the earlier of disposal or when the operation meets the criteria to be classified as held-for-sale.
When an operation is classified as a discontinued operation, the comparative statement of profit or loss and OCI is represented as if the operation had been discontinued from the start of the comparative year.
1.23 SHARE-BASED PAYMENTSThe grant date fair value of equity-settled share-based payment arrangements granted is recognised as an expense, with a corresponding increase in equity.
The grant date fair value of the share-based payment is determined using the discounted cash flow valuation technique.
1.24 EARNINGS PER SHAREEarnings per share is calculated on the weighted average number of shares in issue, net of treasury shares, in respect of the year and is based on profit attributable to ordinary shareholders. Headline earnings per share is calculated in terms of the requirements set out in Circular 04/2018 issued by SAICA.
NOTES (CONTINUED)

AYO Technology Solutions Limited I CONSOLIDATED AND SEPARATE ANNUAL FINANCIAL STATEMENTS 201826
TM
TECHNOLOGY SOLUTIONS LIMITED
2. NEW STANDARDS AND INTERPRETATIONS2.1 STANDARDS AND INTERPRETATIONS NOT YET EFFECTIVE
Below is a list of the current standards and interpretations that have been issued, but are not yet effective.
STANDARD DETAILS OF AMENDMENT ADDITIONAL INFORMATION
IFRS 9 Financial Instruments
IFRS 9 introduced new requirements for classifying and measuring financial assets and liabilities, including a new impairment model which will result in earlier recognition of losses. Under IFRS 9 financial assets will be classified as measured at amortised cost, fair value through profit or loss, or fair value through other comprehensive income.
Effective date: 1 January 2018
Implementation date: The Group expects to implement this standard in the 2019 annual financial statements.
Impact on the Group: The Group performed a detailed assessment of the impact of the application of IFRS 9 on its financial statements. The current findings indicate that apart from the application of the credit loss impairment model, there are no major deviations in the current classification of financial assets as they are largely in line with IFRS 9 and other loan receivables are not considered material. There will also be no major impact on the Group’s accounting for financial liabilities, as the new requirements only affect the accounting for financial liabilities that are designated at fair value through profit or loss and the Group does not have any such liabilities as financial liabilities are accounted for at amortised cost.
The Group has identified that the most significant impact that IFRS 9 will have on the Group relates to the expected credit loss impairment model. The financial assets impairment requirements of IFRS 9 introduce a forward-looking expected credit loss model that results in earlier recognition of credit losses than the incurred loss model of IAS 39. The Group is in the process of performing a detailed assessment, however the impact is likely to be immaterial as the Group uses cash flow forecasts for a year period thus performing impairment tests using a forward-looking model.
NOTES (CONTINUED)

CONSOLIDATED AND SEPARATE ANNUAL FINANCIAL STATEMENTS 2018 27
2. NEW STANDARDS AND INTERPRETATIONS (CONTINUED)2.1 STANDARDS AND INTERPRETATIONS NOT YET EFFECTIVE (CONTINUED)
STANDARD DETAILS OF AMENDMENT ADDITIONAL INFORMATION
IFRS 15 Revenue from Contracts with Customers
IFRS 15 supersedes IAS 11 Construction Contracts; IAS 18 Revenue; IFRIC 13 Customer Loyalty Programmes; IFRIC 15 Agreements for the Construction of Real Estate; IFRIC 18 Transfers of Assets from Customers; and SIC-31 Revenue – Barter Transactions Involving Advertising Services.
The core principle of IFRS 15 is that an entity recognises revenue to depict the transfer of promised goods or services to customers in an amount that reflects the consideration to which the entity expects to be entitled in exchange for those goods or services. An entity recognises revenue in accordance with that core principle by applying the following steps:
• Identify the contract(s) with a customer Identify the performance obligations in the contract
• Determine the transaction price • Allocate the transaction price to
the performance obligations in the contract
• Recognise revenue when (or as) the entity satisfies a performance obligation.
IFRS 15 also includes extensive new disclosure requirements.
Effective date: 1 January 2018
Implementation date: The Group expects to adopt the standard for the first time in the 2019 annual financial statements.
Impact on the Group: In assessing the impact of IFRS 15 on the Group, the activities that generate revenue were assessed in determining whether they fall within the scope of the new revenue standards. The Group generates revenue from various sources, including dividend income and interest income from loans advanced, of which a detailed assessment has been done during the year whereby contracts were analysed within each division and the impact would result in additional disclosures as a result of classification of performance obligations. The Group is in the process of finalising its assessment and documenting the impact thereof.
The new standard does not include guidance on the accounting for dividend income. Instead, guidance that is consistent with the existing requirements of IAS 18 has been incorporated into the financial instruments standards. Although dividend income arises in the ordinary course of the Group’s activities, it does not arise from contracts with customers and therefore may not be presented as revenue.
IFRS 16 Leases IFRS 16 introduces a single lessee accounting model and requires a lessee to recognise right-of-use assets and liabilities for all leases with a term of more than 12 months, unless the underlying asset is of low value. As a consequence, a lessee recognises depreciation of the right-of-use asset and interest on the lease liability, and also classifies cash repayments of the lease liability into a principal portion and an interest portion and presents them in the statement of cash flows.
Effective date: 1 January 2019
Implementation date: The Group expects to adopt the standard for the first time in the 2020 annual financial statements.
Impact on Group: The Group has assessed the requirements of IFRS 16 during the financial year and considered the impact to be medium/high due to the changes of presentation on the statement of financial position and the statement of financial performance.
The directors have considered all of these standards and interpretations and found IFRS 9, IFRS 15 and IFRS 16 together with the applicable interpretations and amendments to these standards, to be applicable to the Group.
NOTES (CONTINUED)

AYO Technology Solutions Limited I CONSOLIDATED AND SEPARATE ANNUAL FINANCIAL STATEMENTS 201828
TM
TECHNOLOGY SOLUTIONS LIMITED
3. PROPERTY, PLANT AND EQUIPMENT2018 2017
Cost
Accumu-lated
depreciationCarrying
value Cost
Accumu-lated
depreciationCarrying
value
GroupPlant and machinery 1 575 (381) 1 194 1 575 (223) 1 352Furniture and fixtures 2 527 (912) 1 615 1 250 (833) 415Motor vehicles 1 356 (1 022) 334 5 074 (3 376) 1 698Office equipment 1 613 (1 237) 376 1 209 (1 115) 94 IT equipment 7 203 (4 362) 2 841 5 354 (3 733) 1 621Computer software 1 374 (1 294) 80 1 968 (1 731) 237 Leasehold improvements 1 258 (941) 317 1 811 (1 150) 661Electronic equipment 1 565 (1 153) 412 1 565 (525) 1 040Total 18 471 (11 302) 7 169 19 806 (12 688) 7 118
2018 2017
Cost
Accumu-lated
depreciationCarrying
value Cost
Accumu-lated
depreciationCarrying
value
CompanyPlant and machinery 1 476 (36) 1 440 – – –Furniture and fixtures 91 (5) 86 – – –IT equipment 1 366 (115) 1 251 11 – 11Total 2 933 (156) 2 777 11 – 11
Reconciliation of property, plant and equipment – Group – 2018Openingbalance Additions Disposals Depreciation
Carryingvalue
Plant and machinery 1 352 – – (157) 1 194Furniture and fixtures 415 1 499 (43) (256) 1 615Motor vehicles 1 698 – (981) (383) 334Office equipment 94 436 – (154) 376IT equipment 1 621 2 264 (141) (903) 2 841Computer software 237 195 – (352) 80Leasehold improvements 661 243 (335) (251) 317Electronic equipment 1 040 – – (629) 412Total 7 118 4 637 (1 500) (3 084) 7 169
Reconciliation of property, plant and equipment – Group – 2017
Openingbalance Additions
Additionsthrough
businesscombinations Disposals Depreciation
Carrying value
Plant and machinery – – 1 509 – (158) 1 352Furniture and fixtures 147 50 237 (10) (9) 415Motor vehicles – – 2 606 – (908) 1 698Office equipment 108 197 48 (33) (226) 94IT equipment 894 1 018 660 (321) (629) 1 621Computer software 776 229 – (9) (759) 237Leasehold improvements 570 314 – (23) (200) 661Electronic equipment – 1 572 – (5) (527) 1 040Total 2 495 3 380 5 060 (401) (3 416) 7 118
NOTES (CONTINUED)

CONSOLIDATED AND SEPARATE ANNUAL FINANCIAL STATEMENTS 2018 29
3. PROPERTY, PLANT AND EQUIPMENT (CONTINUED)Reconciliation of property, plant and equipment – Company – 2018
Openingbalance Additions Disposals Depreciation
Carrying value
Plant and machinery – 1 475 – (36) 1 440Furniture and fixtures – 91 – (5) 86IT equipment 11 1 376 (21) (115) 1 251Total 11 2 942 (21) (156) 2 777
Reconciliation of property, plant and equipment – Company – 2017Openingbalance Additions Disposals Depreciation
Carrying value
Furniture and fixtures 7 – (5) (2) –IT equipment – 11 – – 11Total 7 11 (5) (2) 11
A register containing the information required by Regulation 25(3) of the Companies Regulations, 2011 is available for inspection at the registered office of the Company.
4. GOODWILL2018 2017
Cost 35 629 43 791Accumulated impairment (381) (381)Balance at end of year 35 248 43 410
Reconciliation of goodwill – Group – 2018
Openingbalance
Disposalsthrough
businessdivesture Impairment Total
Goodwill 43 410 (3 205) (4 957) 35 248
Reconciliation of goodwill – Group – 2017Openingbalance Additions Disposals Total
Goodwill 17 301 30 740 (4 631) 43 410
Goodwill relates to the Group’s interest in Health System Technologies Proprietary Limited, the Software Tech Holdings Proprietary Limited Group, Puleng Technologies Proprietary Limited and Kalula Communications Proprietary Limited. The Group performs an annual valuation for purposes of determining the fair value of its investments. The valuation method is the basis for valuing the goodwill which is allocated to Health System Technologies Proprietary Limited, the Software Tech Holdings Proprietary Limited Group, Puleng Technologies Proprietary Limited and Kalula Communications Proprietary Limited as cash generating units (CGU).
The value of the CGU to which the goodwill was allocated has been determined based on the value in use calculations using cash flow projections. The carrying value of one of the CGUs in Software Tech Holdings Group was more than the recoverable amount and an impairment loss of R1 172 962 was recognised in the Group.
During the current year the goodwill in Software Tech Holdings Company of R3 784 331 was impaired as the carrying value was more than the recoverable amount.
The carrying value of all the remaining CGUs has been calculated to be less than the recoverable amount and therefore no impairment has been recognised.
NOTES (CONTINUED)

AYO Technology Solutions Limited I CONSOLIDATED AND SEPARATE ANNUAL FINANCIAL STATEMENTS 201830
TM
TECHNOLOGY SOLUTIONS LIMITED
4. GOODWILL (CONTINUED)The following significant assumptions were used:
Software Tech Holdings subsidiaries
Pre-tax discount rates 24.5% – 26%Number of years 5Growth rate 4.5%
Health System Technologies Proprietary Limited
Pre-tax discount rates 15.67%Number of years 5Growth rate 6%
Puleng Technologies Proprietary Limited
Pre-tax discount rates 15.59%Number of years 5Growth rate 6%
Kalula Communications Proprietary Limited
Pre-tax discount rates 16.01%Number of years 5Growth rate 6%
Goodwill acquired through business combinations has been allocated to individual cash-generating units for impairment testing as follows:
Investment in Health System Technologies Proprietary Limited 2 157 – 2 157 –Investment in Software Tech Holdings Group – – 3 784 –Investment in Software Tech Holdings subsidiaries 2 352 – 6 730 –Investment in Puleng Technologies Proprietary Limited 22 274 – 22 274 –Investment in Kalula Communications Proprietary Limited 8 465 – 8 465 –Total 35 248 – 43 410 –
5. INTANGIBLE ASSETS2018 2017
CostAccumulatedamortisation
Carrying value Cost
Accumulatedamortisation
Carrying value
GroupLicences 2 230 (233) 1 997 – – –Billing system 8 819 (8 748) 71 8 819 (8 748) 71Software development 7 738 (3 489) 4 249 4 638 (3 489) 1 149eCCR system 3 266 (1 716) 1 550 2 543 (1 133) 1 410Supplier distribution agreement 9 876 – 9 876 9 876 – 9 876
Total 31 929 (14 186) 17 743 25 876 (13 370) 12 506
2018 2017
CostAccumulatedamortisation
Carrying value Cost
Accumulatedamortisation
Carrying value
CompanyLicences 2 230 (233) 1 997 – – –
Balance at end of year 2 230 (233) 1 997 – – –
NOTES (CONTINUED)

CONSOLIDATED AND SEPARATE ANNUAL FINANCIAL STATEMENTS 2018 31
5. INTANGIBLE ASSETS (CONTINUED)Reconciliation of intangible asset – Group – 2018
Openingbalance Additions
Internallygenerated Amortisation Total
Licences – 2 230 – (233) 1 997Billing system 71 – – – 71Software development 1 149 – 3 100 – 4 249eCCR system 1 410 – 723 (583) 1 550Supplier distribution agreement 9 876 – – – 9 876Total 12 506 2 230 3 823 (816) 17 743
Reconciliation of intangible assets – Group – 2017
Openingbalance Additions
Additionsthrough
businesscombinations Amortisation Total
Billing system 71 – – – 71Software development – 1 149 – – 1 149eCCR system 2 110 56 – (756) 1 410Supplier distribution agreement – – 9 876 – 9 876Total 2 181 1 205 9 876 (756) 12 506
Reconciliation of intangible assets – Company – 2018Openingbalance Additions Amortisation Total
Licences – 2 230 (233) 1 997
The intangible assets are classified as follows:
Internally generated intangibles• Billing system• Software development• eCCR system
Other intangible assets• Distribution rights
BILLING SYSTEMBased on the terms of the service contract to which the billing system relates, a notice period of one year is required to terminate the contract. The billing system has a residual value of R70 977 which will be amortised when the service contract is terminated.
eCCR SYSTEMThe electronic Continuity of Care Record (eCCR) project is aimed at improving the continuity of care between hospitals and primary healthcare. It is a collaborative project by Health Impact Assessment, Information Management and Health Systems Technology with an initial focus of establishing a web-based electronic discharge summary. The eCCR system was internally developed and phase 1 was completed in the 2016 financial year. The product went live on 1 March 2016. Phase 2A began in October 2016 which entails further ongoing development of the product. The team has started preparing for phase 2B of the project in 2018. Management has assessed that the eCCR system has a useful life of three years and an expected remaining useful life of one year.
SOFTWARE DEVELOPMENTSoftware development relates to 3 different programs currently being developed.
The first being the Health Information System Technology refresh. This is a technology refresh and modernisation of the existing Health Information System platform.
The second is the Health Benefit Protocol and Plan Management. The outcome of this project is the ability to share patient information and care paths between the health insurance agency and healthcare providers in an accurate and reliable manner which supports better patient outcomes through guided information capture and standards-based data management and interoperability.
NOTES (CONTINUED)

AYO Technology Solutions Limited I CONSOLIDATED AND SEPARATE ANNUAL FINANCIAL STATEMENTS 201832
TM
TECHNOLOGY SOLUTIONS LIMITED
5. INTANGIBLE ASSETS (CONTINUED)SOFTWARE DEVELOPMENT (CONTINUED)The third is the Free Bed Enquiry System which allows ambulances to assess the availability of beds at hospitals.
Costs of R3 099 537 were capitalised to software development. Amortisation of the software will commence once the programmes are available for use.
There are no research and development expenses recognised in profit or loss in the current year. Management will assess the useful life of the intangible asset under development once it is ready for use.
Following initial recognition, software is carried at cost less any accumulated amortisation and any accumulated impairment losses. The useful life of software is assessed as finite and is reassessed, with the amortisation method, at least at each financial period-end. The amortisation of software is recognised in profit or loss in the period to which it relates. Management assessed the recoverable amount of the intangible asset at reporting date, which exceeded the carrying value by assessing the future economic benefits which will flow to the Group using expected forecast cash flows.
DISTRIBUTION RIGHTSThe distribution rights arose during the prior year from the acquisition of Kalula Communications Proprietary Limited. The distribution rights regulates the purchase of Plantronics products by CATS for resale by the Group.
There is no limit on the number of time the above distribution right can be renewed and based on historical information no distribution rights have been revoked. Additionally, the cost to renew the distribution rights are insignificant in relation to the economic benefits that are expected to arise from the assets and the distribution rights are expected to be renewed without any cost and therefore have an indefinite useful life. This intangible asset has an indefinite useful life was allocated to the Unified communications cash generating unit. Management assessed the recoverable amount of the intangible asset at reporting date, which exceeded the carrying value by using the forecast cash flows focusing on profitability and constant gross profit margins which have been maintained.
LICENCESThe licences relate to ServiceNow licences purchased during the reporting period, which is a service management software. These licences have a useful life of three years based on the licence agreement, which commenced on 1 July 2018.
6. INVESTMENT IN SUBSIDIARIESBreakdown of investment in subsidiaries are as follows:
Company
Name of company Held by% holding
2018% holding
2017
Carryingamount
2018
Carryingamount
2017
Puleng Technologies Proprietary Limited
AYO Technology Solutions Limited 57% 57% 88 552 149 244
Sekunjalo Medical Services Proprietary Limited
AYO Technology Solutions Limited 100% 100% 284 137 284 137
Software Tech Holdings Proprietary Limited
AYO Technology Solutions Limited 42.59% 42.59% 5 357 7 337
Kalula Communications Proprietary Limited
AYO Technology Solutions Limited 51% 51% 36 928 36 928
414 974 477 646
Subsidiaries for which control was lost during the yearThe Group lost control of subsidiary World Wide Creative Proprietary Limited on 31 August 2018.
Loss on disposal of subsidiary 4 650
The loss has been included in other operating gains/(losses) in profit or loss.
Subsidiaries with less than 50% share capital heldThe Group holds less than 50% of the issued share capital in Software Tech Holdings Proprietary Limited. The Group consolidated Software Tech Holdings Proprietary Limited as it has additional voting powers granted to the parent Company in the shareholders’ agreement. These voting rights together with the other requirements of IFRS 10, resulted in control over the investee.
NOTES (CONTINUED)

CONSOLIDATED AND SEPARATE ANNUAL FINANCIAL STATEMENTS 2018 33
6. INVESTMENT IN SUBSIDIARIES (CONTINUED)Subsidiaries with material non-controlling interestsThe following information is provided for subsidiaries with non-controlling interests which are material. The summarised financial information is provided prior to intercompany eliminations.
Subsidiary 2018 2017
Puleng Technologies Proprietary Limited 43% 43%Software Tech Holdings Proprietary Limited 57.41% 57.41%Kalula Communications Proprietary Limited 49% 49%
Summarised statement of financial position2018
Non-current
assetsCurrent
assetsTotal
assets
Non-current
liabilitiesCurrent
liabilitiesTotal
liabilities
Carryingamount of non-
controllinginterest
Software Tech Holdings Proprietary Limited Group 4 446 16 385 20 831 – 8 725 8 725 7 895Puleng Technologies Proprietary Limited 1 065 72 728 73 793 – 60 736 60 736 7 120Kalula Communications Proprietary Limited 2 598 19 706 22 304 1 579 17 249 18 828 5 188Total 8 109 108 818 116 928 1 579 86 710 88 289 20 203
The difference between the carrying amount of non-controlling interest and the non-controlling interest’s proportionate share of the net assets of the subsidiary is represented by goodwill.
Summarised statement of profit or loss and other comprehensive income
RevenueProfit/(loss)before tax
Incometax expense
Profit/(loss) for the year
Othercompre-hensive
loss
Totalcompre-hensive
income/loss
Profit/(loss)allocated
to non-controlling
interestSoftware Tech Holdings Proprietary Limited Group 73 415 (1 450) (1 349) (2 799) (32) (2 831) (1 184)Puleng Technologies Proprietary Limited 335 352 16 812 (4 707) 12 105 – 12 105 5 205Kalula Communications Proprietary Limited 75 552 (800) 85 (715) – (715) (350)Total 484 319 14 562 (5 971) 8 591 (32) 8 559 3 671
Summarised statement of cash flowsCash flow
fromoperatingactivities
Cash flow from
investingactivities
Cash flow from
financingactivities
Netincrease/(decrease)
in cash flow
Dividend paid to non-
controllinginterest
Software Tech Holdings Proprietary Limited Group 2 480 15 090 (18 466) (896) (11 135)Puleng Technologies Proprietary Limited 13 530 (296) (13 901) (667) (5 049)Kalula Communications Proprietary Limited 192 818 (1 642) (632) –Total 16 202 15 612 (34 009) (2 195) (16 184)
NOTES (CONTINUED)

AYO Technology Solutions Limited I CONSOLIDATED AND SEPARATE ANNUAL FINANCIAL STATEMENTS 201834
TM
TECHNOLOGY SOLUTIONS LIMITED
6. INVESTMENT IN SUBSIDIARIES (CONTINUED)
Summarised statement of financial position2017
Non-current
assetsCurrent
assetsTotal
assets
Non-current
liabilitiesCurrent
liabilitiesTotal
liabilities
Carryingamount of non-
controllinginterest
Software Tech Holdings Proprietary Limited Group 9 569 37 221 46 790 81 13 643 13 724 20 120Puleng Technologies Proprietary Limited 977 98 091 99 068 – 79 473 79 473 8 418Kalula Communications Proprietary Limited 4 017 22 428 26 445 2 808 18 065 20 873 6 214Total 14 563 157 740 172 303 2 889 111 181 114 070 34 752
Summarised statement of profit or loss and other comprehensive income
RevenueProfit/(loss)before tax
Incometax expense
Profit/(loss) for the year
Othercompre-hensive
loss
Totalcompre-hensive
income/loss
Profit/(loss)allocated
to non-controlling
interest
Software Tech Holdings Proprietary Limited Group 68 967 14 764 (3 132) 11 632 (4) 11 628 7 138Puleng Technologies Proprietary Limited 251 134 17 844 (4 996) 12 848 – 12 848 5 524Kalula Communications Proprietary Limited 67 207 926 (273) 653 – 653 320Total 387 308 33 534 (8 401) 25 133 (4) 25 129 12 982
Included in the profit of Software Tech Holdings Proprietary Limited is a profit of R2 810 471 on discontinued operations.
Summarised statement of cash flowsCash flow
fromoperatingactivities
Cash flow from
investingactivities
Cash flow from
financingactivities
Netincrease/(decrease)
in cash flow
Dividend paid to non-
controllinginterest
Software Tech Holdings Proprietary Limited Group 12 121 (1 334) (8 170) 2 617 4 870Puleng Technologies Proprietary Limited 17 589 (261) (2 613) 14 715 1 106Kalula Communications Proprietary Limited (1 329) (19) (1 063) (2 411) –Total 28 381 (1 614) (11 846) 14 921 5 976
NOTES (CONTINUED)

CONSOLIDATED AND SEPARATE ANNUAL FINANCIAL STATEMENTS 2018 35
7. INVESTMENT IN JOINT VENTUREJOINT VENTURE
% ownership interest Carrying amount
Group Held by 2018 2017 2018 2017
Exaro HST Proprietary Limited
Health System Technologies Proprietary Limited 50% 50% 33 33
Exaro HST Proprietary Limited is a jointly controlled entity and is incorporated and operates principally in West Africa. The investment is measured using the equity method. This is the only joint operation in the Group, and there are no other undisclosed structured entities.
SUMMARISED FINANCIAL INFORMATION OF MATERIAL JOINT VENTURESummarised statement of comprehensive income
Exaro HST Limited
2018 2017
Depreciation and amortisation – (17)Other income and expenses (343) (207)Loss before tax (343) (224)Loss from continuing operations (343) (224)Total comprehensive loss (343) (224)
Summarised statement of financial position2018 2017
ASSETSNon-currentProperty, plant and equipment 908 68CurrentCash and cash equivalents 20 18Total assets 928 86
LIABILITIESCurrentTrade creditors (4 342) (3 123)
Total net assets (3 414) (3 037)
Group Company
2018 2017 2018 2017
Reconciliation of net assets to equity accounted investments in joint venture Interest in joint venture. (33) (33) – –Carrying value of investment in joint venture (33) (33) – –
RESTRICTIONS RELATING TO JOINT VENTUREThere are currently no restrictions relating to the joint venture.
UNRECOGNISED LOSSESThe Company has not recognised its share of the losses of Exaro HST Proprietary Limited as the Company has no obligation for any losses of the joint venture as the Group does not fund nor have any funding commitments for Exaro HST Proprietary Limited.
The total unrecognised losses for the current year amount to R342 750 (2017: R223 698). The accumulated unrecognised losses for the current period amount to R3 414 114 (2017: R3 037 133).
NOTES (CONTINUED)

AYO Technology Solutions Limited I CONSOLIDATED AND SEPARATE ANNUAL FINANCIAL STATEMENTS 201836
TM
TECHNOLOGY SOLUTIONS LIMITED
8. INVESTMENT IN ASSOCIATEEmergent Energy Proprietary Limited was disposed of on 1 September 2017 for a cash consideration of R823 716. Further to this there is a contingent consideration which is receivable until August 2019. The contingent consideration is based on projected profits, of which R386 816 accrued to the Group in the current financial year.
Company
Name of company Held by% holding
2018% holding
2017
Carryingamount
2018
Carryingamount
2017
Emergent Energy Proprietary Limited
AYO Technology Solutions Limited – 33.00% – –
9. LOANS TO/(FROM) GROUP COMPANIES Group Company
2018 2017 2018 2017
Joint ventureDigital Health Africa Proprietary Limited 168 168 – –The loan is unsecured, bears no interest and has no repayment terms.
Major shareholder (previously holding company)African Equity Empowerment Investments Limited The loan was unsecured with no fixed terms of repayment. Interest is charged at prime plus 3%. (5 000) (80 596) (5 000) (80 596)
African Equity Empowerment Investments LimitedThe loan is unsecured, and interest is charged at prime overdraft rate. There are no fixed terms of repayment and management does not expect to enforce settlement within the next twelve months. 1 820 4 383 – –
3 180 (76 213) (5 000) (80 596)
Other related entities Sekunjalo Technology Group Proprietary LimitedThe loan is unsecured and bears no interest and is repayable on demand. (1) (1) – –
Sekunjalo Health & Commodities Proprietary LimitedThe loan is unsecured, has no fixed repayment term and bears no interest. 1 1 1 1
G. RushbyThe above loan is unsecured, bears no interest and has no fixed repayment terms. – (69) – –
– (69) 1 1
Non-current assets 1 989 4 552 1 1Non-current liabilities – (80 597) – (80 596)Current liabilities (5 001) (69) (5 000) –Net loans (3 012) (76 114) (5 001) (80 595)
NOTES (CONTINUED)

CONSOLIDATED AND SEPARATE ANNUAL FINANCIAL STATEMENTS 2018 37
9. LOANS TO/(FROM) GROUP COMPANIES (CONTINUED)CREDIT QUALITY OF LOANS TO GROUP COMPANIESThe credit quality of loans to Group companies that are neither past due nor impaired can be assessed by reference to historical information about counterparty default rates.
Other than loans that have been impaired which have low credit quality, credit quality on all other loans is considered to be high.
10. FINANCIAL ASSETS Group Company
2018 2017 2018 2017
At fair value through profit or loss – designatedCadiz Life Investment Enterprise Development FundThe fund is an innovative new investment whereby corporate clients can now earn the required Enterprise Development points in terms of the DTI scorecard, and at the same time earn real returns from a once-off investment. The investments matures 31 July 2023.
6 890 747 6 127 –
3 Laws Capital Proprietary Limited InvestmentThe above investment has no fixed maturity date, is refundable on demand and bears interest at a target rate of CPI +5% per annum.
88 827 – 88 827 –
95 717 747 94 954 –At fair value through profit or loss – held for tradingForeign exchange contractA sixth month forward exchange contract was entered into which expires on 14 September 2018 to purchase $47 054,66 at an exchange rate of 13,245.
67 – – –
Forward exchange contractA sixth month forward exchange contract was entered into which expires on 21 December 2018 to purchase $73 792,16 at an exchange rate of 14,249.
32 – – –
99 – – –Loans and receivablesSA Components CCThe receivable is for plant and equipment sold to SAComponents and is payable in January 2018. The above loan is unsecured, and bears interest of 9.25% per annum. The receivable was repaid during the current financial year.
– 3 024 – 3 024
Staff loansThe above loans bear no interest, are dependent on service terms committed and are repayable on demand should the employee leave the employment of the Company earlier than the committed service term.
799 483 192 –
Alacrity Technologies Proprietary LimitedThe above loan was for the sale of the going concern in Software Tech Holdings Proprietary Limited. The loan is was unsecured, bore no interest and was repaid during the current financial year.
– 15 729 – –
Supplier development loanThe above loans were provided as part of the Company’s enterprise and supplier development process. The loans are interest free and are receivable as follows:– R3 285 000 by no later than 31 October 2018– R350 000 by no later than 13 August 2019
3 635 – 3 285 –
Ragna CCThe above loan is unsecured, bears no interest and has no fixed repayment terms.
30 30 – –
4 464 19 266 3 477 3 024Total financial assets 100 280 20 013 98 431 3 024
NOTES (CONTINUED)

AYO Technology Solutions Limited I CONSOLIDATED AND SEPARATE ANNUAL FINANCIAL STATEMENTS 201838
TM
TECHNOLOGY SOLUTIONS LIMITED
10. FINANCIAL ASSETS (CONTINUED) Group Company
2018 2017 2018 2017
Non-current assetsAt fair value through profit or loss – designated 6 890 747 6 127 -Current assetsAt fair value through profit or loss – designated 88 827 – 88 827 –Held for trading (fair value through profit or loss) 99 – – –Loans and receivables 4 464 19 266 3 477 3 024
93 390 19 266 92 304 3 024100 280 20 013 98 431 3 024
FAIR VALUE INFORMATIONFinancial assets at fair value through profit or loss are recognised at fair value, which is therefore equal to their carrying amounts.
The fair values of investments not listed or quoted are estimated using the discounted cash flow analysis. Fair values are determined annually at balance sheet date.
Refer to note 38 for detail on assumptions and methods used to determine fair values for unlisted investments.
11. DEFERRED TAX Group Company
2018 2017 2018 2017
Deferred tax asset/(liability)Allowance for credit losses 1 428 1 248 – –Provisions 4 700 3 037 2 071 50Tax losses available for set off against future taxable income 527 9 238 – 9 236Property, plant and equipment (90) 18 – –Intangible assets (2 757) (3 102) – –Prepaid expenses (206) (733) – –Income received in advance 116 328 (86) –Investment in subsidiaries – – (81 081) (95 119)Leases 2 – 2 –Investments (10) – – –Total deferred tax liability 3 710 10 034 (79 094) (85 833)
Deferred tax liability (306) (3 835) (82 390) (95 119)Deferred tax asset 4 016 13 869 3 296 9 286Total net deferred tax asset/(liability) 3 710 10 034 (79 094) (85 833)
Reconciliation of deferred tax asset/(liability)At beginning of the year 10 034 11 068 (85 833) (57 059)Increase(decrease) in tax loss available for set off (8 711) 1 128 (9 236) 1 126Taxable/(deductible) temporary difference movement on tangible fixed assets (109) 20 – 2Taxable/(deductible) temporary difference movement on intangible assets 346 (2 497) – –Original temporary difference on provision 1 663 216 2 021 42Fair value of subsidiaries 14 038 (29 944)Income received in advance (211) 117 – –Prepaid expense 526 (143) (86) –Allowance for credit losses 180 125 – –Fair value movements (10) – – –Leases 2 – 2 –Balance at the end of the year 3 710 10 034 (79 094) (85 833)
NOTES (CONTINUED)

CONSOLIDATED AND SEPARATE ANNUAL FINANCIAL STATEMENTS 2018 39
12. INVENTORIES Group Company
2018 2017 2018 2017
Finished goods 5 682 9 702 – –Work in progress 6 696 – 6 696 –
12 378 9 702 6 696 –
No inventory was written down to net realisable value in the current and prior year.
13. TRADE AND OTHER RECEIVABLES Group Company
2018 2017 2018 2017
Trade receivables 135 762 98 057 56 713 4 665Prepayments 1 436 2 616 – –Deposits 1 360 1 627 567 –Value added income tax expense 4 827 496 4 063 58Sundry customers 3 997 6 308 – –Accrued income 35 840 1 324 39 707 –Total 183 222 110 428 101 050 4 723
SUNDRY CUSTOMERS This relates to maintenance jobs done at year end but not yet invoiced. These were subsequently invoiced after year end and recognised as trade receivables.
ACCRUED INCOMEThis relates to accrued income recognised in the Group, the majority being interest accrued on the money market account; dividend income and revenue earned but not yet invoiced.
CREDIT QUALITY OF TRADE AND OTHER RECEIVABLESOf the trade receivables at the reporting date, R96 723 107 (2017: R47 916 768) is due from three of the Group’s largest customers in the Information Technology sector.
The credit quality of trade and other receivables that are neither past due nor impaired can be assessed by reference to external credit ratings (if available) or to historical information about counterparty default rates. The average credit period on sales of merchandise goods and services rendered is 30 days from the anniversary date and statement date. No interest has been charged on trade receivables for amounts outstanding longer than the credit period.
Forty one percent of the Group’s trade receivables stems from Head office. The credit risk for this segment has been assessed as low by the divisional management as the majority of the receivables are classified as current and based on the recent payment history of the debtors.
Thirty one percent of the Group’s trade receivables stem from the Group’s Security segment. The credit risk for this segment has been assessed as low by the divisional management based on the ageing of the receivables (majority of the receivables are classified as current) and the recent payment history.
Eight percent of the Group’s trade receivables stem from sales within the Unified Communications segment. The credit risk for this segment has been assessed as low by the divisional management as the majority of the receivables are less than 60 days overdue and the segment currently has insurance on receivables.
Eighteen percent of the Group’s trade receivables stem from sales within the Healthcare and Support segment. These sales are predominantly to state institutions, recoverability of these customers are extremely good. The credit risk has been assessed as low by the divisional management at year-end based on recent payment history. Credit concentration is High as sales are to a few customers however these are blue chip customers and there have been low defaults in the past.
Two percent of the Group’s trade receivables stem from sales within the Software and Consulting segment. The credit risk for this segment has been assessed as low by the divisional management based on the recent payment history of the debtors.
NOTES (CONTINUED)

AYO Technology Solutions Limited I CONSOLIDATED AND SEPARATE ANNUAL FINANCIAL STATEMENTS 201840
TM
TECHNOLOGY SOLUTIONS LIMITED
13. TRADE AND OTHER RECEIVABLES (CONTINUED)TRADE AND OTHER RECEIVABLES PAST DUE BUT NOT IMPAIREDTrade and other receivables which are less than 3 months past due are not considered to be impaired. At 31 August 2018, R11 973 519 (2017: R14 327 109) were past due but not impaired. The Group has not provided for these debtors as there has not been significant change in credit quality and the amount is still considered recoverable. Further the majority of the past due debtors relates to Kalula Communications Proprietary Limited, which has insurance over debtor defaults.
Group Company
2018 2017 2018 2017
1 month past due 4 620 2 723 – –2 months past due 4 422 8 798 – –3 months past due 2 931 2 805 1 114 –
11 973 14 326 1 114 –
TRADE AND OTHER RECEIVABLES IMPAIREDAs of 31 August 2018, impaired trade and other receivables of R7 352 239 (2017: R5 673 669) was recognised.
In determining the recoverability of a trade receivable, the Group considers any change in the credit quality of the trade receivable from the date credit was initially granted up to the reporting date.
The movement in the allowance for impairment in respect of trade receivables and contract assets during the year was as follows. Comparative amounts for 2017 represent the allowance account for impairment losses under IAS 39.
RECONCILIATION OF ALLOWANCE FOR TRADE AND OTHER RECEIVABLES Group Company
2018 2017 2018 2017
Opening balance 5 674 5 071 1 274 1 274Recognised during the year 2 068 5 709 – –Unused amounts reversed (390) (5 106) – –Total 7 352 5 674 1 274 1 274
FAIR VALUE OF TRADE AND OTHER RECEIVABLESThe fair value of trade and other receivables approximates its carrying value due to the short-term nature.
14. CASH AND CASH EQUIVALENTS Group Company
2018 2017 2018 2017
Cash and cash equivalents consists of:Cash on hand 11 27 – –Bank balances 4 308 687 74 202 4 246 813 2 269Bank overdraft (5 056) (3 109) – –Total 4 303 642 71 120 4 246 813 2 269
Current assets 4 308 698 74 229 4 246 813 2 269Current liabilities (5 056) (3 109) – –Net amount 4 303 642 71 120 4 246 813 2 269
NOTES (CONTINUED)

CONSOLIDATED AND SEPARATE ANNUAL FINANCIAL STATEMENTS 2018 41
14. CASH AND CASH EQUIVALENTS (CONTINUED)The Group has the following facilities in place:
ABSAThe Company has a bank overdraft facility with Absa Bank Limited and is secured with unlimited cross suretyship between African Equity Empowerment Investments Limited, Health System Technologies Proprietary Limited and Premier Fishing SA Proprietary Limited supported by cession of loan accounts.
The following facilities are also held with Absa Bank Limited:Primary lending = R5 000 000Term loan = R5 800 000Credit card = R202 000Forward exchange contract (nominal value) = R10 000 000Foreign exchange settlement = R5 000 000
FIRSTRAND BANK LIMITEDPuleng Technologies Proprietary Limited has the following facilities with FirstRand Bank Limited:Working capital = R2 500 000Forward exchange contracts = R5 000 000Security:
• Cession of debtors• Unlimited suretyship by the non-controlling shareholders of Puleng Technologies Proprietary Limited
NEDBANK LIMITEDKalula Communications Proprietary Limited has the following facilities with Nedbank:
General banking facility = R7 000 000Facility utilised = R5 055 640Vehicle-and-asset finance facility = R1 373 514
Security: Limited surety by the following:
• Mr AS Brown for R8 000 000• Communications Productions (Pty) Ltd for R5 300 000• Briton Music Productions GSA (Pty) Ltd for R7 500 000
CREDIT QUALITY OF CASH AT BANK AND SHORT-TERM DEPOSITS, EXCLUDING CASH ON HANDThe credit quality of cash at bank and short-term deposits, excluding cash on hand that are neither past due nor impaired can be assessed by reference to external credit ratings (if available) or historical information about counterparty default rates. Cash and cash equivalents are held with reputable banking service providers. Absa Bank Ltd provides the majority of banking services used by the Group and it is rated AA+ and A1+ in the long term and short term respectively.
Group Company
2018 2017 2018 2017
Credit ratingAbsa Bank Ltd – Baa3 4 268 950 36 377 4 246 813 2 269Nedbank Ltd – Baa3 2 431 198 – –Standard Bank Ltd – Baa3 2 938 1 491 – –First National Bank Ltd – Baa3 29 312 32 872 – –HSBC – A2 772 155 – –Other 11 27 – –
4 304 414 71 120 4 246 813 2 269
NOTES (CONTINUED)

AYO Technology Solutions Limited I CONSOLIDATED AND SEPARATE ANNUAL FINANCIAL STATEMENTS 201842
TM
TECHNOLOGY SOLUTIONS LIMITED
15. SHARE CAPITAL Group Company
2018 2017 2018 2017
Authorised2 000 000 ordinary shares of no par value – – – –Unissued ordinary shares are under the control of the directors in terms of a resolution of members passed at the last annual general meeting. This authority remains in force until the next annual general meeting.
Issued344 125 194 (2017: 212 382 539) ordinary shares 4 339 444 850 4 339 444 850Share premium 183 280 183 280 183 280 183 280Share issue costs written off against share premium (78 314) – (78 314) –
4 444 410 184 130 4 444 410 184 130
On 21 December 2018, the Company listed on the JSE at an issue price of R43,00 per share. Prior to the listing, the Company issued 31 960 000 shares to the B-BBEE Consortium at an issue price of R1,50 per share.
Share issue costs were incurred on listing, which were made up of sponsor fees and placement fees.
16. RESERVESSHARE-BASED PAYMENT RESERVEPrior to listing, the Company issued 31 960 000 shares to a B-BBEE Consortium at an issue price of R1,50 per share. The shares were issued for cash and the B-BBEE Consortium is restricted from selling the shares for a period of 5 years from the issue date. The fair value of the shares at the date of issuance was R1,87, which was determined using the net asset value of the Company on transaction date. In line with IFRS 2, an adjustment of R11 809 375 was recognised to account for the difference between the issue price and the fair value of the shares. The adjustment was recognised as an expense in the statement of comprehensive income, with the contra recognised directly in equity.
TRANSLATION OF FOREIGN OPERATIONSThe exchange gain arose on translation of the foreign investment held by the Software Tech Holdings Group.
Group Company
2018 2017 2018 2017
Equity-settled share-based payment 11 809 – 11 809 –Exchange differences on translating foreign operations (32) (4) – –
11 777 (4) 11 809 –
NOTES (CONTINUED)
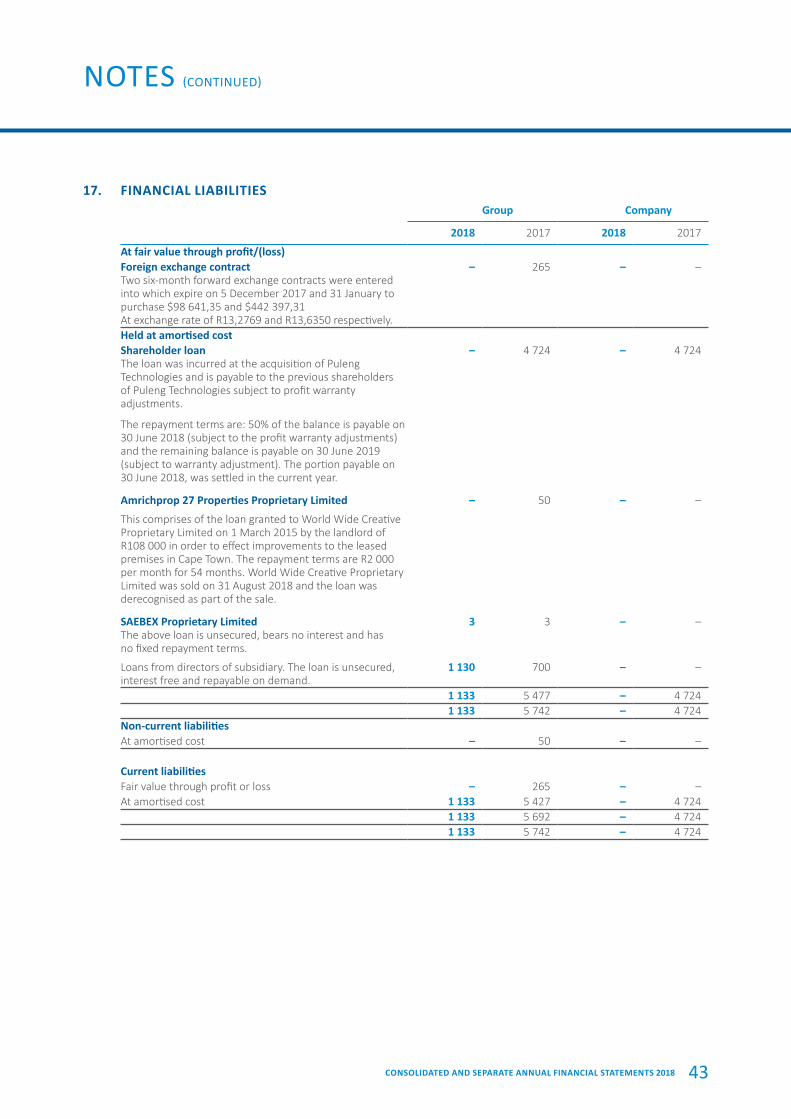
CONSOLIDATED AND SEPARATE ANNUAL FINANCIAL STATEMENTS 2018 43
17. FINANCIAL LIABILITIES Group Company
2018 2017 2018 2017
At fair value through profit/(loss)Foreign exchange contractTwo six-month forward exchange contracts were entered into which expire on 5 December 2017 and 31 January to purchase $98 641,35 and $442 397,31At exchange rate of R13,2769 and R13,6350 respectively.
– 265 – –
Held at amortised costShareholder loanThe loan was incurred at the acquisition of Puleng Technologies and is payable to the previous shareholders of Puleng Technologies subject to profit warranty adjustments.
The repayment terms are: 50% of the balance is payable on 30 June 2018 (subject to the profit warranty adjustments) and the remaining balance is payable on 30 June 2019 (subject to warranty adjustment). The portion payable on 30 June 2018, was settled in the current year.
– 4 724 – 4 724
Amrichprop 27 Properties Proprietary Limited – 50 – –
This comprises of the loan granted to World Wide Creative Proprietary Limited on 1 March 2015 by the landlord of R108 000 in order to effect improvements to the leased premises in Cape Town. The repayment terms are R2 000 per month for 54 months. World Wide Creative Proprietary Limited was sold on 31 August 2018 and the loan was derecognised as part of the sale.
SAEBEX Proprietary LimitedThe above loan is unsecured, bears no interest and has no fixed repayment terms.
3 3 – –
Loans from directors of subsidiary. The loan is unsecured, interest free and repayable on demand.
1 130 700 – –
1 133 5 477 – 4 7241 133 5 742 – 4 724
Non-current liabilitiesAt amortised cost – 50 – –
Current liabilitiesFair value through profit or loss – 265 – –At amortised cost 1 133 5 427 – 4 724
1 133 5 692 – 4 7241 133 5 742 – 4 724
NOTES (CONTINUED)

AYO Technology Solutions Limited I CONSOLIDATED AND SEPARATE ANNUAL FINANCIAL STATEMENTS 201844
TM
TECHNOLOGY SOLUTIONS LIMITED
18. FINANCE LEASE LIABILITIES Group Company
2018 2017 2018 2017
Minimum lease payments due– within one year 394 425 – –– in second to fifth year inclusive 731 2 714 – –
1 125 3 139 – –less: future finance charges (161) (331) – –Present value of minimum lease payments 964 2 808 – –
Present value of minimum lease payments due– within one year 389 259 – –– in second to fifth year inclusive 575 2 549 – –
964 2 808 – –
Non-current liabilities 575 2 549 – –Current liabilities 389 259 – –
964 2 808 – –
The average lease term is two to five years and the average effective borrowing rate was 11%.
Interest rates are linked to prime at the contract date. All leases have fixed repayments and no arrangements have been entered into for contingent rent.
The Group’s obligations under finance leases are secured by the lessor’s charge over the leased assets.
The finance lease relates to vehicles leased by Kalula Communication with a carrying value of R305 211 (2017: R1 671 792).
19. TRADE AND OTHER PAYABLES Group Company
2018 2017 2018 2017
Trade payables 111 982 88 013 45 129 244Amounts received in advance 1 145 1 382 – –Value added Income tax expense 3 252 5 717 – –Payroll accruals 1 147 1 046 – –Accrued expenses 13 445 8 641 8 101 1 152SARS – PAYE, UIF and SDL 1 954 3 703 – –Total 132 925 108 502 53 230 1 396
The average credit period on purchases of certain goods is 30 – 45 days. No interest is charged on trade payables. The Group has financial risk management policies in place to ensure that all payables are paid within a reasonable time of the credit frame.
The fair value of trade and other payables approximates its carrying value due to its short-term nature.
20. DEFERRED INCOMEThe deferred income relates to licence and maintenance contracts billed to customers which will only be delivered after the reporting date.
Group Company
2018 2017 2018 2017
Current liabilities – 2 981 – – – 2 981 – –
NOTES (CONTINUED)
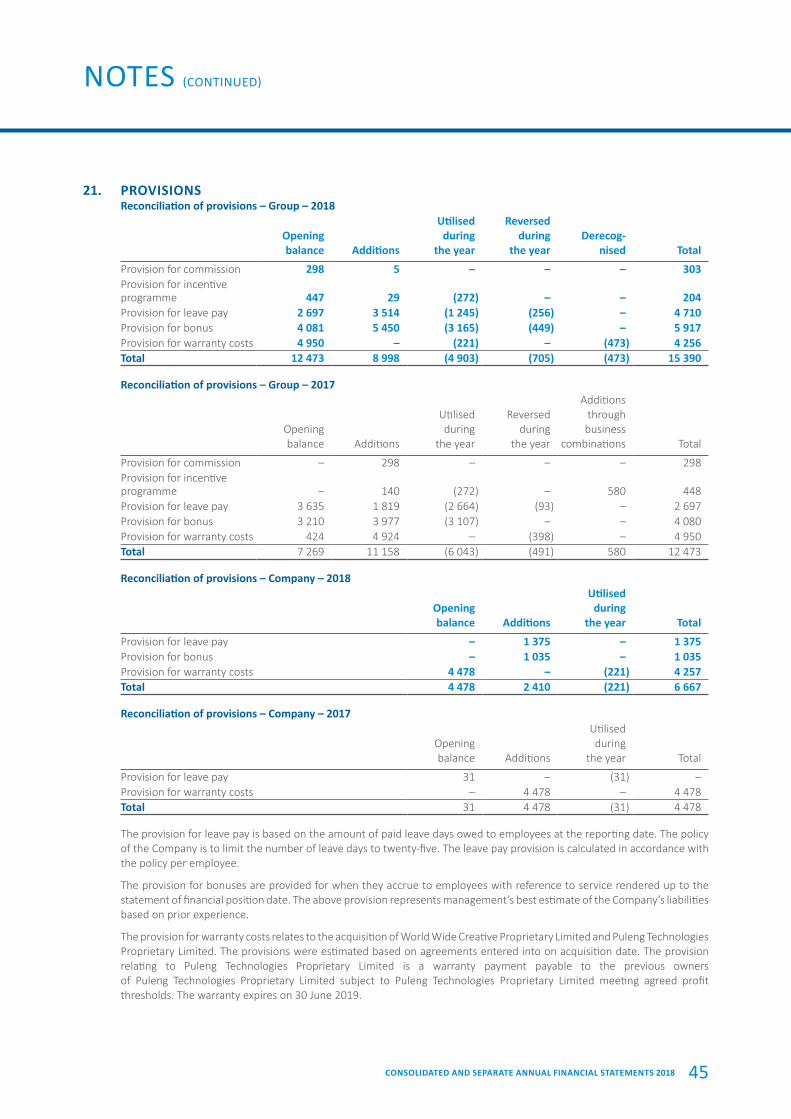
CONSOLIDATED AND SEPARATE ANNUAL FINANCIAL STATEMENTS 2018 45
21. PROVISIONSReconciliation of provisions – Group – 2018
Openingbalance Additions
Utilisedduring
the year
Reversedduring
the yearDerecog-
nised TotalProvision for commission 298 5 – – – 303Provision for incentive programme 447 29 (272) – – 204Provision for leave pay 2 697 3 514 (1 245) (256) – 4 710Provision for bonus 4 081 5 450 (3 165) (449) – 5 917Provision for warranty costs 4 950 – (221) – (473) 4 256Total 12 473 8 998 (4 903) (705) (473) 15 390
Reconciliation of provisions – Group – 2017
Openingbalance Additions
Utilised during
the year
Reversedduring
the year
Additionsthrough
businesscombinations Total
Provision for commission – 298 – – – 298Provision for incentive programme – 140 (272) – 580 448Provision for leave pay 3 635 1 819 (2 664) (93) – 2 697Provision for bonus 3 210 3 977 (3 107) – – 4 080Provision for warranty costs 424 4 924 – (398) – 4 950Total 7 269 11 158 (6 043) (491) 580 12 473
Reconciliation of provisions – Company – 2018
Openingbalance Additions
Utilised during
the year Total
Provision for leave pay – 1 375 – 1 375Provision for bonus – 1 035 – 1 035Provision for warranty costs 4 478 – (221) 4 257Total 4 478 2 410 (221) 6 667
Reconciliation of provisions – Company – 2017
Openingbalance Additions
Utilised during
the year Total
Provision for leave pay 31 – (31) –Provision for warranty costs – 4 478 – 4 478Total 31 4 478 (31) 4 478
The provision for leave pay is based on the amount of paid leave days owed to employees at the reporting date. The policy of the Company is to limit the number of leave days to twenty-five. The leave pay provision is calculated in accordance with the policy per employee.
The provision for bonuses are provided for when they accrue to employees with reference to service rendered up to the statement of financial position date. The above provision represents management’s best estimate of the Company’s liabilities based on prior experience.
The provision for warranty costs relates to the acquisition of World Wide Creative Proprietary Limited and Puleng Technologies Proprietary Limited. The provisions were estimated based on agreements entered into on acquisition date. The provision relating to Puleng Technologies Proprietary Limited is a warranty payment payable to the previous owners of Puleng Technologies Proprietary Limited subject to Puleng Technologies Proprietary Limited meeting agreed profit thresholds. The warranty expires on 30 June 2019.
NOTES (CONTINUED)

AYO Technology Solutions Limited I CONSOLIDATED AND SEPARATE ANNUAL FINANCIAL STATEMENTS 201846
TM
TECHNOLOGY SOLUTIONS LIMITED
21. PROVISIONS (CONTINUED)The Group disposed of its interest in World Wide Creative Proprietary Limited at the reporting date and the provision relating to World Wide Creative Proprietary Limited was derecognised.
The provision for commission is recognised for sales commission recognised in Kalula Communications and is estimated based on monthly revenue at a rate of 2.5%.
The provision for incentive is recognised for Kalula Communication’s partner reward programme which is granted to debtors when they reach certain revenue targets.
22. NON-CURRENT ASSETS HELD FOR SALEDuring the prior year, management committed to a plan to sell the Group’s investment in Emergent Energy. Accordingly, the investment was presented as a disposal group held for sale in the prior year.
The investment was sold during the current year on 1 September 2017 for a cash consideration of R823 716. Further to this there is a contingent consideration which is receivable until 31 August 2019. The contingent consideration is based on projected profits of projects specified in the sale agreement, of which R386 816 accrued to the Group in the current financial year. The Group recognised a profit on sale of R1 490 043 in the current year.
Group Company
2018 2017 2018 2017
Assets and liabilitiesLiabilities of disposal group held for saleLiabilities held for sale – (360) – –
23. REVENUESale of goods 97 244 81 164 533 –Rendering of services 541 649 397 499 54 382 –Management fees – – 4 774 5 057Dividends received – – 23 105 10 324Total 638 893 478 663 82 794 15 381
24. OTHER OPERATING INCOMEFees earned – 738 – –Other recoveries 1 – – –Sundry income 1 789 – – –Commission received – 4 761 3 204 6 883Profit on sale of investment in associate 1 490 – 1 130 –Profit on sale of property, plant and equipment 11 (5) – (5)Fair value gain on Cadiz Life Investment Enterprise Development Fund 2 – 2 –Total 3 293 5 494 4 336 6 878
NOTES (CONTINUED)

CONSOLIDATED AND SEPARATE ANNUAL FINANCIAL STATEMENTS 2018 47
25. OTHER OPERATING GAINS/(LOSSES) Group Company
2018 2017 2018 2017
Gains/(losses) on disposals, scrapings and settlementsDiscontinued operations – 6 019 – –Investment in subsidiaries (4 662) – – –Foreign exchange gains/(losses)Net foreign exchange (losses)/gains (2 659) 1 748 – –Fair value gains/(losses)Investment in subsidiaries – – (62 672) 133 677Financial instruments at fair value through profit or lossFair value gain on Cadiz investment – 13 – –
– 13 (62 672) 133 677Total other operating gains (losses) (7 321) 7 780 (62 672) 133 677
26. MATERIAL NON-OPERATING ITEMS Group Company
2018 2017 2018 2017
Equity-settled share-based payment 11 809 – 11 809 –Warranty expense 4 239 – 4 239 –Goodwill impairment 4 957 – – –Listing costs expensed 6 831 – 6 831 –
27 836 – 22 879 –
Equity-settled share-based payment: Refer to note 16.
Warranty expense: Refer to note 21.
Goodwill impairment: Refer to note 4.
Listing costs expensed: Share issue costs were incurred on listing, which were made up of: legal costs; independent reporting accountant fee; JSE listing fees and printing fees. These costs have been expensed in line with the Pre-listing Statement.
27. FINANCE INCOME Group Company
2018 2017 2018 2017
Bank 226 488 2 101 224 034 34Interest – group loans 466 299 – –Total interest income 226 954 2 400 224 034 34
28. FINANCE COSTSMajor shareholder loan 1 377 8 106 1 375 8 089Finance leases 193 412 – –Bank 103 163 – –SARS interest 81 123 – –Total 1 754 8 804 1 375 8 089
NOTES (CONTINUED)

AYO Technology Solutions Limited I CONSOLIDATED AND SEPARATE ANNUAL FINANCIAL STATEMENTS 201848
TM
TECHNOLOGY SOLUTIONS LIMITED
29. INCOME TAX EXPENSE Group Company
2018 2017 2018 2017
Major components of the tax expense/(income)CurrentLocal income tax – recognised in current tax period 42 017 12 686 47 977 –Under provision – prior period – 655 – –Foreign income tax 23 114 – –Total current tax expense 42 040 13 455 47 977 –DeferredOriginating and reversing temporary differences – (720) – –Benefit of unrecognised tax loss/tax credit/temporary difference used to reduce deferred tax expense 9 230 – – –Current year (3 230) 87 (6 740) 28 774Total deferred tax expense 6 000 (633) (6 740) 28 774Total tax expense 48 040 12 822 41 237 28 774
Reconciliation of the tax expenseReconciliation between accounting profit and tax expense:Accounting profit 195 996 39 669 131 595 139 097Tax at the applicable tax rate of 28% (2017: 28%) 54 879 11 107 36 847 38 947
Tax effect of adjustments on taxable incomeInvestment in subsidiaries – – 3 510 (7 486)Donations 26 26 – –Dividends – – (6 470) (2 687)Legal fees 600 245 592 –Fines and penalties 2 231 161 2 149 –Loss from associate 368 245 – –Tax on discontinued operations – 1 093 – –Tax losses utilised (15 737) 4 (1 573) –Under provision – prior period 3 164 – –Foreign income tax or withholding tax 23 114 – –Disposal of going concern in Software Tech Holdings – (337) – –Other unreconciled movements in temporary difference 135 – – –Equity-settled share-based payment 3 307 – 3 307 –Listing fees 1 828 – 1 828 –Consulting fees 82 – 82 –Learnerships (132) – (132) –Expense in respect of exempt income 427 – 1 097 –
48 040 12 822 41 237 28 774
The estimated tax loss available for set-off against future taxable income is R– (2017: R38 603 624).
30. DISCONTINUED OPERATIONSProfit or lossRevenue – 44 215 – –Expenses – (40 315) – –Operating profit – 3 903 – –Income tax expense – (1 093) – –
– 2 810 – –
SOFTWARE TECH HOLDINGS PROPRIETARY LIMITEDIn the prior year, the Group disposed of the going concern in Software Tech Holdings Proprietary Limited.
NOTES (CONTINUED)

CONSOLIDATED AND SEPARATE ANNUAL FINANCIAL STATEMENTS 2018 49
31. EARNINGS PER SHAREEarnings per share (“EPS”) are derived by dividing the earnings attributable to equity holders of the parent by the weighted average number of ordinary shares.
2018 2017
Gross Tax Net Gross Tax Net
Earnings attributable to ordinary equity holders from continuing operations – – 144 285 – – 13 861Discontinued operations – – – – – 2 811Profit on sale of property, plant and equipment (12) 3 (9) 12 (3) 9Profit on disposal of discontinued operations – – – (6 019) 1 348 (4 671)Profit on disposal of associate (1 491) 417 (1 074) – – –Loss on disposal of subsidiary 1 985 (556) 1 429 – – –Goodwill impairment 4 284 (1 200) 3 084 – – –
Headline earnings 147 715 12 010Continued operation 147 715 9 199Discontinued operation – 2 811Weighted average number of shares 305 700 212 079Basic earnings per share (cents) 47.20 7.86Continued operations 47.20 6.53Discontinued operations – 1.33
Headline earnings per share (cents) 48.32 5.66Continued operations 48.32 4.33Discontinued operations – 1.33
There is no dilution in headline earnings per share
Weighted average number of sharesShares: 31 August 2016 202 152Shares issued: 1 September 2017 6 584Shares issued: 30 September 2017 3 647Shares:15 December 2017 – 31 August 2018 93 317 –Shares: 1 September 2016 – 31 August 2018 212 383 –Shares: 1 – 30 September 2016 – 17 395Shares: 30 September 2016 – 31 August 2017 – 194 684Total weighted average number shares 305 700 212 079
# There were no diluted headline earnings per share.
NOTES (CONTINUED)

AYO Technology Solutions Limited I CONSOLIDATED AND SEPARATE ANNUAL FINANCIAL STATEMENTS 201850
TM
TECHNOLOGY SOLUTIONS LIMITED
32. CASH/(USED IN) GENERATED FROM OPERATIONS Group Company
Notes 2018 2017 2018 2017
Profit before tax 195 997 39 670 131 596 139 097Adjustments for:Depreciation 3 3 084 3 293 389 2Profit on sale of investment in associate 35 (1 490) – (1 130) –Losses/(gains) on foreign exchange 235 708 – –Share of loss from equity-accounted investments – 679 – –Loss on sale of property, plant and equipment 989 40 – –Finance income (226 954) (2 578) (224 034) (34)Finance costs 28 1 754 8 804 1 375 8 089Fair value (gains)/losses (2) (13) 62 672 (133 677)Impairment losses 4 957 – – –Tax penalty 7 676 – 7 676 –Movements in operating lease assets and accruals (35) (520) – –Loss on sale of investment 4 643 (6 019) – –Movements in provisions 5 390 2 788 2 189 4 447Equity-settled share-based payment 11 809 – 11 809 –Income from discontinued operations 30 – 3 903 – –Amortisation 5 817 755 – –Changes in working capital:Inventories (2 675) (5 244) (6 696) –Trade and other receivables (91 650) (18 878) (96 314) 1 444Trade and other payables 26 847 25 802 51 950 592Deferred income (322) (20) – –Total (58 930) 53 170 (58 518) 19 960
33. TAX PAIDTax payable balance at the beginning of the year (7 988) 699 – –Current tax for the year recognised in profit or loss 29 (42 039) (14 548) (47 977) –Current tax on discontinued operations – (1 093) – –Tax penalty (7 682) – (7 676)Balance at end of the year 40 974 7 988 55 653 –
(16 735) (6 954) – –
34. CHANGES IN LIABILITIES ARISING FROM FINANCING ACTIVITIESReconciliation of liabilities arising from financing activities – Group – 2018
Openingbalance
Loss ofcontrol ofsubsidiary
Finance cost
Finance costspaid
Othernon-cash
move-ments
Totalnon-cash
movements Cash flowsClosing
balance
Financial liabilities 5 742 (26) – – – (26) (4 583) 1 133Finance lease liabilities 2 347 – – – – – (1 383) 964Loans from group companies 80 597 – 766 (766) (3 180) (3 180) (72 424) 4 993Other loans 1 842 1 842Total liabilities from financing activities 88 686 (26) 766 (766) (3 180) (3 206) (76 548) 8 932
NOTES (CONTINUED)

CONSOLIDATED AND SEPARATE ANNUAL FINANCIAL STATEMENTS 2018 51
34. CHANGES IN LIABILITIES ARISING FROM FINANCING ACTIVITIES (CONTINUED)Reconciliation of liabilities arising from financing activities – Company – 2018
Openingbalance
Finance cost
Finance costspaid
Othernon-cash
move-ments
Totalnon-cash
move-ments
Cashflows
Closingbalance
Financial liabilities 4 724 – – – – (4 724) –Loans from group companies 80 596 766 (766) (3 179) (3 179) (72 415) 5 002Total liabilities from financing activities 85 320 766 (766) (3 179) (3 179) (77 139) 5 002
35. DISPOSAL OF SUBSIDIARIES/DISCONTINUED OPERATIONWorld Wide Creative Proprietary LimitedOn 31 August 2018 Software Tech Holdings Proprietary Limited Group disposed 75% of its interest in World Wide Creative Proprietary Limited for a consideration of R90. The Company was sold as it no longer fits the Group’s long-term strategy. The net assets of World Wide Creative Proprietary Limited were as stated below on the date of disposal.
35.1 DISPOSAL OF SUBSIDIARY
World Wide Creative
Group Company
2018 2017 2018 2017
Property, plant and equipment 442 – – –Financial assets 4 – – –Goodwill 3 205 – – –Trade and other receivables 2 343 – – –Trade and other payables (974) – – –Provisions (359) – – –Operating lease liability (174) – – –Financial liabilities (26) – – –Cash 314 – – –Outside shareholders (483) – – –Operating lease asset 30 – – –Deferred tax asset 323 – – –Current tax receivable 6 – – –Total net assets sold 4 651 – – –Consideration received (1) – – –Loss on sale of subsidiaries 4 650 – – –
Net cash outflow on disposal Cash sold 314 – – –
NOTES (CONTINUED)

AYO Technology Solutions Limited I CONSOLIDATED AND SEPARATE ANNUAL FINANCIAL STATEMENTS 201852
TM
TECHNOLOGY SOLUTIONS LIMITED
35. DISPOSAL OF SUBSIDIARIES/DISCONTINUED OPERATION (CONTINUED)35.2 DISCONTINUED OPERATIONS
On 30 June 2017, the Group disposed the going concern in Software Tech Holdings Proprietary Limited to Alacrity Technologies Proprietary Limited for a cash consideration of R17 140 000.
The going concern was sold as it no longer aligned with the Group’s long-term strategy.
Group Company
2018 2017 2018 2017
Carrying value of assets soldProperty, plant and equipment – 342 – –Financial assets – 474 – –Goodwill – 4 631 – –Trade and other receivables – 8 467 – –Trade and other payables – (218) – –Provisions – (2 641) – –Operating lease liability – (8) – –Cash and cash equivalents – 2 300 – –Total net assets sold – 13 347 – –Consideration received – (19 440) – –Profit on disposal – 6 093 – –Consideration receivedCash – (2 300) – –Loan receivable – (17 140) – –
– (19 440) – –
NOTES (CONTINUED)

CONSOLIDATED AND SEPARATE ANNUAL FINANCIAL STATEMENTS 2018 53
36. SEGMENT REPORTThe Group has the following five strategic divisions, which are reportable segments. These divisions offer different products and services and are managed separately.
The following summary describes the operations of each reportable segment:
31 August 2018Software and
consultingHead office
Healthcareand support Security
Unifiedcommuni-
cations TotalRevenue 73 415 82 794 100 975 335 352 75 552 668 088External sales 73 415 54 915 99 701 335 310 75 552 638 893Intergroup sales – 27 878 1 598 43 – 29 219Depreciation and amortisation (985) (389) (1 377) (465) (685) (3 901)Interest revenue 257 224 034 1 202 1 419 42 226 954Interest expense (28) (1 375) (83) (1) (267) (1 754)Non-current assets 4 337 53 008 11 773 1 065 2 598 72 781Current assets 16 382 4 437 447 52 087 72 728 19 706 4 598 350Non-current liabilities – – – – (575) (575)Current liabilities (8 715) (101 544) (16 898) (58 059) (16 362) (201 578)Capital expenditure 328 5 173 907 296 163 6 867
31 August 2017Revenue 71 106 21 381 91 100 251 134 67 207 501 928External sales 68 974 248 91 100 251 134 67 207 478 663intergroup sales 2 132 21 133 – – – 23 265Discontinued operation 2 811 – – – – 2 811Depreciation and amortisation (1 143) (2) (1 851) (439) (772) (4 207)Interest revenue 183 34 1 768 373 42 2 400Interest expense (50) (8 089) (18) (90) (557) (8 804)Non-current assets 9 460 21 051 10 745 23 252 5 993 70 501Current assets 38 076 10 016 46 254 98 091 21 570 214 007Non-current liabilities (149) (85 074) – – (2 808) (88 031)Current liabilities (14 184) (6 109) (19 954) (79 473) (17 207) (136 927)Profit from associate – (679) – – – (679)Capital expenditure 2 099 – – 261 163 2 523
SEGMENTAL ANALYSISGEOGRAPHIC INFORMATIONThe operations of the Group are domiciled in South Africa. A total of 2% (2017: 2%) of external revenue is attributable to foreign sales mainly to the Far East, United States of America 0% (2017: 0.3%) and Europe 2% (2017: 1.7%).
MAJOR CUSTOMERS16% (2017: 19%) of the Group’s revenue is derived from the public sector, mainly in the Western Cape. The balance relates to sales to the private sector.
37. COMMITMENTSOperating leases – as lessee/(expense)Minimum lease payments due
Group Company
2018 2017 2018 2017
– within one year 6 314 6 181 1 828 –– in second to fifth year inclusive 13 345 13 873 3 053 –– later than five years 1 936 5 419 – –
21 595 25 473 4 881 –
Operating lease payments represent rentals payable by the Group for certain of its office properties. Leases are negotiated for an average term of 3 years. No contingent rent is payable.
NOTES (CONTINUED)

AYO Technology Solutions Limited I CONSOLIDATED AND SEPARATE ANNUAL FINANCIAL STATEMENTS 201854
TM
TECHNOLOGY SOLUTIONS LIMITED
38. FAIR VALUE INFORMATIONFair value hierarchyFinancial assets, financial liabilities and non-financial assets measured at fair value in the statement of financial position are Grouped into three levels of a fair value hierarchy. The three levels are defined based on the observability of significant inputs to the measurement as follows:
Level 1: Quoted unadjusted prices in active markets for identical assets or liabilities that the Group can access at measurement date.
Level 2: Inputs other than quoted prices included in level 1 that are observable for the asset or liability either directly or indirectly.
Level 3: Unobservable inputs for the asset or liability.
The following table shows the carrying amounts and fair values of financial assets and non-financial assets measured at fair value, including their levels in the fair value hierarchy. It does not include fair value information for financial assets and financial liabilities not measured at fair value if the carrying amount is a reasonable approximation of fair value.
Levels of fair value measurementsLevel 3 – Recurring fair value measurements
Group Company
Notes 2018 2017 2018 2017
ASSETSInvestments in subsidiaries at fair value through profit/(loss) 6 – – 414 974 477 646Financial assets designated at fair value through profit/(loss) 103 Laws Capital Proprietary Limited Investment 88 827 – 88 827 –Cadiz Investment Enterprise Development Fund 6 890 747 6 127 –Total 95 717 747 94 954 –
There are no transfers of assets and liabilities between Levels 1, 2 or 3 of the fair value hierarchy.
NOTES (CONTINUED)

CONSOLIDATED AND SEPARATE ANNUAL FINANCIAL STATEMENTS 2018 55
38. FAIR VALUE INFORMATION (CONTINUED)Reconciliation of assets and liabilities measured at level 3
2018
NotesOpeningbalance
Gains/(losses)recognised in
profit/(loss) Purchases SettlementsClosing
balanceGroupASSETSFinancial assets designated at fair value through profit/(loss) 103 Laws Capital Proprietary Limited Investment – – 488 827* (400 000) 88 827Cadiz Enterprise Development Investment 747 2 6 141 – 6 890Total financial assets designated at fair value through profit/(loss) 747 2 494 968 (400 000) 95 717Total 747 2 494 968 (400 000) 95 717
2017
NotesOpeningbalance
Gains/(losses)recognised in
profit/(loss) Purchases SettlementsClosing
balanceGroupASSETSFinancial assets designated at fair value through profit/(loss) 10Cadiz Enterprise Development Investment 1 129 – – (382) 747Total 1 129 – – (382) 747
2018
NotesOpeningbalance
Gains/(losses)recognised in
profit/(loss) Purchases SettlementsClosing
balanceCompanyASSETSInvestments in subsidiaries at fair value 6Investments in unlisted subsidiaries 477 646 (62 672) – – 414 974Financial assets designated at fair value through profit/(loss) 103 Laws Capital Proprietary Limited Investment – – 488 827* (400 000) 88 827Cadiz Enterprise DevelopmentInvestment – 2 6 125 – 6 127Total 477 646 (62 670) 494 952 (400 000) 509 928
2017
NotesOpeningbalance
Gains/(losses)recognised in
profit/(loss) Purchases SettlementsClosing
balanceCompanyASSETSInvestments in subsidiaries at fair value 6Investments in unlisted subsidiaries 301 782 133 676 42 188 – 477 646Total 301 782 133 676 42 188 – 477 646
Gains and losses recognised in profit or loss are included in fair value adjustments in profit and loss.
* 3 Laws Capital purchases of R488.8 million consist of R470 million initial cash invested and R18.8 million interest earned which was reinvested.
NOTES (CONTINUED)

AYO Technology Solutions Limited I CONSOLIDATED AND SEPARATE ANNUAL FINANCIAL STATEMENTS 201856
TM
TECHNOLOGY SOLUTIONS LIMITED
38. FAIR VALUE INFORMATION (CONTINUED)Financial instruments measured at cost for which a fair value is disclosedFinancial assets that are not measured at fair value, namely trade and other receivables, cash and cash equivalents, loans receivables and financial assets are categorised as loans and receivables. It has been concluded that the carrying amount of these assets approximate their fair value. Refer to note 40.
Financial liabilities that are not measured at fair value, namely loans, trade and other payables and financial liabilities are categorised as financial liabilities. It has been concluded that the carrying amount of these liabilities approximate fair value. Refer to note 41.
Information about valuation techniques and inputs used to derive level 3 fair valuesInvestment in subsidiariesThe value of investments in subsidiaries is determined using a discounted cash flow technique. A capital asset pricing model is used in which the present value of expected cash flows of the subsidiary are determined. The expected cash flows are determined by considering the current and planned operational activities of each subsidiary. The following rates were used in the valuation model:
Beta 0.68 – 1.4Terminal growth rate 4.5% – 6%Weighted average cost of capital 15.6% – 25.8%Specific risk premium 1% – 3%Debt-equity ratio 0% – 20%Cost of debt 10%
The potential effect of using reasonably possible alternative assumptions in the valuation, based on a change in the most significant input by between 1% and 10% while holding all other variables constant, is shown in the following table:
Assumption Change Movement
Cost of debt 1% 3 420Beta 0.1 21 140Weighted average cost of capital 1% 39 320Specific risk premium 1% 34 480Debt-equity ratio 10% 31 330Terminal growth 1% 23 830
Sensitivity analysis by company, for shareholding % and reflecting change onlyCost of
debt Beta WACCSpecific
riskDebt-equity
ratioTerminal
growth
Change 1% 0.1 1% 1% 10% 1%Software Tech HoldingsProprietary Limited – 200 310 310 (580) 120Health System Technologies Proprietary Limited 1 930 13 940 25 390 22 680 21 170 15 340Puleng Technologies Proprietary Limited 1 250 4 880 9 240 7 840 7 230 5 760Kalula Communication Proprietary Limited 240 2 120 4 380 3 650 3 510 2 610
3 420 21 140 39 320 34 480 31 330 23 830
Valuation processes applied by the GroupThe fair value calculation of Investments in subsidiaries are performed by the Group’s finance department and operations team, on a yearly basis. The valuation reports are reviewed with the Board of Directors in accordance with the Group’s reporting policies and operations team on a quarterly basis.
NOTES (CONTINUED)

CONSOLIDATED AND SEPARATE ANNUAL FINANCIAL STATEMENTS 2018 57
39. RELATED PARTY BALANCES AND TRANSACTIONS
Entity name RelationshipTransactiondescription
Group Company
2018 2017 2018 2017
African Equity Empowerment Investments Limited
Shareholder with significant influence
Loans receivable/(payable)
(3 404) (76 213) (5 000) (80 596)
Health System Technologies Proprietary Limited
Subsidiary Loans receivable/(payable)
(1) (1) – –
Digital Health Africa Proprietary Limited
Subsidiary Loans receivable/(payable)
169 169 – –
Sekunjalo Health and Commodities Proprietary Limited
Common share holding
Loans receivable/(payable)
1 1 1 1
KimCo Trust – common key management
Common major shareholder
Loans receivable/(payable)
(615) (700) – –
3 Laws Capital Proprietary Limited
Common shareholding
Purchase of financial asset (refer to note 38)
88 827 – 88 827 –
Minority shareholder – Kalula Communications
Subsidiary Loans receivable/(payable)
371 – – –
African Equity Empowerment Investments Limited
Shareholder with significant influence
Trade receivables/ (trade payables)
(4 314) 1 (4 315) –
Sekpharma Proprietary Limited
Common major shareholder
Trade receivables/ (trade payables)
– 228 – –
Exaro HST Limited Joint venture Trade receivables/ (trade payables)
5 354 5 354 – –
Health System Technologies Proprietary Limited
Subsidiary Trade receivables/ (trade payables)
– – (502) (13)
Health System Technologies Proprietary Limited
Subsidiary Trade receivables/ (trade payables)
– – 435 –
Premier Fishing SA Proprietary Limited
Common major shareholder
Trade receivables/ (trade payables)
(29) (8) (18) –
African Technology and Media Holdings
Common major shareholder
Trade receivables/ (trade payables)
– 1 411 – –
BT Communications Services South Africa Proprietary Limited
Common major shareholder
Trade receivables/ (trade payables)
(37 158) – (37 158) –
Tripos Travel Proprietary Limited
Common major shareholder
Trade receivables/ (trade payables)
(397) – (397) –
Kalula Communications Proprietary Limited
Subsidiary Trade receivables/ (trade payables)
– – 1 114 –
Afrinat Proprietary Limited
Shareholder with significant influence
Trade receivables/ (trade payables)
25 – – –
Premfresh Proprietary Limited
Common major shareholder
Trade receivables/ (trade payables)
(121) – (121) –
Puleng Technology Proprietary Limited
Subsidiary Dividend receivable
– – 2 677 –
African Equity Empowerment Investments Limited
Shareholder with significant influence
Interest paid on shareholder loan
766 8 089 766 8 089
NOTES (CONTINUED)

AYO Technology Solutions Limited I CONSOLIDATED AND SEPARATE ANNUAL FINANCIAL STATEMENTS 201858
TM
TECHNOLOGY SOLUTIONS LIMITED
39. RELATED PARTY BALANCES AND TRANSACTIONS (CONTINUED)
Entity name RelationshipTransactiondescription
Group Company
2018 2017 2018 2017
African Equity Empowerment Investments Limited
Shareholder with significant influence
Interest (received from) loan to shareholder
(466) (306) – (3)
3 Laws Capital Proprietary Limited
Common shareholding
Interest (received from) investment (refer to note 38)
(18 827) – (18 827) –
Biton Music Productions Proprietary Limited
Common shareholder
Rent payable for property
1 006 – – –
Sub-lease to directors
Director Rent receivable on motor vehicle lease
(228) – – –
Health System Technologies Proprietary Limited
Subsidiary Commission received
– – (3 029) (8 530)
African Equity Empowerment Investments Proprietary Limited
Shareholder with significant influence
Administration fees paid to/(received from)
7 203 2 968 7 203 2 968
Health System Technologies Proprietary Limited
Subsidiary Administration fees paid to/(received from)
– – (4 474) (3 831)
Kalula Communication Proprietary Limited
Subsidiary Administration fees paid to/(received from)
– – – (977)
African Equity Empowerment Investments Limited
Shareholder with significant influence
Sales (76) (2 436) – –
Sekpharma Proprietary Limited
Joint venture Sales – (284) – –
Exaro HST Limited Joint venture Sales – (651) – –Premier Fishing SA Proprietary Limited
Common major shareholder
Sales (282) (49) – –
Health System Technology Solutions
Subsidiary Sales – – – (11)
Premier Fishing SA Proprietary Limited
Common major shareholder
Purchases – HR services and courier fees
194 211 – –
African Equity Empowerment Investments Limited
Shareholder with significant influence
Purchases – marketing fees and bank charges
346 516 – –
Tripos Travel Proprietary Limited
Common major shareholder
Purchases – travel – 134 – –
Health System Technologies Proprietary Limited
Subsidiary Purchases – laptops, rent, IT services
– – 930 21
BT Communications Proprietary Limited
Common major shareholder
Purchases – information technology management services
37 633 – 33 885 –
African Equity Empowerment Investments Limited
Shareholder with significant influence
Sundry income received – recovery of expenditure paid by the Company on behalf of AEEI
– (283) – (283)
NOTES (CONTINUED)

CONSOLIDATED AND SEPARATE ANNUAL FINANCIAL STATEMENTS 2018 59
39. RELATED PARTY BALANCES AND TRANSACTIONS (CONTINUED)
Entity name RelationshipTransactiondescription
Group Company
2018 2017 2018 2017
Premier Fishing SA Proprietary Limited
Common major shareholder
Sundry income received – recovery of expenditure paid by the Company on behalf of Premier
– (238) – (238)
Afrinat Proprietary Limited
Common major shareholder
Sundry income received – recovery of salaries paid by the Company on behalf of Afrinat
(2 136) (3 374) (2 136) (3 374)
Health System Technology Proprietary Limited
Subsidiary Sundry income received – recovery of expenditure paid by the Company on behalf of HST
– – (11) (74)
Sekunjalo Medical Services Proprietary Limited
Subsidiary Dividend received – – (3 200) (5 969)
Puleng Technologies Proprietary Limited
Subsidiary Dividend received – – (10 193) (1 458)
Software Tech Holdings Proprietary Limited
Subsidiary Dividend received – – (7 773) (2 896)
African Equity Empowerment Investments Limited
Shareholder with significant influence
Advertising, marketing paid to related parties
– 20 – 20
Independent News and Media Proprietary Limited
Common major shareholder
Advertising, marketing paid to related parties
335 – 335 –
esp Afrika Proprietary Limited
Common major shareholder
Advertising, marketing paid to related parties
3 051 – 3 051 –
African Equity Empowerment Investments Limited
Shareholder with significant influence
Conferences, meetings and seminars
99 21 99 21
Puleng Technologies Proprietary Limited
Subsidiary Conferences, meetings and seminars
– – 42 –
African Equity Empowerment Investments Limited
Shareholder with significant influence
Consulting fees paid
– 111 – 111
Sekunjalo Capital Common major shareholder
Consulting fees paid – tax and corporate finance services
400 50 400 50
Saratoga Private Equity Proprietary Limited
Common shareholder
Consulting fees paid – Information technology services
– 60 – –
S Young Director Consulting fees paid business strategy advisory
341 – 341 –
NOTES (CONTINUED)

AYO Technology Solutions Limited I CONSOLIDATED AND SEPARATE ANNUAL FINANCIAL STATEMENTS 201860
TM
TECHNOLOGY SOLUTIONS LIMITED
39. RELATED PARTY BALANCES AND TRANSACTIONS (CONTINUED)
Entity name RelationshipTransactiondescription
Group Company
2018 2017 2018 2017
Thunder Capital Assets Proprietary Limited
Common shareholder
Consulting fees paid – retainer paid for director
– 52 – –
African Equity Empowerment Investments Limited
Shareholder with significant influence
Legal fees paid
– 714 – 714
Premier Fishing SA Proprietary Limited
Common major shareholder
Professional service fees paid to related parties
82 28 82 28
African Equity Empowerment Investments Limited
Shareholder with significant influence
Corporate finances services for listing
57 700 – 57 700 –
World Wide Creative Proprietary Limited
Subsidiary Professional service fees paid to related parties
– – 220 –
Tripos Tourism Investments Proprietary Limited
Common major shareholder
Travel and Accommodation paid to related parties
1 047 9 1 047 9
Health System Technology Proprietary Limited
Subsidiary Travel and accommodation paid to related parties
– – – 7
Emergent Energy Proprietary Limited
Associates Accounting fees paid to related parties
– (192) – –
Health Systems Technology Proprietary Limited
Subsidiary Recovery of CFO’s salary paid by HST on behalf of the Company
– – 750 –
Kalula Communications Proprietary Limited
Subsidiary Information technology hardware
143 – 143 –
Short-term employee benefits
Directors and other key management
Compensation to directors and other key management
21 483 34 321 – –
3 Laws CapitalProprietaryLimited
Commonshareholding
Managementfee paid
1 263 – 1 263 –
3 Laws CapitalProprietaryLimited
Commonshareholding
(Tradepayables)
(1 263) – (1 263) –
NOTES (CONTINUED)

CONSOLIDATED AND SEPARATE ANNUAL FINANCIAL STATEMENTS 2018 61
40. FINANCIAL ASSETS BY CATEGORYThe accounting policies for financial instruments have been applied to the line items below:
Categories of financial instruments – Group – 2018
Loans andreceivables
Fair valuethrough profit or
loss – held fortrading
Non-financial
assets TotalASSETSLoans to group companies 1 989 – – 1 989Trade and other receivables 135 762 – 47 460 183 222Other financial assets 93 390 6 890 – 100 280Cash and cash equivalents 4 308 698 – – 4 308 698
4 539 839 6 890 47 460 4 594 189
Categories of financial instruments – Group – 2017
Loans andreceivables
Fair valuethrough profit or
loss – held fortrading
Non-financial
assets Total
ASSETSLoans to group companies 4 552 – – 4 552Trade and other receivables 98 057 – 12 371 110 428Cash and cash equivalents 74 229 – – 74 229Other financial assets 19 266 747 – 20 013
196 104 747 12 371 209 222
Categories of financial instruments – Company – 2018
Loans andreceivables
Fair valuethrough profit
or loss –designated
Non-financial
assets TotalASSETSLoans to group companies 1 – – 1Investment in subsidiaries – 414 974 – 414 974Trade and other receivables 56 713 – 44 337 101 050Other financial assets 92 304 6 127 – 98 431Cash and cash equivalents 4 246 813 – – 4 246 813
4 395 831 421 101 44 337 4 861 269
Categories of financial instruments – Company – 2017
Loans andreceivables
Fair valuethrough profit
or loss –designated
Non-financial
assets Total
ASSETSLoans to group companies 1 – – 1Investment in subsidiaries – 477 646 – 477 646Trade and other receivables 4 665 – 58 4 723Other financial assets 3 024 – – 3 024Cash and cash equivalents 2 269 – – 2 269
9 959 477 646 58 487 663
NOTES (CONTINUED)

AYO Technology Solutions Limited I CONSOLIDATED AND SEPARATE ANNUAL FINANCIAL STATEMENTS 201862
TM
TECHNOLOGY SOLUTIONS LIMITED
41. FINANCIAL LIABILITY BY CATEGORYThe accounting policies for financial instruments have been applied to the line items below:
Categories of financial instruments – Group – 2018Financial
liabilities atamortised
cost
Non-financialliability Total
LIABILITIESLoans from group companies 5 001 – 5 001Financial liabilities 1 133 – 1 133Finance lease liability – 964 964Trade and other payables 111 982 20 942 132 924Bank overdraft 5 056 – 5 056Operating lease liability – 47 47
123 172 21 953 145 125
Categories of financial instruments – Group – 2017Financial
liabilities atamortised
cost
Non-financial
liability Total
LIABILITIESLoans from group companies 80 597 – 80 597Loans from shareholders 69 – 69Finance lease liability – 2 808 2 808Financial liabilities 5 742 – 5 742Trade and other payables 88 013 20 490 108 503Operating lease liability – 305 305Bank overdraft 3 109 – 3 109Deferred income – 2 981 2 981
177 530 26 584 204 114
Categories of financial instruments – Company – 2018
Financialliabilities at
amortised cost
Non-financialliability Total
LIABILITIESLoans from group companies 5 000 – 5 000Trade and other payables 45 129 8 101 53 230
50 129 8 101 58 230
Categories of financial instruments – Company – 2017Financial
liabilities atamortised
cost
Non-financial
liability Total
LIABILITIESLoans from group companies 80 596 – 80 596Financial liabilities 4 724 – 4 724Trade and other payables 244 1 151 1 395
85 564 1 151 86 715
NOTES (CONTINUED)

CONSOLIDATED AND SEPARATE ANNUAL FINANCIAL STATEMENTS 2018 63
42. RISK MANAGEMENTFINANCIAL RISK MANAGEMENTThe Group holds financial instruments to finance its operations and to manage the financial risk that arises from these operations. The Group’s activities expose it to a variety of financial risks: market risk (including currency risk, price risk and fair value interest rate risk), credit risk, liquidity risk and cash flow interest rate risk. Risk management is carried out by the Group under policies approved by the board.
LIQUIDITY RISKThe Group’s risk to liquidity is as a result of the funds available to cover future commitments. The Group manages liquidity risk through an ongoing review of future commitments and credit facilities. African Equity Empowerment Investments Limited has subordinated their loan and gives support to the Group which reduces the liquidity risk of the Group.
Cash flow forecasts are prepared and adequately utilised borrowing facilities are monitored.
The table below analyses the Group’s financial liabilities into relevant maturity groupings based on the remaining contractual period at the reporting date. The amounts disclosed in the table are the contractual undiscounted cash flows.
At 31 August 2018Less than
1 YearBetween 1
and 2 yearsBetween 2
and 5 years Total
GroupTrade and other payables 132 927 – – 132 927Loans from group companies 5 000 – – 5 000Finance lease liability 389 575 – 964Other financial liabilities 1 133 – – 1 133
At 31 August 2017Up to
1 yearBetween 1
and 2 years Total
GroupTrade and other payables 108 505 – 108 505Loans from group companies 80 597 – 80 597Finance lease liability 259 2 549 2 808Other financial liabilities 5 692 50 5 742
At 31 August 2018Less than
1 YearBetween 1
and 2 yearsOver
5 yearsCompanyTrade and other payables 53 232 – 50 632Loans from group companies 5 000 – 5 000
At 31 August 2017Less than
1 YearOver
5 yearsCompanyTrade and other payables 1 398 1 398Loans to group companies 80 596 80 596Financial liabilities 4 724 4 724
NOTES (CONTINUED)

AYO Technology Solutions Limited I CONSOLIDATED AND SEPARATE ANNUAL FINANCIAL STATEMENTS 201864
TM
TECHNOLOGY SOLUTIONS LIMITED
42. RISK MANAGEMENT (CONTINUED)INTEREST RATE RISKAt 31 August 2018, if interest rates on Rand-denominated borrowings had been 1% higher/lower with all other variables held constant, post-tax profit for the year would have been R12 678 (2017: R64 038) lower/higher, mainly as a result of higher/lower finance cost on floating rate borrowings.
Interest rate risk is the risk that the value of future cash flows of a financial instrument will fluctuate because of changes in market rates.
The Group adopts a policy of ensuring that 100% of its interest rate risk exposure is at a fixed rate.
CREDIT RISKCredit risk is the risk that a counter-party to a financial instrument will fail to discharge an obligation and cause the Group to incur a financial loss.
Credit risk consists mainly of cash deposits, cash equivalents, and trade receivables. The Group only deposits cash with major banks with high-quality credit standing and limits exposure to any one counterparty.
The Group utilises the services of Absa Bank Limited, First National Bank and Standard Bank, of which the credit ratings are as follows:
MOODY’S RATING FITCH RATINGS
Absa Group Absa Group Absa Bank LimitedLong-term Baa3 BB+ BB+Outlook Negative Negative Stable
Standard Bank Standard Bank Standard BankLong-term Baa3 Ba1 BB+Outlook Stable Stable Stable
First National Bank First National Bank First Rand Limited Long-term Baa3 BB+ BB+Outlook Negative BB+ Negative
Management evaluated credit risk relating to customers on an ongoing basis. If customers are independently rate, these ratings are used. Otherwise, if there is no independent rating, risk control assesses the credit quality of the customer, taking into account its financial position, past experience and other factors. Individual risk limits are set based on internal or external ratings in accordance with limits set by the Board. The utilisation of credit limits is regularly monitored. Sales to retail customer are settled in cash.
Credit risk with respect to receivables is limited due to the number of debtors comprising the Group’s customer base. Although the Group is directly affected by the financial condition of its customers, management does not believe significant credit risk exist at 31 August 2018. Generally, the Group does not require collateral or other securities to support its accounts receivable.
Loans to Group companies are managed at Group level by the Group treasury function. Regular reviews of subsidiary cash flows and loan repayment are monitored on an ongoing basis. Advances and repayment are assessed per the agreed terms. Where there are any deviations, this is brought to the attention of the Group treasury function and the Company’s Board of Directors.
Financial assets exposed to credit risk at period end were as follows:
Group Company
2018 2017 2018 2017
Financial instrumentLoans receivable 1 989 4 552 – 1Financial assets 100 280 20 013 98 431 3 024Trade and other receivables 183 222 110 428 101 050 4 723Cash and cash equivalents 4 308 698 74 229 4 246 813 2 269
NOTES (CONTINUED)

CONSOLIDATED AND SEPARATE ANNUAL FINANCIAL STATEMENTS 2018 65
42. RISK MANAGEMENT (CONTINUED)CREDIT RISK (CONTINUED)At 31 August 2018, the exposure to credit risk for trade receivables by geographic region was as follows:
2018GroupAfrica 8 476Europe 190
8 666
Non-government 80 763Government institutes 23 219
103 982
The Group performs ongoing credit evaluations of the financial condition of all customers. Before any new customer is approved for credit, a thorough credit check is performed by an external credit agency. The agency provides credit scores and credit ratings on each customer. In addition to that a recommended credit limit is provided by the credit agency. Additional internal ratings and credit limit checklist procedures are performed by management before a final credit limit is approved to our customers. The credit quality of trade and other receivables that are neither past due nor impaired is assessed by management based on historical information about counterparty default ratings if available. The customer base consists of both foreign and local customers. Credit quality is considered to be high.
FOREIGN EXCHANGE RISKManagement has set up a policy to require Group companies to manage their foreign exchange risk against their functional currency. The Group companies are required to hedge their entire foreign exchange risk exposure with Group treasury. To manage their foreign exchange risk arising from future commercial transactions and recognised assets and liabilities, entities in the Group use forward contracts. Foreign exchange risk arises when future commercial transactions or recognised assets or liabilities are denominated in a currency that is not the entity’s functional currency.
The Group was exposed to both US Dollar and British Pound exposure during the year. At the reporting date, only a US Dollar balance existed and was restated.
FOREIGN CURRENCY EXPOSURE AT REPORTING DATE
Current assetsTrade debtors USD 13 274 (2017: USD 207 329) 192 2 692
LiabilitiesTrade payables, USD 1 187 878 (2017: USD 629 524) 17 176 8 175
Exchange rates used for conversation of foreign items wereUSD 14,4591 12,9854
At 31 August 2018, if the currency had been 10% higher or lower against the US Dollar with all other variables held constant, post-tax profit for the year would have been R1 222 828 higher or lower (2017: R246 326).
The Group reviews its foreign currency exposure, including commitments on an ongoing basis. The Company expects its foreign exchange contracts to hedge foreign exchange exposure.
43. EVENTS AFTER THE REPORTING PERIODOn 21 August 2018, the Board of Directors approved the Company entering into a binding offer with Loxisource Proprietary Limited and Alexisource Proprietary Limited to acquire 55% of the share capital of Zaloserve Proprietary Limited. Zaloserve is an investment holding company that holds a 100% shareholding in Opiwize Proprietary Limited, which in turn holds 100% shareholding in Sizwe Africa IT Proprietary Limited. The investment will be purchased for R165 million. A payment of 90% of the purchase price will be settled upfront with the balance being settled upon the achievement of warranted profits for a 3-year period.
As per IFRS 3 B64 the acquisition is required to be disclosed as a business combination but due to the fact that the timing between when the deal was finalised and the issue date of the financial statements initial accounting for a business combination was incomplete.
On 21 August 2018, the Board of Directors approved the Company entering into a joint venture with the Vunani Group an independently managed diversified financial services group. The formation of a R100 million fintech joint venture to expand the fintech platform and financial services activities of Vunani further diversifying the portfolio of AYO.
NOTES (CONTINUED)

AYO Technology Solutions Limited I CONSOLIDATED AND SEPARATE ANNUAL FINANCIAL STATEMENTS 201866
TM
TECHNOLOGY SOLUTIONS LIMITED
44. DIRECTORS’ EMOLUMENTSThe aggregate remuneration of the Directors for the financial year ending 31 August 2018, paid by the Group (AYO Technology Solutions and any of its subsidiaries) is as follows:
2018
Salary Bonus
MedicalGroup lifeand other
Pensioncontri-
butionsDirectors’
fees TotalCF Hendricks1,3 – – – – – – K Abdulla1,4 – – – – – – AB Amod1,6 – – – – – – N Gamieldien2 1 543 377 10 27 – 1 957 GW Madzonga1 – – – – – – KAW Hardy2 2 500 2 000 111 284 – 4 895S Nodwele2 1 716 320 51 111 – 2 198S Young1.5 – – – 486 486TM Ntsasa1 – – – – – – MF Khoza1 – – – – – – Dr W Mgoqi1 – – – – – – Dr D George1 – – – – – – R Mosia1,7 – – – – – – S Rasethaba1 – – – – – – N Ramathlodi1,8 – – – – 101 101
5 759 2 697 172 422 587 9 6372017
Salary Bonus
MedicalGroup lifeand other
Pensioncontri-
butions Total
CF Hendricks1 – – – – –K Abdulla1 – – – – –AB Amod1 – – – – –N Gamieldien2 934 170 56 131 1 291GW Madzonga1,9 – – – – –KAW Hardy1,9 – – – – –S Nodwele1,9 – – – – –S Young1,9 – – – – –TM Ntsasa1,9 – – – – –MF Khoza1,9 – – – – –Dr W Mgoqi1,9 – – – – –Dr D George1,9 – – – – –R Mosia1,9 – – – – –S Rasethaba1,9 – – – – –N Ramathlodi1,9 – – – – –
934 170 56 131 1 291
Note:1 Non-executive directors.2 Executive directors.3 CF Hendricks was remunerated by AEEI an amount of R568 524 and by Premier Fishing SA Limited (Premier) an amount of R946 929. Such remuneration was
not payable by AYO Technology, nor was it for services rendered as a Director of the Company.4 K Abdulla was remunerated by AEEI in an amount of R6 058 094. Such remuneration was not payable by AYO Technology nor was it for services rendered as
a Director of the Company.5 S Young was remunerated by AEEI in amount of R369 504 and by Premier an amount of R 182 544. Such remuneration was not payable by AYO Technology
nor was it for services rendered as a Director of the Company.6 AB Amod was remunerated by AEEI in amount of R216 287 and by Premier an amount of R635 682. Such remuneration was not payable by AYO Technology
nor was it for services rendered as a Director of the Company.7 R Mosia was remunerated by Premier an amount of R 182 544. Such remuneration was not payable by AYO Technology nor was it for services rendered as a
Director of the Company.8 N Ramathlodi was remunerated by AEEI in amount of R107 506 and by Premier an amount of R76 149. Such remuneration was not payable by AYO Technology
nor was it for services rendered as a Director of the Company.9 The Directors were appointed during the current reporting period.
NOTES (CONTINUED)

CONSOLIDATED AND SEPARATE ANNUAL FINANCIAL STATEMENTS 2018 67
44. DIRECTORS’ EMOLUMENTS (CONTINUED)The Companies Act of South Africa require that the Company also discloses remuneration and benefits received or receivable by Directors of the Company from any holding company or its subsidiaries. AYO Technology Solutions Limited was a subsidiary of African Equity Empowerment Investments (AEEI) for a portion of the reporting period, as such remuneration received from AEEI or any of its subsidiaries is disclosed.
Directors are not entitled to any commission and are not party to any gain or profit-sharing arrangements with the Group. Save for the emoluments set out above, no other material benefits were received by Directors.
Direct and indirect interest of the DirectorsThe direct and indirect interests of the Directors and their associates (including a director who has resigned during the last 18 months) in the issued share capital of the Company at the reporting date is as follows:
2018
Share helddirectly
number ofshare held
Direct % ofshares in
issue held
Indirectnumber of
shares held
Indirect % ofshares in
issueheld
Total number
of shares held
% of shares in issue
held DirectorK Abdulla 1 250 0.00% – – 1 250 0.00%S Young 2 500 0.00% – – 2 500 0.00%A Amod 1 250 0.00% – – 1 250 0.00%Total 5 000 0.00% – – 5 000 0.00%
2017
Share helddirectly
number ofshare held
Direct % ofshares in
issue held
Indirectnumber of
shares held
Indirect % ofshares in
issueheld
Total number
of shares held
% of shares in issue
held
DirectorK Abdulla 1 250 0.00% – – 1 250 0.00%S Young 2 500 0.00% – – 2 500 0.00%A Amod 1 250 0.00% – – 1 250 0.00%Total 5 000 0.00% – – 5 000 0.00%
There have been no changes in beneficial interest that occurred between the end of the reporting period and the date of this report.
45. AUDITOR’S REMUNERATION2018 2017
Auditor’s remunerationAudit fees 731 102 458 453
NOTES (CONTINUED)

AYO Technology Solutions Limited I CONSOLIDATED AND SEPARATE ANNUAL FINANCIAL STATEMENTS 201868
TM
TECHNOLOGY SOLUTIONS LIMITED
ANALYSIS OF SHAREHOLDER INFORMATIONShareholder information as at 31 August 2018
Number ofshareholders
Percentageof total
shareholdersNumber
of shares
Percentage oftotal issued
shares
ANALYSIS OF SHAREHOLDINGS1 – 5 000 862 81.11% 1 120 336 0.33%5 001 – 10 000 69 6.48% 520 775 0.15%10 001 – 100 000 98 9.21% 2 863 818 0.83%100 001 – 1 000 000 16 1.50% 3 568 039 1.04%1 000 001 – and more 18 1.69% 336 052 226 97.65%Totals 1 063 100.00% 344 125 194 100.00%
Numberof shares
Percentage oftotal issued
shares
MAJOR SHAREHOLDERS (5% AND MORE OF THE SHARES IN ISSUE)African Equity Empowerment Investments Limited 169 866 829 49.36%Government Employees Pension Fund 99 782 655 29.00%
269 649 484 78.36%
SHAREHOLDER SPREADNumber of
shareholders
Percentage of total
shareholdersNumber
of shares
Percentage oftotal issued
shares
Non-public: 5 0.47% 269 654 484 78.36%Directors 3 0.28% 5 000 0.00%>than 10% of I/C 2 0.19% 269 649 484 78.36%
Public 1 058 99.53% 74 470 710 21.64%
Totals 1 063 100.00% 344 125 194 100.00%
DISTRIBUTION OF SHAREHOLDERSIndividuals 936 88.05% 36 011 318 10.46%Nominee companies and trusts 59 5.55% 5 345 294 1.55%Public companies 2 0.19% 269 649 484 78.36%Close corporations and private companies 66 6.21% 33 119 098 9.62%Totals 1 063 100% 344 125 194 100%
SHARE TRADING STATISTICS
Market priceper share
(cents)
High 4 500Low 1 404Year-end 3 000Volume traded (shares) 840 718Value traded (rand) 33 087 187Volume of shares traded as a percentage of issued capital 0.24%Market capitalisation at 31 August 2018 (rand) 10 323 755 820 Market capitalisation at 7 November 2018 (rand) 8 585 923 590

CONSOLIDATED AND SEPARATE ANNUAL FINANCIAL STATEMENTS 2018 69
SHAREHOLDERS’ DIARY
ANNUAL GENERAL MEETINGFINANCIAL REPORTSAnnouncement of interim results May 2019Interim report May 2019 Announcement of annual results November 2019 Integrated report November 2019
DIVIDEND PAYMENTGross dividend (cents per share) 30.00Dividend net of dividend withholding tax (cents per share) 24.00Announcement date Monday, 12 November 2018Last date to trade cum dividend Tuesday, 27 November 2018Trading ex-dividend commences Wednesday, 28 November 2018Record date Friday, 30 November 2018Date of payment Monday, 3 December 2018
Share certificates may not be dematerialised between Wednesday, 28 November 2018 and Friday, 30 November 2018, both days inclusive.
ADMINISTRATIONCOMPANY SECRETARYCompany secretary: R Nock
Registered address: Quay 7, East Pier, V&A Waterfront, Cape Town, 8001
Email: [email protected]
Transfer secretaries: Link Market Services South Africa Proprietary Limited13th Floor, 19 Ameshoff Street, Braamfontein, 2001
Auditors: BDO Cape Incorporated6th Floor, 123 Hertzog Boulevard, Cape Town, 8001(PO Box 2275, Cape Town, 8000)
Sponsor: PSG Capital Proprietary Limited1st Floor, Ou Kollege Building, 35 Kerk Street, Stellenbosch, 7600
LISTINGJohannesburg Stock Exchange Sector: Diversified Industrials Share Code: AYOISIN Code: ZAE000252441

WWW.AYOTSL.COM


