29
4Q13/ 2013 Earnings Release February 26, 2014 Page 1 of 29 2013 Consolidated Earnings Release 4Q13/2013

4Q13/ 2013 Earnings Release
February 26, 2014 Page 1 of 29
2013
Consolidated Earnings Release 4Q13/2013
4Q13/ 2013 Earnings Release
February 26, 2014 Page 2 of 29
EARNINGS CONFERENCE
CALL AGENDA
IN PORTUGUESE Thursday (February 27, 2014)
10:00 a.m. (São Paulo) 8:00 a.m. (US Eastern Time) Dial in: +55 (11) 4688-6361
Code: ARTERIS Replay: from February 27 to March 5
Dial in: +55 (11) 4688-6312 Code: 5799080#
IN ENGLISH
Thursday (February 27, 2014) 12:00 p.m. (São Paulo)
10:00 a.m. (US Eastern Time) Dial in: +55 (11) 4688-6361
Code: ARTERIS Replay: from February 27 to March 5
Dial in: +55 (11) 4688-6312 Code: 9379861#
WEBCAST Live audio webcast available at
http://webcall.riweb.com.br/arteris with replay available on the
Company’s website after the event.
BM&FBovespa: ARTR3 Bloomberg: ARTR3 BZ Thomson Reuters: ARTR.BR Update on February 25, 2014 Closing Price: R$16.12 per share Market Cap: R$5.5 billion
São Paulo, February 26, 2014 – Arteris S.A. – (BM&FBovespa Novo Mercado: ARTR3)
announces its consolidated results for the fourth quarter and full year ended December 31,
2014 (4Q13 and 2013). Except where stated otherwise, the following financial and operating
information is presented on a consolidated basis and in Brazilian reais (R$), pursuant to
Brazilian Corporate Law.
4Q13/2013 HIGHLIGHTS
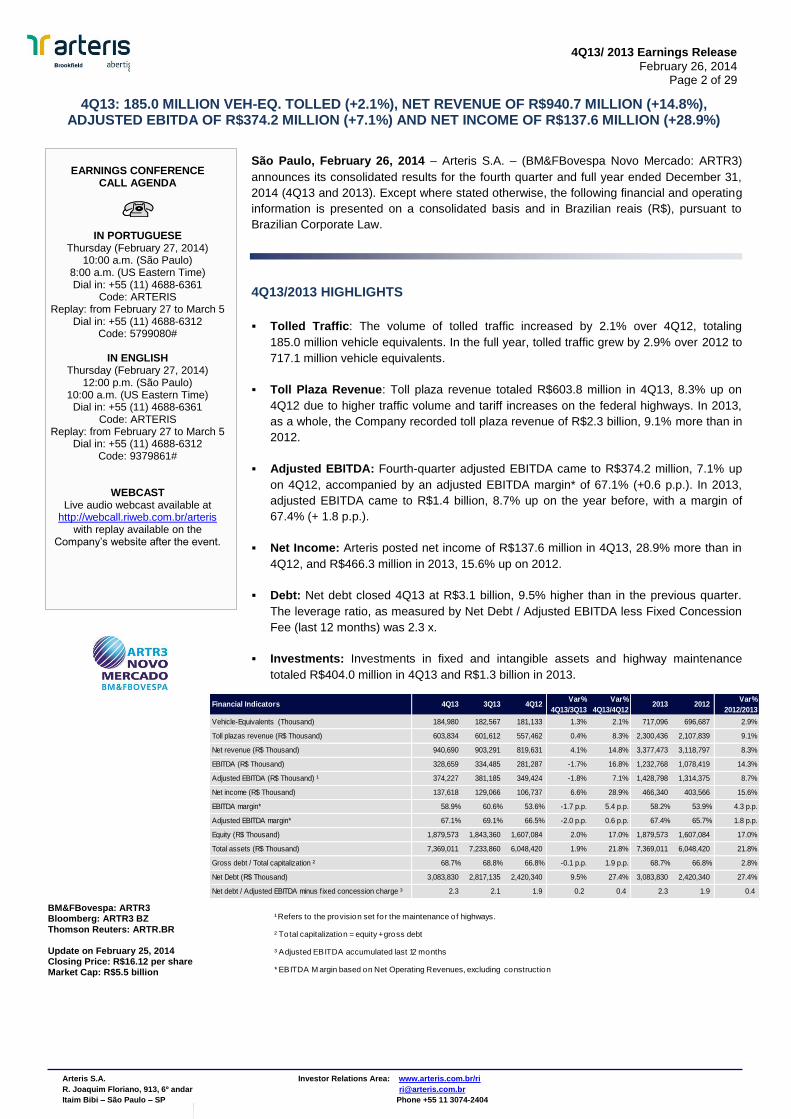
Tolled Traffic: The volume of tolled traffic increased by 2.1% over 4Q12, totaling
185.0 million vehicle equivalents. In the full year, tolled traffic grew by 2.9% over 2012 to
717.1 million vehicle equivalents.
Toll Plaza Revenue: Toll plaza revenue totaled R$603.8 million in 4Q13, 8.3% up on
4Q12 due to higher traffic volume and tariff increases on the federal highways. In 2013,
as a whole, the Company recorded toll plaza revenue of R$2.3 billion, 9.1% more than in
2012.
Adjusted EBITDA: Fourth-quarter adjusted EBITDA came to R$374.2 million, 7.1% up
on 4Q12, accompanied by an adjusted EBITDA margin* of 67.1% (+0.6 p.p.). In 2013,
adjusted EBITDA came to R$1.4 billion, 8.7% up on the year before, with a margin of
67.4% (+ 1.8 p.p.).
Net Income: Arteris posted net income of R$137.6 million in 4Q13, 28.9% more than in
4Q12, and R$466.3 million in 2013, 15.6% up on 2012.
Debt: Net debt closed 4Q13 at R$3.1 billion, 9.5% higher than in the previous quarter.
The leverage ratio, as measured by Net Debt / Adjusted EBITDA less Fixed Concession
Fee (last 12 months) was 2.3 x.
Investments: Investments in fixed and intangible assets and highway maintenance
totaled R$404.0 million in 4Q13 and R$1.3 billion in 2013.
4Q13: 185.0 MILLION VEH-EQ. TOLLED (+2.1%), NET REVENUE OF R$940.7 MILLION (+14.8%), ADJUSTED EBITDA OF R$374.2 MILLION (+7.1%) AND NET INCOME OF R$137.6 MILLION (+28.9%)
Arteris S.A. Investor Relations Area: www.arteris.com.br/ri
R. Joaquim Floriano, 913, 6º andar [email protected]
Itaim Bibi – São Paulo – SP Phone +55 11 3074-2404
CEP 04534-013
Financial Indicators 4Q13 3Q13 4Q12Var%
4Q13/3Q13
Var%
4Q13/4Q122013 2012
Var%
2012/2013
Vehicle-Equivalents (Thousand) 184,980 182,567 181,133 1.3% 2.1% 717,096 696,687 2.9%
Toll plazas revenue (R$ Thousand) 603,834 601,612 557,462 0.4% 8.3% 2,300,436 2,107,839 9.1%
Net revenue (R$ Thousand) 940,690 903,291 819,631 4.1% 14.8% 3,377,473 3,118,797 8.3%
EBITDA (R$ Thousand) 328,659 334,485 281,287 -1.7% 16.8% 1,232,768 1,078,419 14.3%
Adjusted EBITDA (R$ Thousand) ¹ 374,227 381,185 349,424 -1.8% 7.1% 1,428,798 1,314,375 8.7%
Net income (R$ Thousand) 137,618 129,066 106,737 6.6% 28.9% 466,340 403,566 15.6%
EBITDA margin* 58.9% 60.6% 53.6% -1.7 p.p. 5.4 p.p. 58.2% 53.9% 4.3 p.p.
Adjusted EBITDA margin* 67.1% 69.1% 66.5% -2.0 p.p. 0.6 p.p. 67.4% 65.7% 1.8 p.p.
Equity (R$ Thousand) 1,879,573 1,843,360 1,607,084 2.0% 17.0% 1,879,573 1,607,084 17.0%
Total assets (R$ Thousand) 7,369,011 7,233,860 6,048,420 1.9% 21.8% 7,369,011 6,048,420 21.8%
Gross debt / Total capitalization ² 68.7% 68.8% 66.8% -0.1 p.p. 1.9 p.p. 68.7% 66.8% 2.8%
Net Debt (R$ Thousand) 3,083,830 2,817,135 2,420,340 9.5% 27.4% 3,083,830 2,420,340 27.4%
Net debt / Adjusted EBITDA minus f ixed concession charge ³ 2.3 2.1 1.9 0.2 0.4 2.3 1.9 0.4
¹ Refers to the provision set for the maintenance of highways.
² Total capitalization = equity + gross debt
³ Adjusted EBITDA accumulated last 12 months
* EBITDA M argin based on Net Operating Revenues, excluding construction Revenues

4Q13/ 2013 Earnings Release
February 26, 2014 Page 3 of 29
* The EBITDA margin is based on Net Operating Revenue, excluding Construction Revenue.
4Q13 3Q13 4Q12 Var%
4Q13/3Q13
Var%
4Q13/4Q12 2013 2012
Var%
2013/2012
GROSS SERVICE REVENUE 1,001,165 961,538 874,841 4.1% 14.4% 3,602,183 3,327,922 8.2%
Toll plazas revenue 603,834 601,612 557,462 0.4% 8.3% 2,300,436 2,107,839 9.1%
State 357,049 361,631 322,085 -1.3% 10.9% 1,339,489 1,203,094 11.3%
Autovias 84,813 86,319 77,888 -1.7% 8.9% 321,780 294,355 9.3%
Centrovias 93,990 92,572 83,394 1.5% 12.7% 346,881 306,564 13.2%
Intervias 97,175 100,466 88,466 -3.3% 9.8% 367,927 332,033 10.8%
Vianorte 81,071 82,274 72,337 -1.5% 12.1% 302,901 270,142 12.1%
Federal 246,785 239,981 235,377 2.8% 4.8% 960,947 904,745 6.2%
Planalto Sul 26,879 26,087 23,727 3.0% 13.3% 103,544 92,493 11.9%
Fluminense 41,270 40,630 38,491 1.6% 7.2% 158,958 150,238 5.8%
Fernão Dias 60,230 59,218 58,306 1.7% 3.3% 231,870 224,990 3.1%
Régis Bittencourt 69,994 68,807 67,590 1.7% 3.6% 270,240 262,974 2.8%
Litoral Sul 48,412 45,239 47,263 7.0% 2.4% 196,335 174,050 12.8%
Others 14,347 8,664 22,825 65.6% -37.1% 42,877 102,946 -58.4%
Construction services 382,984 351,262 294,554 9.0% 30.0% 1,258,870 1,117,137 12.7%
DEDUCTIONS FROM REVENUE (60,475) (58,247) (55,210) 3.8% 9.5% (224,710) (209,125) 7.5%
NET SERVICE REVENUE 940,690 903,291 819,631 4.1% 14.8% 3,377,473 3,118,797 8.3%
COST AND EXPENSES (612,031) (568,806) (538,344) 7.6% 13.7% (2,144,705) (2,040,378) 5.1%
Cost of services (excl. depreciation and amortization) (129,964) (129,002) (134,114) 0.7% -3.1% (511,490) (530,218) -3.5%
Cost of construction services (382,984) (351,262) (294,554) 9.0% 30.0% (1,258,870) (1,117,137) 12.7%
Administrative expenses (excl. depreciation and amortization) (48,774) (39,465) (39,539) 23.6% 23.4% (166,798) (148,364) 12.4%
Directors' compensation (6,134) (5,826) (4,644) 5.3% 32.1% (21,331) (15,471) 37.9%
Tax expenses (760) (877) (855) -13.3% -11.1% (3,146) (3,700) -15.0%
Provision for maintenance in highw ays (45,568) (46,700) (68,137) -2.4% -33.1% (196,030) (235,956) -16.9%
Other operating income, net 2,153 4,326 3,499 -50.2% -38.5% 12,960 10,468 23.8%
EBITDA 328,659 334,485 281,287 -1.7% 16.8% 1,232,768 1,078,419 14.3%
EBITDA Margin* 58.9% 60.6% 53.6% 58.2% 53.9%
DEPRECIATION AND AMORTIZATION (77,011) (74,968) (62,172) 2.7% 23.9% (285,745) (241,519) 18.3%
Depreciation and amortization (77,011) (74,968) (62,172) 2.7% 23.9% (285,745) (241,519) 18.3%
FINANCE INCOME (COSTS) (79,366) (63,533) (60,640) 24.9% 30.9% (277,767) (237,397) 17.0%
Finance income 22,743 15,440 18,922 47.3% 20.2% 61,061 102,565 -40.5%
Finance costs (102,110) (78,973) (79,556) 29.3% 28.3% (338,824) (339,934) -0.3%
Foreign exchange gain (loss), net 1 - (6) (4) (28)
OPERATING PROFIT BEFORE INCOME TAX AND SOCIAL
CONTRIBUTION172,282 195,984 158,475 -12.1% 8.7% 669,256 599,503 11.6%
INCOME TAX AND SOCIAL CONTRIBUTION (34,664) (66,918) (51,738) -48.2% -33.0% (202,916) (195,937) 3.6%
Current (60,911) (67,878) (57,228) -10.3% 6.4% (230,600) (209,582) 10.0%
Deferred 26,247 960 5,490 2634.1% 378.1% 27,684 13,645 102.9%
NET INCOME FOR THE PERIOD 137,618 129,066 106,737 6.6% 28.9% 466,340 403,566 15.6%
CONSOLIDATED INCOME STATEMENT
(In thousands of Brazilian reais)

4Q13/ 2013 Earnings Release
February 26, 2014 Page 4 of 29
Gross Revenue Breakdown 4Q13
Toll Revenue Breakdown 4Q13
Economic and Financial Performance
Gross Service Revenue
Arteris recorded gross revenue of R$1.0 billion in 4T13, 14.4% up on 4Q12. Toll revenue
increased by 8.3%, led by the state concessions, and construction revenue climbed by
30%, fueled by the execution of the federal highway investment plan.
Annual gross revenue grew by 8.2% over 2012 to R$3.6 billion.
Toll Plaza Revenue
Toll revenue increased by 8.3%, from R$557.5 million, in 4Q12, to R$603.8 million in
4Q13, chiefly fueled by the 10.9% growth in the state concessions, which contributed
R$357.0 million, equivalent to 59% of the total. Although tariffs were frozen on these
highways in July 2013, this effect was offset by the beginning of charges for the air lift axles
of heavy vehicles , which were included in total tolled traffic. In the federal concessions, toll
revenue increased by 4.8%, closing 4Q13 at R$246.8 million, due to higher tariffs and
increased traffic volume.
In 2013, toll revenue came to R$2.3 billion, 9.1% more than in 2012. The state
concessionaires recorded an 11.3% upturn to R$1.3 billion and the federal
concessionaires posted a 6.2% increase to R$960.9 million.
Tolled Traffic: The Company’s consolidated tolled traffic volume came to 184,980
thousand vehicle equivalents in 4Q13, 2.1% up on 4Q12.
In the full year, tolled traffic came to 717,096 thousand vehicle equivalents, 2.9% more
than in 2012.
59%
41% State
Federal
60%
38%
2%
Toll Plaza
Construction
Other
Vehicle-Equivalents (Thousand) 4Q13 3Q13 4Q12Var%
4Q13/3Q13
Var%
4Q13/4Q122013 2012
Var%
2013/2012
State Concessions 55,109 55,916 49,785 -1.4% 10.7% 206,864 189,694 9.1%
Autovias 12,484 12,787 11,473 -2.4% 8.8% 47,422 44,102 7.5%
Centrovias 15,232 15,044 13,507 1.2% 12.8% 56,233 50,696 10.9%
Intervias 17,312 17,861 15,785 -3.1% 9.7% 65,479 60,471 8.3%
Vianorte 10,080 10,224 9,020 -1.4% 11.8% 37,729 34,425 9.6%
Federal Concessions 129,871 126,650 131,348 2.5% -1.1% 510,233 506,993 0.6%
Planalto Sul 7,411 7,244 7,107 2.3% 4.3% 28,704 27,945 2.7%
Fluminense 12,496 12,305 12,416 1.6% 0.6% 48,422 48,913 -1.0%
Fernão Dias 42,627 42,285 41,647 0.8% 2.4% 165,213 160,707 2.8%
Régis Bittencourt 38,870 38,214 37,550 1.7% 3.5% 150,105 146,097 2.7%
Litoral Sul 28,468 26,602 32,628 7.0% -12.8% 117,787 123,331 -4.5%
Total 184,980 182,567 181,133 1.3% 2.1% 717,096 696,687 2.9%

4Q13/ 2013 Earnings Release
February 26, 2014 Page 5 of 29
Traffic Breakdown
(Vehicle Equivalent)
4Q13
The state highways recorded a substantial 10.7% increase in total vehicle equivalents
over 4Q12, thanks to the combination of a favorable tolled traffic organic growth scenario
throughout 2013, due to the positive impact of agricultural production in São Paulo state,
and the addition of new vehicle equivalents from the charging of heavy vehicle air lift axles
since July. As mentioned in the previous quarter, the air lift axle charge was authorized by
the granting authority in order to offset the freeze on the annual inflationary pass-through to
tariffs
Tolled traffic on the federal concessions dipped by 1.1% over 4Q12, pressured by
Autopista Litoral Sul (-12.8%), where toll collection at the plaza in the municipality of Palhoça
(SC) was suspended by the ANTT in June 2013 until its transfer to a new location. The new
plaza is expected to begin operations in mid-June 2014 and any imbalances due to loss of
traffic will be rebalanced in the contract. Excluding this effect, Autopista Litoral Sul’s tolled
traffic would have increased by 7.0% over 4Q12, giving period growth of 3.6% for all the
Company’s federal highways and 5.6% for Arteris as a whole. In the full year, the federal
highway would have grown 3.4% and Arteris 5.0%.
Also in regard to the federal highways, it is worth noting the increase of only 0.6% posted by
Autopista Fluminense. This was due to a combination of factors, including the ongoing
duplication works on the highway, which meant that some users preferred to avoid tolled
stretches, and the slowdown in the transportation of building materials for certain
construction projects, including Açu Port and COMPERJ, in the north of the state, and the
Maracanã Stadium, in metropolitan Rio de Janeiro, which has been already concluded,.
Finally, the comparison between the periods was impacted by the exceptionally strong
comparative base, given that Autopista Fluminense is one of the concessions that has
recorded the biggest increase in vehicle equivalent volume in recent years.
In terms of composition, 62.9% of 4Q13 tolled traffic in the state concessions (measured
in vehicle equivalents) consisted of heavy vehicles and 37.1% of light vehicles, with
respective ratios of 73.3% and 26.7% in the federal concessions.
73.3% 62.9%
26.7% 37.1%
Federal State
Heavy Light

4Q13/ 2013 Earnings Release
February 26, 2014 Page 6 of 29
Average Toll Tariff: In 4Q13, the average consolidated toll tariff of Arteris’ concessionaires
was R$3.26, 6.1% up on 4Q12.
In the annual comparison, the average tariff increased by 6.0%, from R$3.03, in 2012, to
R$3.21.
The following table shows average toll tariff trends in each of the concessionaires and on a
consolidated basis:
As can be seen, there was virtually no change in state concessionaire tariffs in
comparison with 4Q12 and 3Q13. Exceptionally, the annual inflationary adjustment that
always takes place in July, and which would have come to 6.2% in 2013, was not authorized
by the São Paulo state government. On the other hand, it did authorize the charging of a fee
per air lift axle for heavy vehicles on state highways and reduced the variable concession
fee paid to the granting authority from 3.0% of gross toll revenue to 1.5%. These measures
were designed to compensate the impact of the tariff freeze.
The average federal concession toll tariff increased by 6.0% over 4Q12, reflecting the
adjustments in February 2013 (Fluminense and Litoral Sul) and December 2013 (Autopista
Fernão Dias and Planalto Sul), when the cumulative variation in the IPCA inflation index and
any economic-financial rebalancing of the contracts were passed through.
Electronic Collection: Revenue from toll plaza electronic payments (AVI System) in the state
concessionaires accounted for 65.0% of total toll revenue in 4Q13, versus 62.1% in 4Q12,
while the average ratio in the federal concessionaires was 50.6% compared to 47.0% in
4Q12. The following charts show the quarterly figures for revenue collected electronically
since the fourth quarter of 2010:
Average Toll Tariff (R$ / Vehicle-Equivalents) 4Q13 3Q13 4Q12Var%
4Q13/3Q13
Var%
4Q13/4Q122013 2012
Var%
2013/2012
State Concessions 6.48 6.47 6.47 0.2% 0.1% 6.48 6.34 2.1%
Autovias 6.79 6.75 6.79 0.6% 0.1% 6.79 6.67 1.7%
Centrovias 6.17 6.15 6.17 0.3% -0.1% 6.17 6.05 2.0%
Intervias 5.61 5.62 5.60 -0.2% 0.2% 5.62 5.49 2.3%
Vianorte 8.04 8.05 8.02 -0.1% 0.3% 8.03 7.85 2.3%
Federal Concessions 1.90 1.89 1.79 0.3% 6.0% 1.88 1.78 5.5%
Planalto Sul 3.63 3.60 3.34 0.7% 8.6% 3.61 3.31 9.0%
Fluminense 3.30 3.30 3.10 0.0% 6.5% 3.28 3.07 6.9%
Fernão Dias 1.41 1.40 1.40 0.9% 0.9% 1.40 1.40 0.2%
Régis Bittencourt 1.80 1.80 1.80 0.0% 0.0% 1.80 1.80 0.0%
Litoral Sul 1.70 1.70 1.45 0.0% 17.4% 1.67 1.41 18.1%
Total 3.26 3.30 3.08 -0.9% 6.1% 3.21 3.03 6.0%
57.3% 58.0%
60.0% 61.7%
61.2% 60.8% 62.4% 62.9%
62.1% 61.4%
63.5% 63.6% 65.0%
4Q10 1Q11 2Q11 3Q11 4Q11 1Q12 2Q12 3Q12 4Q12 1Q13 2Q13 3Q13 4Q13
AVI State Concessions

4Q13/ 2013 Earnings Release
February 26, 2014 Page 7 of 29
Construction Revenue
The Company intensified its construction works, reaching R$383.0 million in 4Q13 with 30%
growth comparing to the same period on last year. The federal highways accounted for
92.0% of the total.
Annual construction revenue came to R$1.3 billion, 12.7% up on 2012.
Other Revenue
In 4Q13, “other revenue” totaled R$14.3 million, comprising R$8.3 million from the
leasing of highway right of way areas by the concessionaires and R$6.0 million from
highway conservation and paving by the group’s construction companies. The 37.1%
negative variation over 4Q12 was due to the reclassification of revenue from micro-surfacing
works, which used to be recorded as “other revenue”, but has been recognized as
“construction revenue” since 2Q13.
This effect also explains the 58.4% annual decline in “other revenue” over 2012.
38.1% 39.8%
42.5% 44.2% 44.3% 44.8%
46.9% 47.0% 47.0% 46.5% 49.4% 48.8%
50.6%
4Q10 1Q11 2Q11 3Q11 4Q11 1Q12 2Q12 3Q12 4Q12 1Q13 2Q13 3Q13 4Q13
AVI Federal Concessions

4Q13/ 2013 Earnings Release
February 26, 2014 Page 8 of 29
Net Service Revenue and Deductions from Revenue
Fourth-quarter net revenue totaled R$940.7 million, 14.8% more than in 4Q12, fueled by
the 8.3% increase in toll revenue and the 30% upturn in construction revenue. Annual net
revenue came to R$3.4 billion 2013, 8.3% higher than in 2012.
Revenue deductions, composed of PIS (0.65%), COFINS (3.0%) and ISS (5.0%) taxes,
totaled R$60.5 million in 4Q13, 9.5% up year-on-year, mainly accompanying the period
increase in gross toll revenue. In the full year, deductions came to R$224.7 million.
Costs and Expenses
Costs and expenses amounted to R$689.0 million in 4Q13, 14.7% up on 4Q12. However,
cash costs increased by only 4.5% to R$183.5 million and fell by 0.6 p.p. In percentage-
of-net-revenue terms (ex-construction).
Annual costs and expenses moved up in line with period inflation, closing the year at R$2.4
billion (+6.5%). It is important to note that cash costs, which totaled R$689.8 million, only
edged up by 0.4% in absolute terms and recorded a 1.8 p.p. improvement In percentage-
of-net-revenue terms.
One of the Company’s main strategic objectives is the implementation of an efficiency
program in all its operations, based on the best practices already employed by Abertis, in
order to pursue synergies, scale gains and a reduction in costs. As already announced to
the market, once the efficiency plan has been fully implemented the Company expects to
reduce cash costs by around R$60 million per year, thereby improving the Group’s
operating margins. Among the measures implemented, it is particularly worth mentioning the
redefinition of organizational policies, the creation of a corporate purchasing area centralized
in the holding company in order to reduce operational costs and investments (through
increased purchasing and bargaining power and the use of electronic bids for purchases)
the implantation of a SAP program linking all the companies, the development of new toll
collection technologies and a performance-based compensation system.
Costs and Services Expenses (R$ Thousand) 4Q13 3Q13 4Q12Var%
4Q13/3Q13
Var%
4Q13/4Q122013 2012
Var%
2013/2012
Third Party Services (57,438) (46,653) (48,915) 23.1% 17.4% (197,894) (186,627) 6.0%
Personnel (55,907) (52,328) (46,588) 6.8% 20.0% (211,656) (186,466) 13.5%
Conservation (28,709) (23,790) (27,381) 20.7% 4.9% (100,807) (102,321) -1.5%
Inspection fee (9,224) (9,184) (8,708) 0.4% 5.9% (36,689) (34,673) 5.8%
Costs w ith granting authority (7,521) (5,745) (10,019) 30.9% -24.9% (32,554) (37,446) -13.1%
Insurance and guarantees (5,582) (5,423) (4,430) 2.9% 26.0% (21,306) (20,765) 2.6%
Directors' compensation (6,134) (5,826) (4,644) 5.3% 32.1% (21,331) (15,471) 37.9%
Civil, labor and tax risks (484) (1,193) (2,240) -59.4% -78.4% (3,960) (4,902) -19.2%
Tax expenses (760) (877) (855) -13.3% -11.1% (3,146) (3,700) -15.0%
Other operating expenses, net (11,720) (19,825) (21,873) -40.9% -46.4% (60,462) (94,914) -36.3%
Total (Cash Costs) (183,479) (170,844) (175,653) 7.4% 4.5% (689,805) (687,285) 0.4%
% Cash Costs / Net Revenue (excl. construction) 32.9% 30.9% 33.5% 2.1 p.p. -0.6 p.p. 32.6% 34.3% -1.8 p.p.
Cost of construction services (382,984) (351,262) (294,554) 9.0% 30.0% (1,258,870) (1,117,137) 12.7%
Provision for maintenance in highw ays (45,568) (46,700) (68,137) -2.4% -33.1% (196,030) (235,956) -16.9%
Depreciation and amortization (77,011) (74,969) (62,172) 2.7% 23.9% (285,745) (241,519) 18.3%
Total (689,042) (643,775) (600,516) 7.0% 14.7% (2,430,450) (2,281,897) 6.5%

4Q13/ 2013 Earnings Release
February 26, 2014 Page 9 of 29
The main variations in cash costs between the periods were.
Third-party services: Increased by 17.4% over 4Q12 to R$57.4 million, mainly
due to:
- annual contractual adjustments, most of which tied to the IPCA consumer price
index;
- costs (some of which non-recurring) related to the best practice projects being
implemented as part of the Company’s efficiency program, especially the
installation of SAP in all of the Group’s companies.
Personnel: Increased by 20.0% over 4Q12 to R$55.9 million, due to:
- the collective bargaining agreements in March 2013 (an average pay rise of 6.8%
for all employees);
- insourcing of the previously outsourced Autopista Fluminense toll plaza collection
team at the end of 2012 and beginning of 2013.
- wage adjustments throughout the year, especially in 4Q13;
- the restructuring of certain holding company teams and areas and the creation of
a purchasing area as part of the ongoing efficiency plan.
Conservation: These costs vary in accordance with the specific need for highway
repairs. In 4Q13, they increased by 4.9% year-on-year to R$28.7 million. In the
annual comparison, however, the volume of repaving and in infrastructure works
fell by 1.5% to R$100.8 million.
Inspection: Increased by 5.9% to R$9.2 million in the quarterly comparison and by
the same percentage in the annual comparison. These amounts are paid by the
federal highway concessionaires to the granting authority (ANTT) and are adjusted
annually in line with the IPCA consumer price index.
Costs with the concession authority: The decline in the amount of the variable
concession fee paid by the state concessionaires to the granting authority was due
to a measure adopted by the São Paulo state government to offset the non-pass-
through of inflation to tariffs in July 2013. The fee was reduced from 3% of toll
revenue to 1.5%, a percentage that will remain in place for an indeterminate period.
Insurance and guarantees: Due to the increase in the volume of the Company’s
construction works, which are insured, and the reassessment of operational risk
insurance based on accident claim levels, this line increased by 26%, or R$1.1
million, over 4Q12 to R$5.6 million.
Management compensation: Totaled R$6.1 million in 4Q13, R$1.5 million up on
4Q12, chiefly due to the payment of severance pay as a result of the restructuring
of the executive boards of the holding company and the concessionaires as part of
the efficiency program, as well as changes to Arteris’ management. In addition, as
with the Group’s other employees, the executive officers received the amounts
related to the collective bargaining agreement in March.
Civil, labor and tax risks: the amounts recognized refer to expectations of a
probable loss in lawsuits involving the Company and its subsidiaries. In 4Q13, this
line totaled R$0.5 million, versus R$2.2 million in 4Q12. In the full year, it came to
R$4.0 million, 19.2% down on 2012.

4Q13/ 2013 Earnings Release
February 26, 2014 Page 10 of 29
The main changes in non-cash costs were:
Construction costs: As mentioned previously, the 30% increase in construction
costs over 4Q12 was due to heavy investments in the federal highways, which
were reinforced in 4Q13, chiefly due to the new construction schedule defined by
the TAC entered into with the ANTT in September 2013. In the full year,
construction costs increased by 12.7% over 2012 to R$1.3 billion.
Provisions for maintenance: In 3Q13, the Company adjusted its provisions for
maintenance after revising its future highway repaving investment estimates.
Including what had already been provisioned, this item came to R$45.6 million in
4Q13 (-33.1%) and R$196 million in 2013 (-16.9%).
Depreciation and amortization: Depreciation and amortization refer to the
adoption of IFRS rules, which require the complete amortization of intangible
assets by the end of the concession period, weighted by the projected traffic curve
for each highway. As a result, the increase in intangible assets as a function of the
Company’s investments and the constant growth in traffic pushed up this line to
R$70.9 million in 4Q13 (+14%) and R$285.7 million in the full year (+18.3%).

4Q13/ 2013 Earnings Release
February 26, 2014 Page 11 of 29
EBITDA and Adjusted EBITDA
Arteris recorded a 4Q13 operating result, as measured by EBITDA, of R$328.6 million,
16.8% up on the same period the year before, thanks to the increase in toll revenue, the
reduction in cash costs as a percentage of net revenue and (this quarter) the reduction in
provisions for highway maintenance. The EBITDA margin* came to 58.9%, 5.4 p.p. up
year-on-year.
Annual EBITDA totaled R$1.2 billion, 14.3% more than in 2012, with a margin* of 58.2%
(+4.3 p.p.).
EBITDA adjusted for provisions for highway maintenance, which have no cash effect, grew
by 7.1% to R$374.2 million in 4Q13, with an adjusted EBITDA margin* of 67.1%, a 0.6
p.p. improvement. Annual adjusted EBITDA came to R$1.4 billion, 8.7% more than in
2012, with an adjusted margin of 67.4% (+1.8 p.p.).
* The EBITDA Margin is based on Net Operating Revenue, excluding Construction Revenue.
¹ EBITDA is Earnings before Interest, Taxes, Depreciation and Amortization. EBITDA is not a measure adopted in accounting standards
and does not represent cash flow for the periods presented and therefore should not be considered an alternative to cash flow as an
indicator of liquidity. EBITDA does not have a standardized meaning and therefore cannot be compared to the EBITDA of other
companies.
² Includes adjustments related to reversals of the provision for highway maintenance (accounting pronouncement ICPC 01).
* The EBITDA Margin is based on Net Operating Revenue, excluding Construction Revenue.
It is important to note that Arteris’ consolidated EBITDA is composed not only of the
results of its state and federal concessionaires, but also includes the structures of its holding
company and construction companies.
In order to provide a better analysis of the Company’s operating result, the following table
gives a breakdown of Adjusted EBITDA.
* The recognition in 4Q13 of expenses related to the implementation of the Arteris efficiency program’s best practice
initiatives contributed to the variation in the holding company’s EBITDA. These initiatives included, among others, the
creation of a purchasing area, the implementation of SAP, provisions for severance pay for changes in the
management and the restructuring of positions and salaries.
4Q13 3Q13 4Q12 Var%
4Q13/3Q13
Var%
4Q13/4Q12 2013 2012
Var%
2013/2012
NET REVENUE 940,690 903,291 819,631 4.1% 14.8% 3,377,473 3,118,797 8.3%
Cost and expenses (excl. depreciation and amortization) (612,031) (568,806) (538,344) 7.6% 13.7% (2,144,705) (2,040,378) 5.1%
EBITDA ¹ 328,659 334,485 281,287 -1.7% 16.8% 1,232,768 1,078,419 14.3%
EBITDA Margin* 58.9% 60.6% 53.6% -1.7 p.p. 5.4 p.p. 58.2% 53.9% 4.3 p.p.
(+) Provision for maintenance in highw ays 45,568 46,700 68,137 -2.4% -33.1% 196,030 235,956 -16.9%
Adjusted EBITDA ² 374,227 381,185 349,424 -1.8% 7.1% 1,428,798 1,314,375 8.7%
Adjusted EBITDA Margin* 67.1% 69.1% 66.5% -2.0 p.p. 0.6 p.p. 67.4% 65.7% 1.8 p.p.
EBITDA
(In thousands of Brazilian reais)
Adjusted EBITDA - Consolidated 374,227 381,186 349,424 -1.8% 7.1%
State Concessions 268,552 277,938 232,784 -3.4% 15.4%
Federal Concessions 107,851 109,682 102,611 -1.7% 5.1%
Holding* (11,165) (3,542) (2,353) 215.2% 374.5%
Construction Companies 8,988 (2,892) 16,382 -410.8% -45.1%
Adjusted EBITDA (R$ Thousand) 4Q13 3Q13 4Q12Var%
4Q13/3Q13
Var%
4Q13/4Q12

4Q13/ 2013 Earnings Release
February 26, 2014 Page 12 of 29
The following table shows the calculation of EBITDA and Adjusted EBITDA for the Arteris
companies in 4Q13:
And for 2013:
1 Excludes Depreciation and Amortization
* The EBITDA Margin is based on Net Operating Revenue, excluding Construction Revenue.
Group Companies
(R$ Thousand)
Services
Revenue
(A)
Construct
Revenue
(B)
Total (A + B)Cost of
Services (A)
Cost of
Construction
Service (B)
Total (A + B)
Autovias 295,810 38,771 334,581 (95,078) (38,771) (133,849) 200,732 37,961 238,693 80.7%
Centrovias 319,349 4,492 323,841 (88,937) (4,492) (93,429) 230,412 32,221 262,633 82.2%
Intervias 339,944 16,213 356,157 (102,637) (16,213) (118,850) 237,307 33,087 270,394 79.5%
Vianorte 278,336 14,831 293,167 (85,056) (14,831) (99,887) 193,280 33,813 227,093 81.6%
State Concessions 1,233,439 74,307 1,307,746 (371,708) (74,307) (446,015) 861,731 137,082 998,813 81.0%
Planalto Sul 94,567 123,514 218,081 (63,716) (123,514) (187,230) 30,851 7,472 38,323 40.5%
Fluminense 146,796 268,044 414,840 (79,984) (268,044) (348,028) 66,812 9,878 76,690 52.2%
Fernão Dias 213,649 266,821 480,470 (135,902) (266,821) (402,723) 77,747 16,730 94,477 44.2%
Régis Bittencourt 247,911 251,685 499,596 (117,449) (251,685) (369,134) 130,462 13,432 143,894 58.0%
Litoral Sul 183,606 274,499 458,105 (111,628) (274,499) (386,127) 71,978 11,437 83,415 45.4%
Federal Concessions 886,529 1,184,563 2,071,092 (508,679) (1,184,563) (1,693,242) 377,850 58,948 436,798 49.3%
Total Concessionaires 2,119,968 1,258,870 3,378,838 (880,387) (1,258,870) (2,139,257) 1,239,581 196,030 1,435,611 67.7%
Arteris Holding - - - (23,285) - (23,285) (23,285) - (23,285)
Constructors - 518,274 518,274 - (501,802) (501,802) 16,472 - 16,472
Other companies and eliminations for consolidation - (519,639) (519,639) - 519,639 519,639 - - -
Total 2,119,968 1,257,505 3,377,473 (903,672) (1,241,033) (2,144,705) 1,232,768 196,030 1,428,798 67.4%
Adjusted
EBITDA
M argin*
Net Revenue Costs and Services ¹
EBITDA
Provision for
highways's
maintenance
Ajusted
EBITDA
Group Companies
(R$ Thousand)
Services
Revenue
(A)
Construct
Revenue
(B)
Total (A + B)Cost of
Services (A)
Cost of
Construction
Service (B)
Total (A + B)
Autovias 77,966 16,742 94,708 (21,367) (16,742) (38,109) 56,599 7,060 63,659 81.6%
Centrovias 86,468 1,616 88,084 (22,577) (1,616) (24,193) 63,891 7,901 71,792 83.0%
Intervias 89,747 6,058 95,805 (28,785) (6,058) (34,843) 60,962 10,521 71,483 79.6%
Vianorte 74,437 6,154 80,591 (22,589) (6,154) (28,743) 51,848 9,770 61,618 82.8%
State Concessions 328,618 30,570 359,188 (95,318) (30,570) (125,888) 233,300 35,252 268,552 81.7%
Planalto Sul 24,639 32,276 56,915 (17,904) (32,276) (50,180) 6,735 1,193 7,928 32.2%
Fluminense 38,191 85,259 123,450 (20,761) (85,259) (106,020) 17,430 1,417 18,847 49.3%
Fernão Dias 56,126 69,852 125,978 (34,426) (69,852) (104,278) 21,700 2,947 24,647 43.9%
Régis Bittencourt 63,966 70,734 134,700 (29,673) (70,734) (100,407) 34,293 2,320 36,613 57.2%
Litoral Sul 47,182 94,293 141,475 (29,804) (94,293) (124,097) 17,378 2,439 19,817 42.0%
Federal Concessions 230,104 352,414 582,518 (132,568) (352,414) (484,982) 97,536 10,316 107,852 46.9%
Total Concessionaires 558,722 382,984 941,706 (227,886) (382,984) (610,870) 330,836 45,568 376,404 67.4%
Arteris Holding - - (11,165) - (11,165) (11,165) - (11,165)
Constructors - 149,940 149,940 - (140,952) (140,952) 8,988 - 8,988
Other companies and eliminations for consolidation - (150,956) (150,956) - 150,956 150,956 - - -
Total 558,722 381,968 940,690 (239,051) (372,980) (612,031) 328,659 45,568 374,227 67.1%
Net Revenue Costs and Services ¹
EBITDA
Provision for
highways's
maintenance
Ajusted
EBITDA
Adjusted
EBITDA
M argin*

4Q13/ 2013 Earnings Release
February 26, 2014 Page 13 of 29
Financial Result
The 4Q13 financial result was a net financial expense of R$79.4 million, 24.9% higher
than the net expense of R$63.5 million posted in 3Q13.
This was basically due to the following factors:
As a result of the investment of a larger volume of proceeds from the Company’s
and its subsidiaries’ debt issues in 3Q13 and 4Q13 (see details in the Indebtedness
section) and the gradual period increase in the CDI interbank rate, 4Q13 financial
investments increased by 58% over 3Q13, in turn pushing up financial income
from R$15.4 million, in the previous quarter, to R$22.7 million.
The increase in financial charges (+R$16.6 million, or 26.1%), reversals of
present value adjustments (+R$3.4 million or 105.7%) and other financial
expenses (+R$2.6 million, or 60.7%), which contributed to the 29.3% growth in
financial expenses in the quarterly comparison.
The increase in financial charges was related to additional debt servicing from the
new debenture issues by Intervias and Autovias, Arteris and the federal
concessionaires. The upturn in present value adjustments was due to the impact of
the rescheduling of works in some of the federal concessions. Finally, the growth in
other expenses refers to the costs associated with the pre-settlement of Intervias’
first and second debenture issues.
The annual financial result was a net financial expense of R$277.8 million. Although
there was no period variation in financial expenses, financial income fell by 40.5% due to
reduced income from financial investments in 1H13, when interest rates were lower and the
Company had less funds available for investing.
Financial Result (R$ Thousand) 4Q13 3Q13 4Q12Var%
4Q13/3Q13
Var%
4Q13/4Q122013 2012
Var%
2013/2012
Financial Income 22,743 15,440 18,922 47.3% 20.2% 61,061 102,566 -40.5%
Interest Receivable 322 244 260 32.0% 23.8% 983 1,032 -4.7%
Financial Investments 22,200 14,050 15,465 58.0% 43.5% 58,468 89,427 -34.6%
Financial Charges - Reversal of Present Value Adjustments 71 - 2,834 - -97.5% 71 11,267 -99.4%
Other Revenues 150 1,146 363 -86.9% -58.7% 1,539 840 83.2%
Financial Expenses (102,110) (78,973) (79,556) 29.3% 28.3% (338,824) (339,935) -0.3%
Financial Charges (80,009) (63,451) (62,620) 26.1% 27.8% (263,120) (263,613) -0.2%
Monetary Adjustment of Concession Charges (8,573) (8,014) (5,270) 7.0% 62.7% (28,505) (37,299) -23.6%
Financial Charges - Reversal of Present Value Adjustments (6,688) (3,252) (8,369) 105.7% -20.1% (22,713) (26,719) -15.0%
Other Expenses (6,840) (4,256) (3,297) 60.7% 107.5% (24,486) (12,304) 99.0%
Net Exchange Variation 1 - (6) - -116.7% (4) (28) -85.7%
Financial Result (79,366) (63,533) (60,640) 24.9% 30.9% (277,767) (237,397) 17.0%
7.2% 8.5% 9.4%
4Q12 3Q13 4Q13
DI Index (quarterly index)
0.67%
1.91% 1.75%
4Q12 3Q13 4Q13
IGP - M (quarterly)
1.98%
0.62%
2.03%
4Q12 3Q13 4Q13
IPCA (quarterly)

4Q13/ 2013 Earnings Release
February 26, 2014 Page 14 of 29
Net Income
Arteris posted net income of R$137.6 million in 4Q13, 28.9% up on 4Q12, given that the
14.8% increase in net revenue (including the 8.3% upturn in toll revenue) exceeded the
14.7% growth in costs and expenses, despite the higher volume of depreciation and
amortization and the worsening of the financial result. The 33.1% decline in provisions for
highway maintenance restricted the increase in total costs, positively impacting income.
For the same reasons, annual net income grew by 15.6% over 2012 to R$466.3 million.
Indebtedness
On December 31, 2013, net debt totaled R$3.1 billion, 9.5%, or R$266.7 million, more than
in 3Q13.
This quarter-on-quarter increase was a result of:
The higher volume of funds in 3Q13, which totaled R$1.2 billion (the quarter’s
cash position plus the credits from the Intervias debenture issue), versus R$1.0
billion in 4Q13. Part of the proceeds from the Intervias issue was used by the
concessionaire in the fourth quarter to prepay previous debentures.
The R$64.7 million, or 1.6%, increase in gross debt, reflecting:
o The disbursement of long-term loans by the BNDES totaling R$222.3
million;
o The issue of debentures by Arteris and the federal concessionaires, in the
amount of R$335.6 million;
o The issue of debentures by Autovias, totaling R$300.0 million;
o The payment of R$349.0 million related to the commercial paper issue in
4Q13;
o The settlement of installments and prepayment of the Company’s older
debentures related to state concessions, totaling R$446.9 million;
o The amortization of R$25.9 million in BNDES financing;
o R$28.6 million in accrued interest on the Company’s loans.
Debt
(In thousands of Brazilian reais)4Q13 3Q13 4Q12
Var%
4Q13/3Q13
Var%
4Q13/4Q12
Gross Debt 4,124,728 4,059,992 3,234,652 1.6% 27.5%
Short Term 288,482 962,867 472,786 -70.0% -39.0%
Long Term 3,836,246 3,097,125 2,761,866 23.9% 38.9%
Cash Position 1,040,898 642,857 814,312 61.9% 27.8%
Cash and equivalents 929,911 521,391 681,437 78.4% 36.5%
Restricted investments ¹ 110,987 121,466 132,875 -8.6% -16.5%
Other Credits (Intervias Debentures) - 600,000 - - -
Net Debt 3,083,830 2,817,135 2,420,340 9.5% 27.4%
¹ Short and long term

4Q13/ 2013 Earnings Release
February 26, 2014 Page 15 of 29
Issue of Commercial Papers and Debentures
Arteris and Federal Concessionaires
The Commercial Papers issued by Arteris (R$200 million) and the federal
concessionaires (R$149 million) were settled in October 2013. The settlement
funds came from the issue of R$ 200 million in simple debentures by Arteris, and
the issue of R$135.6 million in subsidiary debentures by the federal
concessionaires;
State Concessionaires
The third issue of debentures by Concessionária de Rodovias do Interior Paulista
S.A. (Intervias), a Company subsidiary, totaling R$600 million, was recognized in
the Company’s cash at the beginning of October 2013;
The proceeds from Intervias’ third debenture issue of were partially used to
prepay the first and second debenture issues in the amount of R$108.7 million
and R$158.8 million, respectively.
On November 21, 2013, Autovias S.A., a Company subsidiary, approved the third
issue of R$300 million of simple unsecured debentures, not convertible to shares,
in a single series, on a firm commitment basis, which were the object of public
distribution with restricted placement efforts, pursuant to Law 6385 of December 7,
1976, as amended, and CVM Instruction 476 of January 16, 2009, as amended.
The debentures will mature on August 20, 2017, with amortization in six
semiannual installments, due in February and August of each year. The
remuneration of the debentures corresponds to the CDI interbank rate plus 0.83%
p.a.. The issue took place on December 20, 2013.
The proceeds from Autovias’ third debenture issue were used to partially prepay
the first issue of first series debentures (R$83.8 million) and fully settle the
second issue (R$47.1 million).

4Q13/ 2013 Earnings Release
February 26, 2014 Page 16 of 29
BNDES Financing: Arteris receives long-term loans from the BNDES to finance federal
concession investment programs. All five federal concessionaires have already received
approval for long-term financing lines, guaranteeing the funds needed to implement the
main contractual construction projects before the end of the concession.
Up to December 31, 2013, approximately R$2.4 billion in BNDES funding had been
disbursed, leaving R$1.3 billion still available.
More details on the Company’s debt profile are shown below:
At the close of 4Q13, net debt represented 2.3 times Adjusted EBITDA less payment of the
fixed concession fee in the last 12 months, in the same level to the 2.1 times recorded in
3Q13.
Leverage Ratio and Net Debt (R$ million)
ConcessionariesTotal
Contracted
Total
TakenAvailable
Total 3,694,549 2,405,768 1,288,781
Planalto Sul 331,344 251,855 79,489
Fluminense 780,819 437,157 343,662
Fernão Dias 702,754 602,369 100,385
Régis Bittencourt 1,069,495 674,705 394,790
Litoral Sul 810,137 439,682 370,455
BNDES (R$ Thousand)
1,523 1,453 1,575 1,6111,797 1,883
2,139 2,2372,420 2,488
2,706 2,8173,084
1.61.5 1.5 1.5
1.6 1.61.8 1.9 1.9 2.0 2.1 2.1 2.3
(2,500)
(1,500)
(,500)
,500
1,500
2,500
-
500,0
1000,0
1500,0
2000,0
2500,0
3000,0
3500,0
4Q10 1Q11 2Q11 3Q11 4Q11 1Q12 2Q12 3Q12 4Q12 1Q13 2Q13 3Q13 4Q13
Net Debt Net Debt / Ajusted EBITDA - Fixed Concession Charge (last 12 months)

4Q13/ 2013 Earnings Release
February 26, 2014 Page 17 of 29
At the end of 4Q13, consolidated gross debt (loans and financing plus debentures) totaled
R$4.1 billion, 55.5% of which corresponding to contracts indexed to the TJLP (long-term
interest rate), 33.7% indexed to the CDI interbank rate and 10.8% indexed to the IPCA
inflation rate.
Gross Debt Profile (%)
Gross Debt (R$ million)
55,5% 33,7%
10,8%
TJLP
CDI
IPCA 55,5%
44,4%
0,1%
BNDES
Debentures
Others
Gross Debt (In thousands of
Brazilian reais)4Q13 3Q13 4Q12
Var%
4Q13/3Q13
Var%
4Q13/4Q12
Indexes
TJLP 2,288,152 2,119,353 1,977,673 8.0% 15.7%
CDI 1,390,927 1,511,137 833,280 -8.0% 66.9%
IPCA 447,986 431,959 422,952 3.7% 5.9%
Other 3,827 3,965 5,801 -3.5% -34.0%
Prepaid charges (6,164) (6,422) (5,054) -4.0% 22.0%
Total 4,124,728 4,059,992 3,234,652 1.6% 27.5%
288
810
569 597
395
206 221 237 255 274204
5613
2014 2015 2016 2017 2018 2019 2020 2021 2022 2023 2024 2025 2026
Debt Amotization Schedule (R$ million)
1.234873 908
552 426 414 432 453 473 457 466
963
288
1.554
1.882 1.862 2.411 2.672 2.690 2.713 2.747 2.762 2.721 2.674
3.097
3.836
2.789 2.754 2.7702.963
3.098 3.104 3.145 3.200 3.235 3.178 3.141
4.060 4.125
4Q10 1Q11 2Q11 3Q11 4Q11 1Q12 2Q12 3Q12 4Q12 1Q13 2Q13 3Q13 4Q13
Total
Long Term
Short Term

4Q13/ 2013 Earnings Release
February 26, 2014 Page 18 of 29
Fixed Concession Fee paid to the Concession Authority (State
Concessionaires)
In accordance with the concession contracts, the state concessionaires must pay the
concession authority a fixed fee in exchange for granting the concession. In 4Q13, the
amount paid was R$17.2 million.
On December 31, 2013, the real amount and number of monthly installments to be paid in
regard to the fixed concession fee were as follows:
Fixed Concession Charge Paid
(R$ Thousands)4Q13 3Q13 4Q12
Var%
4Q13/3Q13
Var%
4Q13/4Q122013 2012
Var%
2013/2012
Total (17,217) (17,216) (16,210) 0.0% 6.2% (66,852) (63,515) 5.3%
Autovias (1,812) (1,812) (1,707) 0.0% 6.2% (7,038) (6,688) 5.2%
Centrovias (2,712) (2,711) (2,553) 0.0% 6.2% (10,530) (10,005) 5.2%
Intervias (1,688) (1,688) (1,589) 0.0% 6.2% (6,554) (6,227) 5.3%
Vianorte (11,005) (11,005) (10,361) 0.0% 6.2% (42,730) (40,595) 5.3%
Short Term Long Term Total
Autovias 7,414 27,780 35,194 56
Centrovias 11,093 38,735 49,828 53
Intervias 6,903 35,864 42,767 73
Vianorte 45,006 145,646 190,652 50
Total 70,416 248,025 318,441
ConcessionairesReal Value (R$ Thousands) # of Monthly
Payments

4Q13/ 2013 Earnings Release
February 26, 2014 Page 19 of 29
Investments and Highway Maintenance
In September 2013, the Company signed a Term of Adjustment of Conduct (TAC) with the
National Ground Transportation Agency (ANTT) that redefined the schedule for the
remaining construction works on the federal highways. Since then, the Company has been
complying with the plan at a faster-than-expected rate, as registered in the first TAC balance
disclosed by the ANTT.
As a result, Arteris invested R$404.0 million in its highways in 4Q13, 16.4% more than in
the previous quarter, 94.7% of which in infrastructure works and improvements
(intangible and fixed assets), almost all of which in the federal concessionaires, and the
remainder in state highway maintenance.
Annual investments came to R$1.3 billion, 94.2% of which in infrastructure and
improvements (fixed and intangible assets). Investments through the end of all the
concession agreements are around R$6.8 billion, including maintenance.
The Company’s total investments in recent quarters are presented below:
(R$ Thousand)
266,368
310,685
347,042
403,979
Intangible
and Property
(A)
Maintenance
Realized (B)
Intangible and
Property (A)
Maintenance
Realized (B)
Autovias 25,341 18,665 6,676 58,204 37,325 20,879
Centrovias 6,358 1,045 5,313 25,709 3,449 22,260
Intervias 12,631 6,114 6,517 29,927 14,824 15,103
Vianorte 8,670 5,590 3,080 33,734 15,442 18,292
Estaduais 53,001 31,415 21,586 147,575 71,041 76,534
Planalto Sul 27,935 27,935 - 119,522 119,522 -
Fluminense 94,025 94,025 - 268,671 268,671 -
Fernão Dias 87,306 87,306 - 272,930 272,930 -
Régis Bittencourt 59,056 59,056 - 251,197 251,197 -
Litoral Sul 81,901 81,901 - 265,778 265,778 -
Federais 350,223 350,223 - 1,178,098 1,178,098 -
Total 403,224 381,638 21,586 1,325,673 1,249,139 76,534
Outros inv. e ajustes de consolidação 755 755 - 2,401 2,401 -
Total 403,979 382,393 21,586 1,328,074 1,251,540 76,534
2013
Before
IFRS (A + B)
IFRS
4Q13
Investments
Cash Flow (R$ Thousands)
Before
IFRS (A + B)
IFRS
20,708 16,783 17,457 21,586
245,660 293,902
329,585 382,393
1Q13 2Q13 3Q13 4Q13
Intangible and Fixed Assets
Maintenance
4Q13/ 2013 Earnings Release
February 26, 2014 Page 20 of 29
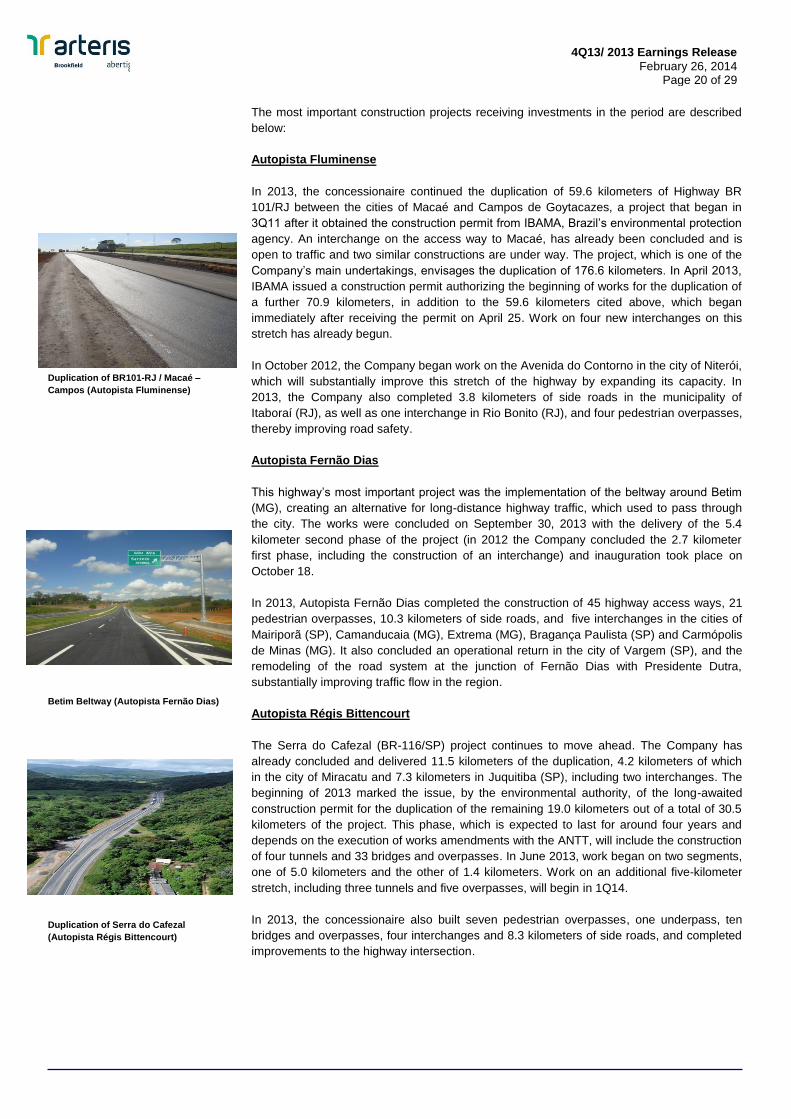
Duplication of BR101-RJ / Macaé –
Campos (Autopista Fluminense)
Betim Beltway (Autopista Fernão Dias)
Duplication of Serra do Cafezal
(Autopista Régis Bittencourt)
The most important construction projects receiving investments in the period are described
below:
Autopista Fluminense
In 2013, the concessionaire continued the duplication of 59.6 kilometers of Highway BR
101/RJ between the cities of Macaé and Campos de Goytacazes, a project that began in
3Q11 after it obtained the construction permit from IBAMA, Brazil’s environmental protection
agency. An interchange on the access way to Macaé, has already been concluded and is
open to traffic and two similar constructions are under way. The project, which is one of the
Company’s main undertakings, envisages the duplication of 176.6 kilometers. In April 2013,
IBAMA issued a construction permit authorizing the beginning of works for the duplication of
a further 70.9 kilometers, in addition to the 59.6 kilometers cited above, which began
immediately after receiving the permit on April 25. Work on four new interchanges on this
stretch has already begun.
In October 2012, the Company began work on the Avenida do Contorno in the city of Niterói,
which will substantially improve this stretch of the highway by expanding its capacity. In
2013, the Company also completed 3.8 kilometers of side roads in the municipality of
Itaboraí (RJ), as well as one interchange in Rio Bonito (RJ), and four pedestrian overpasses,
thereby improving road safety.
Autopista Fernão Dias
This highway’s most important project was the implementation of the beltway around Betim
(MG), creating an alternative for long-distance highway traffic, which used to pass through
the city. The works were concluded on September 30, 2013 with the delivery of the 5.4
kilometer second phase of the project (in 2012 the Company concluded the 2.7 kilometer
first phase, including the construction of an interchange) and inauguration took place on
October 18.
In 2013, Autopista Fernão Dias completed the construction of 45 highway access ways, 21
pedestrian overpasses, 10.3 kilometers of side roads, and five interchanges in the cities of
Mairiporã (SP), Camanducaia (MG), Extrema (MG), Bragança Paulista (SP) and Carmópolis
de Minas (MG). It also concluded an operational return in the city of Vargem (SP), and the
remodeling of the road system at the junction of Fernão Dias with Presidente Dutra,
substantially improving traffic flow in the region.
Autopista Régis Bittencourt
The Serra do Cafezal (BR-116/SP) project continues to move ahead. The Company has
already concluded and delivered 11.5 kilometers of the duplication, 4.2 kilometers of which
in the city of Miracatu and 7.3 kilometers in Juquitiba (SP), including two interchanges. The
beginning of 2013 marked the issue, by the environmental authority, of the long-awaited
construction permit for the duplication of the remaining 19.0 kilometers out of a total of 30.5
kilometers of the project. This phase, which is expected to last for around four years and
depends on the execution of works amendments with the ANTT, will include the construction
of four tunnels and 33 bridges and overpasses. In June 2013, work began on two segments,
one of 5.0 kilometers and the other of 1.4 kilometers. Work on an additional five-kilometer
stretch, including three tunnels and five overpasses, will begin in 1Q14.
In 2013, the concessionaire also built seven pedestrian overpasses, one underpass, ten
bridges and overpasses, four interchanges and 8.3 kilometers of side roads, and completed
improvements to the highway intersection.
4Q13/ 2013 Earnings Release
February 26, 2014 Page 21 of 29
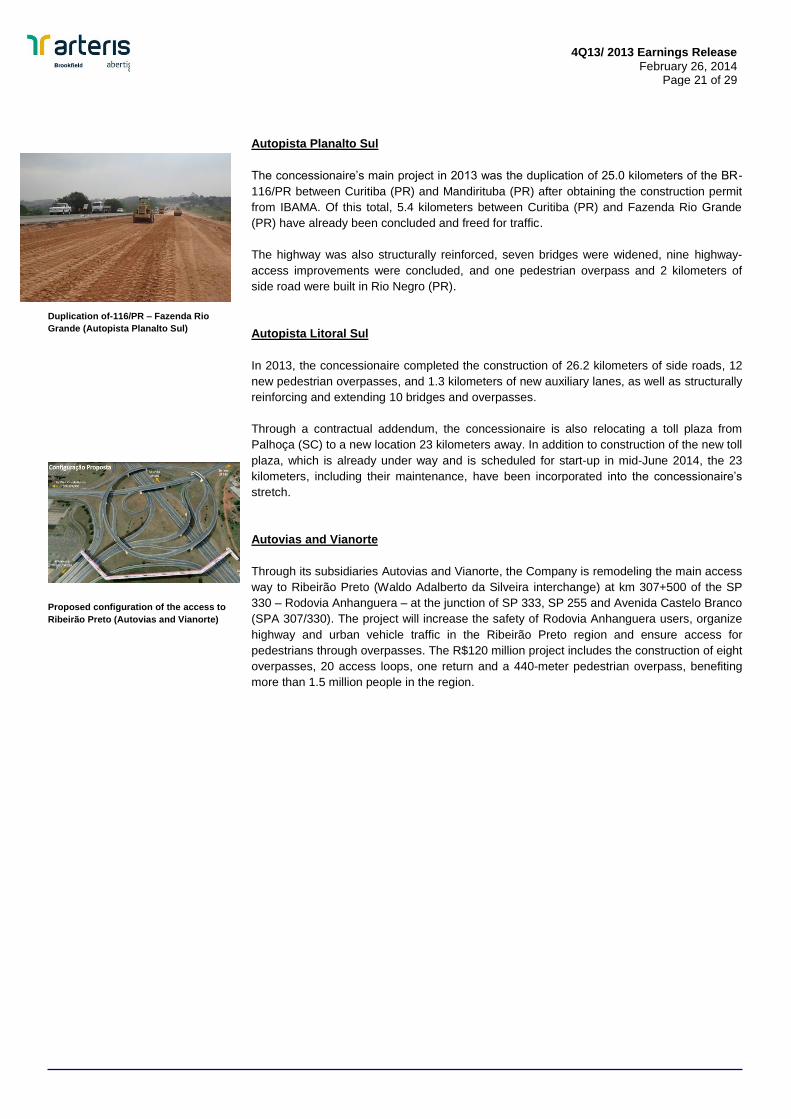
Duplication of-116/PR – Fazenda Rio
Grande (Autopista Planalto Sul)
Proposed configuration of the access to
Ribeirão Preto (Autovias and Vianorte)
Autopista Planalto Sul
The concessionaire’s main project in 2013 was the duplication of 25.0 kilometers of the BR-
116/PR between Curitiba (PR) and Mandirituba (PR) after obtaining the construction permit
from IBAMA. Of this total, 5.4 kilometers between Curitiba (PR) and Fazenda Rio Grande
(PR) have already been concluded and freed for traffic.
The highway was also structurally reinforced, seven bridges were widened, nine highway-
access improvements were concluded, and one pedestrian overpass and 2 kilometers of
side road were built in Rio Negro (PR).
Autopista Litoral Sul
In 2013, the concessionaire completed the construction of 26.2 kilometers of side roads, 12
new pedestrian overpasses, and 1.3 kilometers of new auxiliary lanes, as well as structurally
reinforcing and extending 10 bridges and overpasses.
Through a contractual addendum, the concessionaire is also relocating a toll plaza from
Palhoça (SC) to a new location 23 kilometers away. In addition to construction of the new toll
plaza, which is already under way and is scheduled for start-up in mid-June 2014, the 23
kilometers, including their maintenance, have been incorporated into the concessionaire’s
stretch.
Autovias and Vianorte
Through its subsidiaries Autovias and Vianorte, the Company is remodeling the main access
way to Ribeirão Preto (Waldo Adalberto da Silveira interchange) at km 307+500 of the SP
330 – Rodovia Anhanguera – at the junction of SP 333, SP 255 and Avenida Castelo Branco
(SPA 307/330). The project will increase the safety of Rodovia Anhanguera users, organize
highway and urban vehicle traffic in the Ribeirão Preto region and ensure access for
pedestrians through overpasses. The R$120 million project includes the construction of eight
overpasses, 20 access loops, one return and a 440-meter pedestrian overpass, benefiting
more than 1.5 million people in the region.

4Q13/ 2013 Earnings Release
February 26, 2014 Page 22 of 29
Personnel
Arteris closed 4Q13 with 6,804 employees, 39.8% of whom work for the federal
concessionaires, 19.3% for the state concessionaires, 39.0% for the group’s
construction companies and the remaining 1.9% for the holding company, as shown in
the table below.
Capital Markets
Arteris closed 2013 with a market capitalization of R$6.6 billion, based on the closing
price of R$19.05 per share on December 31, 2013, representing appreciation of 0.53%
since the beginning of the year. In the same period, the Bovespa Index fell by 17.65%.
Under the ticker ARTR3, the Company’s stock was traded in 100% of BM&FBOVESPA
trading sessions, with financial trading volume of approximately R$7.92 billion in 2013.
Performance of ARTR3 vs. Ibovespa Index (2013)
R$ 19.05 +0.5%
51,507 - 17.7%
70 75 80 85 90 95
100 105 110 115 120 125 130
02/01/2013 03/03/2013 02/05/2013 01/07/2013 30/08/2013 29/10/2013 28/12/2013
ARTR3 IBOV
Personnel 4Q13 3Q13 4Q12Var.
4Q13/3Q13
Var.
4Q13/4Q12
Arteris (Holding) 126 120 113 6 13
State Concessions 1,315 1,317 1,335 (2) (20)
Autovias 206 208 207 (2) (1)
Centrovias 314 310 321 4 (7)
Intervias 534 534 542 - (8)
Vianorte 261 265 265 (4) (4)
Federal Concessions 2,708 2,760 2,832 (52) (124)
Litoral Sul 562 561 572 1 (10)
Planalto Sul 262 259 271 3 (9)
Fluminense 403 419 393 (16) 10
Fernão Dias 851 882 943 (31) (92)
Régis Bittencourt 630 639 653 (9) (23)
Latina Manutenção 2,481 2,410 2,480 71 1
Latina Sinalização 174 176 172 (2) 2
Total 6,804 6,783 6,932 21 (128)

4Q13/ 2013 Earnings Release
February 26, 2014 Page 23 of 29
Trading Volume – Daily Average (R$ million)
Number of Trades – Daily Average
* In September 2013, Arteris held a public tender offer for the acquisition of shares which reduced the Company’s free
float, influencing trading volume since then.
Shareholding Structure
The Company’s subscribed and paid-in capital was approximately R$772.4 million on
December 31, 2013, represented by a single class of 344,444,440 common shares.
Base Date: December 31, 2013
*
*
69.3%
30.7% Partícipes en Brasil S.L.
Others
20.6 28.0
21.7
69.9
12.3
4Q12 1Q13 2Q13 3Q13 4Q13
3,113 3,388
2,661 3,072
1,880
4Q12 1Q13 2Q13 3Q13 4Q13
Daily Average 4Q13 3Q13 4Q12Var%
4Q13/3Q13
Var%
4Q13/4Q12
Nº of Trades 1,880 3,072 3,113 -38.8% -39.6%
Nº of Shares Traded 641,569 3,066,525 1,093,271 -79.1% -41.3%
Volume (R$ Million) 12.3 69.9 20.6 -82.4% -40.3%
*

4Q13/ 2013 Earnings Release
February 26, 2014 Page 24 of 29
Ownership Structure
Portfolio of Concession Assets
Key data on our concession portfolio are presented below:
69.3%
100.0%
100.0%
4.68%
100.0% 100.0%
Partícipes en Brasil S.L.
FEDERAL CONCESSIONS SÃO PAULO - STATE CONCESSIONS OTHER BUSNIESS
51.0% 49.0%
Brookfield Asset Management Inc
Concessionaires Km Toll Plazas
Fixed Concession
Charge Payment
Maturity
Concession
MaturityContract Index
State Concessions
Autovias 316,6 5 Aug-18 Aug-18 IGP-M
Centrovias 218,2 5 Jun-18 Jun-19 IGP-M
Intervias 375,7 9 Feb-20 Jan-28 IGP-M
Vianorte 236,6 4 Mar-18 Mar-18 IGP-M
Federal Concessions
Planalto Sul 412,7 5 n.a. Feb-33 IPCA
Fluminense 320,1 5 n.a. Feb-33 IPCA
Fernão Dias 562,1 8 n.a. Feb-33 IPCA
Régis Bittencourt 401,6 6 n.a. Feb-33 IPCA
Litoral Sul 405,9 5 n.a. Feb-33 IPCA

4Q13/ 2013 Earnings Release
February 26, 2014 Page 25 of 29
Information disclosed by Abertis
The quarterly financial and operating information related to Arteris disclosed by Abertis is not
necessarily identical to that reported by the Company, as IFRS rules in Brazil are somewhat
different from those adopted by Abertis. Abertis also includes in its results certain impacts
related to the booking of the acquisition of Participes en Brasil S.L., which owns 69.3% of
Arteris.
The table below shows the traffic trends of the Company’s concessionaires as measured by
ADT (Average Daily Traffic Intensity), a concept normally used by Abertis to measure traffic
performance. ADT represents the concessionaires’’ average daily traffic volume in absolute
vehicle terms and is calculated by taking the daily average number of vehicles in each toll
plaza, weighted by the extension of the highway in kilometers.
Corporate Profile
Arteris is a Brazilian highway concession company with more kilometers under management
than any of its peers. Through its nine concessionaires – Autovias, Centrovias, Intervias,
Vianorte, Autopista Fernão Dias, Autopista Fluminense, Autopista Litoral Sul, Autopista
Planalto Sul and Autopista Régis Bittencourt – Arteris manages 3,250 kilometers in the
states of São Paulo, Rio de Janeiro, Minas Gerais, Paraná and Santa Catarina. Arteris is a
publicly-held company with shares listed in the Novo Mercado trading segment of the
BM&FBovespa. The Company is controlled by Abertis and Brookfield Motorways. More
information can be found at: www.arteris.com.br.
This release contains forward-looking statements relating to the business prospects, estimates of
operating and financial results and growth prospects of Arteris. These are merely projections and as
such are based exclusively on the expectations of Arteris’ management concerning the future of the
business and its continued access to capital to fund the Company’s business plan. Such forward-looking
statements depend substantially on changes in market conditions, government regulations, competitive
pressures, and the performance of the Brazilian economy and the industry and are therefore subject to
change without prior notice.
ADT 4Q13 4Q12 Var% 2013 2012 Var%
State 13.105 12.470 5,1% 12.603 11.964 5,3%
Autovias 12.391 11.840 4,7% 11.963 11.432 4,6%
Centrovias 15.595 14.833 5,1% 14.788 13.979 5,8%
Intervias 10.680 10.252 4,2% 10.381 9.919 4,7%
Vianorte 15.617 14.659 6,5% 14.977 14.071 6,4%
Federal 22.110 21.339 3,6% 21.039 20.339 3,4%
Planalto Sul 7.231 6.844 5,7% 6.883 6.647 3,6%
Fluminense 16.360 15.923 2,7% 15.893 15.562 2,1%
Fernão Dias 26.022 25.377 2,5% 25.169 24.269 3,7%
Régis Bittencourt 23.595 23.005 2,6% 22.508 21.966 2,5%
Litoral Sul 34.884 33.104 5,4% 32.317 30.973 4,3%
Total 18.931 18.208 4,0% 18.061 17.382 3,9%

4Q13/ 2013 Earnings Release
February 26, 2014 Page 26 of 29
APPENDIX 1
CONSOLIDATED BALANCE SHEET
ASSETS 12/31/13 09/30/13 12/31/12
CURRENT ASSETS
Cash and equivalents 929.911 521.391 681.437
Trade receivables 126.709 133.927 111.014
Amounts due from related parties - - 90
Inventories 7.662 7.158 8.878
Prepaid expenses 10.411 15.835 9.076
Recoverable taxes 33.691 28.256 23.772
Restricted investments 47.383 54.055 63.299
Other receivables 5.691 605.747 2.339
Total current assets 1.161.458 1.366.369 899.905
NON-CURRENT ASSETS
Restricted nvestments 63.604 67.411 69.576
Contractual guarantees 331 357 290
Prepaid expenses 22 8 9
Deferred income tax and social contribution 172.108 139.452 120.796
Escrow deposits 20.372 20.544 14.709
Other receivables 217 215 216
Investments in subsidiaries 1.053 1.053 1.053
Property and equipament 46.377 47.996 47.208
Intangible assets 5.903.469 5.590.455 4.894.658
Total non-current assets 6.207.553 5.867.491 5.148.515
TOTAL ASSETS 7.369.011 7.233.860 6.048.420
LIABILITIES AND SHAREHOLDERS' EQUITY
CURRENT
Loans and f inancing 142.989 481.796 109.145
Debentures 145.493 481.071 363.641
Suppliers 122.115 124.165 109.344
Payroll taxes 79.899 81.865 59.878
Taxes payable 82.679 87.242 73.451
Amounts due to related parties 154 259 258
Contractual guarantees 44.847 43.483 42.818
Proposed dividends 22.183 - 20.114
Concession fee obligations 70.299 69.711 67.932
Provision for maintenance in highw ays 71.043 112.208 80.614
Provision for investments in highw ays 68.489 57.163 56.336
Advance insurance 40.152 42.165 54.658
Other payables 10.149 11.741 7.478
Total current liabilities 900.491 1.592.869 1.045.667
NONCURRENT
Loans and f inancing 2.148.990 1.971.678 1.874.329
Debentures 1.687.256 1.125.447 887.537
Concession fee obligations 216.540 226.919 258.691
Deferred revenue 427 748 398
Deferred income tax and social contribution 76.326 69.920 52.698
Provision for maintenance in highw ays 401.395 332.457 252.115
Provision for investments in highw ays 43.151 53.837 54.905
Reserve for civil, labor and tax risks 11.787 12.622 10.176
Other payables 3.075 4.003 4.820
Total non-current liabilities 4.588.947 3.797.631 3.395.669
EQUITY
Capital 772.417 772.417 679.970
Legal reserves 80.076 80.076 60.614
Profit reserves 1.049.351 1.013.138 888.771
Valuation adjustments to capital - foreign exchange differences (22.271) (22.271) (22.271)
Total equity 1.879.573 1.843.360 1.607.084
TOTAL LIABILITIES AND EQUITY 7.369.011 7.233.860 6.048.420
BALANCE SHEET
(In thousands of Brazilian reais)
4Q13/ 2013 Earnings Release
February 26, 2014 Page 27 of 29
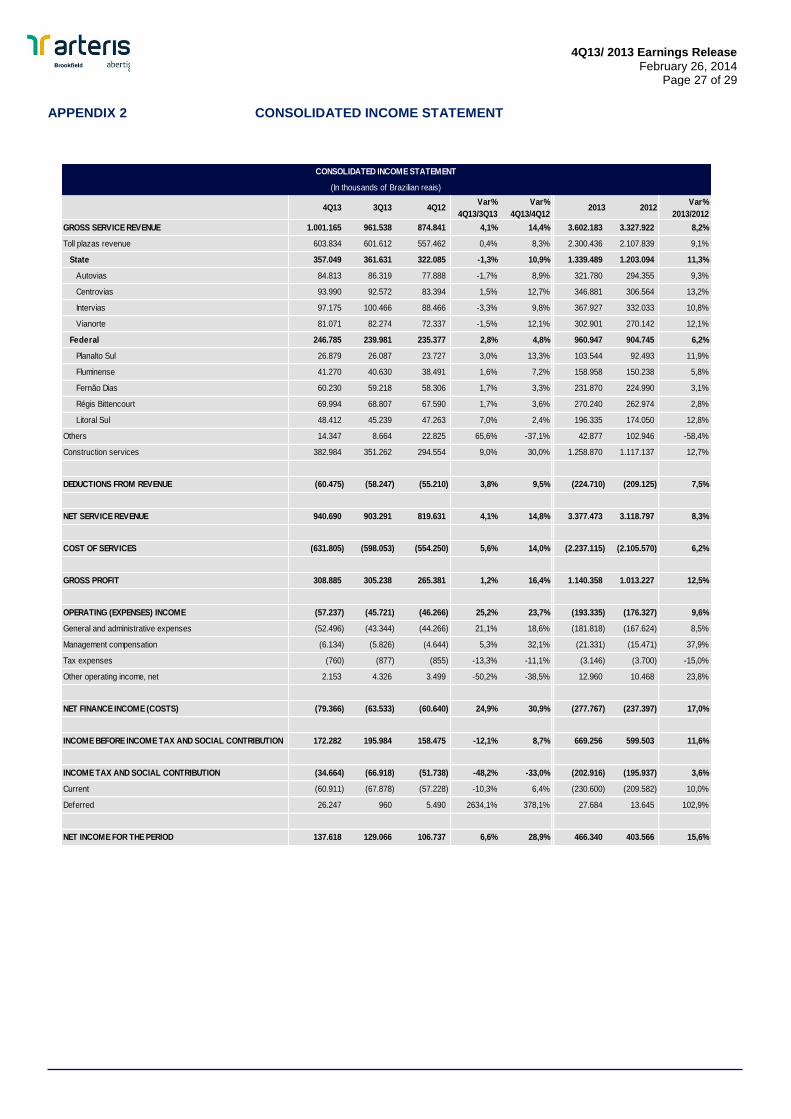
APPENDIX 2 CONSOLIDATED INCOME STATEMENT
4Q13 3Q13 4Q12
Var%
4Q13/3Q13
Var%
4Q13/4Q12 2013 2012
Var%
2013/2012
GROSS SERVICE REVENUE 1.001.165 961.538 874.841 4,1% 14,4% 3.602.183 3.327.922 8,2%
Toll plazas revenue 603.834 601.612 557.462 0,4% 8,3% 2.300.436 2.107.839 9,1%
State 357.049 361.631 322.085 -1,3% 10,9% 1.339.489 1.203.094 11,3%
Autovias 84.813 86.319 77.888 -1,7% 8,9% 321.780 294.355 9,3%
Centrovias 93.990 92.572 83.394 1,5% 12,7% 346.881 306.564 13,2%
Intervias 97.175 100.466 88.466 -3,3% 9,8% 367.927 332.033 10,8%
Vianorte 81.071 82.274 72.337 -1,5% 12,1% 302.901 270.142 12,1%
Federal 246.785 239.981 235.377 2,8% 4,8% 960.947 904.745 6,2%
Planalto Sul 26.879 26.087 23.727 3,0% 13,3% 103.544 92.493 11,9%
Fluminense 41.270 40.630 38.491 1,6% 7,2% 158.958 150.238 5,8%
Fernão Dias 60.230 59.218 58.306 1,7% 3,3% 231.870 224.990 3,1%
Régis Bittencourt 69.994 68.807 67.590 1,7% 3,6% 270.240 262.974 2,8%
Litoral Sul 48.412 45.239 47.263 7,0% 2,4% 196.335 174.050 12,8%
Others 14.347 8.664 22.825 65,6% -37,1% 42.877 102.946 -58,4%
Construction services 382.984 351.262 294.554 9,0% 30,0% 1.258.870 1.117.137 12,7%
DEDUCTIONS FROM REVENUE (60.475) (58.247) (55.210) 3,8% 9,5% (224.710) (209.125) 7,5%
NET SERVICE REVENUE 940.690 903.291 819.631 4,1% 14,8% 3.377.473 3.118.797 8,3%
COST OF SERVICES (631.805) (598.053) (554.250) 5,6% 14,0% (2.237.115) (2.105.570) 6,2%
GROSS PROFIT 308.885 305.238 265.381 1,2% 16,4% 1.140.358 1.013.227 12,5%
OPERATING (EXPENSES) INCOME (57.237) (45.721) (46.266) 25,2% 23,7% (193.335) (176.327) 9,6%
General and administrative expenses (52.496) (43.344) (44.266) 21,1% 18,6% (181.818) (167.624) 8,5%
Management compensation (6.134) (5.826) (4.644) 5,3% 32,1% (21.331) (15.471) 37,9%
Tax expenses (760) (877) (855) -13,3% -11,1% (3.146) (3.700) -15,0%
Other operating income, net 2.153 4.326 3.499 -50,2% -38,5% 12.960 10.468 23,8%
NET FINANCE INCOME (COSTS) (79.366) (63.533) (60.640) 24,9% 30,9% (277.767) (237.397) 17,0%
INCOME BEFORE INCOME TAX AND SOCIAL CONTRIBUTION 172.282 195.984 158.475 -12,1% 8,7% 669.256 599.503 11,6%
INCOME TAX AND SOCIAL CONTRIBUTION (34.664) (66.918) (51.738) -48,2% -33,0% (202.916) (195.937) 3,6%
Current (60.911) (67.878) (57.228) -10,3% 6,4% (230.600) (209.582) 10,0%
Deferred 26.247 960 5.490 2634,1% 378,1% 27.684 13.645 102,9%
NET INCOME FOR THE PERIOD 137.618 129.066 106.737 6,6% 28,9% 466.340 403.566 15,6%
CONSOLIDATED INCOME STATEMENT
(In thousands of Brazilian reais)
4Q13/ 2013 Earnings Release
February 26, 2014 Page 28 of 29
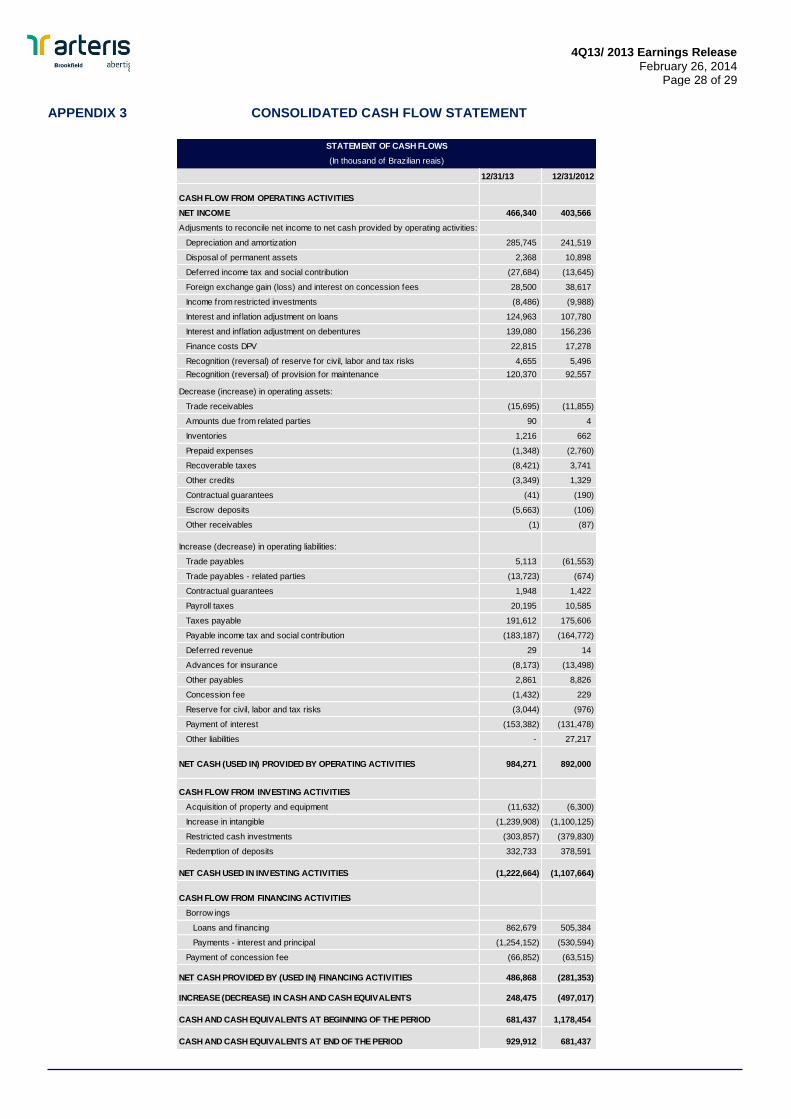
APPENDIX 3 CONSOLIDATED CASH FLOW STATEMENT
12/31/13 12/31/2012
CASH FLOW FROM OPERATING ACTIVITIES
NET INCOME 466,340 403,566
Adjusments to reconcile net income to net cash provided by operating activities:
Depreciation and amortization 285,745 241,519
Disposal of permanent assets 2,368 10,898
Deferred income tax and social contribution (27,684) (13,645)
Foreign exchange gain (loss) and interest on concession fees 28,500 38,617
Income from restricted investments (8,486) (9,988)
Interest and inflation adjustment on loans 124,963 107,780
Interest and inflation adjustment on debentures 139,080 156,236
Finance costs DPV 22,815 17,278
Recognition (reversal) of reserve for civil, labor and tax risks 4,655 5,496
Recognition (reversal) of provision for maintenance 120,370 92,557
Decrease (increase) in operating assets:
Trade receivables (15,695) (11,855)
Amounts due from related parties 90 4
Inventories 1,216 662
Prepaid expenses (1,348) (2,760)
Recoverable taxes (8,421) 3,741
Other credits (3,349) 1,329
Contractual guarantees (41) (190)
Escrow deposits (5,663) (106)
Other receivables (1) (87)
Increase (decrease) in operating liabilities:
Trade payables 5,113 (61,553)
Trade payables - related parties (13,723) (674)
Contractual guarantees 1,948 1,422
Payroll taxes 20,195 10,585
Taxes payable 191,612 175,606
Payable income tax and social contribution (183,187) (164,772)
Deferred revenue 29 14
Advances for insurance (8,173) (13,498)
Other payables 2,861 8,826
Concession fee (1,432) 229
Reserve for civil, labor and tax risks (3,044) (976)
Payment of interest (153,382) (131,478)
Other liabilities - 27,217
NET CASH (USED IN) PROVIDED BY OPERATING ACTIVITIES 984,271 892,000
CASH FLOW FROM INVESTING ACTIVITIES
Acquisition of property and equipment (11,632) (6,300)
Increase in intangible (1,239,908) (1,100,125)
Restricted cash investments (303,857) (379,830)
Redemption of deposits 332,733 378,591
NET CASH USED IN INVESTING ACTIVITIES (1,222,664) (1,107,664)
CASH FLOW FROM FINANCING ACTIVITIES
Borrow ings
Loans and f inancing 862,679 505,384
Payments - interest and principal (1,254,152) (530,594)
Payment of concession fee (66,852) (63,515)
NET CASH PROVIDED BY (USED IN) FINANCING ACTIVITIES 486,868 (281,353)
INCREASE (DECREASE) IN CASH AND CASH EQUIVALENTS 248,475 (497,017)
CASH AND CASH EQUIVALENTS AT BEGINNING OF THE PERIOD 681,437 1,178,454
CASH AND CASH EQUIVALENTS AT END OF THE PERIOD 929,912 681,437
STATEMENT OF CASH FLOWS
(In thousand of Brazilian reais)

4Q13/ 2013 Earnings Release
February 26, 2014 Page 29 of 29
GLOSSARY Adjustment to Present Value (AVP): On December 28, 2007, Federal Law 11,638 was enacted, which amended, revoked and introduced
new provisions to Brazilian Corporate Law, most notably Chapter XV concerning accounting matters, with the law coming into force on January 1, 2008. The main purpose of the new law was to update Brazilian Corporate Law to enable the convergence of generally accepted accounting practices in Brazil with International Financial Reporting Standards (IFRS), as well as to allow new rules and procedures to be issued by the Securities and Exchange Commission of Brazil (CVM), in accordance with international accounting standards.
Complementing this process, the CVM, through Instruction 469 dated May 2, 2008, instructed publicly traded companies on the disclosure and accounting treatment of certain changes introduced by Federal Law 11,638/07. The main changes introduced by Federal Law 11,638/07 that impact the Company's standalone and consolidated Quarterly Financial Information include the mandatory valuation of significant long-term assets and liabilities, such as "Concession Rights" and "Concession Fee Obligations", at present value (Adjustment to Present Value). Previously the Company accounted "Concession Rights" and "Concession Fee Obligations" at their nominal value. The effects from the adjustments to present value from "Concession Rights" and "Concession Fee Obligations" that occurred up to December 31, 2007 were accounted directly under Equity in 2008. As from January 1, 2008, the effects from adjustments to present value have been accounted directly in the quarterly results. Monetary Restatement of the Fixed Concession Fee: The concession contracts between the state concessionaires and the concession authority establish that the monthly payments of the fixed concession fee be adjusted by the IGP-M index every July 1st, which is the same date on which the tolls are adjusted by the same index. State Concessionaires: Specific Purpose Companies created by the winners of the bidding process with which the Concession Contracts were signed which have the specific corporate purpose of maintaining, conserving and operating state highways. State Concessionaires are regulated by the São Paulo State Public Transportation Services Regulatory Agency (ARTESP). Arteris currently manages four state concessionaires in the state of São Paulo (Autovias, Centrovias, Intervias and Vianorte). Federal Concessionaires: Specific Purpose Companies created by the winners of the bidding process with which the Concession
Contracts were signed which have the specific corporate purpose of maintaining, conserving and operating federal highways. Federal Concessionaires are regulated by the National Road Transportation Agency (ANTT). Arteris currently operates five federal concessionaires in Brazil: (Autopista Planalto Sul, Autopista Fluminense, Autopista Fernão Dias, Autopista Régis Bittencourt and Autopista Litoral Su). Costs with the Concession Authority: These are payments that have been stipulated in the concession contracts. These costs are composed of: expenses with the "Variable Fee" for state concessions, which corresponds to 3% of gross revenue at the concessions Autovias, Centrovias and Vianorte, plus 3% of toll revenue and 25% of ancillary revenue; and by costs with "Inspection Funds" and "Technological Development" at the federal concessions, which are adjusted annually by the IPCA inflation index. EBITDA and EBITDA Margin: EBITDA is Earnings before Interest, Taxes, Depreciation and Amortization. EBITDA is not a measure
adopted in accounting standards and does not represent cash flow for the periods presented and therefore should not be considered an alternative to cash flow as an indicator of liquidity. EBITDA does not have a standardized meaning and therefore cannot be compared to the EBITDA of other companies. EBITDA Margin is the ratio between net operating revenue excluding construction revenue and EBITDA. Adjusted EBITDA and Adjusted EBITDA Margin: EBITDA adjusted by the reversal of the provisions for road maintenance. The
Company believes adjusted EBITDA is the best way to show its operating cash flow. Adjusted EBITDA Margin is the ratio between net operating revenue excluding construction revenue and Adjusted EBITDA. Leverage Ratio: The leverage ratio is defined as Net Debt (Gross Debt less Cash and Cash Equivalents) divided by Adjusted EBITDA
(adjusted by the reversal of the provision for maintenance), less the Fixed Concession Fee in cash flow. The lower the leverage ratio, the greater the amount of funding that can be raised in credit markets. Fixed Concession Fee: In accordance with the concession contracts, the state concessionaires must pay the concession authority a fixed
fee in exchange for granting the concession. The contracts also establish that the amount for the fixed fee must be settled in monthly payments over the duration of the concession period. We have opted to account the value of the grant of concession under assets and the total amount payable to the concession authority for the fixed concession fee under liabilities. Electronic Toll Collection / AVI System: The AVI system is an electronic payment system used on our highways. Drivers who use the AVI system have an electronic sensor mounted on their windshield that enables the system to recognize the category of vehicle that they are driving. As they pass through the toll plaza lane, antennae capture the signals emitted and the sensors record the vehicle's presence and calculate the total amount owed, without the driver having to stop the vehicle. Concession Authority: The federal, state or local government or federal district that is responsible for the public service, prior to the
execution of works or otherwise, that is the subject matter of concession or permission. (Federal Law 8,987 of 1995 - Article 2 -CF. Article 1). The concessionaire has access to operate the infrastructure to provide the public services on behalf of the concession authority pursuant to the contractual conditions. The concession authority relies on the regulatory agencies (ARTESP in the state of São Paulo and ANTT for the federal government) to monitor and inspect the transportation services delegated and to regulate the highway concession program. Provision for Maintenance: Estimated spending required to settle the current obligations to maintain infrastructure at the operating levels stipulated in the contract, considering the wear caused by use. The Concessionaire must constitute a provision based on its best estimate of the spending required to maintain a certain level of service or to recuperate infrastructure to operating conditions prior to returning the assets to the concession authority at the end of the concession period, as stipulated in the contract. Toll Adjustments: As established in the concession contracts in the state of São Paulo, tolls are readjusted every July based on the
variation in inflation measured by the IGP-M index in the 12-month period ending on May 31. On July 1, 2013, the IGP-M index will be replaced by the IPCA index as the basis for adjustment. The economic and financial imbalances resulting from the change in index will be evaluated once every two years and be rebalanced in relation to the contract duration transpired. Toll adjustments at the federal concessions are based on the variation in inflation measured by the IPCA index published by the Brazilian Geography and Statistics Institute (IBGE) in the period from the month preceding the base date in the toll proposal presentation, i.e., June 2007, to the month preceding the date on which tolls began to be collected. After this first adjustment, all subsequent adjustments take place annually and are also based on the cumulative variation in the IPCA index in the 12 months since the previous adjustment. Construction Revenue and Costs: These are non-cash accounting entries under the new rules implemented by IFRS that seek to translate the amount of investment the Company makes in intangible assets. The amount recorded as construction revenue is exactly the same as the amount recorded as construction cost, i.e. it does not affect the Company's results. Vehicle Equivalents: Vehicle equivalent unit (VEU) is used as the basis for charging tolls. A passenger vehicle is considered a vehicle equivalent and a commercial vehicle (such as a truck or bus) is calculated by the number of axles, with each axle counting as one passenger vehicle. One passenger vehicle is equivalent to one axle on a commercial vehicle.


