Letter to Shareholders Overview Business Highlights Sustainability Our People Financial Reports Governance Consolidated Financial Statements Barry Callebaut | Annual Report / Consolidated Income Statement for the fiscal year 2020/21 2019/20 in thousands of CHF Notes Revenue from sales and services 1.1 7,207,595 6,893,146 Cost of goods sold (6,060,392) (5,829,445) Gross profit 1,147,203 1,063,701 Marketing and sales expenses (135,376) (140,773) General and administration expenses (430,390) (416,465) Other income 1.3 3,060 4,820 Other expense 1.3 (17,809) (28,131) Operating profit (EBIT) 1.1 566,688 483,152 Finance income 3.8 3,628 6,978 Finance expense 3.8 (105,297) (109,425) Profit before income tax 465,019 380,705 Income tax expense 6.1 (80,514) (69,211) Net profit for the year 384,505 311,494 of which attributable to: shareholders of Barry Callebaut AG 383,939 316,054 non-controlling interests 3.2 566 (4,560) Earnings per share Basic earnings per share (CHF) 3.3 70.04 57.66 Diluted earnings per share (CHF) 3.3 69.84 57.46
Transcript
Letter to Shareholders Overview Business Highlights Sustainability Our People Financial Reports Governance
Consolidated Financial Statements
Barry Callebaut | Annual Report /
Consolidated Income Statement
for the fiscal year 2020/21 2019/20 in thousands of CHF Notes Revenue from sales and services 1.1 7,207,595 6,893,146 Cost of goods sold (6,060,392) (5,829,445) Gross profit 1,147,203 1,063,701 Marketing and sales expenses (135,376) (140,773) General and administration expenses (430,390) (416,465) Other income 1.3 3,060 4,820 Other expense 1.3 (17,809) (28,131) Operating profit (EBIT) 1.1 566,688 483,152 Finance income 3.8 3,628 6,978 Finance expense 3.8 (105,297) (109,425) Profit before income tax 465,019 380,705 Income tax expense 6.1 (80,514) (69,211) Net profit for the year 384,505 311,494
of which attributable to: shareholders of Barry Callebaut AG 383,939 316,054 non-controlling interests 3.2 566 (4,560)
Earnings per share Basic earnings per share (CHF) 3.3 70.04 57.66 Diluted earnings per share (CHF) 3.3 69.84 57.46
Letter to Shareholders Overview Business Highlights Sustainability Our People Financial Reports Governance
Consolidated Financial Statements
Barry Callebaut | Annual Report /
Consolidated Statement of Comprehensive Income
for the fiscal year 2020/21 2019/20 in thousands of CHF Notes Net profit for the year 384,505 311,494 Cash flow hedges 3.7 20,531 16,708 Tax effect on cash flow hedges 3.7 / 6.2 (5,184) (2,815) Currency translation adjustments 41,407 (224,197) Items that may be reclassified subsequently to the income statement 56,754 (210,304) Remeasurement of defined benefit plans 4.2 11,677 31,917 Tax effect on remeasurement of defined benefit plans 6.2 (2,686) (1,931) Items that will never be reclassified to the income statement 8,991 29,986 Other comprehensive income for the year, net of tax 65,745 (180,318) Total comprehensive income for the year 450,250 131,176
of which attributable to: shareholders of Barry Callebaut AG 449,660 136,050 non-controlling interests 590 (4,874)
Letter to Shareholders Overview Business Highlights Sustainability Our People Financial Reports Governance
Consolidated Financial Statements
Barry Callebaut | Annual Report /
Consolidated Balance Sheet
Assets as of August 31, 2021 2020 in thousands of CHF Notes Current assets Cash and cash equivalents 3.4 1,095,831 1,385,976 Short-term deposits 1,467 6,251 Trade receivables and other current assets 2.5 759,951 610,785 Inventories 2.4 2,043,333 1,909,917 Income tax receivables 74,854 62,099 Derivative financial assets 3.7 290,642 365,984 Total current assets 4,266,078 4,341,012 Non-current assets Property, plant and equipment 2.1 1,604,705 1,491,753 Right-of-use assets 2.2 259,928 186,948 Intangible assets 2.3 995,483 985,684 Employee benefit assets 4.2 15,056 14,888 Deferred tax assets 6.2 77,172 83,546 Other non-current assets 25,596 37,279 Total non-current assets 2,977,940 2,800,098 Total assets 7,244,018 7,141,110
Liabilities and equity as of August 31, 2021 2020 in thousands of CHF Notes Current liabilities Bank overdrafts 3.5 63,564 103,603 Short-term debt 3.5 119,427 461,375 Short-term lease liabilities 3.5 41,075 36,543 Trade payables and other current liabilities 2.6 1,433,470 1,119,643 Income tax liabilities 115,351 100,829 Derivative financial liabilities 3.7 350,911 528,492 Provisions 2.7 31,154 19,894 Total current liabilities 2,154,952 2,370,379 Non-current liabilities Long-term debt 3.5 1,930,054 2,006,328 Long-term lease liabilities 3.5 224,464 150,325 Employee benefit liabilities 4.2 138,333 154,041 Provisions 2.7 8,709 6,314 Deferred tax liabilities 6.2 86,298 79,999 Other non-current liabilities 15,991 18,457 Total non-current liabilities 2,403,849 2,415,464 Total liabilities 4,558,801 4,785,843 Equity Share capital 3.2 110 110 Retained earnings and other reserves 2,682,747 2,353,387 Total equity attributable to the shareholders of Barry Callebaut AG 2,682,857 2,353,497 Non-controlling interests 3.2 2,360 1,770 Total equity 2,685,217 2,355,267 Total liabilities and equity 7,244,018 7,141,110
Letter to Shareholders Overview Business Highlights Sustainability Our People Financial Reports Governance
Consolidated Financial Statements
Barry Callebaut | Annual Report /
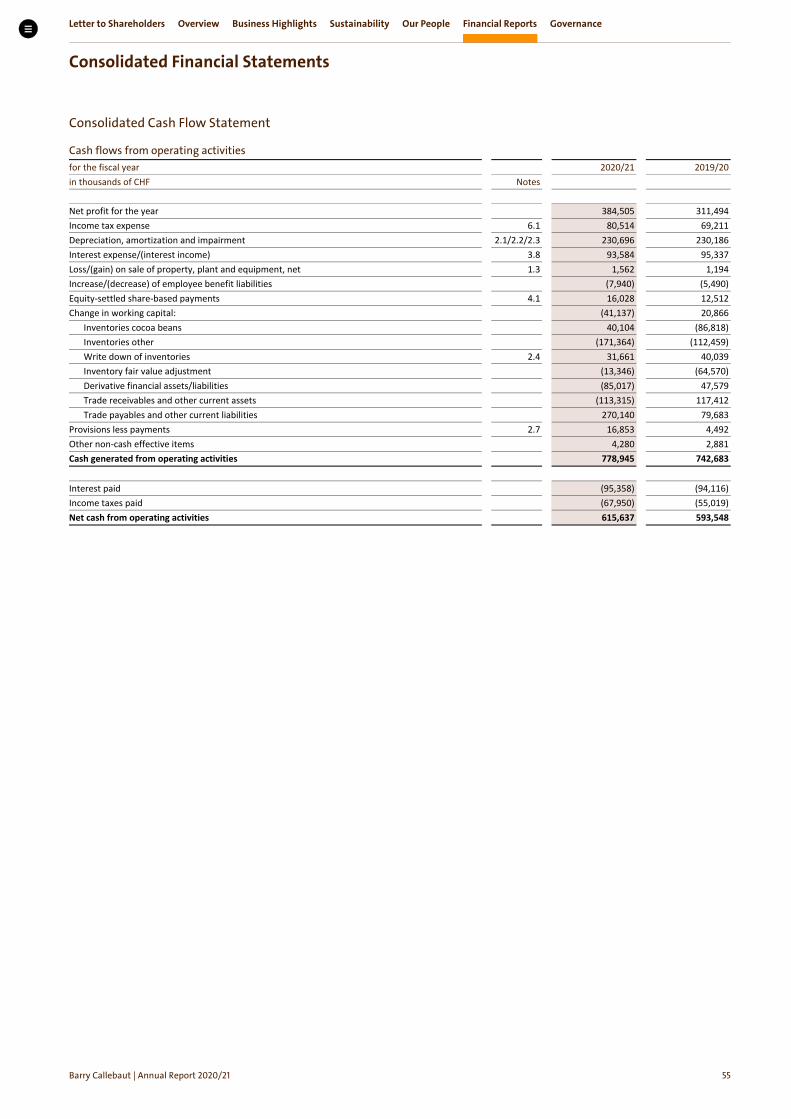
Consolidated Cash Flow Statement
Cash flows from operating activities for the fiscal year 2020/21 2019/20 in thousands of CHF Notes Net profit for the year 384,505 311,494 Income tax expense 6.1 80,514 69,211 Depreciation, amortization and impairment 2.1/2.2/2.3 230,696 230,186 Interest expense/(interest income) 3.8 93,584 95,337 Loss/(gain) on sale of property, plant and equipment, net 1.3 1,562 1,194 Increase/(decrease) of employee benefit liabilities (7,940) (5,490) Equity-settled share-based payments 4.1 16,028 12,512 Change in working capital: (41,137) 20,866
Inventories cocoa beans 40,104 (86,818) Inventories other (171,364) (112,459) Write down of inventories 2.4 31,661 40,039 Inventory fair value adjustment (13,346) (64,570) Derivative financial assets/liabilities (85,017) 47,579 Trade receivables and other current assets (113,315) 117,412 Trade payables and other current liabilities 270,140 79,683
Provisions less payments 2.7 16,853 4,492 Other non-cash effective items 4,280 2,881 Cash generated from operating activities 778,945 742,683 Interest paid (95,358) (94,116) Income taxes paid (67,950) (55,019) Net cash from operating activities 615,637 593,548
Letter to Shareholders Overview Business Highlights Sustainability Our People Financial Reports Governance
Consolidated Financial Statements
Barry Callebaut | Annual Report /
Consolidated Cash Flow Statement
Cash flows from investing activities for the fiscal year 2020/21 2019/20 in thousands of CHF Notes Purchase of property, plant and equipment 2.1 (227,190) (233,430) Proceeds from sale of property, plant and equipment 6,422 2,804 Purchase of intangible assets 2.3 (48,054) (47,464) Proceeds from sale of intangible assets 33 311 Acquisition of subsidiaries/businesses net of cash acquired 5.1 (907) (12,750) Purchase of short-term deposits (67) (7,070) Proceeds from sale of short-term deposits 4,923 1,682 Proceeds from sale/(purchase) of other non-current assets (174) 102 Interest received 3,428 6,533 Net cash used in investing activities (261,586) (289,282)
Cash flows from financing activities for the fiscal year 2020/21 2019/20 in thousands of CHF Notes Proceeds from the issue of short-term debt 3.5 32,184 423,348 Repayment of short-term debt 3.5 (443,810) (141,721) Proceeds from the issue of long-term debt 3.5 137 1,593,050 Repayment of long-term debt 3.5 (28,433) (1,075,336) Payment of lease liabilities 3.5 (39,943) (38,164) Dividend paid to shareholders of Barry Callebaut AG 3.2 (120,715) (142,710) Purchase of treasury shares 3.5 (18,400) (27,332) Effect of changes in non-controlling interests – (9,110) Net cash (used in)/from financing activities (618,980) 582,025 Effect of exchange rate changes on cash and cash equivalents 14,823 (29,107) Net (decrease)/increase in cash and cash equivalents (250,106) 857,184 Cash and cash equivalents at beginning of year 1,282,373 425,189 Cash and cash equivalents at end of year 1,032,267 1,282,373 Net (decrease)/increase in cash and cash equivalents (250,106) 857,184 Cash and cash equivalents 3.4 1,095,831 1,385,976 Bank overdrafts 3.5 (63,564) (103,603) Cash and cash equivalents as defined for the cash flow statement 3.4 1,032,267 1,282,373
Letter to Shareholders Overview Business Highlights Sustainability Our People Financial Reports Governance
Consolidated Financial Statements
Barry Callebaut | Annual Report /
Consolidated Statement of Changes in Equity
Attributable to the shareholders of Barry Callebaut AG
Share capital
Treasury shares
Retained earnings
Hedging reserves
Cumulative translation
adjustment
Total¹ Non- controlling
interests
Total equity
in thousands of CHF as of September 1, 2019 110 (19,506) 3,083,698 (30,775) (657,698) 2,375,829 14,320 2,390,149
Items that may be reclassified subsequently to the income statement
–
–
–
13,893
(223,919)
(210,026)
(278)
(210,304)
Remeasurement of defined benefit plans – – 31,953 – – 31,953 (36) 31,917 Tax effect on remeasurement of defined benefit plans
–
–
(1,931)
–
–
(1,931)
–
(1,931)
Items that will never be reclassified to the income statement
–
–
30,022
–
–
30,022
(36)
29,986
Other comprehensive income, net of tax – – 30,022 13,893 (223,919) (180,004) (314) (180,318) Net profit for the year – – 316,054 – – 316,054 (4,560) 311,494
Total comprehensive income for the year – – 346,076 13,893 (223,919) 136,050 (4,874) 131,176 Hedge reserve transferred to initial carrying amount of the hedged item
Total contributions and distributions – (3,799) (153,731) – – (157,530) – (157,530) Movements of non-controlling interest – – – – – – (7,676) (7,676)
Total changes in ownership interests – – – – – – (7,676) (7,676) as of August 31, 2020 110 (23,305) 3,276,043 (17,734) (881,617) 2,353,497 1,770 2,355,267 as of September 1, 2020 110 (23,305) 3,276,043 (17,734) (881,617) 2,353,497 1,770 2,355,267
Items that may be reclassified subsequently to the income statement
–
–
–
15,229
41,518
56,747
7
56,754
Remeasurement of defined benefit plans – – 11,660 – – 11,660 17 11,677 Tax effect on remeasurement of defined benefit plans
–
–
(2,686)
–
–
(2,686)
–
(2,686)
Items that will never be reclassified to the income statement
–
–
8,974 –
–
8,974
17
8,991
Other comprehensive income, net of tax – – 8,974 15,229 41,518 65,721 24 65,745 Net profit for the year – – 383,939 – – 383,939 566 384,505
Total comprehensive income for the year – – 392,913 15,229 41,518 449,660 590 450,250 Hedge reserve transferred to initial carrying amount of the hedged item
Total contributions and distributions – 7,711 (130,798) – – (123,087) – (123,087) as of August 31, 2021 110 (15,594) 3,538,158 282 (840,099) 2,682,857 2,360 2,685,217
1 Attributable to the shareholders of Barry Callebaut AG.
Letter to Shareholders Overview Business Highlights Sustainability Our People Financial Reports Governance
Notes to the Consolidated Financial Statements
Barry Callebaut | Annual Report /
Basis of Preparation
A. Organization and business activity Barry Callebaut AG (the “Company”) has its head office in Zurich, Switzerland, at Hardturmstrasse 181. Barry Callebaut AG is registered in Switzerland and has been listed on the SIX Swiss Exchange (BARN, ISIN Number: CH0009002962) since 1998. These Consolidated Financial Statements comprise the Company and its subsidiaries (together referred to as the “Group”).
The Group is the world’s leading manufacturer of high-quality chocolate and cocoa products – from sourcing and processing cocoa beans to producing the finest chocolates, including chocolate fillings, decorations, and compounds.
B. Basis of presentation The Consolidated Financial Statements were authorized for issue by the Board of Directors on November 8, 2021 and are subject to approval by the Annual General Meeting of Shareholders on December 8, 2021.
The Consolidated Financial Statements of the Group have been prepared in accordance with International Financial Reporting Standards (IFRS) and comply with Swiss law.
The Consolidated Financial Statements have been prepared on the historical cost basis except for certain items for which IFRS requires another measurement basis, in which case this is explicitly stated in the accounting policies. Significant accounting policies relevant to the understanding of the Consolidated Financial Statements are included in the corresponding notes. The Group has consistently applied its accounting policies to all periods presented in these Consolidated Financial Statements.
The Consolidated Financial Statements are presented in Swiss francs, which is the Company’s functional currency.
All amounts have been rounded to the nearest thousand, unless otherwise indicated. Due to rounding, the figures presented in the tables may not add up precisely to the totals provided.
Letter to Shareholders Overview Business Highlights Sustainability Our People Financial Reports Governance
Notes to the Consolidated Financial Statements
Barry Callebaut | Annual Report /
C. Use of judgment and estimates The preparation of financial statements requires management to make judgments, estimates and assumptions that affect the application of accounting policies and the reported amounts of assets, liabilities, income, and expenses. Actual results may differ from these estimates.
Estimates and underlying assumptions are reviewed on an ongoing basis. Revisions to accounting estimates are recognized prospectively.
Information related to judgments made in applying accounting policies that have the most significant effects on the amounts recognized in the Consolidated Financial State-ments, together with assumptions and estimation uncertainties that have a significant risk of resulting in a material adjustment in the year ending August 31, 2021, are included in the following notes:
Note 2.2 Right-of-use assets: Determination of the lease term for options to extend or terminate the lease Note 2.3 Intangible assets: Impairment testing for CGUs containing goodwill, i.e. key assumptions used for
value-in-use calculations Note 2.7 Provisions: Recognition and measurement of provisions Note 4.2 Employee benefit: Measurement of defined benefit liabilities, i.e. actuarial assumptions Note 6 Income taxes: Recognition and measurement of current and deferred tax liabilities and assets for
uncertain tax positions and availability of future taxable profits against which tax loss carry forwards can be utilized
D. Introduction of new standards and interpretations in / and later The Group has adopted new standards, amendments and interpretations to the existing International Financial Reporting Standards (IFRS) that are mandatory for periods starting on or after January 1, 2021. These adoptions did not have any material impact on the current reporting period.
The Group has also performed an assessment of the new standards and interpretations with effective date of January 1, 2021 and with planned application in fiscal year 2021/22. Based on this assessment, the Group does not expect that the new standards and interpretations will have a material impact on the Consolidated Financial Statements.
Effective date
Applied /Planned application by the Group in
Amendments to Standards and Interpretations Amendments to References to Conceptual Framework in IFRS Standards January 1, 2020 Fiscal year 2020/21 Definition of a Business (Amendments to IFRS 3) January 1, 2020 Fiscal year 2020/21 Definition of Material (Amendments to IAS 1 and IAS 8) January 1, 2020 Fiscal year 2020/21 Interest Rate Benchmark Reform (Amendments to IFRS 9, IAS 39 and IFRS 7) January 1, 2020 Fiscal year 2020/21 Extension of the Temporary Exemption from Applying IFRS 9 (Amendments to IFRS 4) January 1, 2020 Fiscal year 2020/21 Covid-19-Related Rent Concessions (Amendment to IFRS 16) and beyond 30 June 2021 June 1, 2020 / April 1, 2021 Fiscal year 2020/21 Interest Rate Benchmark Reform, Phase 2 (Amendments to IFRS 9, IAS 39, IFRS 7, IFRS 4 and IFRS 16) January 1, 2021 Fiscal year 2021/22 Onerous Contracts – Cost of Fulfilling a Contract (Amendments to IAS 37) January 1, 2022 Fiscal year 2022/23
Letter to Shareholders Overview Business Highlights Sustainability Our People Financial Reports Governance
Notes to the Consolidated Financial Statements
Barry Callebaut | Annual Report /
Operating Performance
. Segment information External segment reporting is based on the internal organizational and management structure, as well as on the internal information reviewed regularly by the Chief Operating Decision Maker. Barry Callebaut’s Chief Operating Decision Maker has been identified as the Executive Committee.
The Executive Committee manages the business from a geographic view. Hence, Presidents were appointed for each Region. Since the Group’s cocoa activities operate independently from the Regions, the Global Cocoa business is managed by the Executive Committee as its own segment in addition to the geographic regions of EMEA (Europe, Middle East and Africa), Americas and Asia Pacific. Furthermore, the Executive Committee also manages the Corporate functions independently. The Corporate segment mainly consists of headquarter services (including the Group’s centralized Treasury department) to other segments. Thus, the Group reports the Corporate segment separately.
The Global Cocoa segment is responsible for the procurement of ingredients for chocolate production (mainly cocoa, sugar, dairy and nuts) and the Group’s cocoa-processing business. Global Cocoa generates approximately 57% of its revenues from transactions with other operating segments of the Group.
The regional chocolate businesses consist of chocolate production related to the Product Groups of Food Manufacturers focusing on industrial customers and Gourmet & Specialties focusing on products for artisans and professional users of chocolate such as chocolatiers, pastry chefs or bakers as well as products for vending machines.
Financial information by reportable segments
2020/21 in thousands of CHF
EMEA
Americas
Asia Pacific
Global Cocoa
Total segments
Corporate Eliminations
Group
Revenue from external customers 3,128,480 1,830,334 443,990 1,804,791 7,207,595 – – 7,207,595 Revenue from transactions with other operating segments of the Group
151,657
7,205
–
2,406,300
2,565,162
–
(2,565,162)
–
Revenue from sales and services 3,280,137 1,837,539 443,990 4,211,091 9,772,757 – (2,565,162) 7,207,595 Operating profit (EBIT) 339,234 186,574 56,983 86,476 669,267 (102,579) – 566,688 Depreciation and amortization (85,186) (53,498) (14,390) (70,168) (223,242) (5,264) – (228,506) Impairment (1,518) (61) (74) (522) (2,175) (15) – (2,190) Interest income 3,640 3,640 Interest expense (88,766) (88,766) Total assets 2,266,399 1,145,417 296,419 2,885,593 6,593,828 1,137,451 (487,261) 7,244,018 Additions to property, plant, equipment, right-of-use assets and intangible assets, excluding acquisitions of subsidiaries/businesses
(165,538)
(86,158)
(23,085)
(123,978)
(398,759)
(10,582)
–
(409,341)
Letter to Shareholders Overview Business Highlights Sustainability Our People Financial Reports Governance
Notes to the Consolidated Financial Statements
Barry Callebaut | Annual Report /
2019/20 in thousands of CHF
EMEA
Americas
Asia Pacific
Global Cocoa
Total segments
Corporate Eliminations
Group
Revenue from external customers 2,915,805 1,759,526 400,229 1,817,586 6,893,146 – – 6,893,146 Revenue from transactions with other operating segments of the Group
115,190
3,424
31
2,324,052
2,442,697
–
(2,442,697)
–
Revenue from sales and services 3,030,995 1,762,950 400,260 4,141,638 9,335,843 – (2,442,697) 6,893,146 Operating profit (EBIT) 269,085 182,378 42,726 87,123 581,312 (98,160) – 483,152 Depreciation and amortization (79,935) (52,598) (12,818) (71,050) (216,401) (4,581) – (220,982) Impairment (1,377) (1,141) (11) (6,535) (9,064) (140) – (9,204) Interest income 6,697 6,697 Interest expense (94,664) (94,664) Total assets 2,055,960 1,096,108 243,023 2,846,779 6,241,870 1,427,740 (528,500) 7,141,110 Additions to property, plant, equipment, right-of-use assets and intangible assets, excluding acquisitions of subsidiaries/businesses
(117,935)
(64,916)
(17,775)
(112,529)
(313,155)
(4,684)
–
(317,839)
Global Cocoa comprises Group-wide sourcing and Global Cocoa processing functions for the benefit of all the Regions. Therefore, the major part of its operating profit (EBIT) is allocated to the Regions.
Segment revenue, segment operating profit (EBIT) and segment assets are measured based on IFRS principles.
Finance income and expense, the Group’s share of result of equity-accounted investees and income taxes are not allocated to the respective segment for internal management purposes.
Additional entity-wide disclosures Information on geographical regions Barry Callebaut is domiciled in Switzerland, however, its major revenues are generated in other countries. The following table shows revenues reported based on the geographic location of customers and non-current assets other than financial instruments, deferred tax assets and employee benefit assets.
2020/21 2019/20 2020/21 2019/20 in thousands of CHF Revenue Non-current assets US 1,294,863 1,265,168 454,948 434,746 Germany 509,933 519,899 98,082 98,824 UK 502,993 468,978 69,286 58,611 France 428,045 397,119 89,512 82,716 Mexico 402,741 374,579 16,737 15,386 Belgium 370,745 375,389 582,972 501,690 Brazil 362,318 351,592 77,223 69,392 Poland 319,115 311,394 78,873 85,687 Switzerland 61,109 59,888 67,504 51,072 Rest of EMEA 1,763,673 1,638,996 630,380 619,662 Rest of Americas 405,490 355,320 174,086 160,977 Asia Pacific 786,570 774,824 541,811 518,835 Total 7,207,595 6,893,146 2,881,414 2,697,598
Letter to Shareholders Overview Business Highlights Sustainability Our People Financial Reports Governance
Notes to the Consolidated Financial Statements
Barry Callebaut | Annual Report /
Information on Product Groups The Group has numerous products that are sold to external customers. Therefore, for internal review by the Chief Operating Decision Maker, information on products is aggregated on a Product Group level. The following table breaks down external revenues into Product Groups:
Segment information by Product Group
in thousands of CHF 2020/21 2019/201 Cocoa Products 1,804,791 1,817,586 Food Manufacturers 4,273,841 4,118,662 Gourmet & Specialties 1,128,963 956,898 Revenue from external customers 7,207,595 6,893,146
1 Certain Gourmet & Specialties customers have been shifted to the Food Manufacturers Product Group to better serve them. The minor reallocation represents
less than 1% of Gourmet & Specialties volume and sales revenues in fiscal year 2019/20.
In fiscal year 2020/21, the biggest single customer contributed CHF 822.0 million or 11.4 % of total revenues reported across various regions (2019/20: CHF 807.9 million or 11.7%). No other single customer contributed more than 10% of total consolidated revenue.
Letter to Shareholders Overview Business Highlights Sustainability Our People Financial Reports Governance
Notes to the Consolidated Financial Statements
Barry Callebaut | Annual Report /
Accounting policies
Revenue recognition Revenue from sales and services represent the net sales revenue from raw materials, semi-processed and processed goods transferred to customers and for services related to food processing.
Revenue is measured based on the contractually agreed transaction price at the amount, which the Group expects to receive in exchange for transferring promised goods or services to the customer.
Revenue is generally recognized at the point in time, when control of the goods has been transferred to the customer, which is upon delivery or shipment of the goods, according to the applicable Incoterms. The payment terms are typically between 30 and 90 days.
The Group recognizes revenue over time for highly customized products for which the Group has no alternative use. The nature of the Group’s business means that the production of these goods and its delivery occur in short succession. The revenue for these products is recognized over time using the output method ‘units delivered’.
Appropriate provisions are made for all additional costs to be incurred in connection with the sales, including the cost related to returns of goods, which do not meet agreed specifications and quality-related claims.
Type of commercial agreement Commercial principle
Contract business Partnership agreements/Umbrella agreement The Group enters into long-term partnership/umbrella agreements of between three to ten years supported by a framework agreement between the Group and the customer governing the conduct of business, payment terms, rights to goods and services. Partnership agreements typically include legally enforceable annual volume purchase commitments. Firm purchase commitments are agreed for delivery periods of typically three to six months.
Volume agreements The customer commits to legally enforceable firm purchase commitments for certain volumes of specified goods. The conduct of business is ordinarily governed by Group's general terms and conditions.
Price list business Based on forecasted sales and raw materials prices, the Group establishes a price list for the products in its portfolio. The price list then applies to sales for a period of typically six to twelve months.
Segment reporting Operating segments are reported in a manner consistent with the internal reporting provided to the Chief Operating Decision Maker. The Chief Operating Decision Maker, who is responsible for allocating resources and assessing performance of the operating segments, has been identified as the Group’s Executive Committee, consisting of the Chief Executive Officer, the Chief Financial Officer and the Presidents of the Regions EMEA, Americas, Asia Pacific and Global Cocoa as well as the Chief Operations Officer, the Chief Innovation, Sustainability & Quality Officer and the Chief Human Resources Officer.
Letter to Shareholders Overview Business Highlights Sustainability Our People Financial Reports Governance
Notes to the Consolidated Financial Statements
Barry Callebaut | Annual Report /
. Research and development expenses
in thousands of CHF 2020/21 2019/20 Research and development expenses (29,685) (32,170)
Research and development expenses not qualifying for capitalization are directly charged to the Consolidated Income Statement and are reported under “Marketing and sales expenses” and “General and administration expenses”. The part qualifying for capitalization is reported as addition under internally generated assets in Note 2.3 – “Intangible assets”.
. Other income and expense
Composition of other income
in thousands of CHF 2020/21 2019/20 Rental income 421 641 Income from sustainability initiatives 1,300 1,919 Other 1,339 2,260 Total other income 3,060 4,820
Composition of other expense
in thousands of CHF 2020/21 2019/20 Restructuring costs (296) (1,931) Litigations and claims (9,517) (9,589) Net loss on sale of property, plant and equipment (1,562) (1,194) Impairment of property, plant and equipment (Note 2.1) (803) (7,560) Impairment of intangibles (Note 2.3) (1,387) (1,644) Impairment of financial instruments (3,549) (4,134) Acquisition related costs (Note 7.2/5.1) (194) (223) Other (501) (1,856) Total other expense (17,809) (28,131)
Gain on disposal of property, plant and equipment in the amount of CHF 0.5 million in fiscal year 2020/21 (2019/20: CHF 0.3 million) was netted against the loss on disposal of property, plant and equipment.
Letter to Shareholders Overview Business Highlights Sustainability Our People Financial Reports Governance
Notes to the Consolidated Financial Statements
Barry Callebaut | Annual Report /
Operating Assets and Liabilities
. Property, plant and equipment
2020/21
Land and buildings
Plant and machinery
Office equipment, furniture and
motor vehicles
Under construction
Total
in thousands of CHF At cost
as of September 1, 2020 672,799 2,023,649 118,363 168,854 2,983,665 Additions1 5,938 30,389 2,807 199,766 238,900 Disposals (5,069) (40,302) (6,170) (365) (51,906) Currency translation adjustments 9,394 29,925 1,343 2,615 43,277 Reclassifications from under construction 57,855 132,948 10,954 (201,757) – Other reclassifications2 – 242 352 1,455 2,049 as of August 31, 2021 740,917 2,176,851 127,649 170,568 3,215,985 Accumulated depreciation and impairment losses
as of September 1, 2020 304,584 1,090,387 96,913 28 1,491,912 Depreciation 22,563 109,610 8,089 – 140,262 Impairment (Note 1.3) – 113 1 689 803 Disposals (4,834) (33,187) (5,899) – (43,920) Currency translation adjustments 3,935 16,614 1,157 27 21,733 Other reclassifications2 – 260 230 – 490 as of August 31, 2021 326,248 1,183,797 100,491 744 1,611,280 Net as of August 31, 2021 414,669 993,054 27,158 169,824 1,604,705
1 Cash outflow amounted to CHF 227.2 million, of which CHF 5.7 million related to prepayments. Of the additions, CHF 17.4 million related to not yet paid purchases of property, plant and equipment.
2 Reclassified from “Intangible assets” (net CHF 0.5 million) and “Right-of-use assets” (net CHF 1.0 million).
Letter to Shareholders Overview Business Highlights Sustainability Our People Financial Reports Governance
Notes to the Consolidated Financial Statements
Barry Callebaut | Annual Report /
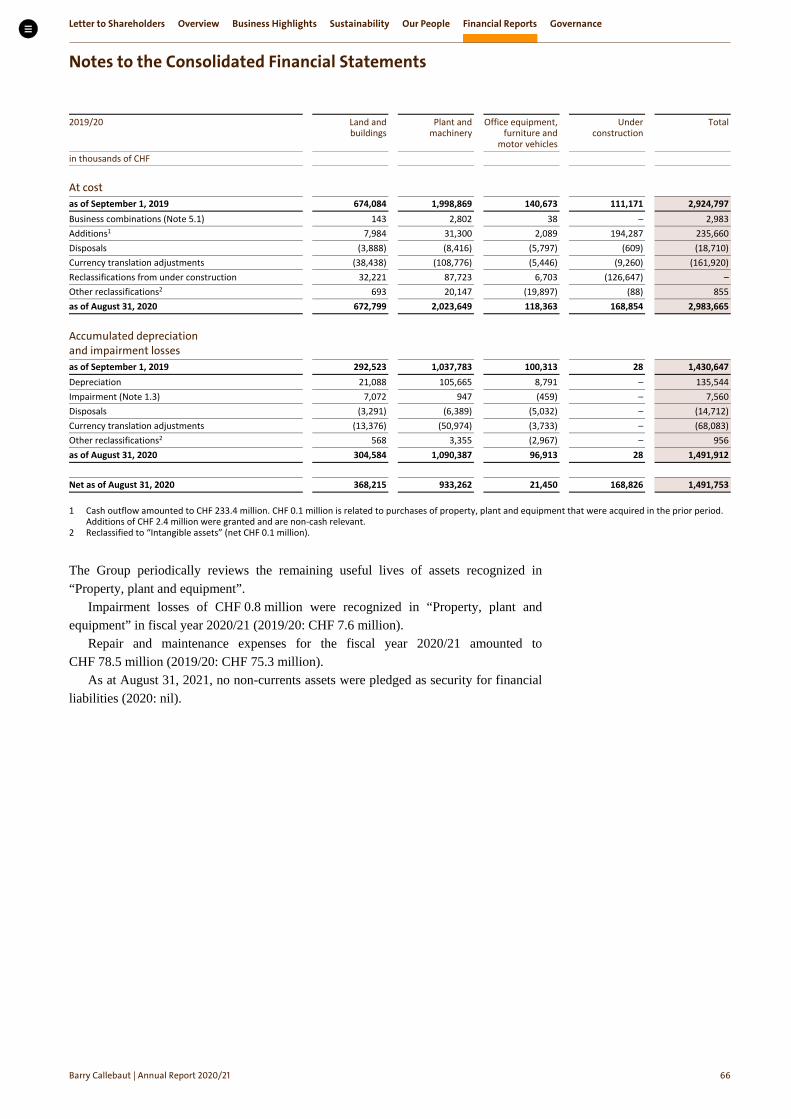
2019/20
Land and buildings
Plant and machinery
Office equipment, furniture and
motor vehicles
Under construction
Total
in thousands of CHF At cost as of September 1, 2019 674,084 1,998,869 140,673 111,171 2,924,797 Business combinations (Note 5.1) 143 2,802 38 – 2,983 Additions1 7,984 31,300 2,089 194,287 235,660 Disposals (3,888) (8,416) (5,797) (609) (18,710) Currency translation adjustments (38,438) (108,776) (5,446) (9,260) (161,920) Reclassifications from under construction 32,221 87,723 6,703 (126,647) – Other reclassifications2 693 20,147 (19,897) (88) 855 as of August 31, 2020 672,799 2,023,649 118,363 168,854 2,983,665 Accumulated depreciation and impairment losses
as of September 1, 2019 292,523 1,037,783 100,313 28 1,430,647 Depreciation 21,088 105,665 8,791 – 135,544 Impairment (Note 1.3) 7,072 947 (459) – 7,560 Disposals (3,291) (6,389) (5,032) – (14,712) Currency translation adjustments (13,376) (50,974) (3,733) – (68,083) Other reclassifications2 568 3,355 (2,967) – 956 as of August 31, 2020 304,584 1,090,387 96,913 28 1,491,912 Net as of August 31, 2020 368,215 933,262 21,450 168,826 1,491,753
1 Cash outflow amounted to CHF 233.4 million. CHF 0.1 million is related to purchases of property, plant and equipment that were acquired in the prior period. Additions of CHF 2.4 million were granted and are non-cash relevant.
2 Reclassified to “Intangible assets” (net CHF 0.1 million).
The Group periodically reviews the remaining useful lives of assets recognized in “Property, plant and equipment”.
Impairment losses of CHF 0.8 million were recognized in “Property, plant and equipment” in fiscal year 2020/21 (2019/20: CHF 7.6 million).
Repair and maintenance expenses for the fiscal year 2020/21 amounted to CHF 78.5 million (2019/20: CHF 75.3 million).
As at August 31, 2021, no non-currents assets were pledged as security for financial liabilities (2020: nil).
Letter to Shareholders Overview Business Highlights Sustainability Our People Financial Reports Governance
Notes to the Consolidated Financial Statements
Barry Callebaut | Annual Report /
Accounting policies
Property, plant and equipment
Property, plant and equipment is measured at the acquisition or construction cost less accumulated depreciation and accumulated impair-ment losses. A straight-line method of depreciation is applied through the estimated useful life.
Estimated useful lives of major classes of depreciable assets are:
Buildings (including warehouses and installations) 20 to 50 years Plant and machinery 5 to 20 years Office equipment, furniture and motor vehicles 3 to 10 years
Maintenance and repair expenditures are charged to the income state-ment as incurred.
The carrying amounts of property, plant and equipment are reviewed at least at each reporting date to assess whether they are recoverable in the form of future economic benefits. If the recoverable amount of an asset has declined below its carrying amount, an impairment loss is recognized to reduce the value of the assets to its recoverable amount. In determining the recoverable amount of the assets, expected cash flows are discounted to their present value.
Borrowing costs Borrowing costs related to the acquisition, construction, or production of a qualifying asset are capitalized in accordance with IAS 23. A qualifying asset is an asset that necessarily takes a substantial period of time in order to use or sell it as intended by the Group management.
Letter to Shareholders Overview Business Highlights Sustainability Our People Financial Reports Governance
Notes to the Consolidated Financial Statements
Barry Callebaut | Annual Report /
. Right-of-use assets
The Group leases land and buildings for use as office and warehouse space. Lease contracts are entered on an individual basis and contain a wide range of different terms and conditions. Lease terms are typically fixed for a period of three to ten years. In many cases, lease contracts for buildings contain extension options, which provide operational flexibility and security. Such options are considered individually to determine whether the Group is reasonably certain to exercise the option. Furthermore, the Group maintains a fleet of leased cars with an average lease term of three years and lease vehicles with an average lease term of seven years. Lease term for hardware is an average of five years.
2020/21 Land and buildings
Plant and machinery
Office equipment and motor
vehicles
Total
in thousands of CHF At cost
as of September 1, 2020 190,799 4,105 31,500 226,404 Additions 105,443 177 16,671 122,291 Disposals (5,669) (33) (2,421) (8,123) Lease modifications (6,310) (94) (323) (6,727) Currency translation adjustments 2,224 41 455 2,720 Reclassifications1 (363) (542) (304) (1,209) as of August 31, 2021 286,124 3,654 45,578 335,356 Accumulated depreciation and impairment losses
as of September 1, 2020 29,317 1,109 9,030 39,456 Depreciation 32,202 463 11,365 44,030 Disposals (5,310) (39) (2,171) (7,520) Lease modifications (821) – (94) (915) Currency translation adjustments 440 11 122 573 Reclassifications1 258 (256) (198) (196) as of August 31, 2021 56,086 1,288 18,054 75,428 Net as of August 31, 2021 230,038 2,366 27,524 259,928
1 Reclassified to Property, plant and equipment (net CHF 1.0 million).
Letter to Shareholders Overview Business Highlights Sustainability Our People Financial Reports Governance
Notes to the Consolidated Financial Statements
Barry Callebaut | Annual Report /
2019/20 Land and buildings
Plant and machinery
Office equipment and motor
vehicles
Total
in thousands of CHF At cost
as of September 1, 2019 183,834 3,828 23,570 211,232 Business combinations 3,951 – – 3,951 Additions 22,331 212 12,172 34,715 Disposals (884) (247) (3,154) (4,285) Lease modifications (5,525) – – (5,525) Currency translation adjustments (12,908) 312 (1,088) (13,684) as of August 31, 2020 190,799 4,105 31,500 226,404 Accumulated depreciation and impairment losses
as of September 1, 2019 – – – – Depreciation 30,141 678 9,791 40,610 Disposals (293) (45) (755) (1,093) Currency translation adjustments (531) 476 (6) (61) as of August 31, 2020 29,317 1,109 9,030 39,456 Net as of August 31, 2020 161,482 2,996 22,470 186,948
The following expenses related to the Group’s leasing activities are recognized in the income statement:
in thousands of CHF 2020/21 2019/20 Expense relating to short-term leases 5,867 5,775 Expense relating to leases of low-value assets 1,305 796 Expense relating to variable lease payments not included in the measurement of lease liabilities 671 229 Lease-related expenses 7,843 6,800 Depreciation of right-of-use assets 44,030 40,610 Interests on lease liabilities 5,311 4,796 Total amount recognized in the income statement 57,184 52,206
In fiscal year 2020/21, the Group’s total cash outflow for lease payments was CHF 53.1 million, including interest paid (2019/20: CHF 43.0 million).
Letter to Shareholders Overview Business Highlights Sustainability Our People Financial Reports Governance
Notes to the Consolidated Financial Statements
Barry Callebaut | Annual Report /
Accounting policies
Definition of a lease At inception of a contract, the Group assesses whether a contract is, or contains, a lease. A contract is, or contains, a lease if the contract conveys a right to control the use of an identified asset for a period of time in exchange for consideration.
Recognition and measurement of a lease
The Group recognizes a right-of-use asset and a lease liability at the lease commencement date.
The lease liability is initially measured at the present value of the future lease payments that are not paid at the commencement date, discounted using the incremental borrowing rate defined on a Group level, specific to the currency of the lease contract. Lease payments included in the initial measurement of the lease liability include for example fixed payments and variable payments that depend on an index or rate, which are initially measured using the index or rate at the commencement date.
The lease liability is subsequently measured at amortized cost using the effective interest method, decreased by lease payments made. The lease liability is remeasured in case of changes in future lease payments (i.e. index-based rents) or any changes in the assessments of extension or termination options. For such remeasurements, a corresponding adjustment generally is made to the right-of-use asset.
The right-of-use asset is initially measured at cost, which comprises the initial amount of the lease liability, plus any initial direct costs incurred, an estimate of costs for restoration obligations, payments made at or before the commencement date and less any lease incentives received. The right-of-use asset is subsequently depreciated using the straight-line method from the commencement date to the earlier of the end of the lease term or the end of the useful life of the underlying asset (determined on the same basis as those of property, plant and equipment). In addition, the right-of-use asset is periodically reduced by impairment losses, if any, and adjusted for certain remeasurements of the lease liability.
The Group applies judgment to determine the lease terms for lease contracts that include renewal or termination options. The assessment of whether the Group is reasonably certain to exercise such options impacts the lease term which significantly affects the amount of right-of-use assets and lease liabilities recognized in the balance sheet.
Short-term leases and leases of low-value assets
The Group has elected not to recognize right-of-use assets and lease liabilities for short-term leases that have a lease term of twelve months or less and do not contain a purchase option, and leases of low-value assets. The Group recognizes the lease payments associated with these leases as an expense on a straight-line basis over the lease term.
Letter to Shareholders Overview Business Highlights Sustainability Our People Financial Reports Governance
Notes to the Consolidated Financial Statements
Barry Callebaut | Annual Report /
. Intangible assets
2020/21
Goodwill
Brand names and licenses
Internally generated
intangible assets
Other / Under development
Total
in thousands of CHF At cost
as of September 1, 2020 822,779 61,957 502,491 44,764 1,431,991 Additions – – 23,624 24,438 48,062 Disposals – – (14,589) (1,214) (15,803) Currency translation adjustments 6,808 266 3,980 625 11,679 Reclassifications from under development – – 19,653 (19,653) – Other reclassifications¹ – – 675 (1,221) (546) as of August 31, 2021 829,587 62,223 535,834 47,739 1,475,383 Accumulated amortization and impairment losses
as of September 1, 2020 – 52,506 360,912 32,889 446,307 Amortization – 1,842 37,567 4,805 44,214 Impairment (Note 1.3) – 174 1,045 168 1,387 Disposals – – (14,565) (1,205) (15,770) Currency translation adjustments – 193 3,215 354 3,762 Other reclassifications¹ – – 283 (283) – as of August 31, 2021 – 54,715 388,457 36,728 479,900 Net as of August 31, 2021 829,587 7,508 147,377 11,011 995,483
1 Reclassified to “Property, plant and equipment” (net CHF 0.5 million).
2019/20
Goodwill
Brand names and licenses
Internally generated
intangible assets
Other / Under development
Total
in thousands of CHF At cost
as of September 1, 2019 859,630 71,821 470,197 58,931 1,460,579 Business combination (Note 5.1) 60 – – – 60 Additions – 333 22,226 24,905 47,464 Disposals – (9,964) (9,793) (1,804) (21,561) Currency translation adjustments (36,911) (1,043) (13,462) (3,246) (54,662) Reclassifications from under development – 8 32,300 (32,308) – Other reclassifications¹ – 802 1,023 (1,714) 111 as of August 31, 2020 822,779 61,957 502,491 44,764 1,431,991 Accumulated amortization and impairment losses
as of September 1, 2019 – 57,745 344,055 32,448 434,248 Amortization – 4,461 35,587 4,780 44,828 Impairment (Note 1.3) – – 1,505 139 1,644 Disposals – (9,964) (9,880) (1,406) (21,250) Currency translation adjustments – (538) (10,691) (1,954) (13,183) Other reclassifications¹ – 802 336 (1,118) 20 as of August 31, 2020 – 52,506 360,912 32,889 446,307 Net as of August 31, 2020 822,779 9,451 141,579 11,875 985,684
1 Reclassified from “Property, plant and equipment” (net CHF 0.1 million).
Letter to Shareholders Overview Business Highlights Sustainability Our People Financial Reports Governance
Notes to the Consolidated Financial Statements
Barry Callebaut | Annual Report /
Additions and reclassification from under development to internally generated intangible assets amounted to CHF 43.3 million in fiscal year 2020/21 (2019/20: CHF 54.5 million). This mainly included costs related to various projects of internally generated software and amounted to CHF 38.5 million (2019/20: CHF 51.6 million). The remainder is related to the development of recipes and innovations of CHF 4.7 million that were recorded under internally generated intangible assets (2019/20: CHF 2.9 million). Additions to other intangible assets mainly included projects under development.
The remaining amortization period for brand names varies between one and ten years, for licenses up to ten years, for software between one and eight years and for other including patents between one and twelve years.
Impairment testing for cash-generating units containing goodwill The carrying amount of goodwill for the Group amounts to CHF 829.6 million (2019/20: CHF 822.8 million). The allocation to the segments is as follows:
as of August 31, 2021 2020 in million CHF Global Cocoa 441.2 437.3 EMEA 303.1 301.4 Americas 80.7 79.4 Asia Pacific 4.6 4.7 Total 829.6 822.8
Goodwill acquired in a business combination is allocated to the respective segment that is expected to benefit from the synergies of the business combination, at acquisition date. Due to the Group’s fully integrated business in the Regions, the segments represent the lowest level within the entity at which the goodwill is monitored for internal management purposes. Thus, the impairment test is performed on a segment level.
For the impairment test, the recoverable amount of a cash-generating unit is based on its value-in-use and is compared to the carrying amount of the corresponding cash-generating unit. Future cash flows are discounted using a pre-tax rate that reflects current market assessments based on the weighted average cost of capital (WACC).
The Group performs its impairment test during the fourth quarter of the fiscal year. This approach was chosen because the Mid-Term Plan, covering the next five fiscal years, is updated annually in the third quarter. The Mid-Term Plan is based on the assumption that there are no major changes to the Group’s organization. The residual value is calculated from an estimated continuing value, which is primarily based on the fifth year of the Mid-Term Plan. The terminal growth rate used for determining the residual value does not exceed the expected long-term growth rate of the industry.
The annual impairment tests did not result in a need to recognize impairment losses in fiscal year 2020/21.
Letter to Shareholders Overview Business Highlights Sustainability Our People Financial Reports Governance
Notes to the Consolidated Financial Statements
Barry Callebaut | Annual Report /
The key sensitivities in the impairment test are the WACC as well as the terminal growth rate. Key assumptions used for value-in-use calculations
The Group has carried out a sensitivity analysis, containing various scenarios. Taking reasonable possible changes in key assumptions into account, no impairment losses have been revealed.
Accounting policies
Goodwill Goodwill on acquisitions is the excess of acquisition date fair value of the total consideration transferred plus the recognized amount of any non-controlling interest in the acquiree and the acquisition date fair value of assets acquired, liabilities and contingent liabilities assumed. Following the initial recognition, goodwill is measured at cost less any accumulated impairment losses. Goodwill is reviewed for impairment annually on the same date or more frequently if events or changes in circumstances indicate that the carrying value may be impaired. Negative goodwill is recognized directly in the Consolidated Income Statement.
At the acquisition date, any acquired goodwill is allocated to each of the cash-generating units (CGUs). The Group defines its CGUs for goodwill impairment testing based on the way that it monitors and derives economic benefits from the acquired goodwill. The impairment tests are performed by comparing the carrying value of the assets of these CGUs with their recoverable amount, based on their value in use, which corresponds to their future projected cash flows discounted at an appropriate pre-tax rate of return. The cash flows correspond to estimates made by Group Management in financial plans and business strategies covering a period of five years after making adjustments to consider the assets in their current condition. They are then projected to perpetuity using a multiple which corresponds to a steady growth rate. The Group assesses the uncertainty of these estimates by making sensitivity analyses. Where the recoverable amount of the CGUs is less than the carrying amount, an impairment loss is recognized.
Research and development costs
Research costs are expensed as incurred.
Development costs for projects related to recipes and product innovations are capitalized as an intangible asset if it can be demonstrated that the project is expected to generate future economic benefits, if it is probable that those future economic benefits will flow to the entity and the costs of the asset can be measured reliably. Development costs previously recognized as an expense are not recognized as an asset in a subsequent period. Development costs that have been capitalized are amortized on a straight-line basis over the period of their expected useful life. The amortization periods adopted do not exceed five years.
Letter to Shareholders Overview Business Highlights Sustainability Our People Financial Reports Governance
Notes to the Consolidated Financial Statements
Barry Callebaut | Annual Report /
Brand names, licenses and other intangible assets
Other acquired intangible assets include brand names, licenses, customer relationships, patents and trademarks, software and projects to improve the processes. Patents and licenses are amortized over their period of validity. All other intangible assets are amortized on a straight-line basis over their anticipated useful life not exceeding ten years. The amortization charge is included in the positions “General and administration expenses” and “Cost of goods sold” in the Consolidated Income Statement.
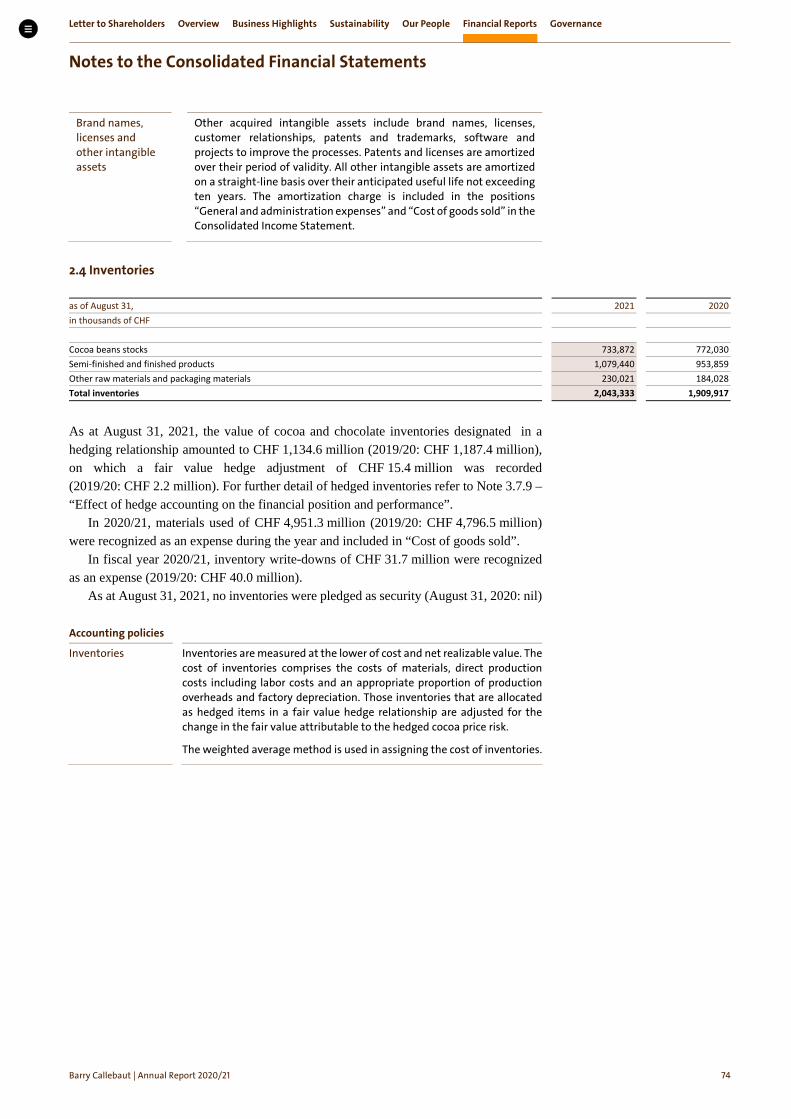
2.4 Inventories
as of August 31, 2021 2020 in thousands of CHF Cocoa beans stocks 733,872 772,030 Semi-finished and finished products 1,079,440 953,859 Other raw materials and packaging materials 230,021 184,028 Total inventories 2,043,333 1,909,917
As at August 31, 2021, the value of cocoa and chocolate inventories designated in a hedging relationship amounted to CHF 1,134.6 million (2019/20: CHF 1,187.4 million), on which a fair value hedge adjustment of CHF 15.4 million was recorded (2019/20: CHF 2.2 million). For further detail of hedged inventories refer to Note 3.7.9 – “Effect of hedge accounting on the financial position and performance”.
In 2020/21, materials used of CHF 4,951.3 million (2019/20: CHF 4,796.5 million) were recognized as an expense during the year and included in “Cost of goods sold”.
In fiscal year 2020/21, inventory write-downs of CHF 31.7 million were recognized as an expense (2019/20: CHF 40.0 million).
As at August 31, 2021, no inventories were pledged as security (August 31, 2020: nil)
Accounting policies
Inventories Inventories are measured at the lower of cost and net realizable value. The cost of inventories comprises the costs of materials, direct production costs including labor costs and an appropriate proportion of production overheads and factory depreciation. Those inventories that are allocated as hedged items in a fair value hedge relationship are adjusted for the change in the fair value attributable to the hedged cocoa price risk.
The weighted average method is used in assigning the cost of inventories.
Letter to Shareholders Overview Business Highlights Sustainability Our People Financial Reports Governance
Notes to the Consolidated Financial Statements
Barry Callebaut | Annual Report /
. Trade receivables and other current assets
as of August 31, 2021 2020 in thousands of CHF Trade receivables 484,974 387,404 Accrued income 32,362 22,643 Loans and other receivables 38,446 12,257 Other current financial assets 20,278 16,655 Receivables representing financial assets 576,060 438,959 Prepayments 57,791 57,655 Other current non-financial assets 707 1,802 Other tax receivables and receivables from government 125,393 112,369 Other receivables 183,891 171,826 Total trade receivables and other current assets 759,951 610,785
The Group runs asset-backed securitization programs, whereby trade receivables are sold at their nominal value minus a discount in exchange for cash. The amount of the receivables sold net of discounts as at August 31, 2021, was CHF 360.5 million (2020: CHF 323.8 million). This amount was derecognized from the balance sheet. The amount is the combination of the gross value of the receivables sold of CHF 381.2 million (2020: CHF 340.9 million) and the discount applicable of CHF 20.7 million (2020: CHF 17.1 million).
Net amounts payable to these programs amounted to CHF 70.3 million as at August 31, 2021 (2020: CHF 85.8 million), consisting of the balance of receivables collected before the next rollover date of CHF 91.0 million (2020: CHF 102.9 million), less the discount on receivables sold of CHF 20.7 million (2020: CHF 17.1 million). These amounts are included in Note 2.6 – “Trade payables and other current liabilities” on a net basis.
The discount is retained by the programs to establish a dilution reserve, a yield reserve, and an insurance first loss reserve.
Trade receivables with the fair value of CHF 87.1 million (and CHF 87.2 million nominal amount) as at August 31, 2021 (2020: fair value CHF 75.9 million, nominal amount CHF 76.0 million), are held for realization through sale under the asset-backed securitization programs and are therefore classified as measured at fair value through profit or loss. All other trade receivables, accrued income, loans, other receivables and other current financial assets are measured at amortized cost.
Interest expense paid under the asset-backed securitization programs amounted to CHF 3.1 million (2019/20: CHF 4.2 million) and was reported under “Interest expense”.
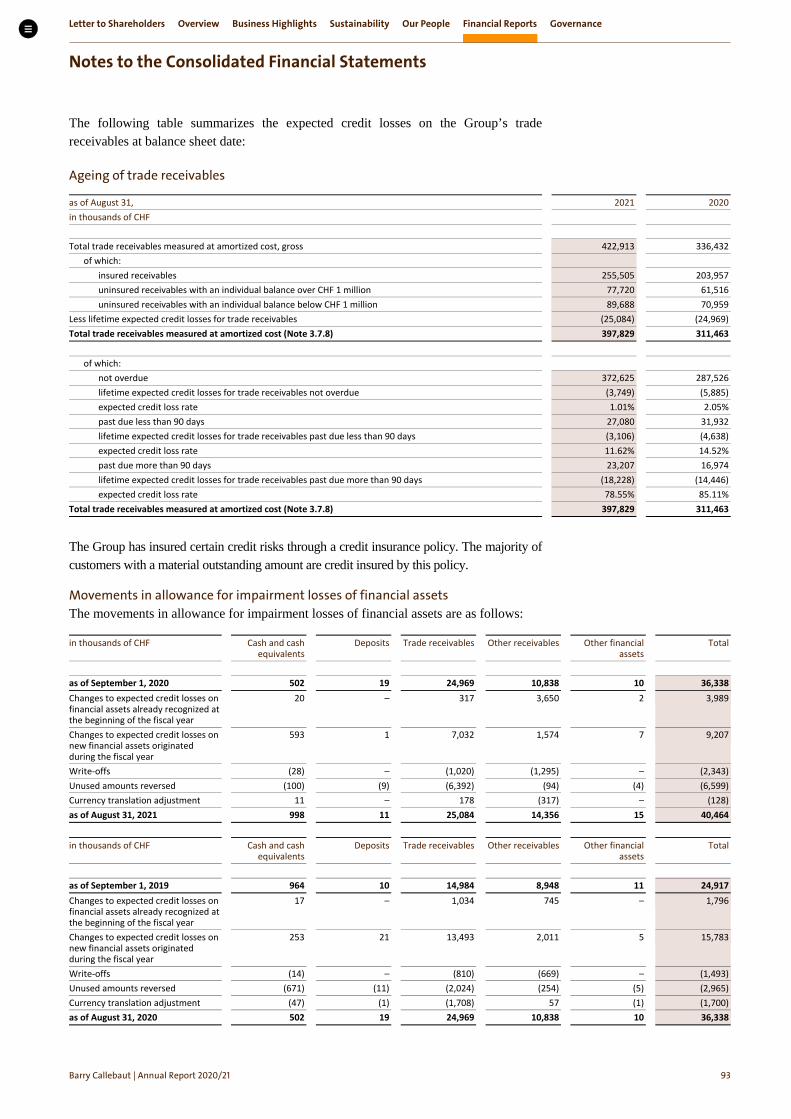
For detailed information about the expected credit losses calculated on the Group’s financial assets measured at amortized cost refer to Note 3.7.4 – “Credit risk and concentration of credit risk”.
Letter to Shareholders Overview Business Highlights Sustainability Our People Financial Reports Governance
Notes to the Consolidated Financial Statements
Barry Callebaut | Annual Report /
Accounting policies
Trade receivables Trade receivables, with the exception of those receivables that are managed under the asset-backed securitization programs, are stated at amortized cost, less lifetime expected credit losses.
The Group maintains asset-backed securitization programs for trade receivables, transferring the contractual rights to the cash flows of third-party trade receivables at their nominal value minus a discount. These receivables are derecognized from the balance sheet. The net amount reported under “Loans and other receivables” or “Other payables” is the amount of the discount minus the receivables already collected at the balance sheet date, but not yet remitted to the asset-purchasing company. Before being sold, the receivables that are managed under the asset-backed securitization programs are classified as financial assets measured at fair value through profit or loss.
Other financial assets
Other financial assets are the items reported in the lines “Loans and other receivables” and “Other current financial assets”. Other financial assets are classified as measured at amortized cost less expected impairment losses. The Group’s other financial assets have contractual cash flows that are solely principal, and the Group’s interest and business model is to hold these assets to collect contractual cash flows.
All purchases and sales of financial assets are recognized on the trade date. Financial assets are recognized when the Group becomes a party to the contractual provisions and are initially measured at fair value, which represents the transferred consideration, plus transaction costs.
Financial assets are derecognized when the Group loses control of the contractual rights to the cash flows of the assets. Such control is lost when the rights and benefits specified in the contract are realized, expired, or are surrendered.
Allowance for im-pairment losses of financial assets
At each reporting date, the Group recognizes an impairment allowance for financial assets measured at amortized cost.
The impairment allowance represents the Group’s estimates of lifetime expected credit losses, which are the present value of the cash shortfalls over the expected life of the financial assets.
Impairment losses are reflected in the allowance account of the respective financial asset class and recognized in the Consolidated Income Statement as follows:
Financial asset class Line item in Consolidated Income Statement Cash and cash equivalents Finance expense Deposits Other expense Trade receivables Revenue from sales and services Other receivables Other expense Other financial assets Other expense
Letter to Shareholders Overview Business Highlights Sustainability Our People Financial Reports Governance
Notes to the Consolidated Financial Statements
Barry Callebaut | Annual Report /
. Trade payables and other current liabilities
as of August 31, 2021 2020 in thousands of CHF Trade payables 891,208 652,379 Accrued expenses 134,408 102,681 Other payables 199,987 188,759 Payables representing financial liabilities 1,225,603 943,819 Accrued wages and social security 140,952 119,700 Other taxes and payables to government 64,008 51,951 Deferred income 2,907 4,173 Other liabilities 207,867 175,824 Total trade payables and other current liabilities 1,433,470 1,119,643
The Group has payables related to asset-backed securitization programs, see Note 2.5 – “Trade receivables and other current assets”. Other payables also consist of outstanding ledger balances with commodity brokers.
Accounting policies
Trade payables and other current financial liabilities
Trade payables and other current financial liabilities are initially recognized at fair value, net of transaction costs, when the Group becomes a party to the contractual provisions. They are subsequently carried at amortized cost using the effective interest rate method. A financial liability is derecognized when the obligation is discharged, cancelled, or expires.
Letter to Shareholders Overview Business Highlights Sustainability Our People Financial Reports Governance
Notes to the Consolidated Financial Statements
Barry Callebaut | Annual Report /
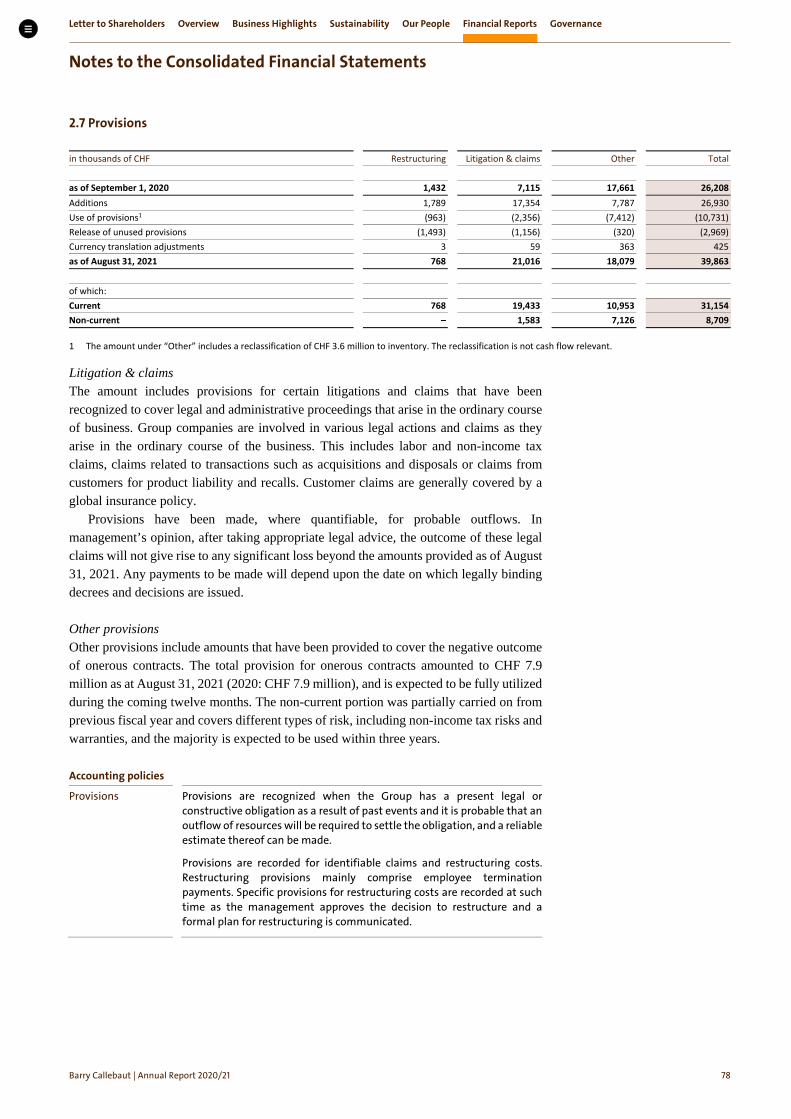
. Provisions
in thousands of CHF Restructuring Litigation & claims Other Total as of September 1, 2020 1,432 7,115 17,661 26,208 Additions 1,789 17,354 7,787 26,930 Use of provisions1 (963) (2,356) (7,412) (10,731) Release of unused provisions (1,493) (1,156) (320) (2,969) Currency translation adjustments 3 59 363 425 as of August 31, 2021 768 21,016 18,079 39,863 of which: Current 768 19,433 10,953 31,154 Non-current – 1,583 7,126 8,709
1 The amount under “Other” includes a reclassification of CHF 3.6 million to inventory. The reclassification is not cash flow relevant.
Litigation & claims The amount includes provisions for certain litigations and claims that have been recognized to cover legal and administrative proceedings that arise in the ordinary course of business. Group companies are involved in various legal actions and claims as they arise in the ordinary course of the business. This includes labor and non-income tax claims, claims related to transactions such as acquisitions and disposals or claims from customers for product liability and recalls. Customer claims are generally covered by a global insurance policy.
Provisions have been made, where quantifiable, for probable outflows. In management’s opinion, after taking appropriate legal advice, the outcome of these legal claims will not give rise to any significant loss beyond the amounts provided as of August 31, 2021. Any payments to be made will depend upon the date on which legally binding decrees and decisions are issued.
Other provisions Other provisions include amounts that have been provided to cover the negative outcome of onerous contracts. The total provision for onerous contracts amounted to CHF 7.9 million as at August 31, 2021 (2020: CHF 7.9 million), and is expected to be fully utilized during the coming twelve months. The non-current portion was partially carried on from previous fiscal year and covers different types of risk, including non-income tax risks and warranties, and the majority is expected to be used within three years. Accounting policies
Provisions Provisions are recognized when the Group has a present legal or constructive obligation as a result of past events and it is probable that an outflow of resources will be required to settle the obligation, and a reliable estimate thereof can be made.
Provisions are recorded for identifiable claims and restructuring costs. Restructuring provisions mainly comprise employee termination payments. Specific provisions for restructuring costs are recorded at such time as the management approves the decision to restructure and a formal plan for restructuring is communicated.
Letter to Shareholders Overview Business Highlights Sustainability Our People Financial Reports Governance
Notes to the Consolidated Financial Statements
Barry Callebaut | Annual Report /
Capital and Financial Risk Management
. Capital management The Group continues to apply its policy to maintain a sound capital base to support the continued development of the business. The Board of Directors seeks to maintain a prudent balance between debt and equity. In compliance with bank covenants, there is also a minimum tangible net worth value (equity – intangible assets) set at CHF 750 million.
The target payout ratio to shareholders is set in a range of 35% to 40% of the net profit in the form of a dividend. The target payout ratio and the form of the payout recommended by the Board is reviewed on an annual basis and is subject to the decision at the Annual General Meeting of Shareholders.
The Group’s subsidiaries have complied with applicable local statutory capital requirements.
. Equity
Share
as of August 31, 2021 2020 in thousands of CHF Share capital is represented by 5,488,858 (2020: 5,488,858) authorized and issued shares of each CHF 0.02 fully paid in (2020: 0.02)
110
110
Share capital and dividends The issued share capital is divided into 5,488,858 registered shares with a nominal value of CHF 0.02 (2020: CHF 0.02). All of the issued shares are fully paid and validly issued and are not subject to calls for additional payments of any kind. The Company has one class of shares, which carries no right to a fixed dividend.
By resolution of the Annual General Meeting on December 9, 2020, the shareholders approved the proposed distribution of dividends in the amount of CHF 22.00 per share, effected through a dividend payment of CHF 120.7 million. The payment was made to shareholders on January 7, 2021.
During the fiscal year 2019/20, the payout of CHF 26.00 per share was effected through a dividend payment out of retained earnings in the amount of CHF 142.7 million. The payment was made to shareholders on January 8, 2020.
Treasury shares Treasury shares are valued at weighted average cost and have been deducted from equity. The book value of the treasury shares as at August 31, 2021, amounted to CHF 15.6 million (2020: CHF 23.3 million).
The fair value of the treasury shares as at August 31, 2021, amounted to CHF 18.4 million (2020: CHF 25.7 million). As at August 31, 2021, the number of outstanding shares amounted to 5,480,985 (2020: 5,476,021) and the number of treasury shares to 7,873 (2020: 12,837). During this fiscal year, 9,138 shares have been purchased, 14,102 transferred to employees and members of the Board of Directors under the employee stock ownership program (2019/20: 14,840 purchased; 13,301 transferred).
Letter to Shareholders Overview Business Highlights Sustainability Our People Financial Reports Governance
Notes to the Consolidated Financial Statements
Barry Callebaut | Annual Report /
Retained earnings As at August 31, 2021, retained earnings contain legal reserves of CHF 15.6 million (2020: CHF 23.3 million), which are not distributable to the shareholders pursuant to Swiss law.
Hedging reserves Hedging reserves comprise the effective portion of the cumulative net change in the fair value of cash flow hedging instruments related to hedged transactions that are expected to occur. For further detail about the hedge reserves, refer to Note 3.7.9 – “Effect of hedge accounting on the financial position and performance”.
Cumulative translation adjustment (CTA) Cumulative translation adjustments comprise all foreign currency differences arising from the translation of the financial statements of foreign operations. Movements in non-controlling interests
in thousands of CHF 2020/21 2019/20 as of September 1, 1,770 14,320 Non-controlling share of profit/(loss) 566 (4,560) Change in non-controlling interests – (7,676) Non-controlling share of other comprehensive income 24 (314) as of August 31, 2,360 1,770
The non-controlling interests are not material for the Group.
Accounting policies
Transactions with non-controlling interests
The Group applies the policy of treating transactions with non-controlling interests equal to transactions with equity owners of the Group. For purchases from non-controlling interests, the difference between consideration paid and the relevant share acquired of the carrying value of net assets of the subsidiary is recorded in equity. Gains or losses on disposal to non-controlling interests are also recorded in equity.
Letter to Shareholders Overview Business Highlights Sustainability Our People Financial Reports Governance
Notes to the Consolidated Financial Statements
Barry Callebaut | Annual Report /
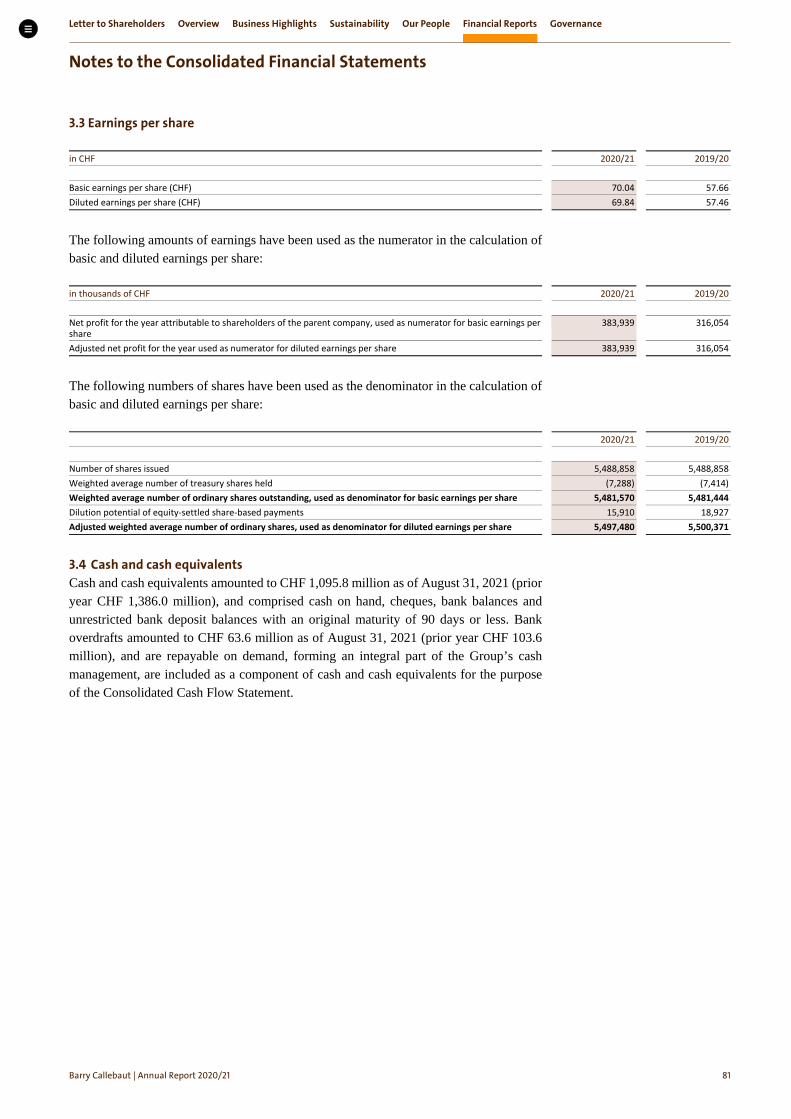
. Earnings per share
in CHF 2020/21 2019/20 Basic earnings per share (CHF) 70.04 57.66 Diluted earnings per share (CHF) 69.84 57.46
The following amounts of earnings have been used as the numerator in the calculation of basic and diluted earnings per share:
in thousands of CHF 2020/21 2019/20 Net profit for the year attributable to shareholders of the parent company, used as numerator for basic earnings per share
383,939
316,054
Adjusted net profit for the year used as numerator for diluted earnings per share 383,939 316,054
The following numbers of shares have been used as the denominator in the calculation of basic and diluted earnings per share:
2020/21 2019/20 Number of shares issued 5,488,858 5,488,858 Weighted average number of treasury shares held (7,288) (7,414) Weighted average number of ordinary shares outstanding, used as denominator for basic earnings per share 5,481,570 5,481,444 Dilution potential of equity-settled share-based payments 15,910 18,927 Adjusted weighted average number of ordinary shares, used as denominator for diluted earnings per share 5,497,480 5,500,371
. Cash and cash equivalents Cash and cash equivalents amounted to CHF 1,095.8 million as of August 31, 2021 (prior year CHF 1,386.0 million), and comprised cash on hand, cheques, bank balances and unrestricted bank deposit balances with an original maturity of 90 days or less. Bank overdrafts amounted to CHF 63.6 million as of August 31, 2021 (prior year CHF 103.6 million), and are repayable on demand, forming an integral part of the Group’s cash management, are included as a component of cash and cash equivalents for the purpose of the Consolidated Cash Flow Statement.
Letter to Shareholders Overview Business Highlights Sustainability Our People Financial Reports Governance
Notes to the Consolidated Financial Statements
Barry Callebaut | Annual Report /
. Financial liabilities
3.5.1 Bank overdrafts and short-term debt as of August 31, 2021 2020 in thousands of CHF Carrying amounts Bank overdrafts 63,564 103,603 Commercial paper – 400,796 Short-term debt 54,318 60,083 Short-term portion of long-term debt (Note 3.5.2) 65,095 482 Other 14 14 Short-term debt 119,427 461,375 Short-term lease liabilities 41,075 36,543 Short-term financial liabilities 224,066 601,521
Short-term financial liabilities are mainly denominated in EUR and XOF as shown in the table below:
as of August 31, 2021 2020 Split per currency Amount Interest range Amount Interest range in thousands of CHF from to from to EUR 82,807 (0.55%) 2.00% 415,697 (0.46%) 0.74% XOF 60,876 3.90% 5.80% 104,158 4.25% 5.80% USD 26,734 1.03% 3.00% 24,741 1.03% 3.00% TRL 11,767 12.52% 21.80% 2,663 6.50% 17.29% BRL 11,743 3.16% 10.14% 26,890 3.75% 9.01% CLP 8,828 1.44% 2.51% 9,759 1.20% 4.14% INR 5,222 6.46% 9.17% 4,364 6.84% 8.50% Other 16,090 0.22% 9.30% 13,249 (0.79%) 9.30% Total 224,067 601,521
3.5.2 Long-term debt
as of August 31, 2021 2020 2021 2020 in thousands of CHF Carrying amounts Fair values Senior Notes 847,577 837,225 911,853 910,472 Schuldscheindarlehen 1,081,756 1,103,551 1,025,810 1,103,551 Less current portion (Note 3.5.1) (65,095) (482) (65,095) (482) Other Loans 65,816 66,034 65,817 66,034 Total long-term debt 1,930,054 2,006,328 1,938,385 2,079,575 Long-term lease liabilities 224,464 150,325 224,464 150,325 Long-term financial liabilities 2,154,518 2,156,653 2,162,849 2,229,900
On June 20, 2013, the Group issued a 5.5% Senior Note with maturity in 2023 for an amount of USD 400 million (CHF 364 million). The Senior Note was issued at a price of 98.122% and includes a coupon step-up clause of 0.25% (limited to 1.00% per annum) per downgraded notch per rating agency. The coupon currently amounts to 5.5% (2019/20: 5.5%).
On May 24, 2016, the Group issued a 2.375% Senior Note with maturity in 2024 for an amount of EUR 450 million (CHF 484 million). The Senior Note was issued at a price of 99.104%. The coupon amounts to 2.375%.
On October 3, 2019, the Group extended the maturity of its EUR 750 million Revolving Credit Facility to June 2024. On March 24, 2020, the Group amended its
Letter to Shareholders Overview Business Highlights Sustainability Our People Financial Reports Governance
Notes to the Consolidated Financial Statements
Barry Callebaut | Annual Report /
EUR 750 million Revolving Credit Facility into a EUR 1,000 million Revolving Credit Facility with maturity in 2024. This Facility was not used in the fiscal year 2020/21.
There are financial covenants related to the Revolving Credit Facility which comprise of profitability per tonne, interest cover ratio and tangible net worth value.
On February 13, 2019, the Group issued a EUR 467 million (CHF 502 million) and CHF 152 million Schuldscheindarlehen. An amount of EUR 191 million with maturity in 2026, an amount of EUR 254 million with maturity in 2027 and an amount of EUR 22 million with maturity in 2029 which were raised in euros. An amount of CHF 11 million with maturity in 2026, an amount of CHF 131 million with maturity in 2027 and an amount of CHF 10 million with maturity in 2029 which were raised in Swiss francs. The weighted average interest rate at issuance date is 1.47% p.a.1
On May 27, 2020, the Group issued a EUR 60 million (CHF 65 million) private placement with maturity in 2022.
On July 27, 2020, the Group issued a EUR 377 million (CHF 408 million) and CHF 20 million Schuldscheindarlehen. This results in an amount of EUR 128.5 million with maturity in 2025, an amount of EUR 65 million with maturity in 2027, an amount of EUR 126.5 million with maturity in 2028, and an amount of EUR 57 million with maturity in 2030 which were raised in euros. An amount of CHF 15 million with maturity in 2025, an amount of CHF 5 million with maturity 2027 which were raised in Swiss francs. The weighted average interest rate is 1.57% p.a.2
The USD 400 million Senior Note, the EUR 450 million Senior Note, the EUR 1,000 million Revolving Credit Facility, the EUR 467 million and CHF 152 million Schuldscheindarlehen, the EUR 60 million private placement, the EUR 377 million and CHF 20 million Schuldscheindarlehen all rank pari passu. The Senior Notes, the Revolving Credit Facility, the private placement as well as the two Schuldscheindarlehen issuances are guaranteed by Barry Callebaut AG.
Given lower working capital requirements and the available cash balance, the Group further reduced its debt portfolio in July 2021 by prepaying part of the floating-rated Schuldscheindarlehen issued in July 2020 for an amount of CHF 27.0 million, and decided not to roll forward commercial paper hedged with fixed-to-floating interest rate derivatives for an amount of CHF 135.2 million.
as of August 31, 2021 2020 in thousands of CHF 2021/22 – 93,305 2022/23 398,248 379,311 2023/24 508,085 496,257 2024/25 175,009 183,974 2025/26 (and thereafter for 2020) 237,120 1,003,806 2026/27 (and thereafter for 2021) 836,056 – Long-term financial liabilities 2,154,518 2,156,653
1 The floating-rate tranches, which represent 56% of the total transaction amount, have a 6-month-IBOR base rate floored at 0%.
2 The floating-rate tranches, which represent 31% of the total transaction amount, have a 6-month-IBOR base rate floored at 0%.
Letter to Shareholders Overview Business Highlights Sustainability Our People Financial Reports Governance
Notes to the Consolidated Financial Statements
Barry Callebaut | Annual Report /
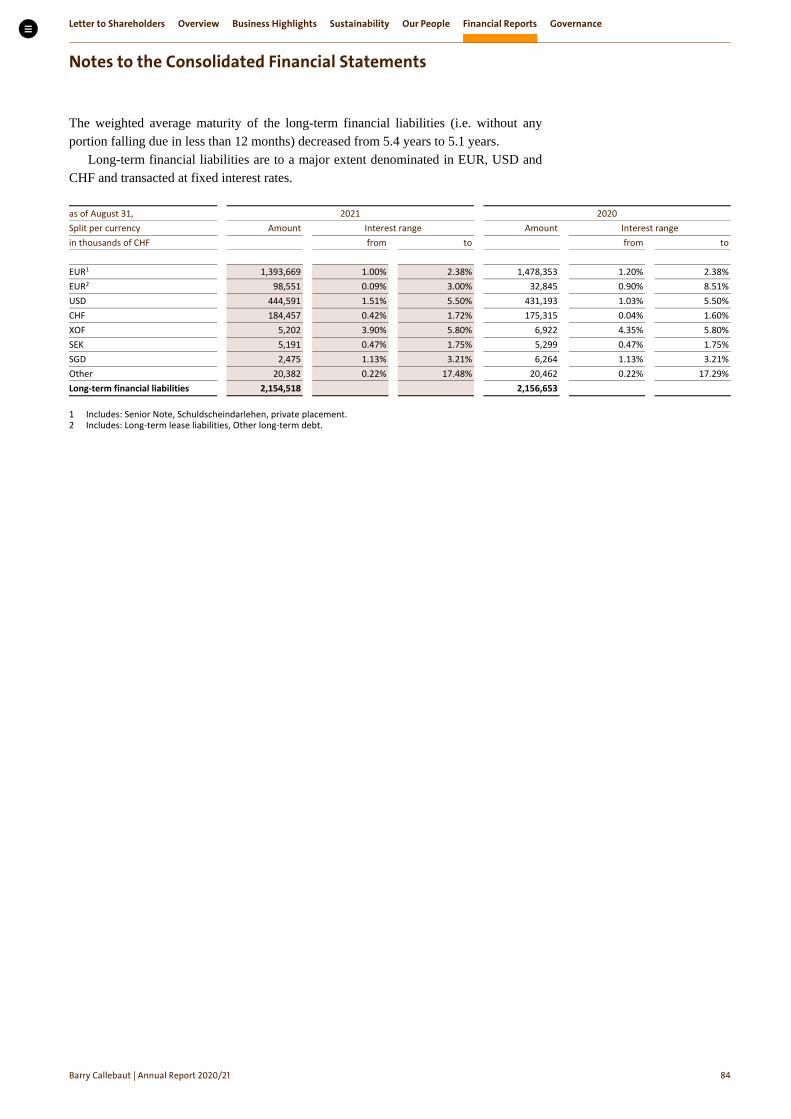
The weighted average maturity of the long-term financial liabilities (i.e. without any portion falling due in less than 12 months) decreased from 5.4 years to 5.1 years.
Long-term financial liabilities are to a major extent denominated in EUR, USD and CHF and transacted at fixed interest rates.
as of August 31, 2021 2020 Split per currency Amount Interest range Amount Interest range in thousands of CHF from to from to EUR1 1,393,669 1.00% 2.38% 1,478,353 1.20% 2.38% EUR2 98,551 0.09% 3.00% 32,845 0.90% 8.51% USD 444,591 1.51% 5.50% 431,193 1.03% 5.50% CHF 184,457 0.42% 1.72% 175,315 0.04% 1.60% XOF 5,202 3.90% 5.80% 6,922 4.35% 5.80% SEK 5,191 0.47% 1.75% 5,299 0.47% 1.75% SGD 2,475 1.13% 3.21% 6,264 1.13% 3.21% Other 20,382 0.22% 17.48% 20,462 0.22% 17.29% Long-term financial liabilities 2,154,518 2,156,653
Letter to Shareholders Overview Business Highlights Sustainability Our People Financial Reports Governance
Notes to the Consolidated Financial Statements
Barry Callebaut | Annual Report /
3.5.3 Changes in liabilities and equity from financing activities
Short-term debt
Long-term debt
Lease liabilities
Retained earnings
Share capital
Treasury shares
Non-controlling
interests
Total
in thousands of CHF Financial liabilities Equity as of September 1, 2019 196,400 1,533,818 206,348 3,083,698 110 (19,506) 14,320 5,015,188 Cash flows from financing activities 281,627 517,714 (38,164) (142,710) – (27,332) – 591,135 Proceeds from the issue of short-term debt 423,348 – – – – – – 423,348 Repayment of short-term debt (141,721) – – – – – – (141,721) Proceeds from the issue of long-term debt – 1,593,050 – – – – – 1,593,050 Repayment of long-term debt – (1,075,336) – – – – – (1,075,336) Payment of lease liabilities – – (38,164) – – – – (38,164) Dividend payment – – – (142,710) – – – (142,710) Purchase of treasury shares – – – – – (27,332) – (27,332) Dividends paid to non-controlling interests – – – – – – – – Other changes related to liabilities (16,653) (45,205) 18,684 – – – – (43,174) Amortized structuring fee – 2,538 – – – – – 2,538 Change in accrued finance expense other – 918 – – – – – 918 New leases and modifications – – 28,767 – – – – 28,767 Interest expense 70,652 – 4,796 – – – – 75,448 Interest paid (70,103) – (4,796) – – – – (74,899) Foreign exchange movements (17,691) (48,172) (10,083) – – – – (75,946) Reclassification 489 (489) – – – – – – Other changes related to equity – – – 335,055 – 23,533 (12,550) 346,038 as of August 31, 2020 461,374 2,006,327 186,868 3,276,043 110 (23,305) 1,770 5,909,187 as of September 1, 2020 461,374 2,006,327 186,868 3,276,043 110 (23,305) 1,770 5,909,187 Cash flows from financing activities (411,626) (28,296) (39,943) (120,715) – (18,400) – (618,980) Proceeds from the issue of short-term debt 32,184 – – – – – – 32,184 Repayment of short-term debt (443,810) – – – – – – (443,810) Proceeds from the issue of long-term debt – 137 – – – – – 137 Repayment of long-term debt – (28,433) – – – – – (28,433) Payment of lease liabilities – – (39,943) – – – – (39,943) Dividend payment – – – (120,715) – – – (120,715) Purchase of treasury shares – – – – – (18,400) – (18,400) Other changes related to liabilities 69,679 (47,977) 118,614 – – – – 140,316 Amortized structuring fee – 2,958 – – – – – 2,958 Change in accrued finance expense other – 515 – – – – – 515 New leases and modifications – – 115,527 – – – – 115,527 Interest expense 68,541 – 5,311 – – – – 73,852 Interest paid (68,873) – (5,311) – – – – (74,184) Foreign exchange movements 4,855 13,706 3,087 – – – – 21,648 Reclassification 65,156 (65,156) – – – – – – Other changes related to equity – – – 382,830 – 26,111 590 409,531 as of August 31, 2021 119,427 1,930,054 265,539 3,538,158 110 (15,594) 2,360 5,840,054
Letter to Shareholders Overview Business Highlights Sustainability Our People Financial Reports Governance
Notes to the Consolidated Financial Statements
Barry Callebaut | Annual Report /
Accounting policies Financial liabilities Financial liabilities are initially recognized at fair value, net of transaction
costs, when the Group becomes a party to the contractual provisions. They are subsequently carried at amortized cost using the effective interest rate method.
A financial liability is derecognized when the obligation is discharged, cancelled, or expires.
Lease liabilities The Group recognizes a right-of-use asset and a lease liability at the lease commencement date.
The lease liability is initially measured at the present value of the future lease payments that are not paid at the commencement date, discounted using the incremental borrowing rate defined on a Group level, specific to the currency of the lease contract. Lease payments included in the initial measurement of the lease liability include for example fixed payments and variable payments that depend on an index or rate, which are initially measured using the index or rate at the commencement date.
The lease liability is subsequently measured at amortized cost using the effective interest method, decreased by lease payments made. The lease liability is remeasured in case of changes in future lease payments (i.e. index-based rents) or any changes in the assessments of extension or termination options. For such remeasurements, a corresponding adjustment generally is made to the right-of-use asset.
The Group applies judgment to determine the lease terms for lease contracts that include renewal or termination options. The assessment of whether the Group is reasonably certain to exercise such options impacts the lease term which significantly affects the amount of lease liabilities and assets recognized in the balance sheet.
Short-term leases and leases of low-value assets
The Group has elected not to recognize right-of-use assets and lease liabilities for short-term leases that have a lease term of twelve months or less and do not contain a purchase option, and leases with asset’s fair value, when newly purchased, is lower than CHF 5,000. The Group recognizes the lease payments associated with these leases as an expense on a straight-line basis over the lease term.
. Capital and lease commitments and guarantees
Capital and lease commitments
as of August 31, 2021 2020 in thousands of CHF Property, plant and equipment 5,254 4,225 Intangible assets 128 101 Leased assets 14,357 – Total capital commitments 19,739 4,326
Leased assets commitments are mainly related to buildings.
Guarantees in favor of third parties Group companies have issued guarantee commitments for the fiscal year 2020/21 in the amount of CHF 0.6 million (2019/20: CHF 1.3 million). These are mainly related to third-party suppliers.
Letter to Shareholders Overview Business Highlights Sustainability Our People Financial Reports Governance
Notes to the Consolidated Financial Statements
Barry Callebaut | Annual Report /
. Financial risk management The nature of its business exposes the Group to a variety of financial risks including the effects of changes in market prices (commodity prices, foreign exchange rates, and interest rates) as well as credit risks and liquidity risks.
The Group’s overall strategy for managing these risks is consistent with the Group’s objectives to maintain cost leadership, reduce earnings volatility in a cost-effective manner and minimize potential adverse effects of such market exposures on the financial performance of the Group. The Group’s sourcing centers and Treasury department continuously monitor and hedge the exposures to commodity price risk, foreign currency and interest rate risk. The Group Commodity Risk Committee (GCRC) and Finance Committee regularly reviews, and monitors, the adherence to policies and defined risk limits. The Group manages its business based on the following two business models: • Contract business: sales contracts for cocoa ingredients and industrial or gourmet
chocolate, where Barry Callebaut has entered into contracts with customers to deliver fixed quantities at fixed prices. These contractually fixed prices are generally based on the forward market prices of the raw material components valid at the contract date for the forward delivery date on which the cocoa ingredients or chocolate is planned to be delivered to the customers.
• Price list business: Barry Callebaut sets price lists for certain Gourmet, Specialties & Decorations, and Beverage products. These price lists are normally updated at intervals of six to twelve months. Customers buy products based on the issued price lists without fixed commitments on quantities.
3.7.1 Commodity price risks a) Commodity risk management The manufacturing of the Group’s products requires raw materials such as cocoa beans, sugar and sweeteners, dairy, nuts, oils and fats. Therefore, the Group is exposed to commodity price risks.
The Group’s sourcing centers manage the commodity risk in compliance with the Group Commodity Risk Management (GCRM) Policy. The GCRC monitors the Group’s commodity risk management activities and acts as the decision-making body for the Group in this respect. The members of the GCRC include the Group’s Chief Financial Officer (CFO) who acts as Chairman of the Committee, the President of Global Cocoa, the VP Group Accounting, Reporting & Risk Management, the CFO Global Cocoa, the VP Global Cocoa Trading & Sourcing, the Head of Global Sourcing (for non-cocoa materials) and the VP Group Treasury & Tax.
The GCRC reports to the Group’s Audit, Finance, Risk, Quality & Compliance Committee (AFRQCC) and must inform the latter about key Group commodity risk issues and the key mitigation decisions taken. The AFRQCC reviews and approves GCRC requests and ensures that the commodity risk management strategy is consistent with the Group’s objectives. It also sets the Group’s Value at Risk (VaR) limit for the major raw material components. The AFRQCC makes recommendations to the Board of Directors and advises the Board of Directors on important risk matters and/or asks for approval. The Board of Directors is the highest approval authority for all GCRM matters and approves the GCRM Policy as well as the Group VaR limit.
The Group applies a 95% ten-day VaR limit to manage the consolidated exposure to commodity price risk. The VaR framework of the Group is based on the standard historical VaR methodology, taking 2,000 days (equivalent to seven years) of the most recent prices, based on which the day-to-day relative price changes are calculated. This simulation of past market conditions is not predicting the future movement in commodity prices, and therefore it does not represent actual losses. It only represents an indication of
Letter to Shareholders Overview Business Highlights Sustainability Our People Financial Reports Governance
Notes to the Consolidated Financial Statements
Barry Callebaut | Annual Report /
the future commodity price risks based on historical volatility. VaR is applied to materials with prices considered to exceed certain volatility levels (e.g. cocoa beans and cocoa products, dairy products, sugar and sweeteners, nuts, oils and fats). As at August 31, 2021, the Group had a total VaR for raw materials of CHF 9.3 million (2020: CHF 9.4 million), well within the Group limit. The average VaR over the fiscal year 2020/21 was CHF 8.0 million (2019/20: CHF 11.5 million). The VaR is used together with a calculation of the expected shortfall and worst cases as well as the use of stress test scenarios.
The GCRC allocates the Group VaR limit into VaR limits for cocoa and non-cocoa raw materials such as sugar, dairy, oils and fats. These two VaR limits are then allocated to limits in tonnes to the related risk reporting units for each of the two areas.
b) Cocoa price risk and the Group’s hedging strategy The Group’s purchasing and sourcing centers make sourcing and risk management decisions for cocoa beans, semi-finished cocoa products and ingredients including hedging commodity price risk exposures. Within the overall limits as defined by the AFRQCC, the Group’s purchasing and sourcing centers can also act as a broker-trader with the objective to generate profits from fluctuations in raw material prices or broker-trader margins.
The fair value of the Group’s open sales and purchase commitments and inventory are fluctuating in line with price movements in the respective commodity markets and are therefore hedged. It is the Group’s policy to hedge its cocoa price risk resulting from its inventory and purchase and sales contracts. The cocoa price risk component in cocoa inventories, purchase and sales contracts as well as chocolate inventories and sales contracts are hedged with exchange traded or over-the-counter cocoa bean derivatives applying fair value hedge accounting. The Group also applies cash flow hedge accounting whereby the cocoa price risk and foreign exchange risk from forecasted sales are hedged with cocoa bean futures and foreign exchange forward contracts.
In order to calculate the cocoa bean price risk exposure embedded in the various cocoa ingredients and chocolate inventories, purchase and sales contracts, the cocoa processing entities translate the various cocoa ingredient volumes of these positions into cocoa bean equivalents, using technical yields (to calculate how many cocoa beans are needed to produce those cocoa ingredient volumes). These technical ratios vary according to cocoa ingredient types and cocoa-processing units. The chocolate entities calculate the bean equivalent in their positions using the prevailing market/commercial ratios. The entities use this approach and these ratios to enter into the appropriate volume of hedging instruments in order to hedge the cocoa bean price risk component in their positions. The Group also uses the same hedging ratios in hedge accounting as described above.
The cocoa bean price risk component is contractually specified in the purchase and sales contracts of cocoa ingredients and chocolate products. Therefore, the cocoa bean price risk component is considered separately identifiable and reliably measurable in the Group’s hedged items (cocoa ingredients purchase contracts, cocoa inventories, chocolate inventories, cocoa ingredients sales contracts and chocolate sales contracts) as well as in its hedging instruments (cocoa bean futures and other contracts accounted for as derivatives).
c) Sugar price risk hedges The Group applies cash flow hedge accounting for hedging relationships when it hedges its commodity price risk and its foreign exchange risks attributable to its forecasted sugar purchases with sugar futures and with foreign exchange forward contracts, respectively. When the Group enters into agreements with sugar suppliers where the price of the
Letter to Shareholders Overview Business Highlights Sustainability Our People Financial Reports Governance
Notes to the Consolidated Financial Statements
Barry Callebaut | Annual Report /
forecasted sugar purchases will be indexed to the raw sugar world market price, it hedges these forecasted sugar purchases with sugar futures.
The raw sugar world market price risk component is a contractually specified element in the hedged items. Therefore, the raw sugar world market price risk component is considered separately identifiable and reliably measurable in the Group’s hedged items (forecasted sugar purchases) as well as in its hedging instruments (sugar futures).
d) Fuel price risk hedges The Group is exposed to fuel oil prices through fuel index commercial contracts with shipping and logistics companies. The Group enters into correlated derivative contracts to mitigate the fuel price volatility associated with the highly probable expense. The hedging relationship is accounted as cash flow hedges. The GCRC approves the duration of hedged exposure and applies counterparty limits to monitor the derivative instruments’ credit exposure.
3.7.2 Foreign currency risks The Group operates across the world and consequently is exposed to multiple currency risks, albeit primarily in CHF, EUR, USD, and GBP. The Group actively monitors its transactional currency exposures and consequently enters into foreign currency hedges with the aim of preserving the value of assets, commitments, and anticipated transactions. The related accounting treatment is explained in the section “Accounting policies”.
All risks relating to foreign currency exposures of assets and liabilities, certain unrecognized firm commitments and highly probable forecasted purchases and sales are centralized as far as possible within the Group’s Treasury department, where the hedging strategies are defined.
Accordingly, the consolidated foreign currency exposures are hedged in compliance with the Group’s Treasury Policy, mainly by means of forward currency contracts entered into with financial institutions of a high credit rating. The Group’s Treasury Policy imposes a dual risk control framework of both open position limits and near-time fair valuation of net currency exposures. Both levels of control are substantially interlinked, avoiding excessive net currency exposures and substantial volatility in the Consolidated Income Statement.
The Group’s Treasury department is supervised by the Group Finance Committee, which meets on a regular basis. The Group Finance Committee monitors the Group’s foreign currency risk position and acts as a decision-taking body for the Group in this respect. The Group Finance Committee consists of the Group’s CFO, the VP Group Financial Planning & Analysis, the VP Group Treasury & Tax, the VP Group Accounting, Reporting & Risk Management, and other Group Finance stakeholders.
The Group’s Treasury Policy, giving guidance on treasury risk management including foreign currency and interest rate risks, is approved by the AFRQCC. The Group’s Risk Management department reviews the consistency of the Group’s treasury management strategy with the Group’s Treasury Policy and reports the status to the Group’s CFO periodically. The AFRQCC is informed by the CFO about the status and important matters in their quarterly meetings and approves requests of the Group Finance Committee on important treasury risk matters including foreign currency risks for recommendation to the Board of Directors. The Board of Directors is the highest approval authority for all Group Treasury Risk Management matters.
The table below provides an overview of the net exposure of CHF, EUR, USD, and GBP against the main functional currencies in the Group. According to the Group’s Treasury Policy, foreign exchange exposures are hedged as from identification on an intraday basis in line with the approved exposure limits. In case of small deviations from
Letter to Shareholders Overview Business Highlights Sustainability Our People Financial Reports Governance
Notes to the Consolidated Financial Statements
Barry Callebaut | Annual Report /
the agreed foreign exchange exposure limits, approval has to be sought from the Group’s Treasury and Risk Management department. For significant deviations, approval from the AFRQCC is required. Companies with the same functional currency are shown in one group. The CFA in Côte d’Ivoire, XOF, and respectively Cameroon, XAF, both have fixed-rate regimes. At present, both are pegged, independently from each other, at 656 per euro. The Serbian dinar (RSD) is a managed floating exchange rate linked to the euro.
Net foreign currency exposures against major functional currencies
as of August 31, 2021 2020 Net exposure in thousands of CHF/EUR/USD/GBP
In order to quantify and manage the Group’s consolidated exposure to foreign currency risks, the historical VaR has been implemented. The VaR concept serves as the analytical instrument for assessing the Group’s foreign currency risk incurred under normal market conditions. The VaR indicates the loss which, within a time horizon of one day, will not be exceeded at a confidence level of 95% using seven years of historical market prices for each major currency pair. The VaR is used together with the calculation of the expected shortfall and worst cases as well as the use of stress test scenarios. The VaR is based on static exposures during the time horizon of the analysis. However, the simulation of past market conditions is not predicting the future movement in foreign currency rates. Therefore, it does not represent actual losses. It only represents an indication of future foreign currency risks. As of August 31, 2021, the Group had a VaR of CHF 0.4 million (2020: CHF 0.5 million). The average VaR over the fiscal year 2020/21 was CHF 0.2 million (2019/20: CHF 0.4 million).
Value at Risk per main exposure currencies
as of August 31, 2021 2020 Value at Risk on net exposures in thousands of CHF Total for the Group and per main exposure currencies
Letter to Shareholders Overview Business Highlights Sustainability Our People Financial Reports Governance
Notes to the Consolidated Financial Statements
Barry Callebaut | Annual Report /
3.7.3 Interest rate risks The Group is exposed to changes in interest rates through its short- and long-term debt obligations. The Group’s Treasury department manages and oversees the financing of the Group, and the related interest rate risks and, to the extent possible, provides the necessary liquidity in the required functional currency for the companies of the Group. Consequently, the Group’s debt obligations are adjusted with the real currency mix of the Group’s liabilities in order to reflect the correct exposure to interest rates.
It is the Group’s policy to manage its interest costs using an optimal mix of fixed and floating rate debt. This is achieved by entering into interest rate derivative instruments in which the Group exchanges at fixed and floating interest rates. To avoid volatility in the Consolidated Income Statement, cash flow hedge accounting is applied to those derivative instruments.
As described in the section “Foreign currency risks”, the Group’s Treasury department is supervised by the Group Finance Committee, which meets on a regular basis. The Group Finance Committee monitors the Group’s interest rate risk and acts as a decision-taking body for the Group in this respect.
The Group’s Treasury Policy also covers the management of interest rate risks. The VP Group Treasury & Tax reports the status periodically to the Group’s CFO, who informs the AFRQCC in their quarterly meetings. The AFRQCC approves requests from the Group Finance Committee on important treasury matters, including interest rate risks, and provides recommendations to the Board of Directors, which is the highest approval authority for all Group treasury matters.
The following schedule provides an overview of all interest-bearing items per year-end closing:
as of August 31, 2021 2020 in thousands of CHF Fixed interest-bearing items Carrying amount of financial liabilities 1,773,412 1,662,431 Reclassification due to interest rate derivative 340,106 494,202 Net fixed interest position 2,113,518 2,156,633 Floating interest-bearing items Carrying amount of financial assets (1,097,299) (1,392,227) Carrying amount of financial liabilities 605,172 1,095,742 Reclassification due to interest rate derivative (340,106) (494,202) Net floating interest position (832,233) (790,687)
Sensitivity analysis on interest rate risks The following table shows the impact of a parallel shift of interest rates by 100 basis points (bps) up and 10 bps down on the Group’s equity and Consolidated Income Statement, net of tax. The calculation is performed on both, the portion of the outstanding debt (excluding the asset-backed securitization programs; see Note 2.5 “Trade receivables and other current assets”) at floating interest rates and the outstanding derivatives exchanging floating into fixed interest rates at the respective year-end. This sensitivity analysis only indicates the potential impact for the respective fiscal year at the prevailing conditions in the financial markets. Consequently, it does not represent actual or future gains or losses, which are strictly managed and controlled, as stipulated by the Group’s Treasury Policy.
Letter to Shareholders Overview Business Highlights Sustainability Our People Financial Reports Governance
Notes to the Consolidated Financial Statements
Barry Callebaut | Annual Report /
as of August 31, 2021 2020 Impact on Income statement Equity Income statement Equity in thousands of CHF
3.7.4 Credit risk and concentration of credit risk Credit risk arising from customers, i.e. the risk of counterparties defaulting, is governed by the Groupʼs Credit Management Policy. This policy defines the Group’s credit management process such as the roles and responsibilities of the regional credit control organization, the initial customer account approval, setting and changing credit limits and payment terms, regular monitoring controls, collection effort process, credit insurance procedures, and credit allowances. System controls ensure a credit control assessment is conducted when accepting customers’ new orders and before goods are dispatched whenever a customer’s credit limit is exceeded due to outstanding or overdue open amounts.
The Group mitigates credit risk through the use of asset-backed securitization programs and factoring facilities (see Note 2.5 “Trade receivables and other current assets”).
The Group has also has a credit risk insurance program whereby the majority of its customers with outstanding amounts larger than EUR 70,000 are insured as far as possible.
The Group’s credit risk exposure also arises from derivative financial instruments, i.e. foreign exchange derivatives, interest rate derivatives, and commodity derivatives, which are entered into with financial institutions. The Group has foreign exchange and interest rate derivatives with financial institutions acting on an international scale and having sound credit ratings. In case of commodity derivatives, the Group enters into futures transactions deals in the New York and the London terminal markets through its brokers. The mark-to-market exposures in relation to these hedging contracts are regularly and substantially collateralized pursuant to margin agreements in place with such counterparties. Counterparty exposures towards such financial institutions are monitored through limit utilization on a regular basis by the Group’s Treasury department and reported to the Group Finance Committee and the AFRQCC.
As of August 31, 2021, the largest customer represents 8% (2020: 8%) whereas the ten biggest customers represent 30% (2020: 29%) of trade receivables. The Group does not have a material credit risk concentration as it maintains a large, geographically diverse customer base. The extent of the Group’s credit risk exposure is represented by the aggregate balance of amounts receivable, reduced by the effects of netting arrangements with counterparties. The maximum nominal credit risk exposure in the event all other parties fail to perform their obligation was CHF 1,968.2 million as of August 31, 2021 (2020: CHF 2,182.3 million).
All financial assets measured at amortized cost are first assessed for individual impairment. Subsequently, expected credit loss is calculated by applying the annualized Credit Default Swap rates (CDS) of the country of domicile (pro rated in line with average payment terms; where available, the individual CDS of the counterparty is applied) and a premium of 25 bps per annum. The net expenses representing additions to the allowance for impairment losses and releases of the unused allowance recognized according to the approach described above amounted to CHF 6.6 million in 2020/21 (2019/20: CHF 14.6 million).
Letter to Shareholders Overview Business Highlights Sustainability Our People Financial Reports Governance
Notes to the Consolidated Financial Statements
Barry Callebaut | Annual Report /
The following table summarizes the expected credit losses on the Group’s trade receivables at balance sheet date:
Ageing of trade receivables
as of August 31, 2021 2020 in thousands of CHF Total trade receivables measured at amortized cost, gross 422,913 336,432
of which: insured receivables 255,505 203,957 uninsured receivables with an individual balance over CHF 1 million 77,720 61,516 uninsured receivables with an individual balance below CHF 1 million 89,688 70,959
Less lifetime expected credit losses for trade receivables (25,084) (24,969) Total trade receivables measured at amortized cost (Note 3.7.8) 397,829 311,463
of which:
not overdue 372,625 287,526 lifetime expected credit losses for trade receivables not overdue (3,749) (5,885) expected credit loss rate 1.01% 2.05% past due less than 90 days 27,080 31,932 lifetime expected credit losses for trade receivables past due less than 90 days (3,106) (4,638) expected credit loss rate 11.62% 14.52% past due more than 90 days 23,207 16,974 lifetime expected credit losses for trade receivables past due more than 90 days (18,228) (14,446) expected credit loss rate 78.55% 85.11%
Total trade receivables measured at amortized cost (Note 3.7.8) 397,829 311,463
The Group has insured certain credit risks through a credit insurance policy. The majority of customers with a material outstanding amount are credit insured by this policy. Movements in allowance for impairment losses of financial assets The movements in allowance for impairment losses of financial assets are as follows:
in thousands of CHF Cash and cash equivalents
Deposits Trade receivables Other receivables Other financial assets
Total
as of September 1, 2020 502 19 24,969 10,838 10 36,338 Changes to expected credit losses on financial assets already recognized at the beginning of the fiscal year
20 – 317 3,650 2 3,989
Changes to expected credit losses on new financial assets originated during the fiscal year
593 1 7,032 1,574 7 9,207
Write-offs (28) – (1,020) (1,295) – (2,343) Unused amounts reversed (100) (9) (6,392) (94) (4) (6,599) Currency translation adjustment 11 – 178 (317) – (128) as of August 31, 2021 998 11 25,084 14,356 15 40,464 in thousands of CHF Cash and cash
equivalents Deposits Trade receivables Other receivables Other financial
assets Total
as of September 1, 2019 964 10 14,984 8,948 11 24,917 Changes to expected credit losses on financial assets already recognized at the beginning of the fiscal year
17 – 1,034 745 – 1,796
Changes to expected credit losses on new financial assets originated during the fiscal year
Letter to Shareholders Overview Business Highlights Sustainability Our People Financial Reports Governance
Notes to the Consolidated Financial Statements
Barry Callebaut | Annual Report /
3.7.5 Liquidity risk Liquidity risk arises through a surplus of financial obligations over available financial assets due at any point in time. The Group’s liquidity is ensured by means of regular Group-wide monitoring and planning of liquidity coordinated by the Group’s Treasury department.
Financing needs are covered through a combination of adequate credit lines with reputable financial institutions as well as through short-term and long-term debt capital market instruments (see Note 3.5 “Financial liabilities”).
Contractual maturities The table below provides an overview of contractual maturities for financial liabilities and derivatives:
as of August 31, 2021 Carrying amount In the first year In the second to the fifth year After five years Contractual
amount in thousands of CHF Non-derivative financial liabilities
Derivative financial assets and liabilities consist of hedged items and hedging instruments designated in a cash flow hedging model or a fair value hedging model and derivative financial instruments with no hedge accounting designation.
In the current fiscal year, the Group designated groups of items in a hedge relationship whenever the items are managed together on a net basis for risk management purposes. This resulted in a greater proportion of economic hedges being designated in a fair value hedge as opposed to having no hedge accounting designation.
Letter to Shareholders Overview Business Highlights Sustainability Our People Financial Reports Governance
Notes to the Consolidated Financial Statements
Barry Callebaut | Annual Report /
3.7.7 Offsetting financial assets and financial liabilities The following financial assets and liabilities are subject to offsetting, enforceable master netting arrangements and similar agreements:
Related amounts not set off in the balance sheet as of August 31, 2021
For the financial assets and liabilities subject to enforceable master netting arrangements or similar arrangements above, each agreement between the Group and the counterparty allows for net settlement of the relevant financial assets and liabilities when both elect to settle on a net basis. In the absence of such an election, financial assets and liabilities will be settled on a gross basis. However, each party to the master netting agreement or similar agreement will have the option to settle all such amounts on a net basis in the event of default, insolvency or bankruptcy or following other events predefined in the contract by the counterparty. The cash collateral received and deposited is reported on lines “Trade payables and other current liabilities” and “Trade receivables and other current assets” in the Consolidated Balance Sheet.
Letter to Shareholders Overview Business Highlights Sustainability Our People Financial Reports Governance
Notes to the Consolidated Financial Statements
Barry Callebaut | Annual Report /
3.7.8 Fair value of financial instruments a) Methods and assumptions The carrying value of the following financial instruments approximates fair value because of the short period to maturity: • Cash and cash equivalents • Short-term deposits • Trade receivables • Other receivables representing financial instruments • Bank overdrafts • Short-term debt • Trade payables • Other payables representing financial instruments • Lease liabilities
Long-term debt In calculating the fair value of long-term debts, future principal and interest payments are discounted at market interest rates.
Derivative financial assets and liabilities The fair value measurement of some derivatives requires assumptions and management’s assessment of certain market parameters. Whenever possible, fair valuation is based on market prices. If required, a valuation model which takes into consideration discounted cash flows, dealer and supplier quotes for similar instruments and recent arm’s-length transactions is used. This valuation model takes into account the specific characteristics of the underlying assets or commodities such as the cost of carry, differentials for the properties and technical ratios reflecting production yield.
Letter to Shareholders Overview Business Highlights Sustainability Our People Financial Reports Governance
Notes to the Consolidated Financial Statements
Barry Callebaut | Annual Report /
Carrying amount and fair value of each class of financial assets and liabilities are presented in the table below:
Letter to Shareholders Overview Business Highlights Sustainability Our People Financial Reports Governance
Notes to the Consolidated Financial Statements
Barry Callebaut | Annual Report /
b) Fair value hierarchy of financial instruments The fair value measurements of financial assets and liabilities are classified using a fair value hierarchy that reflects the significance of the inputs used in making the measurements. The fair value hierarchy has the following levels: • Level 1: The fair value is based on unadjusted, quoted prices in active markets which give
the best possible objective indication for the fair value of a financial asset or liability. A market is regarded as active if quoted prices are readily and regularly available from an exchange, dealer, broker or pricing service, and those prices represent actual and regularly occurring market transactions on an arm’s-length basis.
• Level 2: The estimation of the fair value is based on the results of a valuation model. The valuation model for commodity derivatives includes quoted prices in active markets, recent arm’s-length transactions or dealer and supplier quotes adjusted for the specific characteristics of the underlying commodities such as the cost of carry, differentials for the properties and conversion yields. Observable market data is used for the valuation of foreign exchange and interest rate derivatives. If all significant inputs required to fair value an instrument are observable, the instrument is included in Level 2.
• Level 3: The valuation models used are based on parameters and assumptions not observable on the market.
The following table summarizes the levels applied with regard to financial assets and financial liabilities measured at fair value:
as of August 31, 2021 Level 1 Level 2 Level 3 Total in thousands of CHF Trade receivables – – 87,145 87,145 Derivative financial assets 99,692 190,950 – 290,642 Derivative financial liabilities 125,818 225,093 – 350,911 as of August 31, 2020 Level 1 Level 2 Level 3 Total in thousands of CHF Trade receivables – – 75,941 75,941 Derivative financial assets 193,554 172,430 – 365,984 Derivative financial liabilities 210,634 317,858 – 528,492
As at August 31, 2021, no contracts were irrevocably designated as executory contracts measured at fair value, applying the fair value option, leading to derivative financial assets or derivative financial liabilities (2020: CHF 18.3 million and CHF 40.0 million). The fair value of each executory contract measured at fair value using the fair value option was calculated using the methods described in Level 2.
The Group maintains asset-backed securitization programs for trade receivables, transferring the contractual rights to the cash flow or third-party receivables. These receivables are derecognized. Trade receivables measured at fair value are receivables dedicated to the securitization programs, but not yet remitted to the asset-purchasing company.
Letter to Shareholders Overview Business Highlights Sustainability Our People Financial Reports Governance
Notes to the Consolidated Financial Statements
Barry Callebaut | Annual Report /
The value of the trade receivables measured at fair value was calculated using a discounted cash flow method based on the nominal value and the discount rates (mainly representing the risk-free rate and credit risk of the counterparty) between the Group and the purchasing party.
There have been no transfers between the fair value hierarchy levels during the fiscal years 2020/21 and 2019/20.
3.7.9 Effect of hedge accounting on the financial position and performance a) Impact of hedging instruments designated in hedging relationships The impact of hedging instruments designated in hedging relationships as of August 31, 2021 on the Group’s Consolidated Balance Sheet is as follows:
Letter to Shareholders Overview Business Highlights Sustainability Our People Financial Reports Governance
Notes to the Consolidated Financial Statements
Barry Callebaut | Annual Report /
b) Impact of hedged items designated in hedging relationships The impact of hedged items designated in hedging relationships as of August 31, 2021 on the Group’s Consolidated Balance Sheet is as follows:
in CHF million Carrying amount of the hedged item
Accumulated amount of fair value hedge
adjustments included in the carrying amount of the
hedged item
From the accumulated amount of fair value hedge adjustments: part related
Cocoa and chocolate stocks 1,187.4 n/a 2.2 n/a – n/a 5.0 n/a Risk component of cocoa and chocolate purchase and sales contracts 49.7 145.5 49.7 145.5 – – (91.2) n/a
Foreign exchange risk Firm purchase and sales commitments denominated in foreign currency 28.3 24.0 28.3 24.0 – – (32.8) n/a
Letter to Shareholders Overview Business Highlights Sustainability Our People Financial Reports Governance
Notes to the Consolidated Financial Statements
Barry Callebaut | Annual Report /
c) Impact of the hedging relationships on the Consolidated Income Statement and other comprehensive income The above hedging relationships affected the Consolidated Income Statement and other comprehensive income as follows:
Cash flow hedges
Change in the fair value of the hedging
instrument recognized
in other comprehensive
income
Hedge ineffectiveness
recognized in the Consolidated
Income Statement
Amount reclassified from the cash flow
hedge reserve to the Consolidated
Income Statement
Line item in the
Consolidated Income Statement
impacted by the reclassification from
cash flow hedge reserve
as of August 31, 2021 in CHF million Interest rate risk 3.4 – 2.5 Finance expense Commodity price risk 14.4 – (1.2) Cost of goods sold Foreign exchange risk 0.5 – 0.9 Cost of goods sold
Cash flow hedges
Change in the fair value of the hedging
instrument recognized
in other comprehensive
income
Hedge ineffectiveness
recognized in the Consolidated
Income Statement
Amount reclassified from the cash flow
hedge reserve to the Consolidated
Income Statement
Line item in the
Consolidated Income Statement
impacted by the reclassification from
cash flow hedge reserve
as of August 31, 2020 in CHF million Interest rate risk 1.8 – 2.5 Finance expense Commodity price risk 8.5 – 7.3 Cost of goods sold Foreign exchange risk (2.1) – (1.5) Cost of goods sold
This table includes the changes in the fair value of the hedging instruments recognized in Other comprehensive income throughout the entire fiscal years 2020/21 and 2019/20 (including hedge accounting relationships ended during the fiscal year).
The table in section 3.7.9a “Impact of hedging instruments designated in hedging relationships” (refer to column “Fair value changes of the hedging instrument used as a basis to calculate hedge ineffectiveness”) includes the fair value changes of hedging instruments that are related to hedge accounting relationships, which were still active as at August 31, 2021.
Letter to Shareholders Overview Business Highlights Sustainability Our People Financial Reports Governance
Notes to the Consolidated Financial Statements
Barry Callebaut | Annual Report /
Fair value hedges Hedge ineffectiveness
recognized in the Consolidated
Income Statement
Line item in the
Consolidated Income Statement
where the hedge ineffectiveness is
reported as of August 31, 2021 in CHF million Commodity price risk 4.2 Cost of goods sold Foreign exchange risk 0.6 Cost of goods sold
Fair value hedges Hedge ineffectiveness
recognized in the Consolidated
Income Statement
Line item in the
Consolidated Income Statement
where the hedge ineffectiveness is
reported as of August 31, 2020 in CHF million Commodity price risk 3.8 Cost of goods sold Foreign exchange risk 3.8 Cost of goods sold
Certain ineffectiveness can arise during the hedging process. The main sources of hedge ineffectiveness are considered to be timing differences between entering into the hedged items and into the hedging instruments and differences between the maturity profile of the hedged items and the hedging instruments.
Letter to Shareholders Overview Business Highlights Sustainability Our People Financial Reports Governance
Notes to the Consolidated Financial Statements
Barry Callebaut | Annual Report /
The following table provides further information about the effect of cash flow hedges on equity:
in thousands of CHF
Commodity price risk
Foreign exchange risk
Interest rate risk Total hedging reserve
as of September 1, 2019 (9,955) 2,427 (23,247) (30,775) Movements in the period:
Gains/(losses) taken into equity 8,449 (2,105) 1,781 8,125 Transfer to initial carrying amount of the hedged item (122) (730) – (852) Transfer to the Consolidated Income Statement for the period 7,259 (1,489) 2,472 8,242
thereof: – due to hedged cash flows that are no longer expected to occur/ineffectiveness
(2,170)
1,712 – (458)
due to hedged item affected the Consolidated Income Statement
as of August 31, 2020 3,782 (1,545) (19,971) (17,734) as of September 1, 2020 3,782 (1,545) (19,971) (17,734) Movements in the period:
Gains/(losses) taken into equity 14,373 546 3,443 18,362 Transfer to initial carrying amount of the hedged item 2,558 230 – 2,788 Transfer to the Consolidated Income Statement for the period (1,221) 917 2,473 2,169
thereof: – due to hedged cash flows that are no longer expected to occur/ineffectiveness
10,211
(488) – 9,723
due to hedged item affected the Consolidated Income Statement
Letter to Shareholders Overview Business Highlights Sustainability Our People Financial Reports Governance
Notes to the Consolidated Financial Statements
Barry Callebaut | Annual Report /
3.7.10 Timing, nominal amount and pricing of hedging instruments The following table provides information about the maturity of the nominal amount and interest rates attached to the swaps held by the Group as of August 31, 2021 to hedge its interest rate risk:
as of August 31, 2021 Period of maturity First year Second to fifth year After five years Total
The following table provides information about the foreign exchange forwards and futures in case of the major foreign currency hedging pairs held by the Group as of August 31, 2021 to hedge its foreign exchange risk:
as of August 31, 2021 Period of maturity Current year Next year After next year Total
GBP exposure hedging in entities whose functional currency is EUR
USD exposure hedging in entities whose functional currency is EUR Nominal amount (CHF million, long/(short)) (39.3) (75.2) 4.2 (110.3) Average foreign exchange rate (EUR/USD) 1.124 1.230 1.155 n/a
GBP exposure hedging in entities whose functional currency is USD Nominal amount (CHF million, long/(short)) 159.1 20.5 3.7 183.3 Average foreign exchange rate (USD/GBP) 0.781 0.790 0.786 n/a
USD exposure hedging in entities whose functional currency is BRL Nominal amount (CHF million, long/(short)) (104.0) – – (104.0) Average foreign exchange rate (BRL/USD) 0.182 – – n/a
Letter to Shareholders Overview Business Highlights Sustainability Our People Financial Reports Governance
Notes to the Consolidated Financial Statements
Barry Callebaut | Annual Report /
Accounting policies
Derivative financial instruments
Derivative financial instruments are accounted for at fair value with fair value changes recognized in the Consolidated Income Statement.
As the Group also acts as a cocoa bean trader, certain cocoa bean purchase and sales contracts are net cash settled and therefore, contracts allocated to the same portfolio are treated as derivative contracts.
Additionally, the Group may apply the fair value option for its third-party executory forward purchase and sales contracts (available under IFRS 9 as an alternative to the off-balance sheet treatment). These exemptions are applied for those cocoa contracts where the measurement eliminates or significantly reduces an accounting mismatch that would otherwise occur on own use contracts.
Hedge accounting The Group requires cocoa beans and semi-finished cocoa products for its operations. The Group is exposed to adverse cocoa price movements on the purchase side due to increasing cocoa prices, on the sales side and inventory held due to decreasing cocoa prices. The Group applies hedge accounting to hedge its cocoa price risk embedded in its chocolate inventories and sales contracts as well as in the cocoa inventories, purchase and sales contracts, and uses cocoa bean futures to manage cocoa price risks.
The Group is also exposed to increasing sugar prices and fuel oil prices with regard to its forecasted sugar purchases and forecasted fuel consumption, respectively. The Group therefore applies cash flow hedge accounting when it hedges its sugar price risk embedded in its forecasted sugar purchases with sugar futures.
The Group enters into sales and purchase contracts denominated in various currencies. The foreign currency risks exposure arising from these firm commitments and highly probable transactions are hedged by the Group’s Treasury department. The Group applies fair value hedge accounting to its firm commitments.
The Group’s interest rate risk is managed with interest rate derivatives. Hedge accounting is applied to derivatives that are effective in offsetting the changes in fair value or cash flows of the hedged items. The hedge relationship is documented and the effectiveness of such hedges is tested at regular intervals, at least on a semi-annual basis.
The impact of hedging accounting is presented on the Group’s Consolidated Balance Sheet as follows:
Hedging instrument/item Line item on Consolidated Balance Sheet Cash flow hedges: Interest rate swaps Derivative financial assets and liabilities Commodity futures contracts Derivative financial assets and liabilities Foreign exchange forward and future contracts
Derivative financial assets and liabilities
Fair value hedges: Cocoa and chocolate stocks Inventories Risk component of cocoa and chocolate purchase and sales contracts
Derivative financial assets and liabilities
Commodity futures contracts Derivative financial assets and liabilities Foreign exchange forward and future contracts
Derivative financial assets and liabilities
Firm purchase and sales commitments denominated in foreign currency
Derivative financial assets and liabilities
Receivables Trade receivables and other current assets Payables Trade payables and other current liabilities Debt Short-term debt; long-term debt Cash instruments Cash and cash equivalents
Letter to Shareholders Overview Business Highlights Sustainability Our People Financial Reports Governance
Notes to the Consolidated Financial Statements
Barry Callebaut | Annual Report /
Fair value hedging – for commodity price risks and foreign currency exchange risks related to the contract business
To reflect the Group’s activities of hedging its cocoa price risk exposure embedded in the cocoa and chocolate inventories and unrecognized firm commitments, the Group applies fair value hedge accounting. In this fair value hedge accounting relationship, the chocolate inventories and unrecognized firm sales commitments and the cocoa inventories, unrecognized firm purchase and sales commitments, respectively, are designated as hedged items whereby cocoa bean futures are designated as hedging instruments. When cocoa and chocolate inventory is designated as a hedged item, the subsequent cumulative change in the fair value of the inventory attributable to the hedged cocoa price risk is adjusting the carrying amount of the hedged item (change of inventory cost value) with a corresponding gain or loss in the Consolidated Income Statement.
When unrecognized firm cocoa and chocolate commitments (purchase and sales contracts) are designated as hedged items, the subsequent cumulative change in the fair value of these contracts attributable to the hedged cocoa price risk is recognized as an asset or a liability (reported as “Derivative financial assets” and “Derivative financial liabilities”) with a corresponding gain or loss in the Consolidated Income Statement. The hedging instrument is recorded at fair value under “Derivative financial assets” or “Derivative financial liabilities”, and the changes in the fair value of the hedging instrument are also recognized in the Consolidated Income Statement.
For foreign currency exchange risks related to firm purchase and sales commitments in certain entities, fair value hedge accounting is applied. The hedge relationship is between the unrecognized firm commitments (hedged items) and the foreign currency forward contracts and/or monetary items (hedging instruments). The changes in fair value of the hedging instruments (attributable to foreign currency exchange rate movements) are recognized in the Consolidated Income Statement. The cumulative change in the fair value of the hedged items (unrecognized firm commitments) attributable to the foreign currency risk is recognized as “Derivative financial assets” or “Derivative financial liabilities” with a corresponding gain or loss in the Consolidated Income Statement.
Accounting for cash flow hedges
For each cash flow hedge relationship, the effective part of any gain or loss on the derivative financial instrument is recognized directly in other comprehensive income. Gains or losses that are recognized in other comprehensive income are transferred to the Consolidated Income Statement in the same period in which the hedged exposure affects the Consolidated Income Statement. The ineffective part of any gain or loss is recognized immediately in the Consolidated Income Statement at the time hedge effectiveness is tested.
Hedge accounting is discontinued when the hedging instrument expires or is sold, terminated or exercised, or no longer qualifies for hedge accounting. At that point in time, any cumulative gain or loss on the hedging instrument recognized in other comprehensive income is kept in other comprehensive income until the forecasted transaction occurs. If a hedged transaction is no longer expected to occur, the net cumulative gain or loss recognized in other comprehensive income is immediately transferred to the Consolidated Income Statement.
Letter to Shareholders Overview Business Highlights Sustainability Our People Financial Reports Governance
Notes to the Consolidated Financial Statements
Barry Callebaut | Annual Report /
Cash flow hedging – for commodity price risks (cocoa and sugar price risk) and foreign currency exchange risks arising from forecasted purchase and sales transactions
The Group enters into sugar futures to hedge the sugar price risk exposure embedded in certain forecasted sugar purchases, and into foreign exchange forwards and futures contracts to hedge the currency risk arising from these forecasted sugar purchases.
The Group applies cash flow hedge accounting for these hedging relationships whereby the sugar futures and the foreign exchange forwards and futures are designated as hedging instruments to hedge the variability in cash flows attributable to the risk of sugar price movements and to the foreign currency risk, respectively, in the hedged forecasted sugar purchases.
Where no firm commitments exist, the Group may enter into cocoa bean futures to hedge the cocoa price risk arising from forecasted sales, and into foreign exchange forwards and futures contracts to hedge the currency risk arising from forecasted sales transactions denominated in foreign currencies.
The related entities apply cash flow hedge accounting whereby the cocoa bean futures and the foreign exchange forwards and futures are designated as hedging instruments to the underlying forecasted sales to hedge the variability in cash flow that is attributable to the risk of cocoa price movements and to the foreign exchange risk, respectively.
Cash flow hedging – for interest rate risks
The Group applies cash flow hedge accounting for interest rate derivatives, converting a portion of floating rate borrowings to fixed-rate borrowings.
Cash flow hedging – for logistical expenditure (fuel oil)
The Group also enters into fuel oil swaps to hedge its exposure to fuel oil price movements in its forecasted freight expenditures, and it applies cash flow hedge accounting for this hedging relationship.
No hedge accounting designation
The Group’s purchasing and sourcing centers and the Group’s Treasury department have derivative financial instruments that are measured at fair value without being assigned to a hedge accounting relationship.
Letter to Shareholders Overview Business Highlights Sustainability Our People Financial Reports Governance
Notes to the Consolidated Financial Statements
Barry Callebaut | Annual Report /
. Financial result
Composition of finance income
in thousands of CHF 2020/21 2019/20 Interest income 3,640 6,697 Share of result of equity-accounted investees, net of tax (59) 282 Foreign exchange gains, net 47 – Total finance income 3,628 6,978
Composition of finance expense
in thousands of CHF 2020/21 2019/20 Interest expense (88,766) (94,664) Amortization of structuring fees (2,958) (2,538) Charges on undrawn portion of committed credit facilities (2,381) (1,337) Net interest costs related to defined benefit plans (Note 4.2) (3,119) (3,495) Total interest expense (97,224) (102,034) Bank charges and other financial expense (4,286) (3,763) Foreign exchange losses, net – (1,158) Loss on derivative financial instruments (3,787) (2,471) Total finance expense (105,297) (109,425)
Interest expenses include among other the cost of leasing, the cost of interest rate swaps resulting from paying fixed interest rates in exchange for receiving floating interest rates. All interest rate derivative financial instruments are in a cash flow hedge relationship where the effective portion of the changes in fair value are recognized in Other comprehensive income.
Structuring fees are mainly attributable to the amortization of fees capitalized for the EUR 1,000 million Revolving Credit Facility (as amended and extended from time to time), the USD 400 million Senior Note, issued June 2013, the EUR 450 million Senior Note, issued May 2016, the EUR 467 million and CHF 152 million equivalent Schuldscheindarlehen, issued February 2019, the EUR 60 million private placement, issued May 2020, and the EUR 377 million and CHF 20 million equivalent Schuldscheindarlehen, issued July 2020.
The foreign exchange gains are mainly attributable to price volatility in the global foreign currency markets.
Letter to Shareholders Overview Business Highlights Sustainability Our People Financial Reports Governance
Notes to the Consolidated Financial Statements
Barry Callebaut | Annual Report /
Employees
. Personnel expenses
in thousands of CHF 2020/21 2019/20 Wages and salaries (571,930) (542,500) Compulsory social security contributions (105,112) (93,379) Equity-settled share-based payments (Note 4.2) (16,028) (12,512) Expenses related to defined benefit pension plans (Note 4.2) (15,860) (12,469) Expenses related to other long-term benefit plans (Note 4.2) (238) (1,086) Contributions to defined contribution plans (Note 4.2) (13,532) (11,617) Increase in liability for long service leave – (79) Total personnel expenses (722,700) (673,642) Amounts capitalized as assets 25,599 26,203 Total personnel expenses recognized in Consolidated Income Statement (697,101) (647,439)
Letter to Shareholders Overview Business Highlights Sustainability Our People Financial Reports Governance
Notes to the Consolidated Financial Statements
Barry Callebaut | Annual Report /
. Employee benefits Post-employment and other long-term employee benefits The Group operates a number of independent defined benefit plans and other post-retirement or long-term benefit plans, in line with local legal and tax requirements.
The largest defined benefit pension plans (funded) are located in Switzerland, Belgium, the US and the UK. Together, these plans represent 95% (2019/20: 95%) of the Group’s total gross defined benefit pension liabilities and 98% (2019/20: 98%) of the Group’s total plan assets. The amounts recognized in the Consolidated Balance Sheet are as follows:
as of August 31, 2021 2020 2021 2020
in thousands of CHF Defined benefit pension plans Other long-term benefit plans
Funded Unfunded Total Funded Unfunded Total Total Total Switzerland Weighted average duration in years 16 – 18 – – – Present value of liabilities 104,571 – 104,571 92,258 – 92,258 – – Fair value of plan assets (85,436) – (85,436) (72,401) – (72,401) – – Net plan liabilities (assets) 19,135 – 19,135 19,857 – 19,857 – – Belgium Weighted average duration in years 17 – 14 – 12 15 Present value of liabilities 106,740 – 106,740 97,507 – 97,507 10,547 10,539 Fair value of plan assets (51,579) – (51,579) (46,551) – (46,551) – – Net plan liabilities (assets) 55,161 – 55,161 50,956 – 50,956 10,547 10,539 US Weighted average duration in years 10 – 12 – 4 5 Present value of liabilities 78,387 – 78,387 84,830 – 84,830 71 115 Fair value of plan assets (58,747) – (58,747) (46,802) – (46,802) – – Net plan liabilities (assets) 19,640 – 19,640 38,028 – 38,028 71 115 UK Weighted average duration in years 18 – 18 – – – Present value of liabilities 80,674 – 80,674 72,462 – 72,462 – – Fair value of plan assets (95,730) – (95,730) (87,350) – (87,350) – – Net plan liabilities (assets) (15,056) – (15,056) (14,888) – (14,888) – – Rest of the world Weighted average duration in years 16 10 16 9 21 21 Present value of liabilities 17,517 17,489 35,006 17,386 17,032 34,418 5,003 5,843 Fair value of plan assets (6,230) – (6,230) (5,714) – (5,714) – – Net plan liabilities (assets) 11,287 17,489 28,776 11,672 17,032 28,704 5,003 5,843 Total Present value of liabilities 387,889 17,489 405,378 364,443 17,032 381,475 15,621 16,497 Fair value of plan assets (297,722) – (297,722) (258,819) – (258,819) – – Net plan liabilities (assets) 90,167 17,489 107,656 105,624 17,032 122,656 15,621 16,497 Net balances recognized in the Consolidated Balance Sheet
Letter to Shareholders Overview Business Highlights Sustainability Our People Financial Reports Governance
Notes to the Consolidated Financial Statements
Barry Callebaut | Annual Report /
The changes in the present value of the employee benefit liabilities are as follows:
2020/21 2019/20 2020/21 2019/20 in thousands of CHF Defined benefit pension plans Other long-term benefit plans Present value of defined benefit liabilities as of September 1,
381,476 412,134 16,497 18,674
Currency translations (60) 44 (9) 79 Current service cost 15,814 15,119 1,210 1,545 Past service cost 46 (2,650) – – Remeasurement of other long-term employee benefits – – (972) (841) Interest expense 4,621 4,737 436 509 Losses/(gains) on curtailment – 1 – 382 Total recognized in income statement 20,421 17,251 665 1,674 Actuarial losses/(gains) 6,274 (24,340) (1,301) (1,325) thereof: arising from changes in demographic assumptions (6,130) (225) – (937) arising from changes in financial assumptions 12,574 (17,697) (813) (38) arising from experience adjustments (170) (6,418) (488) (350) Exchange differences on foreign plans 5,514 (9,404) 310 (2,110) Total recognized in other comprehensive income 11,788 (33,744) (991) (3,435) Reclassifications – – – 318 Contribution by employees 4,425 4,342 – – Benefits received 9,237 6,977 – – Benefits paid (21,969) (25,484) (550) (734) Total other (8,307) (14,165) (550) (416) Present value of defined benefit liabilities as of August 31,
The Group expects to pay CHF 17.0 million in employer contributions to defined pension plans in the next fiscal year (2020/21: CHF 23.0 million).
Actuarial losses amounted to CHF 5.0 million for the current fiscal year (2019/20: actuarial gains of CHF 25.7 million), which is mainly related to changes in the financial assumptions such as the development of discount rates. The respective amounts were recognized in Other comprehensive income.
The movement in the fair value of plan assets is as follows:
2020/21 2019/20 in thousands of CHF Defined benefit pension plans Opening fair value of plan assets as of September 1,
258,819 251,170
Currency translations (30) 75 Interest income 1,938 1,751 Gains/(losses) on curtailment – 1 Total recognized in income statement 1,908 1,827 Return on plan assets excluding interest income 16,650 6,253 Exchange differences on foreign plans 5,221 (4,660) Total recognized in other comprehensive income 21,871 1,593 Contributions by employer 21,757 16,469 Contributions by employees 4,425 4,341 Benefits received 9,237 6,976 Benefits paid (20,295) (23,557) Total other 15,124 4,229 Fair value of plan assets as of August 31, 297,722 258,819
Letter to Shareholders Overview Business Highlights Sustainability Our People Financial Reports Governance
Notes to the Consolidated Financial Statements
Barry Callebaut | Annual Report /
The plan assets consist of the following categories of securities:
as of August 31, 2021 2020 in thousands of CHF Defined benefit pension plans Equities 95,387 72,984 Bonds 149,962 136,751 Insurance portfolio 13,219 12,029 Cash and other assets 39,154 37,055 Total fair value of plan assets 297,722 258,819
Most of the equity and debt securities have a quoted market price in an active market. Real estate and alternative investments, which include hedge fund, private equity, infrastructure and commodity investments, usually have a quoted market price or a regularly updated net asset value.
The plan assets do not include any ordinary shares issued by the Company nor any property occupied by the Group or one of its subsidiaries.
The amounts recognized in the Consolidated Income Statement are as follows:
2020/21 2019/20 2020/21 2019/20 in thousands of CHF Defined benefit pension plans Other long-term benefit plans Current service costs 15,814 15,119 1,210 1,545 Net interest expense 2,683 2,986 436 509 Net currency translations (30) (31) (9) 79 Past service cost 46 (2,650) – – Losses/(gains) on curtailments and settlements – – – 382 Remeasurement – – (972) (841) Total expenses related to defined benefit plans and other long-term benefit plans recognized in income statement
18,513
15,424
665
1,674
in thousands of CHF 2020/21 2019/20 Total defined contribution expenses recognized in income statement 13,532 11,617
The expenses related to defined benefit pension plans and other long-term benefit plans are recognized in the following line items in the Consolidated Income Statement:
in thousands of CHF 2020/21 2019/20 Cost of goods sold 3,355 3,850 Marketing and sales expenses 1,278 529 General and administration expenses 10,703 8,449 Research and development expenses 762 727 Personnel expenses 16,098 13,555 Interest expense 3,119 3,495 Foreign exchange gains/(losses) (38) 48 Finance expense 3,081 3,543 Total expenses related to defined benefit plans and other long-term benefit plans recognized in income statement 19,179 17,098
Letter to Shareholders Overview Business Highlights Sustainability Our People Financial Reports Governance
Notes to the Consolidated Financial Statements
Barry Callebaut | Annual Report /
Actuarial assumptions Weighted average actuarial assumptions used are as follows:
2020/21 2019/20 2020/21 2019/20 Defined benefit pension plans Other long-term benefit plans Discount rate 1.7% 1.7% 2.8% 2.6% Expected rate of pension increase 0.6% 0.0% 0.0% 0.0% Expected rate of salary increase 2.4% 1.5% 2.3% 1.3%
The applicable mortality tables in the Group’s largest defined benefit plans and underlying longevity assumptions are summarized in the following table:
Mortality table 2021 2020 2021 2020
Life expectancy at age 65
for a male member Life expectancy at age 65
for a female member Switzerland LPP 2020 (2020: LPP2015) 22 22 24 24 Belgium MR / FR 21 21 25 25 UK S3NMA / S3NFA 22 22 25 25 US PRI-2012 21 21 22 23
Sensitivity analysis Reasonable and possible changes at the reporting date to one of the relevant actuarial assumptions, with all other assumptions held constant, would have affected the defined benefit liabilities by the amounts shown below:
as of August 31, 2021 2020 2021 2020 in thousands of CHF Increase Decrease Discount rate (1% movement) (56,670) (74,480) 73,412 74,480 Expected rate of pension increase (1% movement) 21,956 23,842 (21,956) (23,842) Expected rate of salary increase (1% movement) 27,717 26,971 (27,717) (26,971) Life expectancy at age 65 (1 year) 9,187 9,096 (9,187) (9,096)
Letter to Shareholders Overview Business Highlights Sustainability Our People Financial Reports Governance
Notes to the Consolidated Financial Statements
Barry Callebaut | Annual Report /
Description of the defined benefit plans The characteristics of the most significant defined benefit pension plans of the Group are further described as follows:
Defined benefit plans Switzerland The retirement benefit plans for all Swiss Group entities are mainly defined benefit plans where contributions are expressed as a percentage of the insured actual salary. The employer is affiliated to a collective foundation with reinsurance of actuarial risks arising from the plan with an insurance company. Members benefit from a guaranteed minimum interest on accrued savings and conversion rates at retirement in accordance with the Swiss Federal Law on Occupational Retirement, Survivors’ and Disability Pension Plans (BVG). This law defines the minimum pensionable salary and the minimum retirement credits. In addition to retirement benefits, the Swiss retirement benefit plans also provide for temporary partial or total disability benefits as well as for pre-retirement death benefits including widows’ and orphans’ benefits.
The benefit plans are outsourced to external insurance companies, which are responsible for the operation of the plan including the allocation of plan assets. The governance and the supervision as well as the responsibility to make changes in the plan lie with a Board of Trustees. It consists equally of employer and employee nominated representatives.
The applicable regulation requires the retirement benefit plans of all Swiss Group entities to be funded on the basis of employer and employee contributions, including risk premiums and savings contributions. In case of underfunding, recovery measures must be taken, such as the additional financing from the employer or from the employer and employees, or the reduction of benefits or a combination of both.
The plan regulations in Switzerland were partially modified and certain components of the Swiss pension plans that meet the specific requirements are accounted for as defined contribution plans.
Defined benefit plans – Other countries In the US, the Group maintains a retirement benefit plan only for pensioners and deferred pensioners related to a discontinued operation. Effective July 31, 2005, all benefits in the plan were closed for new entrances and further benefit accruals. The pension plan’s funding is governed by ERISA and the applicable laws and regulations under Internal Revenue Code (IRC) sections 404, 412, and 430. Barry Callebaut is the plan sponsor and usually funds the minimum required contribution based on these regulations. The investment management is outsourced to investment management companies and the plan is governed by a Board of Trustees.
In Belgium, the Group operates defined benefit plans for events of retirement, temporary and permanent disability and death in service put in place by the employer in addition to legal retirement plans. These are company collective plans introduced on July 1, 1993. The retirement benefit plans are funded by a combination of employer and employee contributions as regulated by the Belgian Pension Act. The contributions are expressed as a percentage of the insured actual salary. The plans are fully insured. The funding of the defined benefit plans are externalized to an insurance company who is responsible for the operation of the plan including the allocation of plan assets. The governance and the supervision as well as the responsibility to make changes in the plan lie with a Board of Trustees. The legislation requires a minimum funding level. In the situation where the plan assets are not sufficient, the employer has to pay an additional contribution to the collective financing fund.
Letter to Shareholders Overview Business Highlights Sustainability Our People Financial Reports Governance
Notes to the Consolidated Financial Statements
Barry Callebaut | Annual Report /
In the UK, the Group operates a defined benefit retirement scheme in which members receive benefits based on the final salary with the contributions paid by the employer on a balance of cost basis. Effective January 31, 2014, all benefits in the plan were closed for new entrances and further benefit accruals. The plan is run by the Board of Trustees in accordance with the Trust Deed & Rules and legislation. The Trustees are required by law to fund the plan on prudent funding assumptions under the Trust Deed & Rules of the plan. The contributions payable by the Company to fund the plan are set by the Trustees after consulting the Company. The investment management is outsourced to investment management companies. Share-based payments Share awards are granted to participants according to individual contracts and the current employee stock ownership program.
Long-Term Incentive Plan (LTIP) The purpose of the LTIP is to provide the participants with an ownership interest in Barry Callebaut and to reward them for the long-term performance of the company. The LTIP thus aligns their interests to those of the shareholders.
The current LTIP has been in place since fiscal year 2016/17 and has been amended for the fiscal year 2018/19, where members of the Executive Committee were granted a fourth exceptional tranche, which vests subject to a four-year cliff vesting based on outperforming the Mid-Term Plan targets in terms of volume growth (CAGR; 25%), EBIT (25%), cumulative Free cash flow (25%) and Return on invested capital (ROIC) (25%) for the period September 2018 to August 2022. The maximum payout opportunity for this tranche is 100% of target. For the fiscal year 2020/21, there is no such additional tranche.
The grant of share units under the LTIP is based on a target LTI amount determined individually for each plan participant. The individual LTI amount is divided by the average share price of the last three months of the preceding fiscal year in order to calculate the number of share units awarded. The share units vest in three tranches over three fiscal years, i.e. 25% on the first, 25% on the second and 50% on the third anniversary of the grant date.
The first two tranches are restricted share units (RSU) that vest subject to the LTIP participant continuing to be employed by Barry Callebaut.
The third tranche consists of performance share units (PSU) that vest subject to meeting two performance criteria over the three-year vesting period.
The first performance criterion, accounting for 50% of the respective PSU grant, is the relative share price development of Barry Callebaut versus a peer group of companies in the chocolate, ingredients and FMCG sector: AAK, Fuji Oil, Givaudan, Hershey, Kellogg’s, Kerry, Lindt, Mondelez, Nestlé, Olam and Unilever. The objective (100% vesting) is to achieve median performance, e.g. to outperform half of the peer companies. There is no vesting for a performance below the first quartile of the peer group (threshold), and the vesting is capped at 300% for delivering the best performance in the peer group.
The second performance criterion, accounting for 50% of the relevant PSU grant, is ROIC. The ROIC performance was introduced in fiscal year 2016/17 in order to reward the sustainable management of the Company’s assets. The three-year ROIC target was set by the Board of Directors on the basis of the long-term strategic plan of the Company. The vesting also ranges from 0% to 300% of target. Consequently, the overall vesting of the LTI award (including RSU and PSU) ranges from 50% and 200% of the initially determined number of share units granted.
Letter to Shareholders Overview Business Highlights Sustainability Our People Financial Reports Governance
Notes to the Consolidated Financial Statements
Barry Callebaut | Annual Report /
The Board of Directors reserves the right to suspend or adjust the vesting of the share units in case of a negative result from continuous operations of the Barry Callebaut Group. Once the shares are vested and transferred, they are free of any sales restrictions. Any award granted under the LTIP is subject to clawback and malus provisions. In case of a material misstatement of financial results or a serious reputational damage to Barry Callebaut due to fraud of willful intent, or of a gross misconduct which would qualify as a cause for termination, the Board of Directors may forfeit or claim back vested or unvested share units, within a period of two years after the vesting of the award.
The overall vesting of the LTI award (including RSU, PSU and the fourth exceptional tranche) ranges from 50% to 200% of the initially determined number of the share units granted for members of the Executive Committee.
The share awards granted entitle the participants to full shareholders rights upon vesting of the share units (RSU/PSU) and their conversion into shares. In case of resignation or dismissal for cause during the vesting period (which ranges between one and three years), the initially granted, but not yet vested share units are forfeited.
The fair value of the RSU granted (no performance condition) is estimated by taking the market price at grant date less the present value of the expected dividends that will not be received on these RSU during the vesting period. 2,913 share awards were granted in fiscal year 2020/21 with an average fair value of CHF 1,964 (in fiscal year 2019/20: 2,726 share awards with an average fair value of CHF 1,982).
The fair value of the PSU, of which the vesting is conditional upon the relative share price performance, is assessed as per grant date based on a valuation performed by external experts applying the “Monte Carlo simulation” method. The most relevant parameters relating to Barry Callebaut and the relevant peer group are the risk-free interest rate, annualized volatility, the share price and the dividend yields. The risk-free rates reflect three-year government bonds of the country of origin of the respective company and range from –0.8% to 1.0%. The volatilities and correlations are based on daily returns of a companyʼs share at its respective exchange of origin over a three-year period preceding the start of the vesting cycle (the annualized volatility for Barry Callebaut and its peer group ranges from 17.2% to 29.3%). The dividend yields are based on dividends paid over a three-year period preceding the start of the vesting cycle and range from 0.7% to 4.0%. The share prices are denominated in their respective currency and retrieved for the specified point in time. The base share price taken into account for Barry Callebaut is the share price at grant date and amounted to CHF 2,000.
The fair value of PSU, of which the vesting is conditional upon the Group’s ROIC performance, is taken at fair value of the Barry Callebaut share at grant date discounted for dividends until the vesting. As this part is based on the Group’s performance relating to ROIC, the relative value is adjusted periodically during the vesting period, based on an estimation of the ROIC performance at vesting date.
In fiscal year 2020/21, 1,626 PSU were granted to members of the ExCo with an average fair value of CHF 2,431 (in fiscal year 2019/20: 1,494 share awards with an average fair value of CHF 2,366). To the other plan participants, 1,116 share awards with an average fair value of CHF 2,431 per share were granted in fiscal year 2020/21 (in fiscal year 2019/20: 1,219 share awards with an average fair value of CHF 2,366).
Board of Directors The Board of Directors receives share awards annually for the respective service period. These share awards are not part of the share plans described above and are determined by the NCC as a fixed number of shares. The total number of shares awarded for the service period amounted to 1,266 with an average fair value of CHF 1,930 per share (2019/20: 1,830 share awards with an average fair value of CHF 1,999 per share).
Letter to Shareholders Overview Business Highlights Sustainability Our People Financial Reports Governance
Notes to the Consolidated Financial Statements
Barry Callebaut | Annual Report /
Recognition in financial statements The fair value of the share awards at grant date is recognized over the vesting period as a personnel expense under either of these share plans. For 2020/21, the amount thus recog-nized (before taxes) was CHF 16.0 million with a corresponding increase in equity (2019/20: CHF 12.5 million). Of the amount recognized in 2020/21, CHF 13.3 million related to the LTIP (2019/20: CHF 8.9 million) and CHF 2.7 million to the BoD plan (2019/20: CHF 3.6 million).
The Group operates a number of independently defined benefit plans and other post-retirement or long-term benefit plans, which conform to local legal and tax requirements.
The Group’s net obligation in respect of defined benefit plans is calculated separately for each plan by estimating the amount of future benefit that employees have earned in the current and prior periods, applying the discount rate and deducting the fair value of any plan assets.
The calculation of defined benefit liabilities is performed annually by qualified actuaries using the projected unit credit method. When the calculation results in a potential asset for the Group, the recognized asset is limited to the present value of economic benefits available in the form of any future refunds from the plan or reductions in future contributions to the plan. To calculate the present value of economic benefits, consideration is given to any applicable minimum funding requirements.
Remeasurement of the net defined benefit liability which comprise actuarial gains and losses, the return on plan assets (excluding interest) and the effect of the asset ceiling are recognized immediately in Other comprehensive income. The Group determines the net interest expense (income) on the net defined benefit liability (asset) for the period by applying the discount rate used to measure the defined benefit liability (asset), taking into account any changes in the net defined benefit liability (asset) during the period as a result of contributions and benefit payments. Net interest expense and other expenses related to defined benefit plans are recognized in profit or loss.
When the benefits of a plan are changed, or when a plan is curtailed, the resulting change in benefit that relates to past service or the gain or loss on curtailment is recognized immediately in profit or loss. The Group recognizes gains and losses on the settlement of a defined benefit plan when the settlement occurs.
The Group’s employee benefit schemes are exposed to changes in legislation and to investment return and matching risks, longevity risks and solvency risks. These risks may all require additional contributions and are therefore reviewed on a regular basis by the companies’ management or by the relevant Board of Trustees as follows:
• Changes in legislation: monitoring of country-specific legislation changes
• Investment return risk: analysis and optimization of the allocation and performance of assets as well as monitoring of compliance with investment guidelines
• Investment matching risk: analysis and optimization of asset-liability matching and periodic fair valuation of assets and liabilities
• Longevity risk: analysis of mortality assumptions and monitoring of demographic development
• Solvency risk: monitoring of solvency of external solution providers
Letter to Shareholders Overview Business Highlights Sustainability Our People Financial Reports Governance
Notes to the Consolidated Financial Statements
Barry Callebaut | Annual Report /
Defined contribution plans
Obligations for contributions to defined contribution plans are expensed as the related service is provided. Prepaid contributions are recognized as an asset to the extent that a cash refund or a reduction in future payments is available. The Group has no further payment obligations once the contributions have been paid.
Post-employment benefits other than pensions
Certain subsidiaries provide health care and insurance benefits for a portion of their retired employees and their eligible dependents. The cost of these benefits is actuarially determined and included in the related function expenses over the employees’ working lives. The related liability is also included in the position “Other long-term benefit plans”.
Other long-term employee benefits
Other long-term employee benefits represent amounts due to employees under deferred compensation arrangements mandated by certain jurisdictions in which the Group conducts its operations (including jubilee plans and other long-service award plans). That benefit is discounted to determine its present value. Related remeasurement costs are recognized in the Consolidated Income Statement. The related liability is included in the position “Other long-term benefit plans”.
Termination benefits Termination benefits are expensed at the earlier of when the Group can no longer withdraw the offer of those benefits or when the Group recognizes costs for restructuring.
Long-Term Incentive Plan
For the LTIP, Barry Callebaut AG shares are purchased on the market and passed on to satisfy the awards. In accordance with IFRS 2, the compensation costs relating to share awards granted under this deferred share plan are recognized in the Consolidated Income Statement over the vesting period at their fair value as at the grant date.
Letter to Shareholders Overview Business Highlights Sustainability Our People Financial Reports Governance
Notes to the Consolidated Financial Statements
Barry Callebaut | Annual Report /
Group Structure and Related Parties
. Acquisitions
Acquisitions in 2020/21 There were no acquisitions completed in fiscal year 2020/21. Acquisitions in 2019/20 GKC Foods On July 1, 2020, the Group acquired GKC Foods (Australia) Pty Ltd, a producer of chocolate, coatings and fillings, serving many consumer chocolate brands in Australia and New Zealand. GKC is based in Melbourne, Australia.
This strategic acquisition established Barry Callebaut’s direct presence and manufacturing capacity in the growing Australian market, empowered the Group to expand its position in the industrial chocolate market and to leverage its value-adding Gourmet & Specialties business in the new market.
Barry Callebaut’s investment involved upgrading and expanding the factory’s existing infrastructure. GKC employed around 50 people at the site, including pre-existing employees, who transferred to Barry Callebaut.
The preliminary fair value of the purchase consideration amounted to CHF 3.4 million; CHF 2.8 million was fully paid in cash, the remaining CHF 0.6 million was recognized as “Other payables” and paid in October 2020 upon finalizing the completion statement. The acquisition-related costs in the amount of CHF 0.2 million were expensed and included in “Other expenses” in fiscal year 2019/20. The agreement with the seller did not contain arrangements for contingent considerations.
The purchase price allocation resulted in net identifiable assets of CHF 3.3 million, resulting in a goodwill of CHF 0.1 million. Identifiable net assets consisted mainly of CHF 4.0 million of right-of-use assets and a respective lease liability and CHF 3.0 million of property, plant and equipment.
Since July 1, 2020, the acquired business contributed CHF 0.3 million to revenues from sales and services and a CHF 0.4 million loss to net profit for the fiscal year 2019/20. Had it been consolidated from September 1, 2019, it would have contributed revenues from sales and services of CHF 3.1 million and a loss to net profit of CHF 0.5 million in the Consolidated Income Statement for the fiscal year 2019/20.
. Discontinued operations and disposal The Group did not have any discontinued operations or disposals in 2020/21 and 2019/20.
Letter to Shareholders Overview Business Highlights Sustainability Our People Financial Reports Governance
Notes to the Consolidated Financial Statements
Barry Callebaut | Annual Report /
. Group entities The principal subsidiaries of Barry Callebaut as of August 31, 2021, are as follows:1
Country Subsidiary Municipality of registration %-owned Currency Capital Switzerland Barry Callebaut Cocoa AG Zürich 100 EUR 81,515 Barry Callebaut Management Services AG Zürich 100 CHF 100,000 Barry Callebaut Schweiz AG Dübendorf 100 CHF 4,600,000 Barry Callebaut Sourcing AG Zürich 100 CHF 2,000,000 Cabosse Naturals Switzerland AG Zürich 100 CHF 1,000,000 Australia Barry Callebaut (Australia) Pty Ltd Melbourne 100 AUD 10 GKC Foods (Australia) Pty Ltd Melbourne 100 AUD 100,000 Belgium Barry Callebaut Belgium N.V. Lebbeke-Wieze 100 EUR 61,521,544 Barry Callebaut Manufacturing Halle BV Halle 100 EUR 15,488,952 Barry Callebaut Services N.V. Lebbeke-Wieze 100 EUR 929,286,000 Cabosse Naturals N.V. Halle 100 EUR 1,161,148 International Business Company Belgium BV Kortrijk (Heule) 100 EUR 65,000 Pierre Iserentant SA Thimister-Clermont 100 EUR 260,908 Brazil Barry Callebaut Brasil Indústria e Comércio de Produtos
Alimentícios Ltda. São Paulo 100 BRL 451,750,810
Cameroon Barry Callebaut Cameroon SA Douala 100 XAF 10,000,000 Société Industrielle Camerounaise des Cacaos SA Douala 81 XAF 1,959,531,000 Canada Barry Callebaut Canada Inc. St.-Hyacinthe 100 CAD 142,000,000 D’Orsogna Sweet Ingredients Ltd Ontario 100 CAD 1,000,000 Chile Barry Callebaut Chile SpA Santiago 100 CLP 27,988,650,000 China Barry Callebaut (Suzhou) Chocolate Co., Ltd. Suzhou 100 CNY 219,137,532 Barry Callebaut (Suzhou) Chocolate R&D Center Co., Ltd. Suzhou 100 CNY 13,970,504 Côte d’Ivoire Barry Callebaut Négoce SA Abidjan 100 XOF 3,700,000,000 Biopartenaire SA Yamoussoukro 100 XOF 7,600,000,000 Société Africaine de Cacao SA Abidjan 100 XOF 25,695,651,316 Societe Ivoirienne de Services Agricoles SA Abidjan 100 XOF 10,000,000 Czech Republic Barry Callebaut Czech Republic s.r.o. Prague 100 CZK 200,000 Denmark Barry Callebaut Denmark ApS Hostebro 100 DKK 500,000 Ecuador Barry Callebaut Ecuador SA Guayaquil 100 USD 5,050,000 France Barry Callebaut France SAS Hardricourt 100 EUR 67,900,000 Barry Callebaut Manufacturing France SAS Hardricourt 100 EUR 6,637,540 Barry Callebaut Nord Cacao SAS Gravelines 100 EUR 3,037,000 Germany Barry Callebaut Cocoa Germany GmbH Hamburg 100 EUR 25,000 Barry Callebaut Deutschland GmbH Cologne 100 EUR 52,000 Barry Callebaut Manufacturing Norderstedt GmbH & Co. KG Norderstedt 100 EUR 50,100 C.J. van Houten & Zoon Holding GmbH Norderstedt 100 EUR 72,092,155 Tagungs- und Seminarzentrum Schloss Marbach GmbH Öhningen 100 EUR 1,600,000 Ghana Barry Callebaut Ghana Ltd. Tema 100 USD 9,204,219 Nyonkopa Cocoa Buying Ltd. Kumasi 100 GHS 4,250,000 BC Farm Services Ltd. Kumasi 100 GHS 2,850,000 Great Britain Barry Callebaut (UK) Ltd Banbury 100 GBP 3,200,000 Barry Callebaut Beverages UK Ltd Chester 100 GBP 40,000 Barry Callebaut Manufacturing (UK) Ltd Banbury 100 GBP 15,467,852 Greece Barry Callebaut Hellas Single Member SA Athens 100 EUR 25,000 Hong Kong Barry Callebaut Hong Kong Limited Hong Kong 100 HKD 2 India Barry Callebaut India Private Ltd Mumbai 100 INR 292,299,040 Barry Callebaut Cocoa & Chocolate Ingredients India
Private Limited Pune 100 INR 93,546,460
Indonesia P.T. Barry Callebaut Comextra Indonesia Makassar 100 USD 31,460,000 Indonesia P.T. Barry Callebaut Indonesia Bandung 100 IDR 66,213,000,000 P.T. Papandayan Cocoa Industries Bandung 100 USD 40,000,000 Israel Barry Callebaut Israel Ltd Tel Aviv 100 ILS 10
Letter to Shareholders Overview Business Highlights Sustainability Our People Financial Reports Governance
Notes to the Consolidated Financial Statements
Barry Callebaut | Annual Report /
Country Subsidiary Municipality of registration %-owned Currency Capital Italy Barry Callebaut Italia S.p.A. Milano 100 EUR 104,000 Barry Callebaut Manufacturing Italia S.p.A. Milano 100 EUR 2,646,841 Dolphin S.r.l. Milano 100 EUR 110,000 D’Orsogna Dolciaria S.r.l. San Vito Chietino 100 EUR 5,000,000 Japan Barry Callebaut Japan Ltd. Amagasaki 100 JPY 835,000,000 Korea
Barry Callebaut Chocolate Asia Pacific Pte. Ltd., Korea Branch
Seoul
100
KRW
–
Malaysia Barry Callebaut Malaysia Sdn Bhd Petaling Jaya 100 USD 11,119,936 Barry Callebaut Manufacturing Malaysia Sdn Bhd Johor Bahru 100 USD 10,000,000 Barry Callebaut Services Asia Pacific Sdn Bhd Petaling Jaya 100 MYR 500,000 Mexico Barry Callebaut Chocolates, S. de R.L. de CV Nuevo Leon 100 MXN 3,000 Barry Callebaut Cocoa Management Services SA de CV Mexico City 100 MXN 100,000 Barry Callebaut Mexico Distributors SA de CV Escobedo N.L. 100 MXN 108,950,000 Barry Callebaut Mexico, S. de R.L. de CV Monterrey 100 MXN 13,027,200 Barry Callebaut Servicios, SA de CV Mexico City 100 MXN 50,000 DCMX Cocoa, SA de CV Mexico City 100 MXN 1,304,967
Centro de Capacitación Academia de Chocolate México S.A.P.I. de C.V.
Mexico City
100
MXN
10,000
Morocco Barry Callebaut Maroc SARLAU Casablanca 100 MAD 280,000 Nigeria BC Nigeria Cocoa & Chocolate Limited Lagos 100 NGN 10,000,000 Philippines Cocoa Ingredients (Philippines) Inc. Makati City 100 USD 200,000 Poland Barry Callebaut Manufacturing Polska Sp. z o.o. Łódź 100 PLN 10,000,000 Barry Callebaut Polska Sp. z o.o. Łódź 100 PLN 50,000 Barry Callebaut SSC Europe Sp. z.o.o. Łódź 100 PLN 2,000,000 Russia Barry Callebaut NL Russia LLC Moscow-Chekhov 100 RUB 864,510,182 CJSC Inforum-Prom Kasimov 100 RUB 100,000 Barry Callebaut Kaliningrad LLC Kaliningrad 100 RUB 100,000 Serbia Barry Callebaut South East Europe d.o.o. Belgrade 100 RSD 38,460,161 Singapore Barry Callebaut Chocolate Asia Pacific Pte. Ltd Singapore 100 USD 80,121,785 Barry Callebaut Cocoa Asia Pacific Pte Ltd Singapore 100 USD 558,130,230 South Africa Barry Callebaut South Africa (Pty) Ltd Johannesburg 100 ZAR – Spain Barry Callebaut Ibérica SLU Barcelona 100 EUR 25,000 Barry Callebaut Manufacturing Ibérica SA Gurb 100 EUR 987,600 La Morella Nuts SA Castellvell del Camp 100 EUR 344,553 Sweden ASM Foods AB Mjölby 100 SEK 2,000,000 Barry Callebaut Sweden AB Kågeröd 100 EUR 11,428 Tanzania Biolands International Ltd. Moshi 100 TZS 40,000,000 Thailand Barry Callebaut Thailand Company Ltd Bangkok 100 USD 5,000,000 The Netherlands Barry Callebaut Cocoa Netherlands B.V. Zundert 100 EUR 18,000 Barry Callebaut Decorations B.V. Zundert 100 EUR 18,242 Barry Callebaut Nederland B.V. Zundert 100 EUR 21,435,000 Dings-Decor B.V. Nuth 70 EUR 22,689 Hoogenboom Benelux B.V. Zundert 100 EUR 18,152 Turkey Barry Callebaut Eurasia Gida Sanayi Ve Ticaret Ltd. Sti. Istanbul 100 TRL 183,000,000 Uganda Barry Callebaut Est Africa Ltd Kampala 100 UGX – United Arab Emirates
Barry Callebaut Eurasia Gida Sanayi Ve Ticaret Ltd. Sti., Dubai Branch
Dubai
100
AED
–
USA Barry Callebaut North America Holding Inc. Wilmington, DE 100 USD 1,003 Barry Callebaut USA Holding Inc. Wilmington, DE 100 USD 1,001 Barry Callebaut U.S.A. LLC Wilmington, DE 100 USD – Barry Callebaut USA Service Company Inc. Wilmington, DE 100 USD 1,000
1 The following subsidiaries are inactive or in liquidation: Bio United Ltd, GOR Trade LLC, C.J. van Houten & Zoon Holding GmbH, Barry Callebaut Holdings (UK) Ltd., BC Chocodesign Participacoes Ltda., Barry Callebaut Produktions Deutschland GmbH, Barry Callebaut Nigeria, Biopartenaire SA, Barry Callebaut Cocoa USA Inc. and P.T. Barry Callebaut Comextra Indonesia.
Letter to Shareholders Overview Business Highlights Sustainability Our People Financial Reports Governance
Notes to the Consolidated Financial Statements
Barry Callebaut | Annual Report /
Accounting policies
Scope of consolidation/ subsidiaries
The Consolidated Financial Statements of the Group include all the assets, liabilities, income and expenses of Barry Callebaut AG and the companies which it controls. The Group controls an entity when the Group is exposed to, or has rights to, variable returns from its involvement with the entity and has the ability to affect those returns through its power over the entity. Non-controlling interests are shown as a component of equity in the balance sheet, and the share of the net profit attributable to non-controlling interests is shown as a component of the net profit for the year in the Consolidated Income Statement. Newly acquired companies are consolidated from the date control is transferred (the effective date of acquisition), using the acquisition method. Subsidiaries disposed of are included up to the effective date of disposal.
All intragroup balances and unrealized gains and losses or income and expenses arising from intragroup transactions are eliminated in preparing the Consolidated Financial Statements. Unrealized gains arising from transactions with associates and jointly controlled entities are eliminated to the extent of the Group’s interest in the entity. Unrealized losses are eliminated in the same way as unrealized gains, but only to the extent that there is no evidence of impairment.
Letter to Shareholders Overview Business Highlights Sustainability Our People Financial Reports Governance
Notes to the Consolidated Financial Statements
Barry Callebaut | Annual Report /
. Significant shareholders and related parties Significant shareholders The following shareholders hold a participation of more than 3% of the issued share capital of the Group’s ultimate parent Barry Callebaut AG:
as of August 31, 2021 2020 Jacobs Holding AG 30.1% 40.1% Renata Jacobs 5.0% 5.0% BlackRock, Inc.1 3.1% 3.1%
1 Based on notifications through the electronic publication platform of the SIX Swiss Exchange.
Related parties Significant transactions and balances between the Group and related parties are as follows:
in thousands of CHF Nature of cost/revenue 2020/21 2019/20 Other operating expenses charged by related parties (250) (250)
Jacobs Holding AG Management services (250) (250)
as of August 31, 2020/21 2019/20 in thousands of CHF Other payables to related parties 63 117
Jacobs Holding AG 63 117
Compensation of key management personnel The key management personnel is defined as the Board of Directors and the Executive Committee. Key management compensation consists of the following:
in million CHF 2020/21 2019/20 Short-term employee benefits 15.6 14.6 Post-employment benefits 2.3 2.4 Share-based payments 10.2 9.6 Total 28.1 26.6
Further details related to the requirements of the Swiss Transparency law (Art. 663bbis and 663c Swiss Code of Obligations) are disclosed in Notes 2.8, 3.4 and 3.5 in the Financial Statements of Barry Callebaut AG and in the Remuneration Report.
Letter to Shareholders Overview Business Highlights Sustainability Our People Financial Reports Governance
Notes to the Consolidated Financial Statements
Barry Callebaut | Annual Report /
Taxes
. Income taxes
Income tax expense
in thousands of CHF 2020/21 2019/20 Current income tax expenses (76,250) (72,161) Deferred income tax expenses (4,264) 2,950 Total income tax expenses (80,514) (69,211)
Reconciliation of income taxes
in thousands of CHF 2020/21 2019/20 Profit before income taxes 465,019 380,705 Expected income tax expenses at weighted average applicable tax rate (99,245) (70,166) Non-tax deductible expenses (6,193) (8,335) Tax-deductible items not qualifying as an expense under IFRS 28,310 25,685 Tax-exempt income 15,638 10,418 Income recognized for tax declarations purposes only (8,083) (1,606) Prior-period-related items (11,788) 193 Changes in tax rates 1,549 (2) Losses carried forward not yet recognized as deferred tax assets (6,711) (28,261) Tax relief on losses carried forward formerly not recognized as deferred tax assets 6,009 2,863 Total income taxes (80,514) (69,211)
For the reconciliation above the weighted average applicable tax rate was 21.3% in 2020/21 (2019/20: 18.4 %).
The weighted average applicable tax rate has, year-on-year, increased mainly due to changes in the country mix of profit before taxes, that was significantly impacted by COVID-19 in the prior fiscal year, and to a lesser extent by modified corporate tax rates in certain tax jurisdictions. The prior-year income tax expense of CHF 69.2 million includes a one-off, cash-neutral tax expense of CHF 1.0 million resulting from the Swiss tax reform, related to the revaluation of the deferred tax assets and liabilities to the newly enacted cantonal tax rates which became effective as of January 1, 2020. The application of the Swiss tax reform has resulted in the recognition of a deferred tax income of CHF 12.8 million in 2020/21 (2019/20: CHF 9.4 million).
The Group’s effective tax rate in 2020/21 is 17.3% (2019/20: 17.9% excluding the one-off deferred tax impact related to the Swiss tax reform).
The tax relief on losses carried forward previously not recognized as deferred tax assets of CHF 6.0 million (2019/20: CHF 2.9 million) consists of CHF 5.9 million tax relief of utilization on tax losses carried forward previously not recognized (2019/20: CHF 2.9 million) and CHF 0.1 million of tax losses recognized for the first time in 2020/21 (2019/20: CHF 0.0 million).
Letter to Shareholders Overview Business Highlights Sustainability Our People Financial Reports Governance
Notes to the Consolidated Financial Statements
Barry Callebaut | Annual Report /
. Deferred tax assets and liabilities
Movement in deferred tax assets and liabilities
Inventories
Property, plant,
equipment/ intangible
assets
Other assets
Provisions
Other liabilities
Tax loss carry-
forwards
Total
in thousands of CHF as of September 1, 2019 11,197 (78,885) 22,377 (609) 24,878 27,628 6,586 Charged to the income statement (1,654) (17,919) 11,050 (956) 13,845 (1,416) 2,950 Recognized in other comprehensive income – – (23) 2 (4,726) – (4,747) Effect of disposals – (1,882) 1 – (165) 51 (1,995) Currency translation effects (511) 4,388 (2,476) 63 457 (1,168) 753 as of August 31, 2020 9,032 (94,298) 30,929 (1,500) 34,289 25,095 3,547 as of September 1, 2020 9,032 (94,298) 30,929 (1,500) 34,289 25,095 3,547 Charged to the income statement (6,336) (43,264) 22,520 735 12,963 9,118 (4,264) Recognized in other comprehensive income – – (2,154) – (5,716) – (7,870) Effect of disposals – 28 (28) – (1) – (1) Currency translation effects 35 (1,758) 1,038 (25) (613) 785 (538) as of August 31, 2021 2,731 (139,292) 52,305 (790) 40,922 34,998 (9,126)
For fiscal year 2020/21, deferred tax expense recognized in other comprehensive income amounted to CHF 7.9 million (2019/20: deferred tax expense CHF 4.7 million), and this relates to remeasurement of defined benefit plans of CHF 2.7 million (2019/20: deferred tax expense of CHF 1.9 million) and to cash flow hedging reserves CHF 5.2 million (2019/20: deferred tax expense of CHF 2.8 million). Recognized deferred tax assets and liabilities The recognized deferred tax assets and liabilities, without setoff of balances within the same tax jurisdiction, are attributable to the following:
as of August 31, 2021 2020 in thousands of CHF Assets Liabilities Net Assets Liabilities Net Inventories 14,003 (11,272) 2,731 19,289 (10,257) 9,032 Property, plant and equipment/intangible assets
Letter to Shareholders Overview Business Highlights Sustainability Our People Financial Reports Governance
Notes to the Consolidated Financial Statements
Barry Callebaut | Annual Report /
For fiscal year 2020/21, deferred tax assets amounting to CHF 0.0 million (2019/20: CHF 11.5 million) were recognized that are depending on future taxable profits in excess of existing taxable temporary differences for entities which suffered fiscal losses in the current period. Such fiscal losses in prior fiscal year 2019/20 were fully resulting from the economic impact of the COVID-19 crisis and did not recur in fiscal year 2020/21. Tax losses carried forward excluded from recognition of related deferred tax assets Tax losses carried forward not recognized as deferred tax assets have the following expiry dates:
as of August 31, 2021 2020 in thousands of CHF Expiry: Within 1 year 51 683 After 1 up to 2 years 1,020 114 After 2 up to 3 years 1,039 1,095 After 3 up to 10 years 11,120 6,733 After 10 years 305 241 Unlimited 376,287 406,955 Total unrecognized tax losses carried forward 389,822 415,821
Tax losses carried forward utilized during the year 2020/21 were CHF 38.7 million (2019/20: CHF 41.0 million). The related tax relief amounted to CHF 10.5 million, of which CHF 4.6 million were already recognized as a deferred tax asset in the previous year (2019/20: CHF 7.3 million of which CHF 4.4 million were already recognized as a deferred tax asset in the previous year) and CHF 5.9 million that were previously not recognized (2019/20: CHF 2.9 million).
As at August 31, 2021, the Group had unutilized tax losses carried forward of approxi-mately CHF 531.1 million (2019/20: approximately CHF 516.7 million) available for offset against future taxable income.
Of the total tax losses carried forward, an amount of CHF 141.2 million has been recognized for deferred taxation purposes resulting in a deferred tax asset of CHF 35.0 million (2019/20: CHF 100.9 million recognized resulting in a deferred tax asset of CHF 25.1 million). The net increase of CHF 9.9 million in the deferred tax asset on recognized tax losses carried forward consists of CHF 13.7 million recognition of current year tax losses carried forward, CHF 4.6 million decrease resulting from utilization of tax losses already recognized as a deferred tax asset in prior year, CHF 0.0 million increase due to tax rate changes and CHF 0.8 million increase relating to currency translation adjustments.
Letter to Shareholders Overview Business Highlights Sustainability Our People Financial Reports Governance
Notes to the Consolidated Financial Statements
Barry Callebaut | Annual Report /
Accounting policies
Taxes Current income taxes are recognized based on taxable income, whereas other taxes such as non-recoverable taxes withheld on management fees and royalties received or paid are reported under “Other expenses”. Non-recoverable withholding taxes are only accrued if distribution by subsidiary companies is foreseen.
Income taxes are calculated in accordance with the tax regulations in effect in each country.
Current and deferred tax liabilities and assets for uncertain tax positions according to IFRIC 23 are considered based on the probability of the related uncertain tax positions and measured based on the single most probable outcome or the weighted average expected outcome of the uncertain tax positions.
The Group determines the expected income tax rate by weighing the applicable tax rates in the jurisdictions concerned based on the profit before taxes per jurisdiction.
The applicable expected tax rate per company is the domestic corporate income tax rate applicable to the profit before taxes of the company for the respective fiscal year.
Deferred income taxes are recognized using the balance sheet liability method. Deferred income tax applies to all temporary differences arising between the tax values of assets and liabilities and their values in the Consolidated Financial Statements.
The recoverability of deferred tax assets is assessed based on the availability of sufficient fiscal profitability in the future to absorb the future tax deduction of the related temporary differences or the related tax losses carried forward.
Deferred tax liabilities related to the investments in subsidiaries and joint ventures are not recognized to the extent the Group is able to control the timing of the reversal of these temporary differences and it is probable that these temporary differences will not reverse in the foreseeable future.
Letter to Shareholders Overview Business Highlights Sustainability Our People Financial Reports Governance
Notes to the Consolidated Financial Statements
Barry Callebaut | Annual Report /
Other Disclosures
. Other accounting policies Foreign currency transactions The functional currency of the Group’s entities is the currency of their primary economic environment. In individual companies, transactions in foreign currencies are recorded at the rate of exchange at the date of transaction.
Monetary assets and liabilities denominated in foreign currencies are translated into respective functional currencies at the exchange rate prevailing at the reporting date. Any resulting exchange gains and losses are taken to the income statement. If related to commercial transactions or to the measurement of financial instruments in coverage of commercial transactions, such foreign currency gains and losses are classified as Cost of goods sold. Otherwise, foreign currency gains and losses are classified as Finance income and Finance expense.
Foreign currency translation For consolidation purposes, assets and liabilities of subsidiaries reporting in currencies other than Swiss francs are translated to Swiss francs at reporting date rates of exchange. Income statement and cash flow statement are translated at the average rates of exchange for the period. Differences arising from the translation of financial statements using the above method are recorded as cumulative translation adjustments in other comprehensive income. When a foreign operation is disposed of, such that control, significant influence or joint control is lost, the cumulative amount in the translation reserve is reclassified to the Consolidated Income Statement as part of the gain or loss on disposal.
Government grants Provided there is reasonable assurance that they will be irrevocably received, grants relating to capital expenditure are deducted from the cost of property, plant and equipment and thus recognized in the Consolidated Income Statement on a straight-line basis over the useful life of the asset.
Other grants that compensate the Group for expenses incurred are deferred and recognized in the Consolidated Income Statement over the period necessary to match them with the costs they are intended to compensate.
Letter to Shareholders Overview Business Highlights Sustainability Our People Financial Reports Governance
Notes to the Consolidated Financial Statements
Barry Callebaut | Annual Report /
. Subsequent events ECC Group acquisition On June 24, 2021, Barry Callebaut announced the acquisition of two related companies, Europe Chocolate Company NV (ECC), a privately owned manufacturer of chocolate specialties and decorations and Flanders Quality Machines NV (FQM), a privately owned manufacturer of machinery for chocolate specialties and decorations. The companies began manufacturing specialty chocolate ingredients in 1993. They collectively operated a chocolate factory and a warehouse in Malle, Belgium, and employed about 70 people. The transaction, subject to several closing conditions, was successfully closed on September 1, 2021, and the Group acquired 100% of outstanding shares of the two companies.
This strategic acquisition expanded the Group's value-adding specialties capabilities, allowing Barry Callebaut to cater to the increasing demand of Food Manufacturers for highly customized specialty chocolate and decorations and expanded its specialized chocolate molding capabilities by allowing the Group to offer tailor-made solutions thanks to the advanced in-house developed technology.
The purchase consideration was composed of an upfront payment and deferred consideration based on the achievement of performance conditions. The upfront payment of CHF 22.4 million was paid on September 1, 2021 and is subject to customary purchase price adjustments. The acquisition-related costs amount to CHF 0.2 million, were expensed in current fiscal year and included in “Other expenses”.
The purchase price allocation could not be completed nor could a reasonable estimate be made since the final measurement of the assets and liabilities is still in progress.