1 Constellation Energy Q2 2007 Earnings Presentation July 27, 2007 Kevin Hadlock: Good morning everyone. I am Kevin Hadlock, Vice President of Investor Relations for Constellation Energy. Welcome to our second quarter 2007 earnings call. Thank you for joining us today. Turning to slide 2…
Transcript
1
Constellation EnergyQ2 2007 Earnings Presentation
July 27, 2007
Kevin Hadlock:
Good morning everyone. I am Kevin Hadlock, Vice President of Investor Relations for Constellation Energy. Welcome to our second quarter 2007 earnings call. Thank you for joining us today.
Turning to slide 2…
2
2
Forward-looking Statements DisclaimerCertain statements made in this presentation are forward-looking statements and may contain words such as “believes,” “anticipates,” “expects,”“intends,” “plans,” and other similar words. We also disclose non-historical information that represents management’s expectations, which are based on numerous assumptions. These statements are not guarantees of future performance and are subject to risks and uncertainties that could cause actual results to be materially different from projected results. These risks include, but are not limited to: the timing and extent of changes in commodity prices for energy including coal, natural gas, oil, electricity, nuclear fuel, and emissions allowances; the timing and extent of deregulation of, and competition in, the energy markets, and the rules and regulations adopted on a transitional basis in those markets; the conditions of the capital markets, interest rates, availability of credit, liquidity and general economic conditions, as well as Constellation Energy’s and BGE’s ability to maintain their current credit ratings; the ability to attract and retain customers in our competitive supply activities and to adequately forecast their energy usage; the effectiveness of Constellation Energy’s and BGE’s risk management policies and procedures and the ability and willingness of our counterparties to satisfy their financial and other commitments; the liquidity and competitiveness of wholesale markets for energy commodities; uncertainties associated with estimating natural gas reserves, developing properties and extracting gas; operational factors affecting the operations of our generating facilities (including nuclear facilities) and BGE’s transmission and distribution facilities, including catastrophic weather-related damages, unscheduled outages or repairs, unanticipated changes in fuel costs or availability, unavailability of coal or gas transportation or electric transmission services, workforce issues, terrorism, liabilities associated with catastrophic events, and other events beyond our control; the inability of BGE to recover all its costs associated with providing customers service; the effect of weather and general economic and business conditions on energy supply, demand, and prices; regulatory or legislative developments that affect deregulation, transmission or distribution rates, demand for energy, or that would increase costs, including costs related to nuclear power plants, safety, or environmental compliance; the ability of our regulated and non-regulated businesses to comply with complex and/or changing market rules and regulations; the actual outcome of uncertainties associated with assumptions and estimates using judgment when applying critical accounting policies and preparing financial statements, including factors that are estimated in applying mark-to-market accounting, such as the ability to obtain market prices and in the absence of verifiable market prices, the appropriateness of models and model impacts (including, but not limited to, extreme contractual load obligations, unit availability, forward commodity prices, interest rates, correlation and volatility factors); changes in accounting principles or practices; losses on the sale or write-down of assets due to impairment events or changes in management intent with regard to either holding or selling certain assets; our ability to successfully identify and complete acquisitions and sales of businesses and assets; and cost and other effects of legal and administrative proceedings that may not be covered by insurance, including environmental liabilities. Given these uncertainties, you should not place undue reliance on these forward-looking statements. Please see our periodic reports filed with the SEC for more information on these factors. These forward-looking statements represent estimates and assumptions only as of the date of this presentation, and no duty is undertaken to update them to reflect new information, events or circumstances.
Before we begin our presentation, let me remind you that our comments today will include forward-looking statements, which are subject to certain risks and uncertainties.
For a complete discussion of these risks, we encourage you to read our documents on file with the SEC.
Our presentation today is being webcast, and the slides are available on our website, which you can access at constellation.com under Investor Relations.
Moving to slide 3…
3
3
Use of Non-GAAP Financial MeasuresConstellation Energy presents adjusted earnings per share (adjusted EPS) in addition to its reported earnings per share in accordance with generally accepted accounting principles (reported GAAP EPS). Adjusted EPS is a non-GAAP financial measure that differs from reported GAAP EPS because it excludes the cumulative effects of changes in accounting principles, discontinued operations, special items (which we define as significant items that are not related to our ongoing, underlying business or which distort comparability of results) included in operations, the impact of certain economic, non-qualifying hedges, and synfuel earnings. The mark-to-market impact of economic non-qualifying hedges is significant to reported results, but economically neutral to the company in that offsetting gains or losses on underlying accrual positions will be recognized in the future. Synfuel earnings are excluded due to the potential for oil price volatility to result in a difficult-to-forecast phase-out of tax credits. We present adjusted EPS because we believe that it is appropriate for investors to consider results excluding these items in addition to our results in accordance with GAAP. We believe this measure provides a picture of our results that is comparable among periods since it excludes the impact of items such as workforce reduction costs or gains and losses on the sale of assets, which may recur occasionally, but tend to be irregular as to timing, thereby distorting comparisons between periods. However, investors should note that this non-GAAP measure involves judgment by management (in particular, judgment as to what is classified as a special item or an economic, non-qualifying hedge to be excluded from adjusted earnings). This non-GAAP measure is also used to evaluate management's performance and for compensation purposes. Constellation Energy also provides its earnings guidance in terms of adjusted EPS. Constellation Energy is unable to reconcile its guidance to GAAP earnings per share because we do not predict the future impact of special items, economic, non-qualifying hedges or synfuel earnings due to the difficulty of doing so. The impact of special items, economic, non-qualifying hedges, or synfuel earnings could be material to our operating results computed in accordance with GAAP. We note that such information is not in accordance with GAAP and should not be viewed as an alternative to GAAP information. A reconciliation of Non-GAAP information to GAAP information is included either on the slide where the information appears or on one of the slides in the Non-GAAP Measures section provided at the end of the presentation. Please see the Summary of Non-GAAP Measures included to find the appropriate GAAP reconciliation and its related slide(s). These slides are only intended to be reviewed in conjunction with the oral presentation to which they relate.
We will use Non-GAAP financial measures in this presentation to help you understand our operating performance.
We have attached an Appendix to the charts on the website reconciling Non-GAAP measures to GAAP measures.
With that, I would like to turn the time over to Mayo Shattuck, Chairman, President and CEO of Constellation Energy…
4
4
Q2 2007 Adjusted EPS Summary
$0.55 - $0.75Q2 Earnings Guidance (3)
0.01(0.07)Synfuel Earnings (1)
$0.45$0.64Adjusted Earnings (2)
(1) Represents synfuel earnings of $0.14 per share and expected synfuel phase-out risk of $0.07 per share in Q2’07(2) Excludes special items, certain economic, non-qualifying hedges and synfuel earnings(3) Excludes estimated synfuel earnings of $0.14 per share and estimated synfuel phase-out risk of $0.07 per share See Appendix
(0.08)0.08Special Items
0.00(0.01)(Gain)/Loss on Economic Non-Qualifying Hedges
$0.52$0.64GAAP Earnings
Q2 2006Q2 2007($ per share)
Thank you, Kevin.
Good morning everyone and thank you for joining us today. Our reported earnings were in line with our expectations and our underlying fundamental performance was even stronger. We recorded adjusted earnings of 64 cents per share, in-line with our guidance range of 55 cents to 75 cents per share and 19 cents above the second quarter of 2006. Adjusted earnings include a loss of 14 cents per share due to the timing impact of qualifying hedges that were required to be marked to market in the quarter. These hedge losses are expected to reverse in future periods, with a significant portion reversing during the balance of 2007. Adding back the timing impact of the mark-to-market losses associated with the hedges, our second quarter results would have exceeded the upper end of our guidance range, reflecting continued strong performance from our Merchant business.
Turning to slide 5…
5
5
Climate Change and Evolving Energy Markets
• Taking an active stance in the climate change debate– Imperative to slow, stop, then reverse growth of greenhouse gas
emissions– Support mandatory economy-wide controls and a cap on carbon
emissions that would create a global market for carbon trading
• Existing carbon footprint is relatively advantageous• Substantial opportunity to assist large customer base in
achieving sustainability objectives• Most significant contribution would be deployment of new
nuclear fleet
I want to take this opportunity to talk about Constellation’s perspective regarding climate change and evolving environmental policy. It is increasingly clear that most of the significant business decisions we face—and many of the greatest opportunities we see in the future—are affected by the probability of greenhouse gas controls. We are taking an active stance in the policy debates occurring at the state, federal and international levels. We believe it is imperative to slow, stop, then reverse the growth of greenhouse gas emissions. We support mandatory, economy-wide controls and a cap on carbon emissions that would create a global market for carbon trading.
Today, we have a relatively advantageous carbon footprint. We own about 8,700 megawatts of generation capacity, with more than 60% of the output coming from nuclear and hydro. As a price for carbon begins to be reflected in the market through voluntary compliance or a cap-and-trade program, we will be well positioned.
With the expanded focus on environmental stewardship, we see substantial opportunities to assist our large customer base in achieving their sustainability objectives. Many of our customers are seeking products to manage their carbon exposure or to meet other renewable energy objectives. While still in its formative stage, we are providing products to our customers to help them meaningfully reduce their demand and tap into “green” energy products. The fact that we have a wide array of businesses and assets—high quality, low-emitting generation plants, industry leading, customer-focused competitive supply businesses, and a regulated utility—provides a strong platform for Constellation Energy to offer an expansive set of environmentally friendly energy products to our customers.
While we are excited by these customer opportunities, perhaps the most significant contribution Constellation can make would be to deploy the first standardized fleet of new nuclear power plants in almost three decades. We took a significant step towards this objective last week with the announcement of the strategic joint venture with EDF, which I will talk about in a few minutes.Turning to slide 6…
6
6
Responding to Demand for Clean Energy ProductsEnvironmentally Sensitive
and Responsive
– More than 60% of current output sourced from ultra-low emitting nuclear and hydro sources
– Installing flue gas desulphurization (FGD) scrubber at Brandon Shores
– Provide products to assist customers in meeting sustainability objectives
– Assisting new sources of supply by providing a market or managing risk
– Providing customers with tools to manage energy consumption and cost
Positioned to Adapt to Market Evolution
– Existing fleet is strategically positioned in location and fuel type
– Evaluating potential to build new plants and re-open retired generation capacity in MD
– Pursuing deployment of new nuclear fleet
– Manage demand response on behalf of customers
– Ability to leverage large customer base to provide new products
– Active in key environmentally-focused energy markets—CO2, SO2, NOX, and low-emissions coal
– Potential for advanced meters and demand-side management with utility customers
Supply – Generation
Demand –Commodities Group, NewEnergy, BGE
Today, our businesses are environmentally sensitive, and we are proactively moving to improve our position. We are proud to have one of the lowest emitting generation fleets, with more than 60% of our megawatt hours coming from ultra low-emitting nuclear and hydro sources. In the second quarter, we announced the start of construction on the Brandon Shores scrubber that will substantially reduce SO2 and Mercury emissions from the plant. Looking to the future, our generation fleet is strategically positioned in location and fuel type to benefit from the changing environment.
Our customer-focused businesses are actively engaged on the demand side. Our retail businesses are seeing increasing demand for sustainability products, and we are modifying our product offerings to meet these needs. At the Commodities Group, we are active in emissions trading in CO2, SO2, and NOx and in providing emissions products to our customers, including emissions credits and low-emissions coal. We are contracting with renewable energy providers to secure renewable energy credits to supply our customers. Earlier this week, we announced the signing of an 18-year renewable energy power purchase agreement for about 200 MWs with a wind project to be constructed in Illinois. This project should help Illinois meet its recently announced wind energy goals and provides us with an attractive long-term “green” commodity resource. At Constellation Energy Projects and Services, we operate several large renewable energy projects and are developing more than 20 additional projects including solar, geothermal, biomass and wind resources.
At BGE we are fast-tracking a SMART Energy Savers program to provide our customers with the tools and incentives to better understand their energy usage through advanced metering and conservation programs and to reduce demand in times of peak load.
By leveraging our large customer base and understanding their requirements, we expect to capitalize on the evolution of the market.Moving to side 7…
7
7
Growing Sustainable Energy Solutions
Demand Response
200
485217
217
0
200
400
600
800
2006 2007E
Meg
awat
ts
NewEnergy BGE
Renewable Energy Credits Delivered to Customers
3.4 3.2
0.2 0.6
0
1
2
3
4
2006 2007E
Mil
lion
s
Commodities NewEnergy
This chart quantifies some of the sustainable energy metrics that we follow. We believe demand response is more than just a reliability product, because it reduces energy consumption and the associated greenhouse gas emissions. We estimate we will serve over 700 megawatts of demand response during 2007, an increase of 68% over 2006.
In 2007, we expect to deliver more than 3.8 million renewable energy credits to wholesale and retail customers, and we see significant potential growth due to new programs in in states like Illinois, as well as, increasing interest in voluntary offsets in other states.
We believe this is just the beginning and expect our role of providing sustainable energy solutions to customers will increase significantly in the coming years.
Turning to slide 8…
8
8
Leading the North American New Nuclear Renaissance
• Constellation and EDF forming 50/50 joint venture for new nuclear development– EDF will make initial investment of
$350 million in UniStarSubsequent potential contributions of up to $275 million upon reaching certain milestones
– CGG will contribute UniStar businesses and right to develop new nuclear plants at CEG’s existing sites
• EDF may purchase in the open market up to 9.9% of outstanding CEG common stock over next five years
• Furthers Constellation’s leadership to drive potential nuclear renaissance in North America
• Builds scale in design, materials procurement and operations
• Provides access to technical expertise of world leader in nuclear operations
• Manages and reduces Constellation’s financial risks associated with licensing and development of new nuclear plants
Transaction Summary Strategic Rationale
We are increasingly excited about the potential customer opportunities presented by the move to a sustainable energy marketplace, however, we believe the most significant contribution we can make is to pursue the option to deploy a fleet of new nuclear plants in the U.S. We recognized years ago that Constellation had an opportunity to assume a leadership position in new nuclear technology.
As many of you are aware, last week we announced a 50/50 joint venture that we are forming with EDF, the world’s largest nuclear plant operator, solidifying our leadership position. The new company, UniStar Nuclear Energy, will focus on the potential development and deployment of the first fleet of new nuclear power plants in the United States and Canada in nearly three decades.
Initially, EDF will invest $350 million in UniStar Nuclear Energy and Constellation will contribute the UniStar line of businesses we have developed over the past two years. Upon reaching certain milestones, EDF will contribute up to an additional $275 million. In connection with this strategic alliance, EDF may purchase up to 9.9% of Constellation’s outstanding common stock in the open market during the next five years, with a limit of 5% ownership during the first 12 months of the agreement.
Our partnership with EDF is a big step in furthering Constellation’s ability to drive a potential nuclear renaissance in North America, a goal we have been working towards with AREVA. Adding EDF’s knowledge and capabilities to the business model will solidify UniStar Nuclear Energy’s position as the leading new nuclear development team in the U.S. Lastly, this relationship manages and reduces Constellation Energy’s financial risks associated with licensing and developing new nuclear plants.
Turning to slide 9…
9
9
Poised to Succeed in 2007 and Beyond• Clear and substantial earnings growth
– Reaffirming guidance of $5.25 to $5.75 per share for 2008– Projecting 21% to 26% compound annual growth from 2006 through 2008– Forecasting 2009 earnings growth of more than 10% over projected 2008 earnings
• Constellation has delivered superior results over the past five years– Predictably and consistently delivered on earnings guidance through a variety of
market conditions– Disciplined focus on managing through the full commodity cycle
• Our strong market position will enable us to take advantage of developing market opportunities– High-quality assets in high value markets– Market-leading position in power and strong presence in gas and coal markets– Industry-leading risk management capabilities and disciplined investment approach– Strong balance sheet
See Appendix
Before I turn the call over to John, let me summarize the investment thesis in Constellation Energy. First, we see clear and substantial earnings growth in the coming years. We are reaffirming guidance for 2008 of $5.25 to $5.75 per share, representing 21% to 26% compound annual earnings growth from 2006 through 2008. We are forecasting 2009 earnings growth of more than 10% over projected 2008 earnings.
Second, we believe this market environment is very attractive and our team is well positioned to capture the opportunities presented by the market. Constellation’s management team has delivered superior results over the past five years. We have predictably and consistently delivered on earnings guidance through a variety of market conditions. Our disciplined focus on managing through the full commodity cycle has allowed us to perform well in both up and down commodity price environments and has held the company in good stead.
Third, as we look to the future, we feel like we are just getting started. Today we have a solid foundation built upon a well-managed, high quality asset base. Our focus on customers and market-leading position in power and our strong position in gas and coal markets continue to give us an information edge and scale advantage over our competitors. Our industry-leading risk management capabilities and our disciplined investment approach help us to make sound investments and optimize their value. Finally, our strong balance sheet provides us the financial flexibility to act quickly to capture opportunities.
Before I hand off to John Collins, I want to note that john has been participating in these earnings calls with me for six years, but right now he’s being handed the microphone as our CFO for the first time. For the past six years, John has been our Chief Risk Officer, and previously he was the Principal Financial Officer for our commodities group. We’re every proud of the risk management systems, which John has been instrumental in constructing, and equally proud of the finance organization, which Follin Smith built and which John Collins inherits. One of the hallmarks of this company is its disciplined approach to the allocation and management of its capital base, and we are pleased to have someone of John’s caliber to continue that commitment. So with that, John, I’ll hand it over to you.
10
Financial Overview
John R. CollinsExecutive Vice President,
Chief Financial Officer, and Chief Risk Officer
Thank you Mayo, and good morning everyone.
Let’s begin on slide 11…
11
11
Q2 2007 Highlights
• Delivered strong earnings growth driven by strong Merchant performance
• Transitioned most of BGE’s residential customers in Maryland to market rates– Only 4% opted to continue deferring increase until January 1,
2008
• Completed $623 million rate deferral securitization
• Began construction on Brandon Shores scrubber
We had a strong second quarter marked by continued earnings growth in the Merchant businesses. The generation fleet performed well as we continue to transition to current market prices.
During the quarter, most of BGE’s residential electric customers in Maryland transitioned to market rates. Earlier this year, the Maryland Public Service Commission approved an opt-in plan for customers to defer the transition to full market rates until January 1, 2008. Only 4% of BGE’s residential electric customers opted into this plan, while theremaining 96% moved to full market rates on June 1. This is consistent with the results of other Maryland utilities that have transitioned to market prices and whose rates are comparable to BGE’s residential customers’ rates.
In addition, we completed the securitization for the initial rate stabilization plan approved by the PSC last year. We issued $623 million in rate stabilization bonds that are supported by a non-bypassable charge on customer bills over a 10-year period.
We are also moving forward with the planned environmental upgrades on our coal-fired power plants. In connection with these projects, we expect to spend approximately $1.1 billion through 2010 consistent with previous estimates. Last month, we began construction on the Brandon Shores Scrubber project. This project illustrates our continued commitment to invest in the latest clean air technology and significantly reduces our SO2 and Mercury emissions.
Turning to slide 12…
12
12
Q2 2007 Earnings Summary
42%$0.19$0.45$0.64Adjusted Earnings (2)
N.M.(0.02)0.020.00Other Non-regulated(27%)(0.03)0.110.08Utility75%$0.24$0.32$0.56Merchant%EPSQ2 2006Q2 2007($ per share)
ChangeAdjusted Earnings
0.00(0.01)(Gain)/Loss on Economic Non-Qualifying Hedges
$0.45$0.64Adjusted Earnings (2)
$0.55 - $0.75Q2 Earnings Guidance (3)
(0.08)0.08Special Items
0.01(0.07)Synfuel Earnings (1)
$0.52$0.64GAAP EarningsQ2 2006Q2 2007($ per share)
(1) Represents synfuel earnings of $0.14 per share and expected synfuel phase-out risk of $0.07 per share in Q2’07(2) Excludes special items, certain economic., non-qualifying hedges and synfuel earnings(3) Excludes estimated synfuel earnings of $0.14 per share and estimated synfuel phase-out risk of $0.07 per share See Appendix
For the second quarter, our adjusted earnings were 64 cents per share, including the earnings timing issues related to qualifying hedges we were required to mark to market in the quarter. This is in the middle of our guidance range of 55 to 75 cents per share. GAAP EPS was 64 cents. Let me walk you through the adjustments to GAAP in the second quarter of 2007.
• We had 8 cents related to special items. Included in this amount was a 7-cent charge related to a wind investment in western Maryland that we acquired from FPL in connection with the merger termination. We decided not to pursue this project as an equity investor. We also had a 1-cent special item related to the work-force reduction at Nine Mile Point.
• We had a 1 cent gain on economic, non-qualifying hedges associated with gas transport, which we subtract from GAAP EPS.
• Lastly, Synfuel EPS was 7 cents in the quarter. As you’ll remember, we call out synfuel earnings separately since the synfuel tax credit program expires at the end of this year and the fact that synfuel earnings vary with oil prices.
Overall, adjusted earnings per share were up 19 cents year-over-year. The Merchant was up 24 cents; the Utility was down 3 cents, and Other Non-regulated was down 2 cents.
Turning to slide 13…
13
13
$0.04 - $0.08$0.08Adjusted Earnings
GuidanceActual
Q2 2007Adjusted Earnings vs. Guidance($ per share)
BGE
($0.03)
Change
$0.11$0.08Adjusted Earnings
Q2 2006Q2 2007
Adjusted Earnings vs. Prior Year ($ per share)
See Appendix
BGE earned 8 cents of adjusted EPS in the quarter, down 3 cents per
share from the second quarter of 2006, driven by the loss of nuclear
decommissioning revenues due to Senate Bill 1 and other inflationary costs,
partially offset by higher electric volumes due to customer growth and a return
to more normal weather after a mild second quarter in 2006.
Turning to slide 14…
14
14
$0.50 - $0.70$0.56Adjusted Earnings
GuidanceActual (1)
Q2 2007Adjusted Earnings vs. Guidance($ per share)
Merchant
-5¢ Loss of CTC Revenue+11¢ Lower Net Interest Expense
-3¢ Other(1) Excludes special items, certain economic, non-qualifying hedges and synfuel earnings (2) Excludes mark-to-market impacts of qualifying hedgesSee Appendix
-18¢ MTM Impacts of Qualifying Hedges+31¢ Fleet Price
Variance Primarily Due to:
$0.24$0.32$0.56Adjusted Earnings (1)
ChangeQ2 2006Q2 2007Adjusted Earnings vs. Prior Year($ per share)
The Merchant segment’s adjusted earnings were 56 cents per share, compared to our guidance range of 50 cents to 70 cents per share. Compared to the second quarter of last year, the Merchant segment was up 24 cents per share. The generation fleet drove an increase of 31 cents per share as it continues to transition to market prices. Wholesale Competitive Supply increased 13 cents per share due to higher backlog realization. Net interest expense was down 11 cents per share due to lower net debt following the sale of our gas-fired generation plants in December 2006.
Second quarter results include 18 cents per share of losses associated with qualifying hedges that were required to be marked to market, of which approximately 14 cents is pure timing. These hedge losses are expected to reverse in future periods, with a significant portion reversing in the second half of 2007. Adding back the timing impact of these losses, the Merchant segment would have exceeded the top of the guidance range. In addition, Retail Competitive Supply results declined 5 cents per share in part due to mark-to-market losses on economic hedges of accrual positions. The 5-cent loss of competitive transition charge collections in Maryland and 3 cents of other costs also created a negative year-over-year variance. Turning to slide 15…
15
15
Wholesale Competitive Supply Highlights• Completed acquisition of Progress Ventures portfolio
– Received $346 million cash payment
– Acquired full requirements contracts with electric cooperatives in Georgia with a peak load of 3,100 MWs
– Assumed tolling contracts to support load
• Successfully executing on our natural gas strategy- Commodities Group has acquired
103 bcfe(1) of proved reserves for $212 million (YTD)
- Constellation Energy Partners has acquired 136(2) bcfe of proved reserves for $355 million (YTD)
Portfolio Development
Harvest
Strategic Investment
Upstream Investment Strategy
(1) Internal estimate(2) Comprised of 93 bcfe non-SEC reserves (AMVEST Osage, Inc.) and 43 bcfe SEC reserves (EnergyQuest)
In wholesale competitive supply, we completed the acquisition of the Progress Ventures portfolio and received cash proceeds of $346 million. In the transaction, the commodities group assumed full requirements contracts to serve electric cooperatives in Georgia and assumed tolling contracts that support the load. This transaction represents an opportunity for us to grow the wholesale competitive business in the Southeast , where we have had good initial success to date and where we see additional opportunities.
We also continue to execute on our natural gas strategy. Year-to-date, the Commodities Group has acquired 103 bcfe of proved reserves for $212 million and Constellation Energy Partners, where we have an equity ownership of about 30%, has acquired 136 bcfe of proved reserves for $355 million. We continue to look for opportunities to harvest and deploy capital in upstream gas at attractive returns.
As we’ve told you previously, our objective is to build a portfolio of strategically connected gas producing assets that leverage our risk management and valuation capabilities. Our focus is on properties primarily in early stage development where we can develop the assets for future opportunities to harvest the properties and redeploy the capital. As we move forward, we will continue to pursue attractive economic opportunities in our upstream gas business. At the same time, we will look for opportunities to realize returns from the portfolio by monetizing investments after enhancing their value, including pursuing possible opportunities with CEP as properties mature and have a production profile more suitable for an MLP.
Moving to slide 16…
16
16
Wholesale Competitive Supply (1)
New Business
(51%)(88)17486Total New Business Realized (2)
(1) Excludes special items, certain economic, non-qualifying hedges and synfuel results(2) Includes power, gas (non-project), and coal gross margin and gas project margin (project revenue less operating, depreciation, depletion and interest expenses incurred at
the project level). Including gas project-level expenses of $23 million in Q2 2007 and $16 million in Q2 2006, total wholesale competitive supply gross margin in Q2 2007 and Q2 2006 was $229 million and $262 million, respectively.
See Appendix
(98)14446Portfolio Management & Trading
(16%)($40)$246$206Total Contribution Margin (2)
103040Originated & Realized (2)
67%$48$72$120Total Already Originated Business (2)
%$Q2 2006Q2 2007
Change($ in millions)
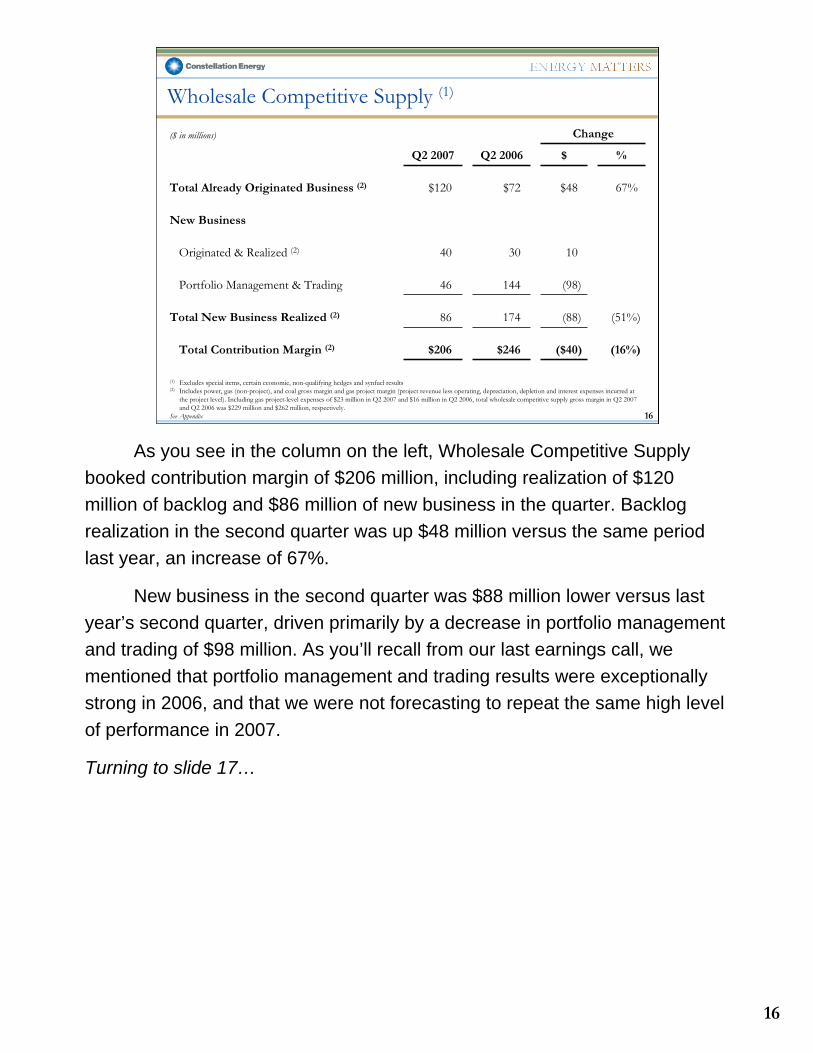
As you see in the column on the left, Wholesale Competitive Supply booked contribution margin of $206 million, including realization of $120 million of backlog and $86 million of new business in the quarter. Backlog realization in the second quarter was up $48 million versus the same period last year, an increase of 67%.
New business in the second quarter was $88 million lower versus last year’s second quarter, driven primarily by a decrease in portfolio management and trading of $98 million. As you’ll recall from our last earnings call, we mentioned that portfolio management and trading results were exceptionally strong in 2006, and that we were not forecasting to repeat the same high level of performance in 2007.
Turning to slide 17…
17
17
Wholesale Competitive Supply: Origination
$536$469Current Year Plan
$309
113
$196
Q2 2006
$308
186
$122
Q2 2007
(1) Includes power, gas (non-project), and coal gross margin and gas project margin (projected revenue less operating, depreciation, depletion and interest expenses incurred at the project level)
$908$1,026Total Origination Plan (including future years)
78%78%% of Total Origination Plan Achieved
79%49%% of Current Year Plan Achieved
Total Wholesale Competitive Supply Origination Value to be Realized (1)
284567Future Years
$707$798Total Originated
$423$231Current Year
To Be Realized In:
1H 20061H 2007($ in millions)
This chart gives you the full picture of Wholesale Competitive Supply performance, because it shows the earnings added to the backlog during the quarter. We add backlog when we originate new transactions or restructure existing ones; we also reflect the value of actions taken to increase the future value of coal and downstream gas transactions in our portfolio. On the “total originated” line in the center of the chart you see that the Commodities Group originated new business gross margin of $308 million in the second quarter, compared to $309 million for the same period last year. Looking at the components, we originated $122 million of business to be realized this year, versus $196 million in last year’s second quarter. We also originated $186 million to be realized in future years versus $113 million in the second quarter last year. For the first half of 2007, we have originated new business gross margin of $798 million compared to $707 million for the first half of last year.
As highlighted in this chart, wholesale competitive supply is having a strong year with 49% of our current year plan and 78% of our total year origination plan achieved through the end of June.
Moving to slide 18…
18
18
Wholesale Competitive Supply: Backlog
(1) Includes power, gas (non-project), and coal gross margin and gas project margin (project revenue less operating, depreciation, depletion and interest expenses incurred at the project level)
(2) Includes portfolio value changes for downstream gas and coal(3) Reflects portfolio pricing on 12/31/06
Backlog (1)
(as of 6/30/07)
369
189 170
231
134114
$0
$100
$200
$300
$400
$500
$600
$700
2007 2008 2009
$ in
mil
lion
s
New Business Since 12/31/06
Value as of 12/31/06(3)
(2)
600
323284
This chart provides an update of the backlog we’ve created this year in our Wholesale Competitive Supply portfolio. These accrual earnings provide significant visibility into future periods’ earnings. On an ongoing basis, we actively manage risks such as basis risk between regions, customers’ variable usage risk, supply risk and counterparty performance risk.
Of the $567 million of future contribution margin originated in the first half of 2007, we have added $134 million to the 2008 backlog and $114 million to the 2009 backlog.
Wholesale Competitive Supply continues to perform well, and the future year backlog provides a highly visible stream of future earnings already originated as a solid base from which to build.
Turning to slide 19…
19
19
NewEnergy HighlightsElectric• Delivered 18.1 million MWhs in Q2 2007• Realized gross margin/MWh of $5.42
– Lower costs to serve load
• For the second quarter of 2007, retention rates were 64% consistent with 65% experienced in second quarter of 2006
Gas• Delivered about 82 billion cubic feet in Q2 2007• Completed acquisition of Cornerstone Energy
– Expanded geographic footprint– Added over 100 bcf annually
In the second quarter, NewEnergy Electric delivered over 18 million megawatt hours, which was up about 7% compared to last year.
For the second quarter of 2007, NewEnergy benefited from lower costs to serve load, resulting in realized gross margin of $5.42 per megawatt hour. Based on year-to-date performance, we expect unit margins to average about $4.50 per megawatt hour this year. Long-term, we still expect margins to trend toward $3.50 per megawatt hour.
Retention rates were 64% in the second quarter of 2007, consistent with the 65% experienced in the second quarter of last year.
On the gas side, NewEnergy Gas delivered about 82 billion cubic feet in the second quarter, which was about flat compared to the second quarter last year. NewEnergy also completed the Cornerstone acquisition for approximately $100 million. This acquisition will add over 100 bcf annually and has further expanded NewEnergy’s geographic footprint.
Moving to slide 20…
20
20
NewEnergy: Retail MWh Backlog
Contracted Retail MWh (as of 6/30/07)
35
35
37
68
8396
0
20
40
60
80
100
120
2006 2007 2008
MW
hs
in m
illio
ns
Delivered Backlog Plan
• NewEnergy is about 85% contracted in 2007 vs. plan as compared to 89% this time last year
In NewEnergy backlog, we have 70 million megawatt hours either
delivered or contracted for 2007, which accounts for about 85% of the full-year
target and is in line with the pace last year. We also added to future backlog.
We currently have 37 million megawatt hours contracted for 2008, providing a
solid foundation for next year, which represents 39% of our 2008 Plan
volumes in comparison to 34% last year for 2007 volumes.
Turning to slide 21…
21
21
Q2 2007 Cash Flow
$116-$14$102Net Income
193365125Depreciation & Amortization
(20)Equity (Repurchase)/Issuance - Benefit Plans
$102$12$(144)$203Free Cash Flow
(90)-(90)-SB1 Rate Deferrals
290--290Asset Dispositions/Contract Restructuring
(325)-(98)(227)Capital Expenditures & Investments
(79)Dividends
(113)9(35)(87)Working Capital & Other
31Pension Adjustment (pre-tax)
$3Net Cash Flow before Debt Issuances/(Payments)
(98)12(54)(87)“Operating” Cash Flow
(132)3(33)(102)Net CapEx
TotalOther
Non-RegUtilityMerchant($ in millions)
See Appendix
Free cash flow for the quarter was a positive $102 million. Capital spending is tracking slightly below plan for the year. Working capital was a use of $113 million as we posted approximately $50 million more cash collateral than at the end of the first quarter. The $346 million of cash received from the Progress portfolio is in the Contract Restructuring line (and is offset by the amortization of other contract restructurings we have completed in the past). We also funded the last of the Senate Bill 1 rate deferrals at BGE of $90 million. We continue to purchase shares in the open market to satisfy employee benefit obligations rather than issue new shares, resulting in a use of $20 million for the quarter.
Turning to slide 22…
22
22
Impact of Capacity Market Reform• PJM capacity auction results
• Auction for 2009/2010 planning year is scheduled for October 2007
Note: Capacity position includes owned and purchased capacity less sold capacity
42%87%Percentage of capacity hedged (PJM & NY)20092008(Position as of 6/30/07)
$40.80$188.54$197.67
Planning Year2007/2008
$210.11Southwestern MAAC$111.92Rest of Pool
$148.80Eastern MAAC
Planning Year2008/2009
($ per MW/day)
In our first quarter presentation, we provided you with our capacity hedge positions for our total New York and PJM portfolios. As with energy, we have sold capacity to load serving customers and bought capacity from numerous generators over the last several years. Together with our owned generation capacity, we have a large portfolio of capacity positions throughout New York and PJM. Given competitive dynamics, we do not provide the details of our positions in each location.
In mid-July, PJM released the 2008/2009 planning year auction results. Compared to the price levels we saw in April for the 2007/2008 planning year, clearing prices increased for rest of pool and Southwest MAAC and decreased for Eastern MAAC. As of the end of June, our hedge ratios on our total capacity position in New York and PJM were 87% in 2008 and 42% in 2009.
These recent capacity auction results suggest that scarcity pricing signals are beginning to be reflected in the energy market, which should encourage the build of new generation capacity. The combination of higher energy and capacity prices is creating potential investment opportunities for Constellation. We are responding to these price signals in several ways, many of which we would not consider in the absence of the RPM framework and related positive price signals. We are evaluating the potential to re-open 175 MWs of retired generation assets in Maryland. In addition, we continue to make steady progress in our feasibility study for building new-gas fired generation capacity at existing sites, although we’ve not yet committed to build.
Turning to slide 23…
23
23
Q3 2007 Guidance
$1.46
$0.02
$0.20
$1.24
Actual Q3 2006
($0.01) - $0.01Other Non-Regulated
$1.35 - $1.55Adjusted Earnings Per Share (1)
$0.08 - $0.12BGE
$1.25 - $1.45Merchant
Guidance Q3 2007($ per share)
See Appendix(1) Excludes special items, certain economic, non-qualifying hedges, and synfuel earnings
Let me turn to our third quarter guidance. We expect third quarter earnings to be $1.35 to $1.55 per share compared to adjusted EPS of $1.46 in the third quarter of last year. In Merchant, we are projecting EPS of $1.25 to $1.45 per share versus $1.24 adjusted earnings per share in the third quarter last year, driven primarily by improved earnings from the generation fleet as we continue to transition to current market prices, higher Wholesale Competitive Supply backlog realization, and lower interest expense. The positives will be offset by the absence of revenue from the gas plants that were sold in 2006 and higher costs to support growth.
We expect BGE to earn 8 to 12 cents per share in the third quarter, down from the 20 cents of adjusted EPS earned in the third quarter last year, due to the loss of revenue as a result of the Senate Bill 1 residential electric credit for nuclear decommissioning revenue and residential POLR return and other inflationary costs.
Moving to slide 24…
24
24
Earnings Outlook
(1) Adjusted for the effect of special items, certain economic, non-qualifying hedges, and synfuel earningsSee Appendix
• Reaffirming earnings guidance for 2007 and 2008• 2009 adjusted EPS growth of more than 10% over 2008
3.61
+10%
5.25 - 5.75
4.30 - 4.65
$3.00
$3.50
$4.00
$4.50
$5.00
$5.50
$6.00
$6.50
2006 2007E 2008E 2009E
Adju
sted
EPS
(1)
I will wrap up with our 2007 to 2009 outlook. Given the favorable fundamental outlook of the energy markets, with strong global demand, continued strong power and fuel prices, and tightening reserve margins in many markets, we have increased confidence in our long-term outlook.
We are reaffirming our 2007 guidance of $4.30 to $4.65 per share and we have a higher level of confidence in 2008 that moves us to the mid-to-high end of our $5.25 to $5.75 per share guidance range. Looking out further to 2009, we expect earnings growth of more than 10 percent over 2008. Beyond 2009, we believe the underlying fundamentals in the energy markets have positive implications for longer term growth.
That concludes our prepared remarks. We’ll now turn the call over to the operator for questions…
25
Additional Modeling Information
26
26
Merchant – Income Statement (1)
N.M.(4)3(1)Qualifying Facilities / Other
8%11136147Plants with PPAs
56%86154240Mid-Atlantic Fleet
(22%)(20)9070NewEnergy
(13%)($33)$262$229Wholesale Competitive Supply
(6%)(4)(68)(72)D & A
76%$44$58$102Net Income
(68%)(26)(38)(64)Income Tax
73%$70$96$166Pre-Tax Income
69%32(46)(14)Net Interest Expense
27%$38$142$180EBIT
0%(2)(503)(505)Total Costs below Gross Margin
9
(7)
$40
$
Change B/(W)
26%
(2%)
6%
%
(34)(25)Other Revenue and Expenses
(401)(408)O & M
$645$685Gross Margin
Q2 2006Q2 2007($ in millions)
See Appendix(1) Earnings excluding special items, certain economic, non-qualifying hedges, and synfuel earnings
27
27
Significant Excess Liquidity
Historical Excess Liquidity
-
1.0
2.0
3.0
4.0
5.0
6.0
7.0
8.0
Dec-
01
Mar-0
2
Jun-
02
Sep-02
Dec-02
Mar-0
3
Jun-
03
Sep-
03
Dec-
03
Mar-0
4
Jun-
04
Sep-
04
Dec-04
Mar-0
5
Jun-
05
Sep-
05
Dec-
05
Mar-0
6
Jun-
06
Sep-
06
Dec-
06
Mar-0
7
Jun-
07
($ i
n b
illi
ons)
Cash & Bank Lines Bank Line Usage
• Significant liquidity to support business growth• Sufficient liquidity to meet all stressed price and credit scenarios
(1) Excludes $2.5 billion bridge facility
Excess Liquidity
(1)
28
28
Driving Additional Profits from Productivity
(100)
(50)
0
50
100
150
200
2004 2005 2006 2007E 2008EPre
-Tax
Ear
nin
gs (
$ in
mill
ion
s)
Realized Target
(40)
50
97
150 - 155 170 - 180
• Year-to-date, realized $15 million, or 23% of our 2007 productivity plan• Since announcing our long-term productivity initiatives, we have added $112 million pre-tax
to ongoing annual profits
29
29
2007E Balance Sheet / Credit Metrics
0.40.30.30.4-3rd Party Cash Collateral
1.00.71.40.3-AOCI Balance
35%34%35%43%55%Net Debt to Total Capital
22%
33%
$8.7
5.7
$0.1
$2.9
(1.9)
$4.8
Q1 2007
34%32%44%55%Adjusted Net Debt to Adjusted Total Capital(2)
$0.1$0.1$0.1$0.150% Trust Preferred
Capital
$2.9$2.7$3.9$5.1Net Debt
5.44.95.14.1Equity (1)
(2.0)(2.3)(0.8)(0.1)Less: Cash
$8.4$7.7$9.1$9.4Total Capital
$4.9$5.0$4.7$5.2 Total Debt
22%16%29%19%FFO / Debt
Debt
Q2 2007YE 2006YE 2005YE 2001($ in billions)
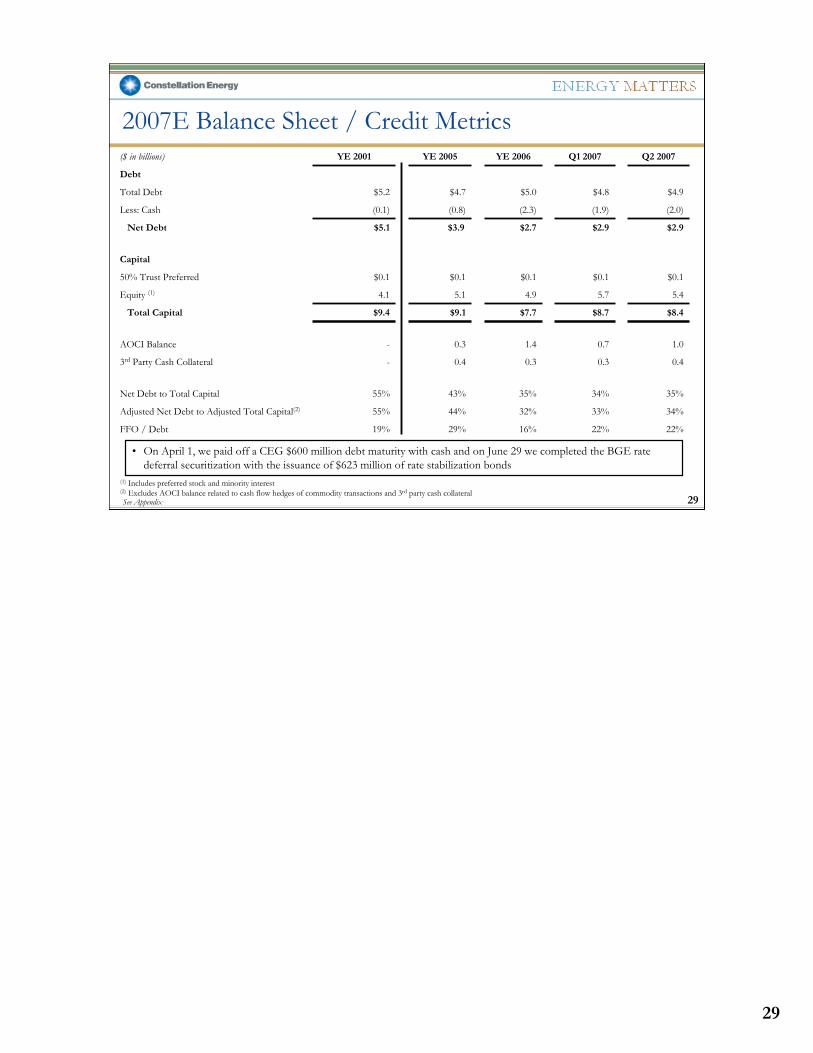
• On April 1, we paid off a CEG $600 million debt maturity with cash and on June 29 we completed the BGE rate deferral securitization with the issuance of $623 million of rate stabilization bonds
(1) Includes preferred stock and minority interest(2) Excludes AOCI balance related to cash flow hedges of commodity transactions and 3rd party cash collateralSee Appendix
30
30
$131($404)($273)($250)Cash Collateral Held
398 (205)603701Exchanges
231481711763rd Parties
(182)751569877Subtotal Posted
Collateral Posted
(51)347296627Net Cash Posted Subtotal
($26)Change in Total Collateral Posted
$25$1,524$1,549$1,653Letters of Credit Posted
Change vs. Q1 076/30/073/31/0712/31/06($ in millions)
Collateral Positions
• Continued sensitivity to downward movement of commodity prices
31
31
Limiting Variability – Portfolio Management
Percent Hedged as of 6/30/07
$0.00$0.00Fuel down $0.10/MMBtu, Power unchanged
($0.02)$0.00Power down $1/MWh, Fuel unchanged
70%95%Fuel
($0.02)
Sensitivity to Price Changes as of 6/30/07 ($ per share)
$0.00Power down $1/MWh, Fuel down $0.10/MMBtu
95%Power 83%
20092008
• Accrual portfolio managed to reduce exposure of future earnings to commodity price changes• MTM portfolio VaR levels remain low at average of $8.8 million in Q2 2007
Note: Percent hedged includes Mid-Atlantic Fleet, Plants with PPA’s, Power Wholesale Competitive Supply and NewEnergy; excludes gas, coal and freight businesses
32
32
Synfuel Update (1)
(46)(24)(12)Current period credit phase-out
$0.17
$31
($11)8
$529%
$428325
($66)
YTD 2007 Actual
$0.30
$55
($30)8
$829%
$8515844
($117)
2007 Estimate
29%Tax credit phase-out percentage
$0.07Net synfuel EPS
$12Net synfuels income
$3Production expenses, net of tax
Impact of phase-out
Pre-phase-out:
($10)-
$224313
($33)
Q2 2007 Actual
Net income impact of phase-out2006 Tax credit true-up
Net income pre-phase-outTax credits before phase-outTax benefit of pre-tax lossPre-tax loss on production
($ in millions, except per share amounts)
The 2007 phase-out estimate is based on oil forwards and volatilities as of June 30, 2007
(1) Numbers may not sum due to rounding
33
33
South Carolina Synfuel (1)
3.51.81.0Production (tons in millions)
(32)(17)(9)Current period credit phase-out
$0.11
$20
($10)6
$129%
$2957
18($45)
YTD 2007 Actual
$0.19
$35
($23)6
$329%
$58109
32($83)
2007 Estimate
29%Tax credit phase-out percentage
$0.04Net synfuel EPS
$7Net synfuels income
$1Production expenses, net of tax
Impact of phase-out
Pre-phase-out:
($8)-
$1530
10($25)
Q2 2007 Actual
Net income impact of phase-out2006 Tax credit true-up
Net income pre-phase-outTax credits before phase-out
Tax benefit of pre-tax lossPre-tax loss on production
($ in millions, except per share amounts)
(1) Numbers may not sum due to rounding
34
34
Pace Synfuel (1)
1.60.80.4Production (tons in millions)
(14)(7)(4)Current period credit phase-out
$0.06
$11
($1)2
$429%
$12257
($21)
YTD 2007 Actual
$0.11
$20
($7)2
$529%
$274912
($34)
2007 Estimate
29%Tax credit phase-out percentage
$0.03Net synfuel EPS
$5Net synfuels income
$2Production expenses, net of tax
Impact of phase-out
Pre-phase-out:
($2)-
$7133
($9)
Q2 2007 Actual
Net income impact of phase-out2006 Tax credit true-up
Net income pre-phase-outTax credits before phase-outTax benefit of pre-tax lossPre-tax loss on production
($ in millions, except per share amounts)
(1) Numbers may not sum due to rounding
35
35
NewEnergy Performance
Realized Electric Gross Margin (GM / MWh)
$1.00
$3.00
$5.00
$7.00
1Q05 2Q05 3Q05 4Q05 1Q06 2Q06 3Q06 4Q06 1Q07 2Q07
Electric Retention Rates
0%
25%
50%
75%
100%
1Q06 2Q06 3Q06 4Q06 1Q07 2Q07
Including Return to Utility Excluding Return to Utility
Gas Retention Rates
80%
90%
100%
1Q06 2Q06 3Q06 4Q06 1Q07 2Q07
Electric
Gas
Realized Gas Gross Margin (GM / Dth)
$0.00
$0.10
$0.20
$0.30
$0.40
1Q05 2Q05 3Q05 4Q05 1Q06 2Q06 3Q06 4Q06 1Q07 2Q07(1) Gross Margin adjusted for FAS 133 and cumulative accounting adjustments
(1) (1)
36
36
NewEnergy Gross Margin Reconciliation
$0.1382.1
$1113
$7
$5.4218.1
9%$98(2)10
$106
Q2 2007
$0.2082.0
$1614
$13
$3.9516.9
14%$65
011
$76
Q2 2006
Other Margin
% of Gross Receipts Tax / Gross Margin
Gas Gross Margin / DthVolume (Dth)
Adjusted Gas Gross MarginOther MarginNon-Qualifying HedgesGross Margin Gas(1)
Electric Margin / MWhVolume
Adjusted Electric Gross Margin
Gross Receipts TaxGross Margin Electric
(1) Gross Margin adjusted for FAS 133 and cumulative accounting adjustments
37
Non-GAAP Reconciliations
38
38
Summary of Non-GAAP Measures
Slide(s) Where Used Slide Containing Non-GAAP Measure in Presentation Most Comparable GAAP Measure Reconciliation
Adjusted EPS Reported GAAP EPSQ207 Actual 4, 12, 13, 14 39Q206 Actual 4, 12, 13, 14 39EPS Guidance 4, 9, 12, 13, 14, 23, 24 39Q306 Actual 23 402006 YTD Actual 24 41
Q207 Merchant Gross Margin 16, 26 Income from Operations / Net Income 42Q206 Merchant Gross Margin 16, 26 43Q207 Merchant Below Gross Margin 26 42Q206 Merchant Below Gross Margin 26 43
Net Cash Flow before Debt Issuances/(Payments) 21 Operating, Investing and Financing Cash Flow 44Free Cash Flow 21 44
Debt to Total Capital 29 Debt Divided by Total Capitalization 45
39
39
Adjusted EPS Q2 2007 and 2006We exclude special items and certain economic, non-qualifying fuel adjustment clause and gas transportation and storage hedges because we believe that it is appropriate for investors to consider results excluding these items, in addition to our results in accordance with GAAP. We have also adjusted earnings to exclude synfuel results due to the potential volatility and phase-out of the tax credits. We believe such a measure provides a picture of our results that is comparable among periods since it excludes the impact of items, which may recur occasionally, but tend to be irregular as to timing and magnitude, thereby distorting comparisons between periods. However, investors should note that this non-GAAP measure involves judgment by management (in particular, judgment as to what is or is not classified as a special item). We also use this measure to evaluate performance and for compensation purposes.
EARNINGS GUIDANCE Constellation Energy is unable to reconcile its earnings guidance excluding special items, non-qualifying hedges, and synfuel results to GAAP earnings per share because we do not predict the future impact of special items such as the cumulative effect of changes in accounting principles, the disposition of assets, economic, nonqualifying hedges or synfuel results.
EPS Before Discontinued Operations
40
40
Adjusted EPS – Q3 2006We exclude special items and certain economic, non-qualifying fuel adjustment clause and gas transportation and storage hedges because we believe that it is appropriate for investors to consider results excluding these items, in addition to our results in accordance with GAAP. We have also adjusted earnings to exclude synfuel results due to the potential volatility and phase-out of the tax credits. We believe such a measure provides a picture of our results that is comparable among periods since it excludes the impact of items, which may recur occasionally, but tend to be irregular as to timing and magnitude, thereby distorting comparisons between periods. However, investors should note that this non-GAAP measure involves judgment by management (in particular, judgment as to what is or is not classified as a special item). We also use this measure to evaluate performance and for compensation purposes.
RECONCILIATION:Merchant Regulated Regulated OtherEnergy Electric Gas BGE Nonreg. Total
Adjusted EPS – YTD 2006We exclude special items and certain economic, non-qualifying fuel adjustment clause and gas transportation and storage hedges because we believe that it is appropriate for investors to consider results excluding these items, in addition to our results in accordance with GAAP. We have also adjusted earnings to exclude synfuel results due to the potential volatility and phase-out of the tax credits. We believe such a measure provides a picture of our results that is comparable among periods since it excludes the impact of items, which may recur occasionally, but tend to be irregular as to timing and magnitude, thereby distorting comparisons between periods. However, investors should note that this non-GAAP measure involves judgment by management (in particular, judgment as to what is or is not classified as a special item). We also use this measure to evaluate performance and for compensation purposes.
RECONCILIATION:
Total
2006 ACTUAL RESULTS:
Reported GAAP EPS 5.16$
Income from Discontinued Operations 1.04 GAAP MEASURES
4.12
Special Items and Non-qualifying Hedges Included in Operations:
Non-qualifying Hedges 0.21
Synthetic fuel facility results 0.16
Gain on sale of gas-fired plants (excluding High Desert) 0.26
Merger-related costs (0.03)
Workforce reduction costs (0.09)
Total Special Items, Non-qualifying Hedges, and Synfuel Results 0.51
Adjusted EPS 3.61$ NON-GAAP MEASURE
EPS Before Discontinued Operations
42
42
2Q07 Merchant Gross Margin and Below Gross MarginWe utilize the non-GAAP financial measure of Gross Margin to highlight the relationship between the costs of and prices for energy in our Merchant Energy business categories (i.e., Mid-Atlantic Fleet, Plants with PPAs, Wholesale Competitive Supply, NewEnergy, and QFs/Other). We believe this non-GAAP measure helps investors to better understand the changes in the level of our Merchant Energy operating results for these categories from period to period.
RECONCILIATION:GAAP Adjustments Merchant
GAAP Fuel & Purchased In Arriving Gross MarginMerchant Revenue & Expense Categories Revenues Energy Expenses Difference At Gross Margin Notes (Non-GAAP)
($ millions)Mid-Atlantic Fleet 684.3$ 375.6$ 308.7$ (70)$ a, b, c 240$ Plants with PPAs 162.3 19.6 142.7 4 a 147 Wholesale Competitive Supply 1,330.5 1,187.8 142.7 86 a , d, e, g 229 **NewEnergy 2,158.7 2,085.3 73.4 (3) d 70 QFs / Other 3.9 - 3.9 (5) e, f (1)
Total Merchant 4,339.7$ 3,668.3$ 671.4$ 12$ 685$
Adjustments Merchant Below Arriving At Merchant Gross Margin
Total Merchant: GAAP Below Gross Margin (Non-GAAP)Revenues less fuel and purchased energy expenses 671.4$ 685$ Operations and maintenance expenses (431.7) 23 h, i, j (408) Impairment loss (20.2) 20 k - Workforce reduction costs (2.3) 2 k - Depreciation, depletion, and amortization (67.9) (4) i, j (72) Taxes other than income taxes (29.2) 29 l - Accretion of asset retirement obligations (18.2) 18 l -
Income From Operations 101.9 205 Gain on initial Public Offering of CEP LLC 12.5 (13) g - Other income / (expense) 22.8 (47) b, l, m (25)
EBIT N/A 180 Fixed charges (19.7) 6 j, m (14)
Income Before Income Taxes 117.5 166 Income tax expense (15.3) (49) k, j (64)
Net Income 102.2$ 102$
Details of Adjustments Made in Arriving at Merchant Gross Margin:a Adjustment to remove ($68 million) gain from Mid-Atlantic Fleet and $4 million loss from Plants with PPA's of estimated gross margin created through active portfolio
management more appropriately categorized as a competitive supply activity.b Adjustment to remove ($4 million) of decommissioning revenues from non-GAAP gross margin measure and included in Other Income. The offsetting decommissioning
expense was recorded in accretion of asset retirement obligations.c Adjustment to remove $3 million of other indirect costs from non-GAAP gross margin as they are more appropriately categorized as operating expenses.d Adjustment to remove $1 million loss in Wholesale Competitive Supply and ($3 million) gain in NewEnergy related to economic, non-qualifying hedges of gas transport and storage contracts.e Adjustment to remove synfuel losses from Wholesale Competitive Supply gross margin of $9 million and Other gross margin of $5 million.f Adjustment to reflect ($10 million) of direct costs in Other for purposes of non-GAAP gross margin measure.g Adjustment to move $13 million gain on sale of stock by CEP to gross margin to reflect management's view of this activity as part of operations
Details of Adjustments Made in Arriving at Merchant Below Gross Margin:h Adjustment detailed in "c" and "f" above are offset by adjustments made to O&M costs. i Adjustment to reclassify certain allocated costs totaling $12 million from O&M to Depreciation and Amortization.j Adjustment to remove Synfuel results, which are not included in determining Merchant Below Gross Margin - $4 million in O&M, $8 million in D&A, $2 million in Fixed Charges, and ($42 million) from income tax expense.k Adjustment to remove Special Items and related tax benefit of ($7 million), which are not included in determining Merchant Below Gross Margin.l Adjustment to reflect management's view of these items as Other Income / Expense.m Adjustment to move Interest Income of $4 million recorded in Other Income / Expense to Fixed Charges (to show a fixed charge amount net of interest income).
** Excludes $23 million of operating expenses, depreciation, depletion and amortization, and interest expense associated with our Upstream Gas properties
PROJECTED GROSS MARGIN AND RESULTS BELOW GROSS MARGIN:Constellation Energy is unable to reconcile its projected gross margin or results below gross margin to GAAP because we do not predict the future impact of reconciling items or special items such as the cumulative effect of changes in accounting principles and the disposition of assets.
Quarter Ended June 30, 2007
43
43
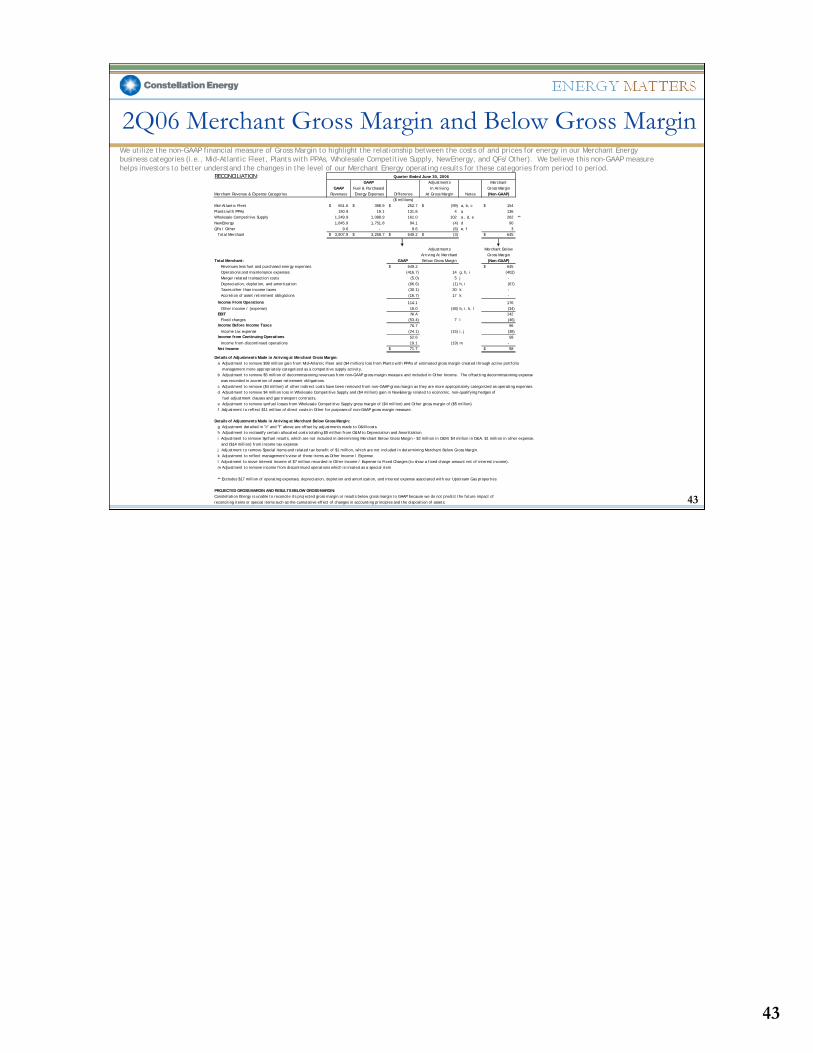
2Q06 Merchant Gross Margin and Below Gross MarginWe utilize the non-GAAP financial measure of Gross Margin to highlight the relationship between the costs of and prices for energy in our Merchant Energy business categories (i.e., Mid-Atlantic Fleet, Plants with PPAs, Wholesale Competitive Supply, NewEnergy, and QFs/Other). We believe this non-GAAP measure helps investors to better understand the changes in the level of our Merchant Energy operating results for these categories from period to period.
RECONCILIATION:GAAP Adjustments Merchant
GAAP Fuel & Purchased In Arriving Gross MarginMerchant Revenue & Expense Categories Revenues Energy Expenses Difference At Gross Margin Notes (Non-GAAP)
($ millions)Mid-Atlantic Fleet 651.6$ 398.9$ 252.7$ (99)$ a, b, c 154$ Plants with PPAs 150.9 19.1 131.8 4 a 136 Wholesale Competitive Supply 1,249.9 1,088.9 161.0 102 a , d, e 262 **NewEnergy 1,845.9 1,751.8 94.1 (4) d 90 QFs / Other 9.6 - 9.6 (6) e, f 3
Total Merchant 3,907.9$ 3,258.7$ 649.2$ (3)$ 645$
Adjustments Merchant Below Arriving At Merchant Gross Margin
Total Merchant: GAAP Below Gross Margin (Non-GAAP)Revenues less fuel and purchased energy expenses 649.2$ 645$ Operations and maintenance expenses (416.7) 14 g, h, i (402) Merger related transaction costs (5.0) 5 j - Depreciation, depletion, and amortization (66.6) (1) h, i (67) Taxes other than income taxes (30.1) 30 k - Accretion of asset retirement obligations (16.7) 17 k -
Income From Operations 114.1 176 Other income / (expense) 16.0 (48) b, i, k, l (34)
EBIT N/A 142 Fixed charges (53.4) 7 l (46)
Income Before Income Taxes 76.7 96 Income tax expense (24.1) (15) i, j (38)
Income from Continuing Operations 52.6 58 Income from discontinued operations 19.1 (19) m -
Net Income 71.7$ 58$
Details of Adjustments Made in Arriving at Merchant Gross Margin:a Adjustment to remove $98 million gain from Mid-Atlantic Fleet and ($4 million) loss from Plants with PPA's of estimated gross margin created through active portfolio
management more appropriately categorized as a competitive supply activity.b Adjustment to remove $5 million of decommissioning revenues from non-GAAP gross margin measure and included in Other Income. The offsetting decommissioning expense
was recorded in accretion of asset retirement obligations.c Adjustment to remove ($4 million) of other indirect costs have been removed from non-GAAP gross margin as they are more appropriately categorized as operating expenses.d Adjustment to remove $4 million loss in Wholesale Competitive Supply and ($4 million) gain in NewEnergy related to economic, non-qualifying hedges of fuel adjustment clauses and gas transport contracts.e Adjustment to remove synfuel losses from Wholesale Competitive Supply gross margin of ($4 million) and Other gross margin of ($5 million)f Adjustment to reflect $11 million of direct costs in Other for purposes of non-GAAP gross margin measure.
Details of Adjustments Made in Arriving at Merchant Below Gross Margin:g Adjustment detailed in "c" and "f" above are offset by adjustments made to O&M costs. h Adjustment to reclassify certain allocated costs totaling $5 million from O&M to Depreciation and Amortizationi Adjustment to remove Synfuel results, which are not included in determining Merchant Below Gross Margin - $2 million in O&M, $4 million in D&A, $1 million in other expense, and ($14 million) from income tax expensej Adjustment to remove Special Items and related tax benefit of $1 million, which are not included in determining Merchant Below Gross Margin.k Adjustment to reflect management's view of these items as Other Income / Expense.l Adjustment to move Interest Income of $7 million recorded in Other Income / Expense to Fixed Charges (to show a fixed charge amount net of interest income).m Adjustment to remove income from discontinued operations which is treated as a special item
** Excludes $17 million of operating expenses, depreciation, depletion and amortization, and interest expense associated with our Upstream Gas properties
PROJECTED GROSS MARGIN AND RESULTS BELOW GROSS MARGIN:Constellation Energy is unable to reconcile its projected gross margin or results below gross margin to GAAP because we do not predict the future impact of reconciling items or special items such as the cumulative effect of changes in accounting principles and the disposition of assets.
Quarter Ended June 30, 2006
44
44
Cash FlowsThe following is a reconciliation of the non-GAAP financial measures of Net Cash Flow before Debt Issuances/Payments and Free Cash Flow. We utilize these non-GAAP measures because we believe they are helpful in understanding our ability to reduce debt by existing cash.
RECONCILIATION:
QTD JUNE ACTUAL RESULTS:Net cash used in operating activities (GAAP measure) 61 Adjustment for derivative contracts presented as financing activities under SFAS 149 5 Adjusted Net Cash Provided by Operating Activities 66$ NON-GAAP MEASURE
Net cash used in investing activities (GAAP measure) (801)
Net Cash Used in Financing Activities (Excl. Debt-Related Sources & Uses) *Common stock dividends paid (79) Proceeds from issuance of common stock 17 Reacquisition of common stock (37) Net proceeds from acquired contracts 821 Other financing activities, excluding SFAS 149 activities included in operating 16 Adjusted Net Cash Used in Financing Activities 738
Net Cash Flow before Debt Issuances/(Payments) 3 NON-GAAP MEASURE
Less: Proceeds from issuance of common stock (17) Add: Reacquisition of common stock 37 Add: Common stock dividends paid 79
Free Cash Flow 102$ NON-GAAP MEASURE
* Total GAAP Cash Provided by Financing Activities (incl. debt-related sources & uses) was $771 million QTD June 07.
PROJECTED CASH FLOWS:Constellation Energy is unable to provide a reconciliation of these measures for Projected 2007 because it does not prepare a forecasted statement of cash flows on a GAAP basis.
Q2 2007($ millions)
45
45
Net Debt to Total CapitalDebt to Total Capital is a non-GAAP ratio that excludes unamortized discounts and premiums, reduces debt by our cash balance, and includes minority interests in equity. In addition, we reflect a 50 percent equity credit for our trust preferred securities and remove the non-economic impact commodity hedges and cash collateral held, similar to the evaluation performed by major credit rating agencies. Management believes this non-GAAP measures provide investors useful information on our leverage because it is consistent with the evaluation performed by rating agencies, takes into account minority equity interests in our consolidated affiliates and cash available to reduce debt, and facilitates comparability between periods.
RECONCILIATION:
Total long-term debt (gross of current portion) 4,719.8$ 4,719.8$ 4,741.5$ 4,741.5$ 4,849.3$ 4,849.3$ 4,610.9$ 4,610.9$ 3,874.4$ 3,874.4$
Fair value decrease (increase) in fixed to floating rate swap included in long-term debt 16.3 (1.6) 7.1 0.9 -
6.20% deferrable interest subordinated debentures due
Exclude commodity hedge AOCI Balance from common shareholders' equity 963 666 1,379 323 (30.0) Counterparty cash collateral held reflected as a reduction of cash balance (404) (296) (253) (388) - Adjusted Net Debt to Total Capital 33.9% 33.4% 31.6% 43.7% 54.8%
PROJECTED LEVERAGE RATIOS:Constellation Energy is unable to provide a reconciliation of this measure for Projected 2007 because it does not prepare a forecasted balance sheet on a GAAP basis.