Consumption of fruits and vegetables in the UK and the potential impact of Brexit on nutrition Gareth Gorst 1 Cesar Revoredo-Giha 2 1 University of Edinburgh 2 Scotland’s Rural College - Food Marketing Research Family Finance Surveys User Conference, Royal Statistical Society, London, 2018 Consumption of fruits and vegetables in the UK and the potential impact of Brexit on nutrition Gareth Gorst 1 Cesar Revoredo-Giha 2 1 University of Edinburgh 2 Scotland’s Rural College - Food Marketing Research Family Finance Surveys User Conference, Royal Statistical Society, London, 2018
Transcript
Consumption of fruits and vegetables in the UK and the potential impact of Brexit on nutrition
Gareth Gorst 1 Cesar Revoredo-Giha 2
1 University of Edinburgh2 Scotland’s Rural College - Food Marketing Research
Family Finance Surveys User Conference, Royal Statistical Society, London, 2018
Consumption of fruits and vegetables in the UK and the potential impact of Brexit on nutrition
Gareth Gorst 1 Cesar Revoredo-Giha 2
1 University of Edinburgh2 Scotland’s Rural College - Food Marketing Research
Family Finance Surveys User Conference, Royal Statistical Society, London, 2018
22
Outline
1. Background and Motivation
2. Questions
3. Data
4. Methods
5. Results
6. Conclusions
33
Background and Motivation
• June 2016 – UK voted to leave the EU– Generated some discussion around UK food– Trade, labour and currency– Little focus on nutrition
• Potential effects of ‘trading down’– Cheaper can result in lower quality– 2017: 26% of adults classified obese in England, 26% of
adults consumed 5 or more portions of fruit and vegetables per day
– Estimated cost of overweight and obesity on NHS = £6 billion per year (Scarborough et al., 2011; Butland, 2007)
44
Consumption of Fruits in the UK
Average weekly per capita fruit (fresh and processed) purchased by UK country
Source: Defra (2017b)
0
200
400
600
800
1000
1200
1400
1600
GRAM
S/P
ERSON/W
EEK
England Wales Scotland Northern Ireland
55
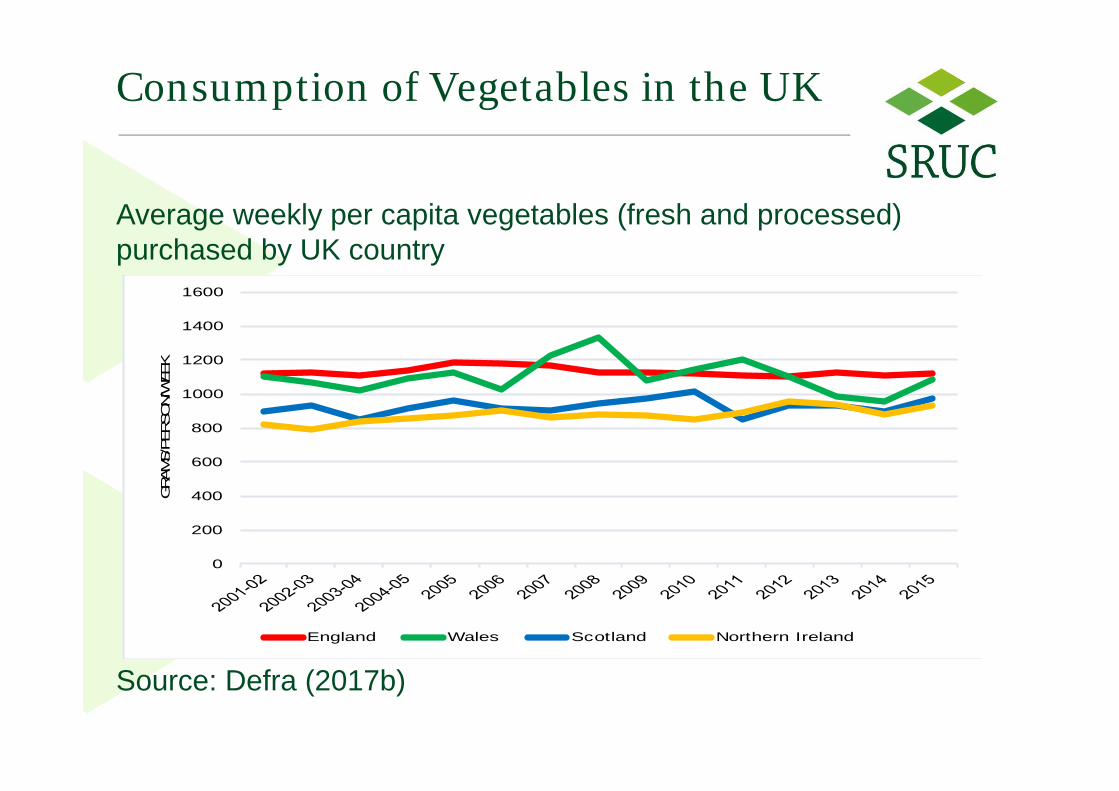
Consumption of Vegetables in the UK
Average weekly per capita vegetables (fresh and processed) purchased by UK country
Source: Defra (2017b)
0
200
400
600
800
1000
1200
1400
1600
GRAMS/P
ERSON/W
EEK
England Wales Scotland Northern Ireland
66
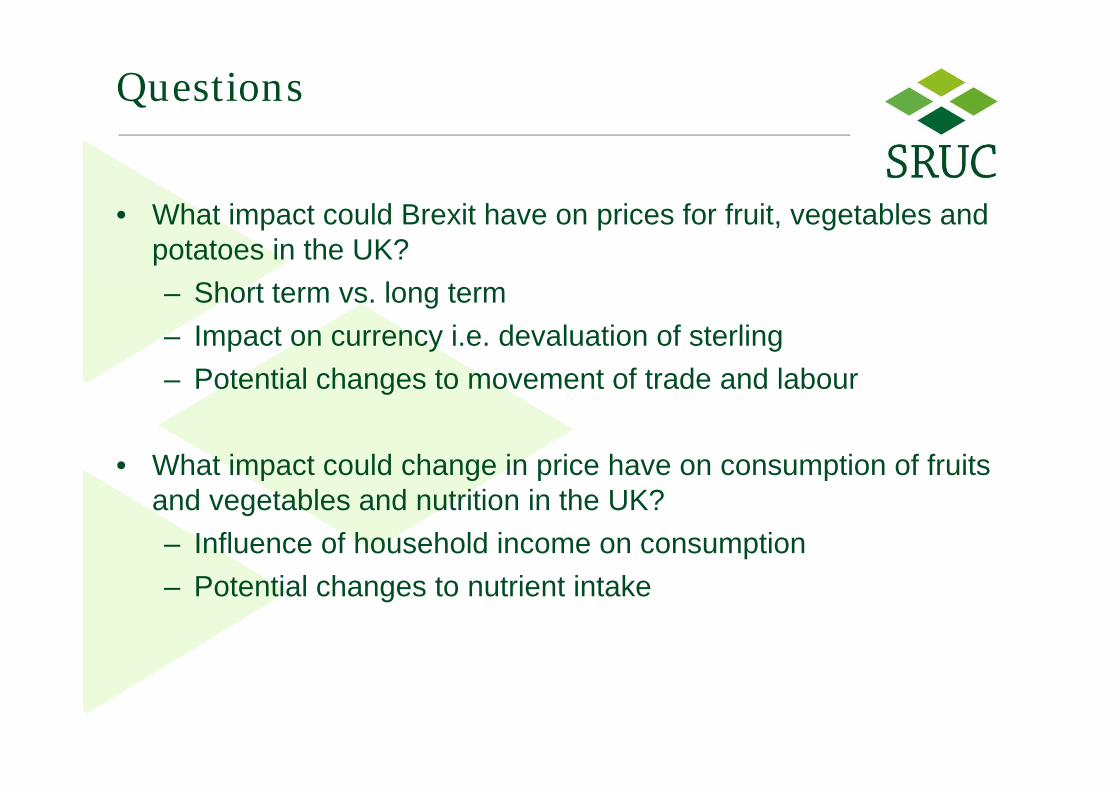
Questions
• What impact could Brexit have on prices for fruit, vegetables and potatoes in the UK?– Short term vs. long term– Impact on currency i.e. devaluation of sterling– Potential changes to movement of trade and labour
• What impact could change in price have on consumption of fruits and vegetables and nutrition in the UK?– Influence of household income on consumption– Potential changes to nutrient intake
77
Brexit Scenarios
• Scenario 1: Devaluation of Sterling– 2.9 per cent rise in price– (Johnson, Levell & Waters, 2016)
• Scenario 2: Changes to Trade– 8 per rise in price– attributed to possible changes in trade practices – defaulting
to WTO tariffs (Smit, van Merrienboer and de Jong, 2017)
• Scenario 3: Access to Labour– 37 per cent rise in price (?)– Only applied to those foods domestically produced
88
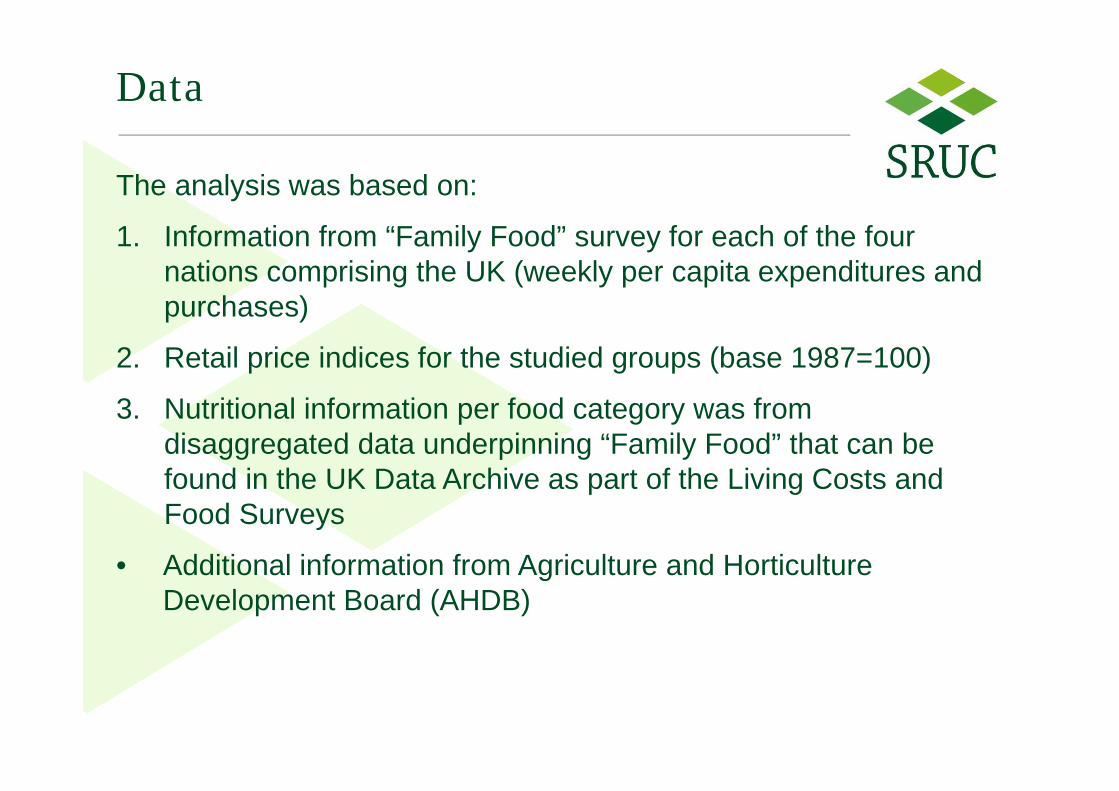
Data
The analysis was based on:
1. Information from “Family Food” survey for each of the four nations comprising the UK (weekly per capita expenditures and purchases)
2. Retail price indices for the studied groups (base 1987=100)
3. Nutritional information per food category was from disaggregated data underpinning “Family Food” that can be found in the UK Data Archive as part of the Living Costs and Food Surveys
• Additional information from Agriculture and Horticulture Development Board (AHDB)
99
Data (cont.)
• Estimated nutrient intakes are calculated using nutrient composition data supplied by Public Health England (PHE)
• The majority of the data are from PHE’s nutrient analysis programme, supplemented by values from manufacturers and retailers
• The five nutrients assessed were energy (kcal), vitamin C, vitamin A (retinol equivalent), magnesium (Mg) and iron (Fe)
1010
Methods
The method consisted in: 1. Using the annual data from Family Food and a multistage
demand system (6 stages) unconditional elasticities for the 260 products considered in family food were estimated
2. The exercise of computing the elasticities was carried out by the UK and each one of the UK countries
3. In order to ensure that the initial would be able to reproduce the 2015 data. The estimated elasticities were used to calibrate a demand system using Beghin et al. (2004)
4. The quantities purchased were transformed to nutrients using the conversion factors from Family Food
5. The calibrated demand system was implemented using Excel VBA
6. The simulations (changes in prices were carried out)
1111
Results
1212
Fruits - Bananas
219.44 218.20 216.00
194.74 192.34188.10
204.27 202.49199.36
189.27 188.01 185.78
160
170
180
190
200
210
220
230
BASELIN E AVER AGE ( 2015) SC EN AR IO 1 SC EN AR IO 2
GRA
MS/P
ERS
ON/W
EEK
England Wales Scotland Northern Ireland
Impact of Scenarios 1 and 2 on per capita per week consumption of fresh bananas in the UK
Source: Own calculation based on Defra (2017)
1313
Fruits – Bananas (cont.)
Scenario 2 - average change in intake of selected nutrients from fresh bananas in the UK
Source: Own calculation based on Defra (2017)
1414
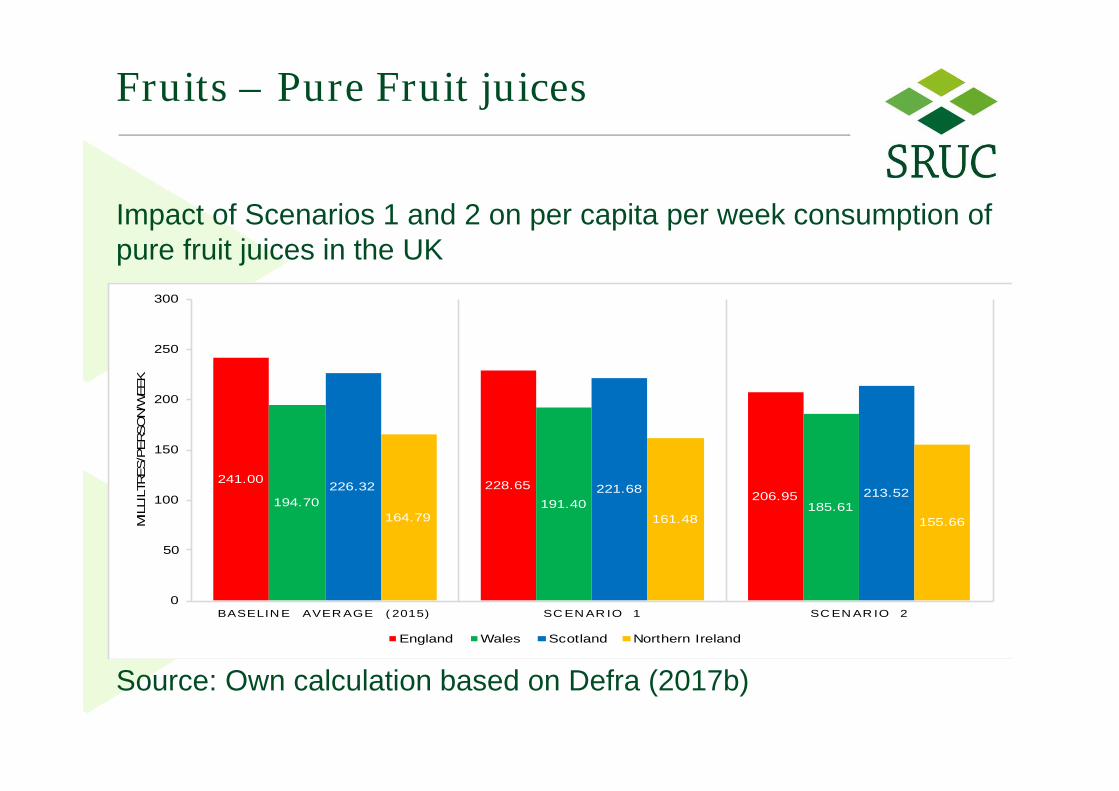
Fruits – Pure Fruit juices
Impact of Scenarios 1 and 2 on per capita per week consumption of pure fruit juices in the UK
Source: Own calculation based on Defra (2017b)
241.00 228.65206.95194.70 191.40 185.61
226.32 221.68 213.52
164.79 161.48 155.66
0
50
100
150
200
250
300
BASELIN E AVER AGE ( 2015) SC EN AR IO 1 SC EN AR IO 2
MIL
LILT
RES/P
ERSO
N/W
EEK
England Wales Scotland Northern Ireland
1515
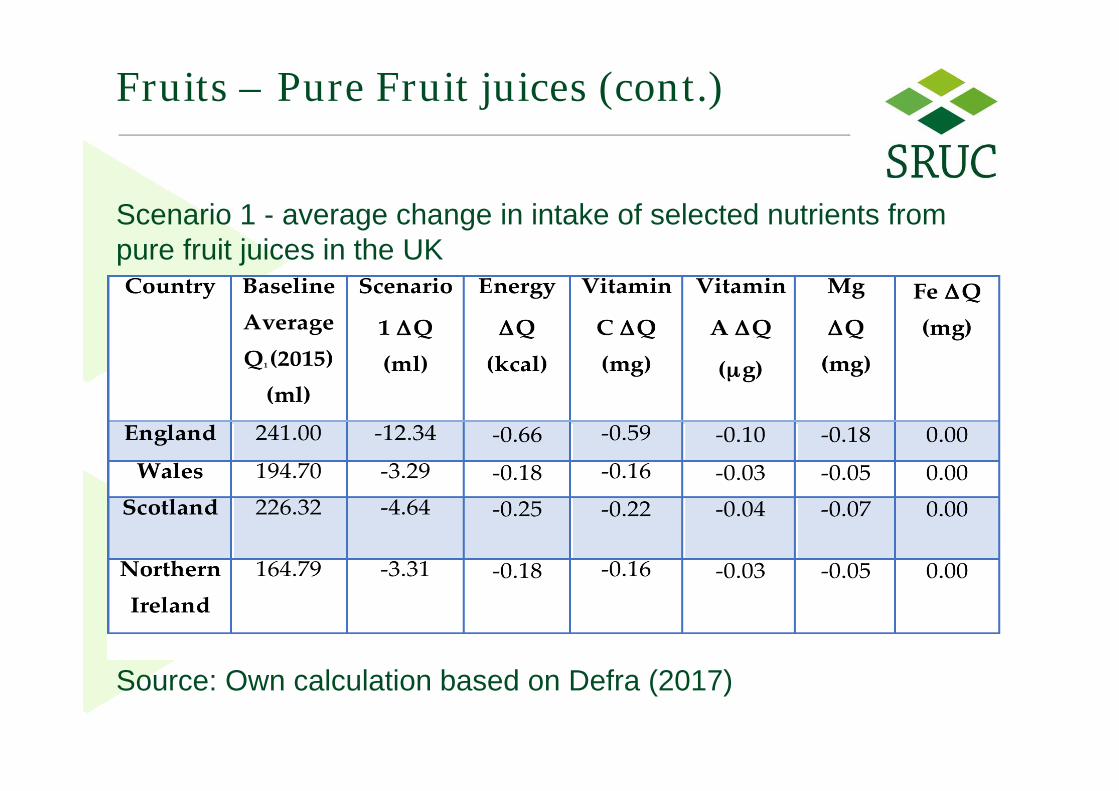
Fruits – Pure Fruit juices (cont.)
Scenario 1 - average change in intake of selected nutrients from pure fruit juices in the UK
Source: Own calculation based on Defra (2017)
1616
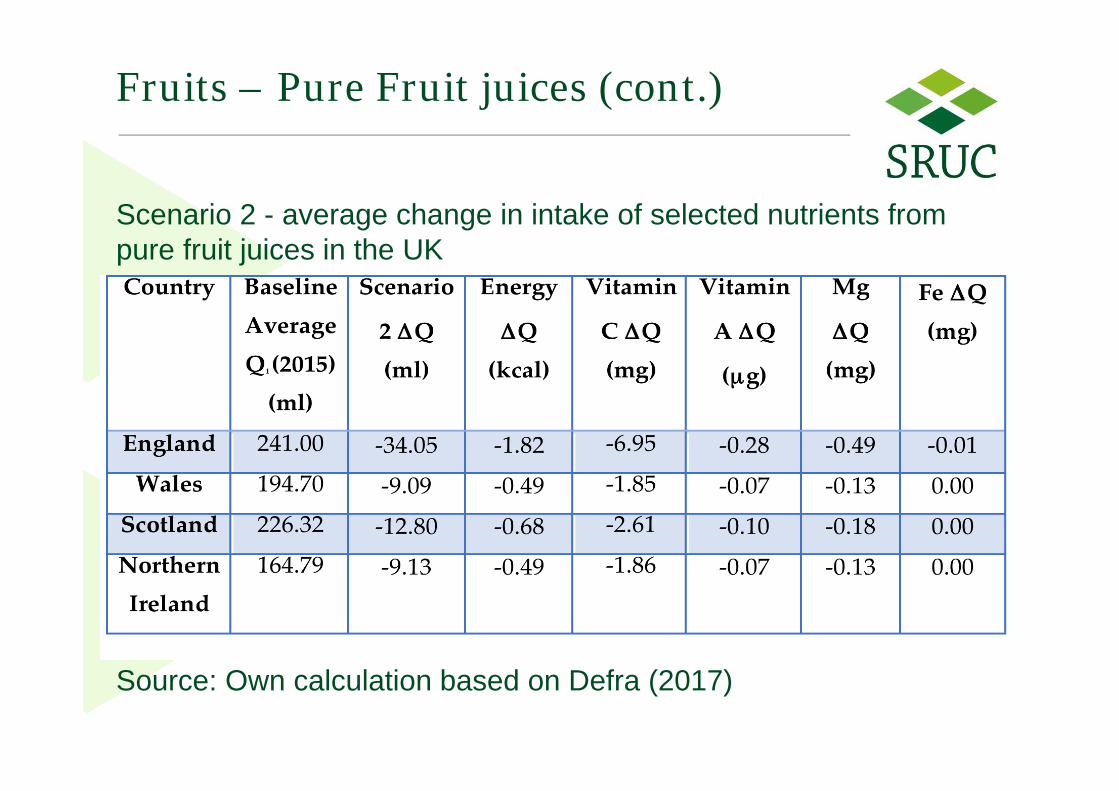
Fruits – Pure Fruit juices (cont.)
Scenario 2 - average change in intake of selected nutrients from pure fruit juices in the UK
Source: Own calculation based on Defra (2017)
1717
Vegetables - Tomatoes
Impact of Scenarios 1 and 2 on average per capita per week consumption of fresh tomatoes in the UK
Source: Own calculation based on Defra (2017)
86.58
59.84
12.82
75.36 73.35 69.81
85.49 84.75 83.44
60.64 60.13 59.24
0.00
10.00
20.00
30.00
40.00
50.00
60.00
70.00
80.00
90.00
100.00
BASELIN E AVER AGE ( 2015) SC EN AR IO 1 SC EN AR IO 2
GRA
MS
/PE
RS
ON
/WEE
K
England Wales Scotland Northern Ireland
1818
Vegetables – Tomatoes (cont.)
Scenario 1 - average change in consumption of fresh tomatoes in the UK and impact on intake of vitamin A
Source: Own calculation based on Defra (2017)
1919
Vegetables – Tomatoes (cont.)
Scenario 2 - average change in consumption of fresh tomatoes in the UK and impact on intake of vitamin A
Source: Own calculation based on Defra (2017)
2020
Vegetables - Carrots
101.
20
100.
58
99.4
9
93.3
0
91.7
8
89.3
8
85.1
6
61.1
3
95.8
7
93.8
8
90.3
7
70.4
2
86.2
4
82.7
3
76.5
5
41.4
1
0.00
20.00
40.00
60.00
80.00
100.00
120.00
B A S E L I N E A V E R A G E ( 2 0 1 5 ) S C E N A R I O 1 S C E N A R I O 2 S C E N A R I O 3
GR
AM
S/P
ER
SO
N/W
EE
K
England Wales Scotland Northern Ireland
Impact of Brexit scenarios on average per capita per week consumption of fresh carrots in the UK
Source: Own calculation based on Defra (2017)
2121
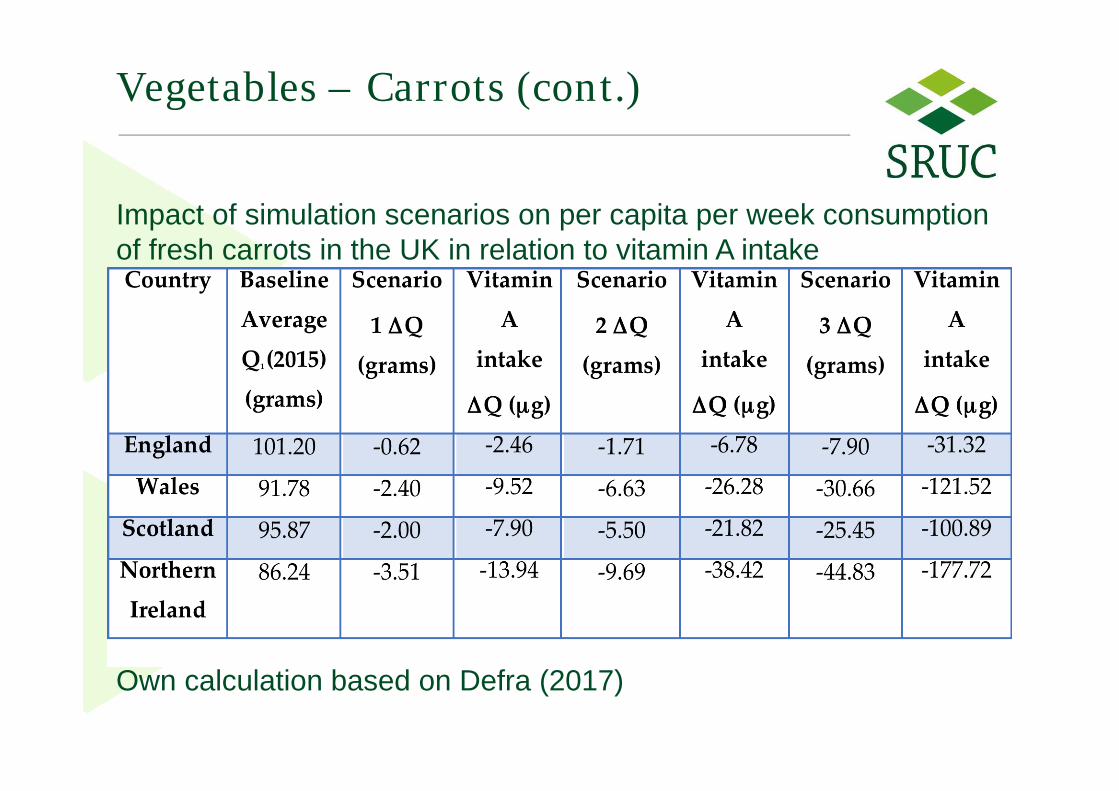
Vegetables – Carrots (cont.)
Impact of simulation scenarios on per capita per week consumption of fresh carrots in the UK in relation to vitamin A intake
Own calculation based on Defra (2017)
2222
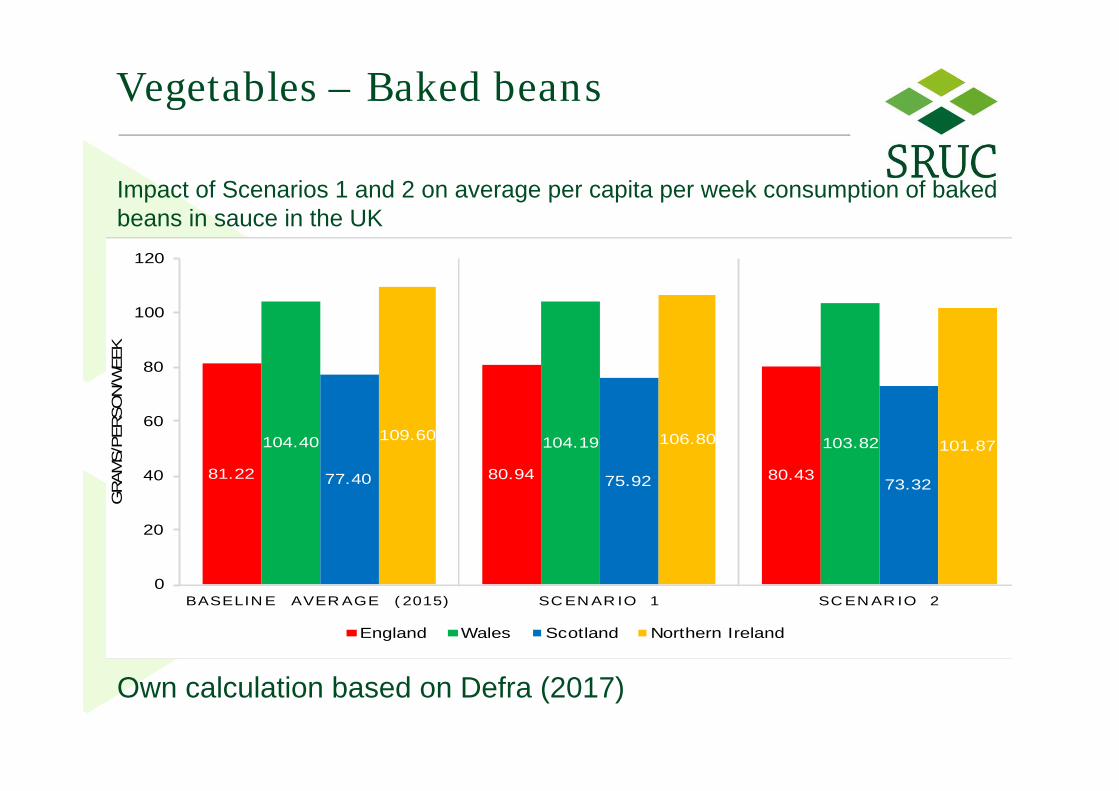
Vegetables – Baked beans
81.22 80.94 80.43
104.40 104.19 103.82
77.40 75.92 73.32
109.60 106.80 101.87
0
20
40
60
80
100
120
BASELIN E AVER AGE ( 2015) SC EN AR IO 1 SC EN AR IO 2
GRA
MS/P
ERS
ON/
WEEK
England Wales Scotland Northern Ireland
Impact of Scenarios 1 and 2 on average per capita per week consumption of baked beans in sauce in the UK
Own calculation based on Defra (2017)
2323
Vegetables – Baked beans (cont.)
Scenario 2 - average change in consumption of baked beans in sauce in the UK and impact on selected nutrient intakes
Own calculation based on Defra (2017)
2424
Conclusions
• Decreased consumption of fruit and vegetables following a 2.9 per cent rise in price - nutrient intakes in the UK were impacted only moderately for the average UK consumer and did not present any great threat to overall nutrient intakes
• For the most part, the average UK consumer was likely to tolerate a small rise in price affecting fruit and vegetables post-exit
2525
Thank you for your attention!
2626
Acknowledgements
• Some of this paper derives mainly from work commissioned by the Scottish Government as part of the 2016-21 Research Programme on Food, Health and Wellbeing (Theme 3).
• In addition, the work was also partially based on research as part of the ERANET-SUSFOOD Project SUSDIET “Implementing sustainable diets in Europe” funded by Defra.