58
Printed on Recycled Paper Contaminant Candidate List Regulatory Determination Support Document for Sodium
Printed on Recycled Paper
Contaminant CandidateList RegulatoryDetermination SupportDocument for Sodium


Printed on Recycled Paper
Contaminant Candidate ListRegulatory Determination Support Document
for Sodium
U.S. Environmental Protection AgencyOffice of Water (4607M)
Standards and Risk Management DivisionWashington, DC 20460
http://www.epa.gov/SAFEWATER/ccl/cclregdetermine.html
EPA-815-R-03-15July 2003

Disclaimer
This document is designed to provide supporting information regarding theregulatory determinations for sodium as part of the Contaminant CandidateList (CCL) evaluation process. This document is not a regulation, and it doesnot substitute for the Safe Drinking Water Act (SDWA) or the EnvironmentalProtection Agency’s (EPA’s) regulations. Thus, it cannot impose legally-binding requirements on EPA, States, or the regulated community, and maynot apply to a particular situation based upon the circumstances. Mention oftrade names or commercial products does not constitute endorsement orrecommendation for use.
Regulatory Determination Support Document for Sodium July 2003
i
ACKNOWLEDGMENTS
This document was prepared in support of the EPA’s Office of Ground Water and Drinking Waterregulatory determination for sodium as part of the Contaminant Candidate List (CCL) evaluationprocess. Karen Wirth and Tom Carpenter served as EPA’s Co-Team Leaders for the CCL regulatorydetermination process and Ephraim King as Standards and Risk Management Division Director. Harriet Colbert served as Work Assignment Manager. The CCL Work Group provided technicalguidance throughout. In particular, Karen Wirth, Dan Olson, and Joyce Donohue provided scientificand editorial guidance. External expert reviewers and many stakeholders provided valuable advice toimprove the CCL Program and this document. The Cadmus Group, Inc., served as the primarycontractor providing support for this work. The major contributions of Matt Collins, Emily Brott,Ashton Koo, Richard Zeroka, and Brent Ranalli are gratefully acknowledged. George Hallberg servedas Cadmus’ Project Manager.
Regulatory Determination Support Document for Sodium July 2003
ii
This page intentionally left blank.
Regulatory Determination Support Document for Sodium July 2003
iii
USEPA, Office of Water Report: EPA 815-R-03-015, July 2003
CONTAMINANT CANDIDATE LISTREGULATORY DETERMINATION SUPPORT DOCUMENT
FOR SODIUM
EXECUTIVE SUMMARY
Sodium was a 1998 Contaminant Candidate List (CCL) regulatory determination prioritycontaminant. Sodium was one of the contaminants considered by the U.S. Environmental ProtectionAgency (EPA) for a regulatory determination. The available data on occurrence, exposure, and otherrisk considerations suggest that regulating sodium may not present a meaningful opportunity to reducehealth risk. EPA presented preliminary CCL regulatory determinations and further analysis in the June3, 2002 Federal Register Notice (USEPA, 2002a; 67 FR 38222), and confirmed the final CCLregulatory determinations in the July 18, 2003 Federal Register Notice (USEPA, 2003a; 68 FR42898).
To make this regulatory determination for sodium, EPA used approaches guided by the NationalDrinking Water Advisory Council’s (NDWAC) Work Group on CCL and Six-Year Review. TheSafe Drinking Water Act (SDWA) requirements for National Primary Drinking Water Regulation(NPDWR) promulgation guided protocol development. The SDWA Section 1412(b)(1)(A) specifiesthat the determination to regulate a contaminant must be based on a finding that each of the followingcriteria are met: (i) “the contaminant may have adverse effects on the health of persons”; (ii) “thecontaminant is known to occur or there is substantial likelihood that the contaminant will occur in publicwater systems with a frequency and at levels of public health concern”; and (iii) “in the sole judgementof the Administrator, regulation of such contaminant presents a meaningful opportunity for health riskreduction for persons served by public water systems.” Available data were evaluated to address eachof the three statutory criteria.
Sodium (Na) is a naturally occurring element ubiquitous in the environment. It is the sixth mostabundant element in the Earth’s crust and the most abundant anion in the hydrosphere. Sodium in theocean is associated with chlorine in the form of sea salt. In the lithosphere, most sodium minerals existas soluble salts found primarily in evaporite deposits and silicate minerals, and more rarely as halides oraluminohalides. The sodium cation (Na+) is necessary for a number of biochemical processes in manyliving organisms.
Sodium chloride (NaCl) is the most economically and industrially important form of sodium withthousands of uses. Among other things, salt is used as a flavor enhancer or food preservative, as a roaddeicer, in water softening treatment, in powdered soaps and detergents, as the electrolyte in salinesolutions, in rubber manufacture, and as a pesticide. Sodium chloride is also used in oil and gas
Regulatory Determination Support Document for Sodium July 2003
iv
exploration, textile and dyeing industries, metal processing, pulp and paper production, tanning andleather treatment, and in the chemical industry to manufacture other chemicals. Widespreadenvironmental releases of five other sodium compounds reported through the Toxic Release Inventory(TRI) underscore the heavy use and release of sodium in the environment.
A Health Advisory (HA) has until now never been issued for sodium, though a Drinking WaterEquivalent Level (DWEL) is available. The DWEL of 20 mg/L is a non-enforceable guidance levelconsidered protective against non-carcinogenic adverse health effects and is based on an AmericanHeart Association recommendation issued in 1965. Also, EPA has issued a non-enforceable guidanceof 250 mg/L for salinity and dissolved solids in ambient waters (USEPA, 1997; 62 FR 52194).
The sale, use, and distribution of pesticide products containing sodium chloride and sodium bromideare controlled under the Federal Insecticide, Fungicide, and Rodenticide Act (FIFRA). TheComprehensive Environmental Response, Compensation, and Liability Act (CERCLA, or“Superfund”) also includes sodium and many of its compounds on its list of hazardous substances. Anumber of sodium compounds are also listed as hazardous constituents under the ResourceConservation and Recovery Act (RCRA).
Sodium occurrence in ambient waters and stream bed sediments monitored by the United StatesGeological Survey’s (USGS) National Water Quality Assessment (NAWQA) program is ubiquitous,approaching 100% of water and sediment sampling sites for all land use categories. Although sodiumdetection frequencies are high, sodium occurrence at levels of public health concern is low. Less than6% of all surface water sites and less than 8% of all ground water sites report detections greater than120 mg/L, a benchmark concentration level used for this analysis.
Sodium has been detected in ground water PWS samples collected through the National Inorganicand Radionuclide Survey (NIRS) study. Occurrence estimates are high with 100% of samples showingdetections, affecting 100% of the national population served. The 99th percentile concentration of allsamples is 517 mg/L. About 13.2% of the NIRS systems exceeded the 120 mg/L benchmark level,affecting approximately 7.1 million people nationally. Additional data, including both ground water andsurface water PWSs from select States, were examined through independent analyses and also showsubstantial sodium occurrence.
The weight of evidence favors the conclusion that high sodium intakes can have an adverse effecton blood pressure, especially for sodium-hypertensives. Hypertension affects almost 50 million peoplein the United States, and along with factors such as body weight, alcohol intake, and cholesterol, is arisk factor for heart disease. However, hyptertension is influenced more by lifestyle, behavior, andother nutrient intake than by sodium intake.

Regulatory Determination Support Document for Sodium July 2003
v
Sodium is known to occur in public water systems and in a few cases at levels of public healthconcern, particularly for salt-sensitive hypertensives. However, at these same concentrations, taste isgenerally affected and would likely lead consumers to decrease consumption. In addition, whencompared with other intake routes, sodium from drinking water has a minor impact. For these reasons,regulation of sodium is unlikely to present a meaningful opportunity for health risk reduction for personsserved by public water systems. However, EPA may choose to issue a non-enforceable DrinkingWater Advisory, based on current health effects, taste effects, and occurrence data, to provideguidance to communities that may be exposed to elevated concentrations of sodium chloride or othersodium salts in their drinking water. In addition, under EPA-required sodium monitoring, test resultsmust be reported to State and local public health authorities, who may advise sensitive populations ofany risk they may face.
This page intentionally left blank.

Regulatory Determination Support Document for Sodium July 2003
vii
TABLE OF CONTENTS
ACKNOWLEDGMENTS . . . . . . . . . . . . . . . . . . . . . . . . . . . . . . . . . . . . . . . . . . . . . . . . . . . . . . . i
EXECUTIVE SUMMARY . . . . . . . . . . . . . . . . . . . . . . . . . . . . . . . . . . . . . . . . . . . . . . . . . . . . . . iii
TABLE OF CONTENTS . . . . . . . . . . . . . . . . . . . . . . . . . . . . . . . . . . . . . . . . . . . . . . . . . . . . . . . vii
LIST OF TABLES . . . . . . . . . . . . . . . . . . . . . . . . . . . . . . . . . . . . . . . . . . . . . . . . . . . . . . . . . . . . ix
LIST OF FIGURES . . . . . . . . . . . . . . . . . . . . . . . . . . . . . . . . . . . . . . . . . . . . . . . . . . . . . . . . . . . xi
1.0 INTRODUCTION . . . . . . . . . . . . . . . . . . . . . . . . . . . . . . . . . . . . . . . . . . . . . . . . . . . . . . . . . . 11.1 Purpose and Scope . . . . . . . . . . . . . . . . . . . . . . . . . . . . . . . . . . . . . . . . . . . . . . . . . . . . . . . 11.2 Statutory Framework/Background . . . . . . . . . . . . . . . . . . . . . . . . . . . . . . . . . . . . . . . . . . . . 11.3 Statutory History of Sodium . . . . . . . . . . . . . . . . . . . . . . . . . . . . . . . . . . . . . . . . . . . . . . . . 21.4 Regulatory Determination Process . . . . . . . . . . . . . . . . . . . . . . . . . . . . . . . . . . . . . . . . . . . . 31.5 Determination Outcome . . . . . . . . . . . . . . . . . . . . . . . . . . . . . . . . . . . . . . . . . . . . . . . . . . . . 5
2.0. CONTAMINANT DEFINITION . . . . . . . . . . . . . . . . . . . . . . . . . . . . . . . . . . . . . . . . . . . . . . 52.1 Physical and Chemical Properties . . . . . . . . . . . . . . . . . . . . . . . . . . . . . . . . . . . . . . . . . . . . 62.2 Environmental Fate and Transport . . . . . . . . . . . . . . . . . . . . . . . . . . . . . . . . . . . . . . . . . . . . 6
3.0 OCCURRENCE AND EXPOSURE . . . . . . . . . . . . . . . . . . . . . . . . . . . . . . . . . . . . . . . . . . . . 73.1 Use and Environmental Release . . . . . . . . . . . . . . . . . . . . . . . . . . . . . . . . . . . . . . . . . . . . . . 7
3.1.1 Production and Use . . . . . . . . . . . . . . . . . . . . . . . . . . . . . . . . . . . . . . . . . . . . . . . . . . 73.1.2 Environmental Release . . . . . . . . . . . . . . . . . . . . . . . . . . . . . . . . . . . . . . . . . . . . . . . 11
3.2 Ambient Occurrence . . . . . . . . . . . . . . . . . . . . . . . . . . . . . . . . . . . . . . . . . . . . . . . . . . . . . 133.2.1 Data Sources and Methods . . . . . . . . . . . . . . . . . . . . . . . . . . . . . . . . . . . . . . . . . . . 133.2.2 Results . . . . . . . . . . . . . . . . . . . . . . . . . . . . . . . . . . . . . . . . . . . . . . . . . . . . . . . . . . . 14
3.3 Drinking Water Occurrence . . . . . . . . . . . . . . . . . . . . . . . . . . . . . . . . . . . . . . . . . . . . . . . . 163.3.1 Analytical Approach . . . . . . . . . . . . . . . . . . . . . . . . . . . . . . . . . . . . . . . . . . . . . . . . . 16
3.3.1.1 National Inorganic and Radionuclide Survey (NIRS) . . . . . . . . . . . . . . . . . . . . 163.3.1.2 Supplemental IOC Data . . . . . . . . . . . . . . . . . . . . . . . . . . . . . . . . . . . . . . . . . 173.3.1.3 Data Management and Analysis . . . . . . . . . . . . . . . . . . . . . . . . . . . . . . . . . . . . 183.3.1.4 Occurrence Analysis . . . . . . . . . . . . . . . . . . . . . . . . . . . . . . . . . . . . . . . . . . . . 18
3.3.2 Results . . . . . . . . . . . . . . . . . . . . . . . . . . . . . . . . . . . . . . . . . . . . . . . . . . . . . . . . . . . 193.4 Conclusion . . . . . . . . . . . . . . . . . . . . . . . . . . . . . . . . . . . . . . . . . . . . . . . . . . . . . . . . . . . . 24
Regulatory Determination Support Document for Sodium July 2003
viii
4.0 HEALTH EFFECTS . . . . . . . . . . . . . . . . . . . . . . . . . . . . . . . . . . . . . . . . . . . . . . . . . . . . . . . 244.1 Hazard Characterization and Mode of Action Implications . . . . . . . . . . . . . . . . . . . . . . . . . 244.2 Dose-Response Characterization and Implications in Risk Assessment . . . . . . . . . . . . . . . . 264.3 Relative Source Contribution . . . . . . . . . . . . . . . . . . . . . . . . . . . . . . . . . . . . . . . . . . . . . . . 274.4 Sensitive Populations . . . . . . . . . . . . . . . . . . . . . . . . . . . . . . . . . . . . . . . . . . . . . . . . . . . . . 274.5 Exposure and Risk Information . . . . . . . . . . . . . . . . . . . . . . . . . . . . . . . . . . . . . . . . . . . . . 284.6 Conclusion . . . . . . . . . . . . . . . . . . . . . . . . . . . . . . . . . . . . . . . . . . . . . . . . . . . . . . . . . . . . 29
5.0 TECHNOLOGY ASSESSMENT . . . . . . . . . . . . . . . . . . . . . . . . . . . . . . . . . . . . . . . . . . . . . 295.1 Analytical Methods . . . . . . . . . . . . . . . . . . . . . . . . . . . . . . . . . . . . . . . . . . . . . . . . . . . . . . 295.2 Treatment Technology . . . . . . . . . . . . . . . . . . . . . . . . . . . . . . . . . . . . . . . . . . . . . . . . . . . . 30
6.0 SUMMARY AND CONCLUSIONS - DETERMINATION OUTCOME . . . . . . . . . . . . . . 30
REFERENCES . . . . . . . . . . . . . . . . . . . . . . . . . . . . . . . . . . . . . . . . . . . . . . . . . . . . . . . . . . . . . . . 33
Appendix A: Abbreviations and Acronyms . . . . . . . . . . . . . . . . . . . . . . . . . . . . . . . . . . . . . . . . . . . 41
Regulatory Determination Support Document for Sodium July 2003
ix
LIST OF TABLES
Table 3-1: End uses of sodium chloride in 1990 (in thousands of short tons) . . . . . . . . . . . . . . . . . . . 9Table 3-2: U.S. sodium chloride statistics, 1990-1998 (in thousands of metric tons) . . . . . . . . . . . . 10Table 3-3: Environmental fate of post-consumer sodium chloride, 1990 (in millions of short tons) . . 11Table 3-4: Sodium detections and concentrations in streams and ground water . . . . . . . . . . . . . . . . 16Table 3-5: Sodium occurrence in ground water systems (NIRS survey) . . . . . . . . . . . . . . . . . . . . . 22Table 3-6: Occurrence summary of ground and surface water systems by State for sodium . . . . . . . 23Table 5-1: Analytical methods for sodium . . . . . . . . . . . . . . . . . . . . . . . . . . . . . . . . . . . . . . . . . . . 30

This page intentionally left blank.

Regulatory Determination Support Document for Sodium July 2003
xi
LIST OF FIGURES
Figure 3-1: Abundance of sodium chloride (salt) in the ocean . . . . . . . . . . . . . . . . . . . . . . . . . . . . . . 8Figure 3-2: Average sodium concentrations in precipitation over the United States . . . . . . . . . . . . . . 8

This page intentionally left blank.
Regulatory Determination Support Document for Sodium July 2003
1
1.0 INTRODUCTION
1.1 Purpose and Scope
This document presents scientific data and summaries of technical information prepared for, andused in, the U.S. Environmental Protection Agency’s (EPA) regulatory determination for sodium. Information regarding sodium’s physical and chemical properties, environmental fate, occurrence andexposure, and health effects is included. Analytical methods and treatment technologies are alsodiscussed. Furthermore, the regulatory determination process is described to provide the rationale forthe decision.
1.2 Statutory Framework/Background
The Safe Drinking Water Act (SDWA), as amended in 1996, requires the EPA to publish a list ofcontaminants (referred to as the Contaminant Candidate List, or CCL) to assist in priority-settingefforts. The contaminants included on the CCL were not subject to any current or proposed NationalPrimary Drinking Water Regulations (NPDWR), were known or anticipated to occur in public watersystems, and were known or suspected to adversely affect public health. These contaminants thereforemay require regulation under SDWA. The first Drinking Water CCL was published on March 2, 1998(USEPA, 1998c; 63 FR 10273), and a new CCL must be published every five years thereafter.
The 1998 CCL contains 60 contaminants, including 50 chemicals or chemical groups, and 10microbiological contaminants or microbial groups. The SDWA also requires the Agency to select 5 ormore contaminants from the current CCL and determine whether or not to regulate these contaminantswith an NPDWR. Regulatory determinations for at least 5 contaminants must be completed 3½ yearsafter each new CCL.
Language in SDWA Section 1412(b)(1)(A) specifies that the determination to regulate acontaminant must be based on a finding that each of the following criteria are met:
Statutory Finding i: the contaminant may have adverse effects on the health of persons;
Statutory Finding ii: the contaminant is known to occur or there is substantial likelihood that thecontaminant will occur in public water systems with a frequency and at levels of public healthconcern; and
Statutory Finding iii: in the sole judgement of the Administrator, regulation of such contaminant presents a meaningful opportunity for health risk reduction for persons served bypublic water systems.

Regulatory Determination Support Document for Sodium July 2003
2
The geographic distribution of the contaminant is another factor evaluated to determine whether itoccurs at the national, regional or local level. This consideration is important because the Agency ischarged with developing national regulations and it may not be appropriate to develop NPDWRs forregional or local contamination problems.
EPA must determine if regulating this CCL contaminant will present a meaningful opportunity toreduce health risk based on contaminant occurrence, exposure, and other risk considerations. TheOffice of Ground Water and Drinking Water (OGWDW) is charged with gathering and analyzing theoccurrence, exposure, and risk information necessary to support this regulatory decision. TheOGWDW must evaluate when and where this contaminant occurs, and what would be the exposureand risk to public health. EPA must evaluate the impact of potential regulations as well as determine theappropriate measure(s) for protecting public health.
For each of the regulatory determinations, EPA first publishes in the Federal Register the draftdeterminations for public comment. EPA responds to the public comments received, and then finalizesregulatory determinations. If the Agency finds that regulations are warranted, the regulations must thenbe formally proposed within 24 months, and promulgated 18 months later. EPA has determined thatthere is sufficient information to support a regulatory determination for sodium.
1.3 Statutory History of Sodium
Sodium chloride (NaCl), otherwise known as halite, salt, sea salt, or table salt, is the mosteconomically and industrially important form of sodium, with an estimated 14,000 direct and indirectuses. Among other things, salt is used as a flavor enhancer or preservative in food, as a road deicer, inwater softening treatment, in powdered soaps and detergents, as the electrolyte in saline solutions, inrubber manufacturing, and as a pesticide. Sodium chloride is also used in oil and gas exploration, textileand dyeing industries, metal processing, pulp and paper production, tanning and leather treatment, andin the chemical industry (Kostick, 1993; Gornitz, 1972). Because salt has so many human end usesand is abundant in the ocean, sodium is ubiquitous in the environment.
A Health Advisory (HA) for sodium has never been issued, though a Drinking Water EquivalentLevel (DWEL) is available. The DWEL of 20 mg/L is a non-enforceable guidance level consideredprotective against non-carcinogenic adverse health effects and is based on an American HeartAssociation recommendation issued in 1965. Also, EPA has issued a non-enforceable guidance of 250mg/L for salinity and dissolved solids in ambient waters (USEPA, 1997; 62 FR 52194).
The sale, use, and distribution of pesticides, including those containing sodium, is controlled underthe Federal Insecticide, Fungicide, and Rodenticide Act (FIFRA). FIFRA was most recently amendedin 1996 under the Food Quality Protection Act (FQPA). FIFRA requires registration of all pesticideswith EPA, as well as certain labeling, application, and use restrictions. Moreover, pesticide
Regulatory Determination Support Document for Sodium July 2003
3
manufacturing plants must be registered, and the manufacturer must provide EPA with scientific dataregarding the product’s efficacy and demonstrating that it does not pose an unreasonable risk to peopleor the environment (USEPA, 1998a).
Pesticide products containing sodium chloride and sodium bromide have been registered underFIFRA since 1954 and 1975, respectively. Currently, thirty-two sodium bromide pesticide productsand two pesticide products containing sodium chloride are registered in the United States (USEPA,1993).
The Comprehensive Environmental Response, Compensation, and Liability Act (CERCLA, or“Superfund”) includes sodium and many of its compounds on its list of hazardous substances. CERCLA’s listing requires reporting of releases over a certain “reportable quantity” which, forelemental sodium, is ten pounds (USEPA, 1998b). A number of sodium compounds are also listed ashazardous constituents under the Resource Conservation and Recovery Act (RCRA) (USEPA,1998b). Furthermore, data are available for five sodium compounds through the Toxic ReleaseInventory (TRI). The TRI was established by the Emergency Planning and Community Right-to-KnowAct (EPCRA). EPCRA requires certain industrial sectors to publically report the environmental releaseor transfer of chemicals included in this inventory (USEPA, 2000a).
1.4 Regulatory Determination Process
In developing a process for the regulatory determinations, EPA sought input from experts andstakeholders. EPA asked the National Research Council (NRC) for assistance in developing ascientifically sound approach for deciding whether or not to regulate contaminants on the current andfuture CCLs. The NRC’s Committee on Drinking Water Contaminants recommended that EPA: (1)gather and analyze health effects, exposure, treatment, and analytical methods data for eachcontaminant; (2) conduct a preliminary risk assessment for each contaminant based on the availabledata; and (3) issue a decision document for each contaminant describing the outcome of the preliminaryrisk assessment. The NRC noted that in using this decision framework, EPA should keep in mind theimportance of involving all interested parties.
One of the formal means by which EPA works with its stakeholders is through the NationalDrinking Water Advisory Council (NDWAC). The NDWAC comprises members of the generalpublic, State and local agencies, and private groups concerned with safe drinking water, and advisesthe EPA Administrator on key aspects of the Agency’s drinking water program. The NDWACprovided specific recommendations to EPA on a protocol to assist the Agency in making regulatorydeterminations for current and future CCL contaminants. Separate but similar protocols weredeveloped for chemical and microbial contaminants. These protocols are intended to provide aconsistent approach to evaluating contaminants for regulatory determination, and to be a tool that willorganize information in a manner that will communicate the rationale for each determination to
Regulatory Determination Support Document for Sodium July 2003
4
stakeholders. The possible outcomes of the regulatory determination process are: a decision toregulate, a decision not to regulate, or a decision that some other action is needed (e.g., issuance ofguidance).
The NDWAC protocol uses the three statutory requirements of SDWA Section 1412(b)(1)(A)(i)-(iii) (specified in section 1.2) as the foundation for guiding EPA in making regulatory determinationdecisions. For each statutory requirement, evaluation criteria were developed and are summarizedbelow.
To address whether a contaminant may have adverse effects on the health of persons (statutoryrequirement (i)), the NDWAC recommended that EPA characterize the health risk and estimate ahealth reference level (or, in the case of sodium, a benchmark) for evaluating the occurrence data foreach contaminant.
Regarding whether a contaminant is known to occur, or whether there is substantial likelihood thatthe contaminant will occur, in public water systems with a frequency, and at levels, of public healthconcern (statutory requirement (ii)), the NDWAC recommended that EPA consider: (1) the actual andestimated national percent of public water systems (PWSs) reporting detections above half the healthreference level (or benchmark); (2) the actual and estimated national percent of PWSs with detectionsabove the health reference level (or benchmark); and (3) the geographic distribution of the contaminant.
To address whether regulation of a contaminant presents a meaningful opportunity for health riskreduction for persons served by public water systems (statutory requirement (iii)) the NDWACrecommended that EPA consider estimating the national population exposed above half the healthreference level (or benchmark) and the national population exposed above the health reference level (orbenchmark).
The approach EPA used to make regulatory determinations followed the general formatrecommended by the NRC and the NDWAC to satisfy the three SDWA requirements under section1412(b)(1)(A)(i)-(iii). The process was independent of many of the more detailed and comprehensiverisk management factors that will influence the ultimate regulatory decision making process. Thus, adecision to regulate is the beginning of the Agency regulatory development process, not the end.
Specifically, EPA characterized the human health effects that may result from exposure to acontaminant found in drinking water. Based on this characterization, the Agency estimated a healthreference level (HRL) for each contaminant. In the case of sodium, a benchmark was chosen based ontaste effects, which occur at lower concentrations than health effects.
For each contaminant EPA estimated the number of PWSs with detections >½HRL (orbenchmark) and >HRL (or benchmark), the population served at these values, and the geographic

Regulatory Determination Support Document for Sodium July 2003
5
distribution, using a large number of occurrence data (approximately seven million analytical points) thatbroadly reflect national coverage. Round 1 and Round 2 UCM data, evaluated for quality,completeness, bias, and representativeness, were the primary data used to develop national occurrenceestimates. Use and environmental release information, additional drinking water data sets (e.g., Statedrinking water data sets, EPA National Pesticide Survey, and Environmental Working Group datareviews), and ambient water quality data (e.g., NAWQA, State and regional studies, and the EPAPesticides in Ground Water Database) were also consulted.
The findings from these evaluations were used to determine if there was adequate information toevaluate the three SDWA statutory requirements and to make a determination of whether to regulate acontaminant.
1.5 Determination Outcome
After reviewing the best available public health and occurrence information, EPA has made adetermination not to regulate sodium with an NPDWR. This determination is based on the finding thatregulation of sodium may not present a meaningful opportunity for health risk reduction for personsserved by public water systems. However, EPA may issue an advisory to provide guidance tocommunities that may be exposed to drinking water contaminated with sodium chloride or other sodiumsalts. All CCL regulatory determinations and further analysis are formally presented in the FederalRegister Notices (USEPA, 2002a; 67 FR 38222; and USEPA, 2003a; 68 FR 42898). The followingsections summarize the data used to reach this decision.
2.0. CONTAMINANT DEFINITION
Sodium (Na) is a naturally occurring element ubiquitous in the environment. It is the sixth mostabundant element in the Earth’s crust and the most abundant anion in the hydrosphere (the hydrosphereis all water, including atmospheric and oceanic water, on earth; Gornitz, 1972). The sodium cation(Na+) is necessary for biochemical processes like sodium pumps and concentration gradients in manyliving organisms (Madigan et al., 1997). The earth’s oceans contain roughly 18.4 quadrillion short tons(1 short ton = 2000 lbs) of sodium associated with chlorine in the form of sea salt (Kostick, 1993). Inthe lithosphere, most sodium minerals exist as soluble salts found primarily in evaporite deposits, asintricate rock-forming silicates, or as rare halides or aluminohalides (Gornitz, 1972).
Sodium chloride (NaCl), otherwise known as halite, salt, sea salt, or table salt, is the mosteconomically and industrially important form of sodium, with an estimated 14,000 direct and indirectuses. Among other things, salt is used as a flavor enhancer or preservative in food, as a road deicer, inwater softening treatment, in powdered soaps and detergents, as the electrolyte in saline solutions, inrubber manufacturing, and as a pesticide. Sodium chloride is also used in oil and gas exploration, textile

Regulatory Determination Support Document for Sodium July 2003
6
and dyeing industries, metal processing, pulp and paper production, tanning and leather treatment, andin the chemical industry to manufacture such chemicals as chlorine, sodium metal, sodium hydroxide,sodium carbonate, and sodium sulfate (Kostick, 1993; Gornitz, 1972).
2.1 Physical and Chemical Properties
Sodium is an alkali metal located in group 1A of the periodic table, and has an atomic weight of22.99 g/mol, melting point of 97.82 °C, and boiling point of 892 °C. Sodium metal is a soft solid with ashiny metallic luster and is an excellent conductor of electricity. Sodium does not occur in nature in itspure form because the metal readily gives up its single valence electron, making it highly reactive(Brown et al., 1994). Elemental sodium reacts violently with water to form sodium hydroxide andhydrogen gas, and oxidizes in the presence of oxygen to sodium monoxide. Sodium commonly occursas sodium halides (NaCl, NaBr), sodium carbonates (Na2CO3, NaHCO3), sodium sulfates (Na2SO4,NaHSO4), sodium hydride (NaH), or sodium nitrate (NaNO3) (Gornitz, 1972).
2.2 Environmental Fate and Transport
A sodium salt is formed when the sodium cation replaces some or all of the hydrogen cations in anacid. Sodium salts that occur in seawater can be classified as “cyclic” salts because they traversedifferent atmospheric, terrestrial, and aquatic environments before returning to the ocean. Morespecifically, cyclic salts are conveyed from the ocean into the atmosphere by spray and thentransported inland dissolved in suspended water droplets. The salts are transferred to the soil throughprecipitation or dry deposition and eventually leach to freshwater streams and ground water. Fromthese freshwater reservoirs, the salts return to the ocean, thus completing the cycle (Fairbridge, 1972). Sodium chloride that has been used in industry and released into the environment either directly or bymeans of landfills is also expected to cycle back to the ocean (Kostick, 1993).
Sodium salts can occur on earth as evaporite deposits, formed when the rate of evaporationexceeds the rate of precipitation plus runoff. Ancient deposits were formed chiefly by the evaporationof retreating seas (Kostick, 1993; Feldman and Cruft, 1972). Recent evaporite deposits arepredominantly non-marine in origin and occur in hot, arid climates or in windy, restricted basins(Feldman and Cruft, 1972). Evaporite deposits of halite (NaCl) can become deformed underincreasing temperatures and pressures, disrupting surrounding sediment layers and forming salt domes. Salt domes can extend vertically downward more than 20,000 feet and are common in the Gulf Coastregion of the United States (Gornitz, 1972; Kostick, 1993).
Sodium salts are water soluble and can leach to freshwater (Fairbridge, 1972). Sodium does notadsorb strongly to clay, and therefore can be leached from clay sedimentary rock (Creasey, 1972). Sodium salts are natural constituents of ground water because of the abundance of evaporite minerals in

Regulatory Determination Support Document for Sodium July 2003
7
the earth’s crust. Ground water sodium levels may be increased in areas where salt is used to deicehighways (Hackett, 1972).
3.0 OCCURRENCE AND EXPOSURE
This section examines the occurrence of sodium in drinking water. While no complete nationaldatabase exists of unregulated or regulated contaminants in drinking water from public water systems(PWSs) collected under SDWA, this report aggregates and analyzes existing federal and State datathat have been screened for quality, completeness, and representativeness. Populations served byPWSs exposed to sodium are estimated, and the occurrence data are examined for regional or otherspecial trends. To augment the incomplete national drinking water data and aid in the evaluation ofoccurrence, information on the use and environmental release, as well as ambient occurrence of sodium,is also reviewed.
3.1 Use and Environmental Release
3.1.1 Production and Use
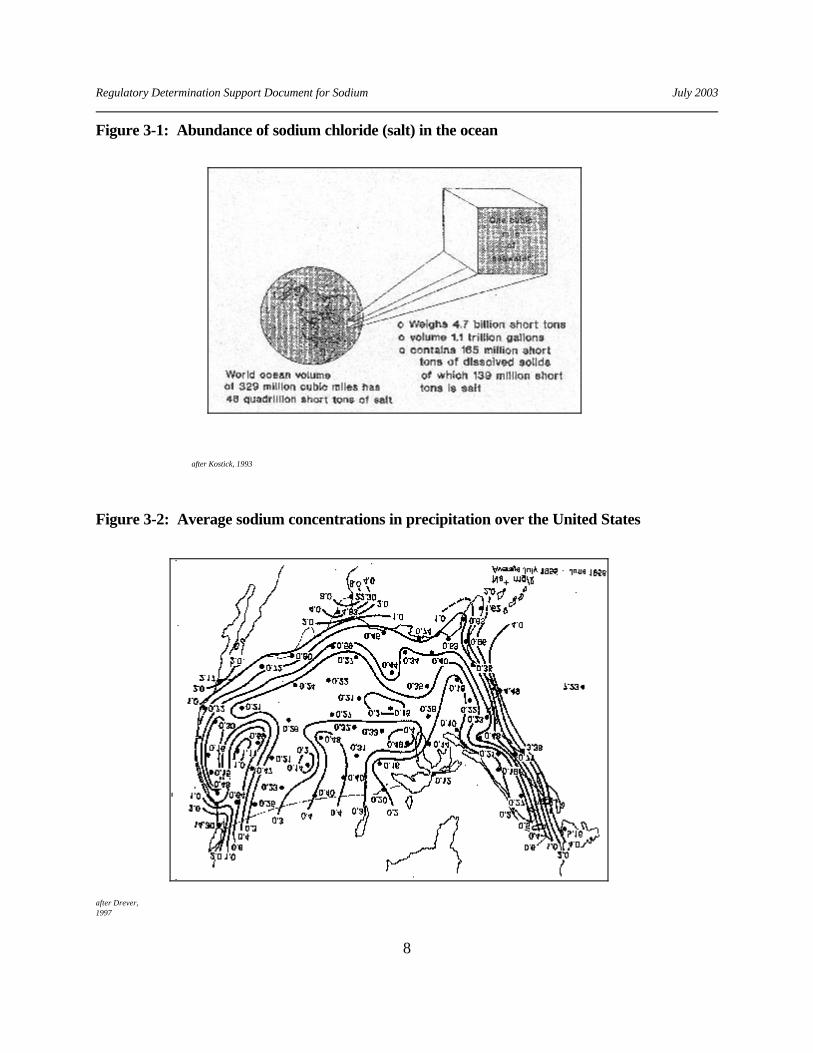
The earth’s oceans contain approximately 46 quadrillion short tons (1 short ton = 2,000 lbs) ofsodium chloride, or 18.4 quadrillion short tons of sodium (sodium chloride is 40% sodium by weight)(Figure 3-1). Sodium chloride is also known as salt, sea salt, halite, or table salt.
Sodium is transported from the ocean to the atmosphere by spray and is suspended in waterdroplets until it is either precipitated or introduced to the soil by dry deposition (Fairbridge, 1972). Sodium levels in precipitation are higher near coastal areas and decrease further inland (Figure 3-2).
Regulatory Determination Support Document for Sodium July 2003
8
Figure 3-1: Abundance of sodium chloride (salt) in the ocean
after Kostick, 1993
Figure 3-2: Average sodium concentrations in precipitation over the United States
after Drever,1997

Regulatory Determination Support Document for Sodium July 2003
9
Table 3-1: End uses of sodium chloride in 1990 (in thousands of short tons)
Sectors and subsectorsShort tons of
NaCl consumedPercent of Total
Chemicals:..................Chlorine and sodium hydroxide manufacture 19,182
..................Manufacture of other chemicals, like sodium carbonate and sodium 2,046
.....................................Total chemicals 21,228 47Ice control/stabilization:...................Government 10,757...................Commercial 545.....................................Total ice control 11,302 25
Food processing...................Meat packers 598...................Dairy 140...................Canning 318...................Baking 171...................Grain mill processing 97...................Other food processing 298...................Grocery wholesale 671...................................Total food processing 2,293 5General Industrial...................Textiles and dyeing 227...................Metal processing 346...................Rubber 45...................Oil 793...................Pulp and paper 283...................Tanning and leather 109...................Other industrial 288.....................................Total general industries 2,091 5Agricultural ...................Feed retailers and/or dealers-mixers 1,101...................Feed manufacturers 546...................Direct-buying and user 55...................Distributors 619.................................... Total agricultural 2,321 5Distributors...................Grocery wholesale and/or retailers 223...................Institutional wholesalers and end users 96
...................U.S. Government resale 9
...................Other wholesale and/or retailers 1,851
.....................................Total distributors 2,030 5Water treatment...................Government 297...................Commercial 198...................Distributors 1,123.....................................Total water treatment 1,618 4Other 2,030 4.....................................Grand total 100
after Kostick, 1993
Sodium chloride is the most economically and industrially important form of sodium, with anestimated 14,000 direct and indirect uses (Kostick, 1993). As depicted in Table 3-1, sodium chlorideuse can be broken down into eight major categories: chemical (47%), ice control (25%), foodprocessing (5%), general industrial (5%), agricultural (5%), distributors (5%), water treatment (4%),and miscellaneous (4%).

Regulatory Determination Support Document for Sodium July 2003
10
Two sodium end uses with the most probable immediate effect on drinking water quality are watertreatment and road deicing. In water treatment, sodium is used as a softener by substituting the sodiumcation, Na+, for calcium (Ca2+) and magnesium (Mg2+), both of which make water “hard.” Water isconsidered “hard” when calcium and magnesium ions occur in high concentrations and leave cakedmineral deposits in household and commercial equipment. Various softening processes exchangesodium cations for calcium and magnesium cations and release sodium directly into the drinking watersupply (Kostick, 1993). Many sodium salts are used for water treatment, for example sodium chloride,sodium hydroxide, sodium bicarbonate, and sodium carbonate.
Sodium chloride that has been used to deice roads can also be a problem for drinking watersystems. The salt and ice mixture creates a brine with a lower freezing point than water, effectivelymelting ice (Kostick, 1993). Sodium chloride is a cheap and effective solution to frozen roads, but canbecome an environmental concern when run-off affects local vegetation and soil quality, as well asground water and surface water supplies. In one study, sodium levels eight times the norm weredetected forty-five feet from the highway in areas where deicing salt had been used for 18 years(USEPA, 1990). A different study, undertaken by the Federal Government and Universityresearchers, found that highway deicing with sodium chloride made a significant impact on the salinity ofthe nation’s streams between the years 1974-1981. Data for the investigation came from the NationalWater Quality Surveillance System and from United States Geological Survey (USGS) NationalStream Quality Accounting Network sampling stations (Smith et al., 1987).
The United States produces more sodium chloride than any other country in the world, with othermajor producers including Russia, England, Germany, Canada, and France (Gornitz, 1972; Kostick,1993). From 1990 to 1998, United States NaCl consumption was between three to ten million metrictons greater than its production (1 metric ton = 2,205 lbs), with imports three to thirteen times higherthan exports (Table 3-2).
Although these figures suggest that the U.S. relies on foreign sources to meet consumption needs,most imports were supplied by foreign subsidiaries of major U.S. sodium chloride producers (Kostick,1998). For the years 1994-1998, United States salt statistics analyzed by State indicate that Louisianasold, or used, the most sodium (35%), followed by Texas (23%), New York (11%), Kansas (7%),and Utah (4%) (Kostick, 1994; Kostick 1995; Kostick, 1996; Kostick, 1997; Kostick, 1998).

Regulatory Determination Support Document for Sodium July 2003
11
Table 3-2: U.S. sodium chloride statistics, 1990-1998 (in thousands of metric tons)
Year Production Exports Imports Consumption,reported*
1998 41,200 731 8,770 44,200
1997 41,400 748 9,160 49,500
1996 42,200 869 10,600 52,800
1995 42,100 670 7,090 46,500
1994 40,100 742 9,630 47,200
1993 39,200 688 5,870 44,400
1992 36,000 992 5,390 39,700
1991 36,300 1,780 6,190 40,600
1990 36,800 2,270 5,970 no dataafter Kostick,1994 and Kostick, 1998*Reported consumption is sales or use as reported by the salt companies including their imports and exports.
3.1.2 Environmental Release
Beyond raw production and use data, the disposal and release of sodium products to theenvironment is of special concern to drinking water systems. The end use of some sodium productsinvolves direct environmental application, as with pesticides like sodium chloride or sodium bromide(USEPA, 1993). Other sodium products are dispersed post-consumption to the environment or aredisposed of in landfills. Table 3-3 outlines the environmental fate of products from general sodiumchloride use categories.
Dispersive losses of sodium chloride are those released to the environment directly afterconsumption. Examples include salt in run-off following highway deicing, effluents in industrial sewage,or salt released into the drinking water supply following water softening treatment. Sodium chloride canalso be dispersed to the environment through use in dry cleaning compounds, perfume, gasolineadditives, pharmaceuticals, and cosmetics. Products disposed of in landfills include those productsbrought to municipal sanitary landfills or toxic/hazardous landfills (Kostick, 1993).
Regulatory Determination Support Document for Sodium July 2003
12
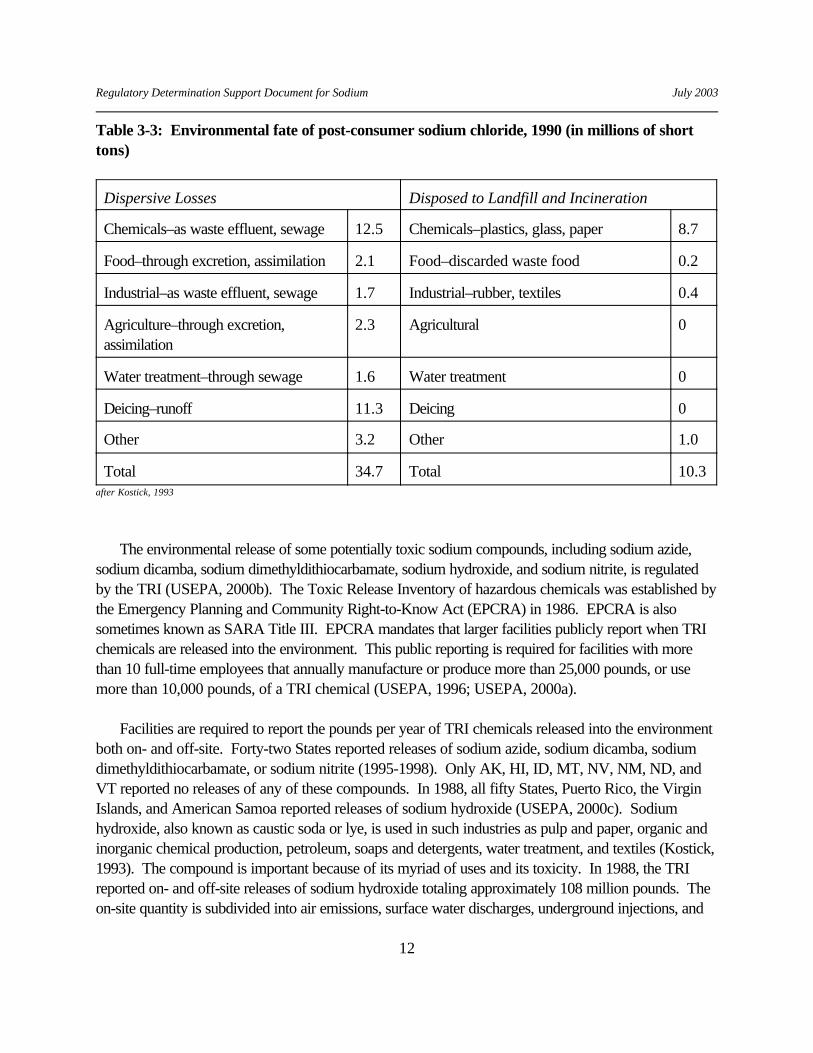
Table 3-3: Environmental fate of post-consumer sodium chloride, 1990 (in millions of shorttons)
Dispersive Losses Disposed to Landfill and Incineration
Chemicals–as waste effluent, sewage 12.5 Chemicals–plastics, glass, paper 8.7
Food–through excretion, assimilation 2.1 Food–discarded waste food 0.2
Industrial–as waste effluent, sewage 1.7 Industrial–rubber, textiles 0.4
Agriculture–through excretion,assimilation
2.3 Agricultural 0
Water treatment–through sewage 1.6 Water treatment 0
Deicing–runoff 11.3 Deicing 0
Other 3.2 Other 1.0
Total 34.7 Total 10.3after Kostick, 1993
The environmental release of some potentially toxic sodium compounds, including sodium azide,sodium dicamba, sodium dimethyldithiocarbamate, sodium hydroxide, and sodium nitrite, is regulatedby the TRI (USEPA, 2000b). The Toxic Release Inventory of hazardous chemicals was established bythe Emergency Planning and Community Right-to-Know Act (EPCRA) in 1986. EPCRA is alsosometimes known as SARA Title III. EPCRA mandates that larger facilities publicly report when TRIchemicals are released into the environment. This public reporting is required for facilities with morethan 10 full-time employees that annually manufacture or produce more than 25,000 pounds, or usemore than 10,000 pounds, of a TRI chemical (USEPA, 1996; USEPA, 2000a).
Facilities are required to report the pounds per year of TRI chemicals released into the environmentboth on- and off-site. Forty-two States reported releases of sodium azide, sodium dicamba, sodiumdimethyldithiocarbamate, or sodium nitrite (1995-1998). Only AK, HI, ID, MT, NV, NM, ND, andVT reported no releases of any of these compounds. In 1988, all fifty States, Puerto Rico, the VirginIslands, and American Samoa reported releases of sodium hydroxide (USEPA, 2000c). Sodiumhydroxide, also known as caustic soda or lye, is used in such industries as pulp and paper, organic andinorganic chemical production, petroleum, soaps and detergents, water treatment, and textiles (Kostick,1993). The compound is important because of its myriad of uses and its toxicity. In 1988, the TRIreported on- and off-site releases of sodium hydroxide totaling approximately 108 million pounds. Theon-site quantity is subdivided into air emissions, surface water discharges, underground injections, and
Regulatory Determination Support Document for Sodium July 2003
13
releases to land. Approximately thirteen million pounds of sodium hydroxide, or roughly 20% of totalon-site releases, were discharged directly to surface water in 1988. The chemical was taken off of theTRI list in 1989 (USEPA, 2000c).
In conclusion, because sodium has so many human end uses and is abundant in the ocean, sodiumis ubiquitous in the environment. Two sodium uses of particular significance to drinking water suppliesare salt for highway deicing and salt for water softening treatment. Sodium chloride is the mosteconomically and industrially important form of sodium, with an estimated 14,000 direct and indirectuses. The United States is the largest sodium chloride producing country in the world, with productionquantities averaging 40 million metric tons from 1990-1998.
The disposal and release of sodium products to the environment is of great concern to drinkingwater supplies. Approximately 34.7 million short tons of sodium chloride were dispersed to theenvironment post-consumption in 1990, while roughly 10.3 million short tons were disposed of inlandfills. The Toxic Release Inventory has reported releases of toxic sodium compounds like sodiumazide, sodium dicamba, sodium dimethyldithiocarbamate, or sodium nitrite in 42 States. Sodiumhydroxide, though listed as a TRI chemical only for reporting year 1988, had documented releases in all50 States as well as Puerto Rico, the Virgin Islands, and American Samoa.
3.2 Ambient Occurrence
To understand the presence of a chemical in the environment, an examination of ambientoccurrence is useful. In a drinking water context, ambient water is source water existing in surfacewaters and aquifers before treatment. The most comprehensive and nationally consistent datadescribing ambient water quality in the United States are being produced through USGS’s NationalWater Quality Assessment (NAWQA) program. NAWQA, however, is a relatively young programand complete national data are not yet available from their entire array of sites across the nation.
3.2.1 Data Sources and Methods
The USGS instituted the NAWQA program in 1991 to examine water quality status and trends inthe United States. NAWQA is designed and implemented in such a manner as to allow consistencyand comparison between representative study basins located around the country, facilitatinginterpretation of natural and anthropogenic factors affecting water quality (Leahy and Thompson,1994).
The NAWQA program consists of 59 significant watersheds and aquifers referred to as “studyunits.” The study units represent approximately two thirds of the overall water usage in the UnitedStates and a similar proportion of the total population served by public water systems. Approximatelyone half of the nation’s land area is represented (Leahy and Thompson, 1994).
Regulatory Determination Support Document for Sodium July 2003
14
To facilitate management and make the program cost-effective, approximately one third of thestudy units at a time are engaged in intensive assessment for a period of 3 to 5 years. This is followedby a period of less intensive research and monitoring that lasts between 5 and 7 years. In this way, all59 study units rotate through intensive assessment over a ten-year period (Leahy and Thompson,1994). The first round of intensive monitoring (1991-96) targeted 20 study units and the second roundmonitored another 16 beginning in 1994.
Sodium is an analyte for both surface and ground water NAWQA studies, with a MinimumReporting Level (MRL) of 0.2 mg/L. Sodium occurrence in bed sediments is also assessed (MRL =0.005%).
Sodium data from the first two rounds of intensive NAWQA monitoring have undergone USGSquality assurance checks and are available to the public through their NAWQA Data Warehouse(USGS, 2001). Occurrence results are presented below. The descriptive statistics generated from thesodium NAWQA data broadly characterize the frequency of sodium detections by sample and by site. Furthermore, detection frequencies above a benchmark level of 120 mg/L are also presented for allsamples, and by site (see Section 3.3.1.4 for further discussion of this benchmark level and itsdevelopment). The median and 99th percentile concentrations are included as well to characterize thespread of sodium concentration values in ambient waters sampled by the NAWQA program.
3.2.2 Results
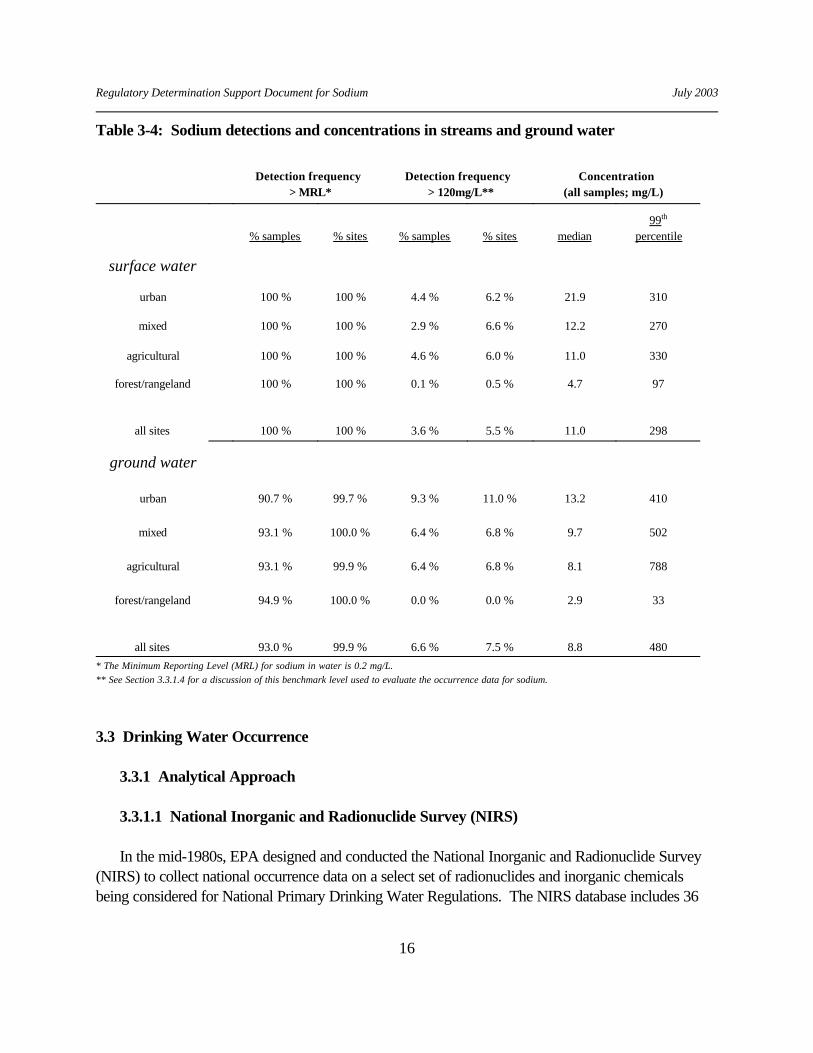
Typical of many inorganic contaminants, sodium occurrence in ambient surface and ground watersis high (Table 3-4). This is not surprising, considering that sodium is the sixth most abundant element inthe Earth’s crust, the most abundant anion in the hydrosphere, and is used in many products. Surfaceand ground water detection frequencies are similar, between 90% and 100% in all cases, thoughground water detections are somewhat lower. Median sodium concentrations and benchmarkexceedances are also similar between surface and ground water, but ground water benchmarkexceedances are generally higher than surface water exceedances, while median concentrations arelower for ground water. The 99th percentile concentrations are variable but are generally higher forground water.
Table 3-4 illustrates that low-level sodium occurrence is ubiquitous. Surface water detectionfrequencies are 100% for all land use categories. Detection frequencies > 120 mg/L (by site) aresimilar for urban, mixed, and agricultural areas, while forest/rangeland areas show extremely lowfrequencies of benchmark exceedances. These results are understandable because forest/rangelandbasins are not as affected by anthropogenic inputs of sodium (like agrochemical applications) as otherland use categories.

Regulatory Determination Support Document for Sodium July 2003
15
Median concentrations for sodium in surface waters range from 4.7 mg/L in forest/rangeland areasto 21.9 mg/L in urban areas. The median level in urban basins is substantially higher than in other landuse categories and may reflect the effects of road salt applications, more prevalent in areas with greaterpopulation densities. The 99th percentile concentrations are similar for all land use categories except forforest/rangeland areas, with a lower 99th percentile concentration. Simple detections and detectionsexceeding the benchmark by site, for all sites, are approximately 100% and 5.5%, respectively. Thesefigures indicate that although sodium is ubiquitous in surface water, detection frequencies at levelsexceeding the benchmark concentration level are relatively low.
For ground water, detections approach 100% of sites for all land use categories. Urban areasshow the greatest median concentration and frequency of benchmark exceedances. Forest/rangelandareas show no detections greater than the benchmark, and exhibit the lowest median and 99th percentilevalues. These results suggest that urban and agricultural releases of sodium can leach to ground water,as forest/rangeland areas have such consistently low detection values. Detection frequencies above theMRL and the benchmark level for all sites are approximately 99.9% of sites and 7.5% of sites,respectively. Again, sodium detection frequencies in ground water at levels exceeding the benchmarkconcentration level are low compared to sodium occurrence.
Similar to surface and ground water, 100% of bed sediment sampling sites showed detections in allland use categories. Sodium concentrations in bed sediments are measured by the percent of sodiumby weight in the sediment sample analyzed. The median concentrations range from 0.4%(forest/rangeland basins) to 0.8% (urban basins) and the 99th percentile concentrations range from1.8% (forest/rangeland and agricultural) to 2.0% (urban). Again, similar to surface and ground waters,urban basins and forest/rangeland basins occupy the extremes of the concentration percentile spectrum. However, bed sediment concentration percentiles are generally comparable across land use types. Theoccurrence of sodium in stream sediments is pertinent to drinking water concerns because somedesorption of the compound from sediments into water will occur through equilibrium reactions,although at very low rates.
Regulatory Determination Support Document for Sodium July 2003
16
Table 3-4: Sodium detections and concentrations in streams and ground water
Detection frequency > MRL*
Detection frequency > 120mg/L**
Concentration(all samples; mg/L)
% samples % sites % samples % sites median99th
percentile
surface water
urban 100 % 100 % 4.4 % 6.2 % 21.9 310
mixed 100 % 100 % 2.9 % 6.6 % 12.2 270
agricultural 100 % 100 % 4.6 % 6.0 % 11.0 330
forest/rangeland 100 % 100 % 0.1 % 0.5 % 4.7 97
all sites 100 % 100 % 3.6 % 5.5 % 11.0 298
ground water
urban 90.7 % 99.7 % 9.3 % 11.0 % 13.2 410
mixed 93.1 % 100.0 % 6.4 % 6.8 % 9.7 502
agricultural 93.1 % 99.9 % 6.4 % 6.8 % 8.1 788
forest/rangeland 94.9 % 100.0 % 0.0 % 0.0 % 2.9 33
all sites 93.0 % 99.9 % 6.6 % 7.5 % 8.8 480* The Minimum Reporting Level (MRL) for sodium in water is 0.2 mg/L.** See Section 3.3.1.4 for a discussion of this benchmark level used to evaluate the occurrence data for sodium.
3.3 Drinking Water Occurrence
3.3.1 Analytical Approach
3.3.1.1 National Inorganic and Radionuclide Survey (NIRS)
In the mid-1980s, EPA designed and conducted the National Inorganic and Radionuclide Survey(NIRS) to collect national occurrence data on a select set of radionuclides and inorganic chemicalsbeing considered for National Primary Drinking Water Regulations. The NIRS database includes 36
Regulatory Determination Support Document for Sodium July 2003
17
inorganic compounds (IOCs) (including 10 regulated IOCs), 2 regulated radionuclides, and 4unregulated radionuclides. Sodium was one of the 36 IOCs monitored.
The NIRS provides contaminant occurrence data from 989 community PWSs served by groundwater. The NIRS does not include surface water systems. The selection of this group of PWSs wasdesigned so that the contaminant occurrence results are statistically representative of nationaloccurrence. Most of the NIRS data are from smaller systems (based on population served by thePWS) and each of these statistically randomly selected PWSs was sampled a single time between 1984and 1986.
The NIRS data were collected from PWSs in 49 States. Data were not available for the State ofHawaii. In addition to being statistically representative of national occurrence, NIRS data are designedto be divisible into strata based on system size (population served by the PWS). Uniform detectionlimits were employed, thus avoiding computational (statistical) problems that sometimes result frommultiple laboratory analytical detection limits. Therefore, the NIRS data can be used directly fornational contaminant occurrence analyses with very few, if any, data quality, completeness, orrepresentativeness issues.
3.3.1.2 Supplemental IOC Data
One limitation of the NIRS study is a lack of occurrence data for surface water systems. Toprovide perspective on the occurrence of sodium in surface water PWSs relative to ground waterPWSs, SDWA compliance monitoring data that were available to EPA were reviewed from Stateswith occurrence data for both ground and surface water.
The State ground water and surface water PWS occurrence data for sodium used in this analysiswere submitted by States for an independent review of the occurrence of regulated contaminants inPWSs at various times for different programs (USEPA, 1999). In the USEPA (1999) review,occurrence data from a total of 14 States were noted. However, because several States containeddata that were incomplete or unusable for various reasons, only 12 of the 14 States were used for ageneral overview analysis. From these 12 States, 8 were selected for use in a national analysis becausethey provided the best data quality and completeness and a balanced national cross-section ofoccurrence data. These eight were Alabama, California, Illinois, Michigan, Montana, New Jersey,New Mexico, and Oregon.
Only the Alabama, California, Illinois, New Jersey, and Oregon State data sets containedoccurrence data for sodium. The data represent approximately 36,000 analytical results from morethan 5,500 PWSs mostly during the period from1993 to 1997, though some earlier data are alsoincluded. The number of sample results and PWSs vary by State.
Regulatory Determination Support Document for Sodium July 2003
18
3.3.1.3 Data Management and Analysis
The data used in the State analyses were limited to only those data with confirmed water sourceand sampling type information. Only standard SDWA compliance samples were used; “special”samples, “investigation” samples (investigating a contaminant problem that would bias results), orsamples of unknown type were not used in the analyses. Various quality control and review checkswere made of the results, including follow-up questions to the States that provided data. Many of themost intractable data quality problems encountered occurred with older data. These problematic datawere, in some cases, simply eliminated from the analysis. For example, when the number ofproblematic data were insignificant relative to the total number of observations they were dropped fromthe analysis (for further details see USEPA, 1999).
3.3.1.4 Occurrence Analysis
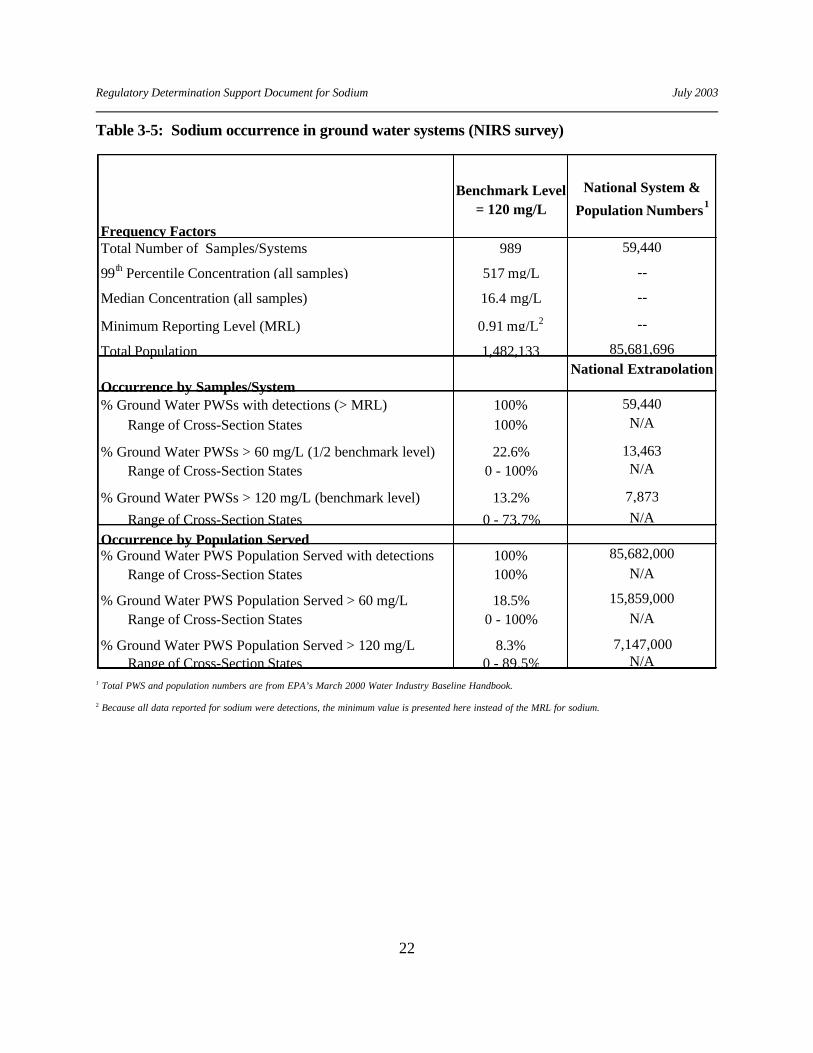
The summary descriptive statistics presented in Table 3-5 for sodium are derived from analysis ofthe NIRS data. Included are the total number of samples, the 99th percentile concentration of allsamples, and the median concentration of all samples. The percentages of PWSs and populationserved indicate the proportion of PWSs and PWS population served whose analytical results showed adetection(s) of the contaminant (simple detection, > MRL) at any time during the monitoring period; ora detection(s) greater than half the benchmark level; or a detection(s) greater than the benchmark level.
The benchmark level used to evaluate the occurrence information for sodium is 120 mg/L, whichwas derived from the National Research Council’s dietary guideline (NRC, 1989a) for adults of 2.4g/day for sodium from sodium chloride (table salt). The Drinking Water Equivalent concentration is 1.2g/L given a drinking water intake of 2 L/day. A Relative Source Contribution (RSC) of 10% wasapplied, giving rise to the benchmark of 120 mg/L ([2400mg/2L]* 0.10).
In Table 3-5, national occurrence is estimated by extrapolating the summary statistics for sodium tonational numbers for systems, and population served by systems, from the Water Industry BaselineHandbook, Second Edition (USEPA, 2000d). From the handbook, the total number of ground watercommunity water systems (CWSs) plus ground water non-transient, non-community water systems(NTNCWSs) is 59,440, and the total population served by ground water CWSs plus ground waterNTNCWSs is approximately 85.6 million persons (see Table 3-5). To arrive at the nationaloccurrence estimates, the national estimate for ground water PWSs (or population served by groundwater PWSs) is simply multiplied by the percentage for the given summary statistic (e.g., the nationalestimate for the total number of ground water PWSs with detections (i.e., > MRL; 59,440) is theproduct of the percentage of ground water PWSs with detections (100%) and the national estimate forthe total number of ground water PWSs (59,440)).

Regulatory Determination Support Document for Sodium July 2003
19
The nationally extrapolated occurrence estimates for sodium are not presented in the FederalRegister Notice. While the NIRS data were collected in a statistically appropriate fashion suitable forextrapolation, the data available for many CCL regulatory determination priority contaminants were nota strict statistical sample. National extrapolations of these data can be problematic. Also, the NIRSdata only represent ground water PWSs. Thus, national extrapolations from NIRS data do notrepresent national occurrence for all PWSs. Therefore, to maintain consistency across all CCLregulatory determination priority contaminants, a straight-forward presentation, and data integrity, onlythe actual occurrence results for all CCL regulatory determination priorities are presented in theFederal Register Notice for stakeholder review. The nationally extrapolated occurrence values forsodium are presented here, however, to provide additional perspective.
In Table 3-6, occurrence data on sodium directly submitted by the States of Alabama, California,Illinois, New Jersey, and Oregon for A Review of Contaminant Occurrence in Public WaterSystems (USEPA, 1999) were used to augment the NIRS study which lacked surface water data. Included in the table are the same summary statistics as Table 3-5, with additional informationdescribing the relative distribution of sodium occurrence between ground water and surface waterPWSs in the 5 States.
The State data analysis was focused on occurrence at the system level because a PWS with aknown contaminant problem usually has to sample more frequently than a PWS that has never detectedthe contaminant. The results of a simple computation of the percentage of samples with detections (orother statistics) can be skewed by the more frequent sampling results reported by the contaminated site. The system level of analysis is conservative. For example, a system need only have a single samplewith an analytical result greater than the MRL, i.e., a detection, to be counted as a system with a result“greater than the MRL.”
When computing basic occurrence statistics, such as the number, or percent, of samples, orsystems, with detections of a given contaminant, the value (or concentration) of the MRL can haveimportant consequences. For example, the lower the reporting limit, the greater the number ofdetections (Ryker and Williamson, 1999). As a simplifying assumption, a value of half the MRL is oftenused as an estimate of the concentration of a contaminant in samples/systems whose results are lessthan the MRL. However, for these occurrence data this is not straightforward. This is in part related toState data management differences as well as real differences in analytical methods, laboratories, andother factors.
The situation can cause confusion when examining descriptive statistics for occurrence. Because asimple meaningful summary statistic is not available to describe the various reported MRLs, and toavoid confusion, MRLs are not reported in the summary table (Table 3-6).
3.3.2 Results
Regulatory Determination Support Document for Sodium July 2003
20
The NIRS data in Table 3-5 show that approximately 100% of ground water PWSs (thisextrapolates to all 59,440 systems nationally) had detections of sodium, affecting about 100% of theground water PWS population served (approximately 85.6 million people nationally). Approximately23% of the NIRS PWSs had detections greater than ½ the benchmark level of 120 mg/L (about13,500 ground water PWSs nationally), affecting approximately 18.5% of the population served(estimated at 15.9 million people nationally). The percentage of NIRS PWSs with detections greaterthan the benchmark level of 120 mg/L was approximately 13% (about 8,000 ground water PWSsnationally), affecting 8.3% of the population served (estimated at approximately 7.1 million peoplenationally)
Drinking water data for sodium from the supplemental individual States vary among States (Table3-6). Sodium monitoring has not been required under SDWA, though these States had obviouslyconducted some monitoring. Alabama, California, New Jersey, and Oregon have substantial amountsof data and PWSs represented. However, the number of systems with sodium data for Illinois is farless than the number of PWSs in this State. Hence, it is not clear how representative these data are. Because the NIRS data only represent sodium occurrence in ground water PWSs, the supplementalState data sets provide some perspective on surface water PWS occurrence.
For simple detections, the supplemental State data show a range from 99.3% to 100% of groundwater PWSs (Table 3-6). These figures are comparable to the NIRS ground water PWS results:100% greater than the MRL (Table 3-5). The supplemental State data show 100% simple detectionsfor surface water PWSs. Comparisons made between data for simple detections need to be viewedwith caution because of differences in MRLs between the State data sets and the NIRS study, andamong the States themselves (see Section 3.3.1.4), though these numbers for sodium are verycomparable. For further perspective, the median concentration of all samples for the NIRS data (16.4mg/L) is bracketed by the range of median concentrations from the States’ data (5.26 mg/L to 31mg/L).
The supplemental State data sets indicate that ground water PWS detections greater than thebenchmark level of 120 mg/L are between 3% and 15% (Table 3-6). The NIRS national average iswithin this range at 13.2% of PWS greater than the benchmark level of 120 mg/L (Table 3-5). Asmight be expected, surface water PWSs showed slightly fewer exceedances of the benchmark levelthan ground water PWSs, ranging from 0% - 3%.
Reviewing sodium occurrence by PWS population served shows that from 0.5% - 50% of theStates’ ground water PWS populations were served by systems with detections greater than thebenchmark level of 120 mg/L (Table 3-6). However, the figure of 50% is the maximum among thesupplementary States. Three of the 5 States show ground water PWS populations receiving more than120 mg/L at percentages lower than that for NIRS, which is 8.3%. Populations served by surfacewater PWSs with detections greater than 120 mg/L ranged from 0% - 1.4% among the five
Regulatory Determination Support Document for Sodium July 2003
21
supplemental States. Population figures for the supplemental States are incomplete and are onlyreported for those systems in the database that have reported their population data. For sodium,approximately 82% of the PWSs reporting occurrence data for these 5 States also reported populationdata.
Regulatory Determination Support Document for Sodium July 2003
22
Benchmark Level = 120 mg/L
Total Number of Samples/Systems 989
99th Percentile Concentration (all samples) 517 mg/L
Median Concentration (all samples) 16.4 mg/L
Minimum Reporting Level (MRL) 0.91 mg/L2
Total Population 1,482,133
Occurrence by Samples/System% Ground Water PWSs with detections (> MRL) 100%
Range of Cross-Section States 100%
% Ground Water PWSs > 60 mg/L (1/2 benchmark level) 22.6%Range of Cross-Section States 0 - 100%
% Ground Water PWSs > 120 mg/L (benchmark level) 13.2%Range of Cross-Section States 0 - 73.7%
Occurrence by Population Served% Ground Water PWS Population Served with detections 100%
Range of Cross-Section States 100%
% Ground Water PWS Population Served > 60 mg/L 18.5%Range of Cross-Section States 0 - 100%
% Ground Water PWS Population Served > 120 mg/L 8.3%Range of Cross-Section States 0 - 89.5%
Frequency Factors
National System &
Population Numbers1
59,440
--
--
National Extrapolation85,681,696
--
59,440N/A
13,463N/A
7,873N/A
85,682,000
N/A
N/A
15,859,000N/A
7,147,000
Table 3-5: Sodium occurrence in ground water systems (NIRS survey)
1 Total PWS and population numbers are from EPA’s March 2000 Water Industry Baseline Handbook.
2 Because all data reported for sodium were detections, the minimum value is presented here instead of the MRL for sodium.

Regulatory Determination Support Document for Sodium July 2003
23
Alabama California Illinois New Jersey Oregon
Total Number of Samples 1,327 27,494 383 4,417 2,319Number of Ground Water Samples 917 25,111 313 3,941 1,506Number of Surface Water Samples 410 2,383 70 476 813
Percent of Samples with Detections 99.3% 99.5% 100% 99.0% 98.8%Percent of Ground Water Samples with Detections 99.0% 99.6% 100% 99.1% 98.8%Percent of Surface Water Samples with Detections 99.8% 99.5% 100% 98.1% 100%
99th Percentile Concentration (all samples) 260 mg/L 209 mg/L 370 mg/L 150 mg/L 166 mg/L
Median Concentration (all samples) 5.26 mg/L 31 mg/L 25 mg/L 14 mg/L 9.78 mg/L
Minimum Reporting Level (MRL) Variable1 Variable1 Variable1 Variable1 Variable1
Total Number of PWSs 435 2,433 227 1,444 1,032Number of Ground Water PWSs 366 2,214 160 1,411 863Number of Surface Water PWSs 69 219 67 33 169
Total Population Served 3,662,222 45,375,106 1,995,394 6,350,025 2,101,401Ground Water PWS Population Served 1,820,214 27,791,117 724,635 2,478,067 1,261,661Surface Water PWS Population Served 1,837,743 30,740,138 1,270,179 3,871,958 1,497,224
Occurrence by System
% PWSs with detections (> MRL) 100% 99.8% 100% 99.4% 99.4%Ground Water PWSs with detections 100% 99.8% 100% 99.4% 99.3%Surface Water PWSs with detections 100% 100% 100% 100% 100%
Benchmark Level = 120 mg/L
% PWSs > 1/2 Benchmark Level 22.3% 29.4% 19.4% 11.0% 10.5%Ground Water PWSs > 1/2 Benchmark Level 26.2% 30.5% 26.3% 11.0% 11.7%Surface Water PWSs > 1/2 Benchmark Level 1.5% 18.3% 3.0% 12.1% 4.1%
% PWSs > Benchmark Level 9.7% 11.4% 10.6% 3.6% 2.8%Ground Water PWSs > Benchmark Level 11.5% 12.2% 15.0% 3.6% 3.1%Surface Water PWSs > Benchmark Level 0.0% 2.7% 0.0% 3.0% 1.2%
Occurrence by Population Served
% PWS Population Served with detections 100% 100% 100% 100.0% 100.0%Ground Water PWS Population with detections 100% 100% 100% 99.9% 99.9%Surface Water PWS Population with detections 100% 100% 100% 100% 100%
Benchmark Level = 120 mg/L
% PWS Population Served > 1/2 Benchmark Level 17.5% 76.5% 11.2% 13.7% 3.5%Ground Water PWS Population > 1/2 Benchmark 33.2% 69.4% 30.2% 21.2% 4.6%Surface Water PWS Population > 1/2 Benchmark 0.0% 77.2% 0.3% 8.9% 1.1%
% PWS Population Served > Benchmark Level 5.0% 33.3% 8.7% 1.8% 0.4%Ground Water PWS Population > Benchmark Level 8.1% 49.4% 24.0% 4.3% 0.5%Surface Water PWS Population > Benchmark Level 0.0% 1.4% 0.0% 0.2% 0.1%
Frequency Factors
Table 3-6: Occurrence summary of ground and surface water systems by State for sodium
1 See Section 3.3.1.4 for details

Regulatory Determination Support Document for Sodium July 2003
24
3.4 Conclusion
The Toxic Release Inventory has reported releases of toxic sodium compounds like sodium azide,sodium dicamba, sodium dimethyldithiocarbamate, or sodium nitrite in 42 States. Sodium hydroxide,though only listed as a TRI chemical for reporting year 1988, had documented releases in all 50 Statesas well as Puerto Rico, the Virgin Islands, and American Samoa.
Low-level sodium occurrence in ambient waters and stream bed sediments monitored by theUSGS NAWQA program is ubiquitous, approaching 100% of water and sediment sampling sites for allland use categories. Forest/rangeland basins show the lowest frequency of benchmark levelexceedances, median concentrations, and 99th percentile concentrations across all land use categoriesfor ambient waters and bed sediments. Benchmark level exceedances, median, and 99th percentileconcentrations are generally similar for all other land use categories, although urban and agriculturalbasins sometimes exhibit higher levels. Although sodium detection frequencies are high in ambientwaters and stream bed sediments, sodium occurrence at levels of public health concern is low.
Sodium has been detected in ground water PWS samples collected through the NIRS study. Occurrence estimates are high with 100% of samples showing detections affecting 100% of the nationalpopulation served. The 99th percentile concentration of all samples is 517 mg/L. At the benchmarklevel of 120 mg/L, 13.2% of the NIRS systems showed exceedances, affecting approximately 7.1million people nationally.
Additional SDWA data from the States of Alabama, California, Illinois, New Jersey, and Oregon,including both ground water and surface water PWSs, were examined through independent analysesand also show substantial levels of sodium occurrence. These data provide perspective on the NIRSestimates that only include data for ground water systems. The supplemental State data show that allfive States reported almost 100% detections in both ground water and surface water systems. Atdetections above the benchmark level of 120 mg/L, surface water PWS detection frequencies aregenerally lower than those for ground water. If national data for surface water systems were available,the occurrence and exposure estimates would be substantially greater than from NIRS alone.
4.0 HEALTH EFFECTS
A full description of the health effects associated with exposure to sodium are presented in Drinking Water Advisory: Consumer Acceptability Advice and Health Effects Analysis onSodium (USEPA, 2003). A summary of the pertinent findings are presented below.
Regulatory Determination Support Document for Sodium July 2003
25
4.1 Hazard Characterization and Mode of Action Implications
Sodium is physiologically necessary for maintaining normal body fluid volume, blood pressure, andcell function. The major source of sodium generally comes from the intake of food, with only a smallcontribution from drinking water. Normal sodium level in the blood is about 154 mEq/L.
According to the National Research Council, the estimated minimum daily requirements for sodiumare 120–225 mg for infants (0 months-1 year), 300-400 mg for children (2-9 years), and 500 mg forindividuals 10 years and older (NRC, 1989a). Sodium requirements increase during pregnancy andlactation. The American Heart Association and the National Institutes of Health recommend thathealthy adults restrict their sodium intake to no more than 2,400 mg/day in order to lower the risk ofhypertension (AHA, 2000; NIH, 1993). Typically, the average sodium intake ranges from 3,500 to4,500 mg/day (Karanja et al., 1999).
About 3% of the U.S. population is on sodium restricted diets. In general, sodium exposure islimited to levels of 250, 500, 1,000 or 2,000 mg/day in these diets. A no-added-salt diet restricts onlyfoods that are high in sodium. However, these so called no-added-salt diets still average about 4,000mg of sodium per day, indicating the abundance of sodium in the food supply (Cataldo and Whitney,1986). Individuals on sodium restricted diets may need to consider the level of sodium in drinkingwater supply when planning their diet (Cataldo and Whitney, 1986).
Experimental studies performed on rats and human adults suggest a positive correlation betweenexcessive sodium intake and hypertension (NAS, 1977; WHO, 1979; NIH, 1993). One study, basedupon 10,079 subjects in 32 countries, reports an increase in systolic pressure of 2.2 mm Hg for every2,300 mg increase in sodium intake (ICRG, 1988; Elliot et al., 1989). Extreme hypertension isassociated with coronary artery disease and stroke (Stamler, 1991). In addition, high sodium intakemay result in increased heart muscle thickness in response to increased blood pressure (Schmieder etal., 1988).
Despite consistent reports on adults, blood pressure and sodium intake reports on children areinconsistent. While some studies associate an increase in blood pressure with a high sodium diet(Calabrese and Tuthill, 1977, 1981; Tuthill and Calabrese, 1979), other studies fail to find a correlation(Pomrehn et al., 1983; Faust, 1982; Armstrong et al., 1982; Tuthill et al., 1980).
Earlier clinical trial studies have indicated that lower sodium intake does not yield convincingevidence for risk reduction of cardiovascular disease in populations with normal blood pressures(Muntzel and Drueke, 1992; Salt Institute, 2000; NIH, 1993; Callaway, 1994; Kotchen andMcCarron, 1998; McCarron, 1998). However, results of the recent Dietary Approaches to StopHypertension (DASH) trials at Brigham and Women’s Hospital suggest that restricted dietary intake ofsodium is, in fact, beneficial for many people with hypertension (Harsha et al., 1999; Sacks et al.,

Regulatory Determination Support Document for Sodium July 2003
26
2001). In addition to sodium restriction, lifestyle and dietary changes such as weight reduction,exercise, stress reduction, and adequate dietary potassium, calcium, and magnesium are effective non-medicinal treatments against hypertension. Limiting cholesterol, dietary fat, and alcohol intake is alsorecommended (Whitney et al., 1987).
While sodium salts are generally not considered acutely toxic to humans, acute effects and deathhave been reported in cases of very high sodium intake (RTECS, 2000; WHO, 1979). The effects ofhigh sodium levels from ingestion appear to be more severe for infants than adults because infantkidneys are not yet able to process the sodium (Sax, 1975).
Data on the reproductive toxicity of sodium are sparse. In a study done on rats, excessive sodiumchloride (1,570 mg sodium/kg body weight) caused fetal and maternal toxic effects. Maternal toxicityeffects included decreased pregnancy rates and decreased body weight gain, while fetotoxic effectsincluded high mortality rate (Karr-Dullien and Bloomquist, 1979). Developmental effects wereobserved only in a strain of rat pups bred to be hypertensive that were fed high sodium diets for up to 4months after birth. No developmental effects in rat strains with normal blood pressure were noted inthis study.
Although sodium is not considered carcinogenic, it may influence genotoxic events, thus increasingthe likelihood of tumor development. High oral doses of sodium chloride in the presence ofcarcinogens may cause damage to the gastrointestinal tract and lead to an increase in DNA synthesisand cell regeneration. Gastric tumors could, therefore, be a potential adverse health effect (Tatematsuet al., 1975; NRC, 1989b; Takahashi et al., 1983).
4.2 Dose-Response Characterization and Implications in Risk Assessment
Although numerous human studies have examined sodium intake and blood pressure effects, theycannot serve to characterize dose-response relationships. First, the results are inconsistent; second, thesodium intake measurements are indirect (as determined by the amount of sodium excreted in theurine); and third, the results are influenced by other factors such as nutrients in the diet, lifestyle, andbehavioral patterns rather than sodium itself (Muntzel and Drueke, 1992; Salt Institute, 2000; NIH,1993; Callaway, 1994; Kotchen and McCarron, 1998; McCarron, 1998).
Dose-response data are controversial. As noted above, the American Heart Associationrecommends that healthy adults restrict their sodium intake to 2,400 mg/day (2000). In the DASHstudy, sodium sensitive individuals who reduced their sodium intake by 2,300 mg/day from averagelevels of 3,500S4,500 mg/day lowered their systolic blood pressure by 3.7 mm Hg (compared to 1 mmHg in normal individuals). Furthermore, hypertensive individuals that increase dietary calcium,potassium, magnesium, and fiber (by following the high fruit and vegetable DASH diet), but do notchange sodium levels, achieve similar reductions in systolic pressure (Harsha et al., 1999). A
Regulatory Determination Support Document for Sodium July 2003
27
combination of the DASH diet with sodium restriction yields additional reductions in blood pressureamong hypertensive and normotensive subjects (Sacks et al., 2001). Thus, dose-response effects aredifficult to characterize because they are population and lifestyle dependent.
4.3 Relative Source Contribution
Food is the principle source of exposure to sodium. Of the total amount of sodium present in food,only a relatively low amount (10%) is naturally occurring (Sanchez-Castillo et al., 1987a,b). Themajority of dietary sodium comes from sodium chloride that is added during food processing andpreparation. Sanchez-Castillo et al. estimate that 15% of dietary sodium comes from salt added duringcooking and at the table, whereas 75% is from salt added during food processing and manufacture(1987a,b). The first National Health and Nutrition Examination Survey reported that approximately32% of the sodium chloride consumed comes from baked goods and cereals, 21% from meats, and14% from dairy products (Abraham and Carroll, 1981). Using data from a two-year dietary survey,Subar et al. found that 23.4% of the dietary salt intake comes from table salt and processed foods suchas cold cuts and other processed meats, condiments, and snack foods (i.e. chips, popcorn; 1998). Yeast breads provide 10.9% of the sodium, cheese, 5.6%, and ham, 4.1%. Together, these foodscontribute 44.1% of total sodium intake.
Reported dietary intakes of sodium from various studies range from 1,800 mg/day to 5,000mg/day, depending on the methods of assessment used (Abraham and Carroll, 1981; Dahl, 1960;Pennington et al.; 1984, Karanja et al., 1999; Kurtzweil, 1995). The amount of discretionary sodiumintake is highly variable and can be quite large. The Food and Drug Administration found that mostAmerican adults tend to eat between 4,000 and 6,000 mg of sodium/day, while individuals on asodium-restricted diet usually ingest less than 1,000 to 3,000 mg/day (Kurtzweil, 1995). In theassessment of pretreatment diets for the participants in the DASH trials, sodium levels range from about3,500 to 4,500 mg/day (Karanja et al., 1999).
If the relative source is calculated from the median value for sodium in drinking water (16 mg/L)using 4,000 mg sodium/day as a baseline for dietary sodium and 2 L/day as a water intake, drinkingwater contributes only 0.8% of the total dietary sodium. If the relative source is calculated from the99th percentile value (about 500 mg/L), drinking water contributes 25% of the daily sodium. If the 2.4g/day recommended intake is used as a baseline, systems at the median concentration contribute 1.3%of the recommended intake, but systems at the 99th percentile contribute 41.6% of the total. Habitualintake of 2 L of water per day at this concentration is not advisable. However, the palatability of thewater could be adversely affected by high sodium concentration, which would likely diminish total waterintake and lead to corrective measures.

Regulatory Determination Support Document for Sodium July 2003
28
4.4 Sensitive Populations
Populations expected to have an increased sensitivity to sodium include infants/children, individualswith hypertension, the elderly (blood pressure increases with age), African Americans (the incidence ofhypertension is disproportionally high among African Americans) and individuals with renal diseases.
Several studies indicate that younger children are more sensitive to high sodium levels than areadults (Elton et al. 1963; Gauthier, 1969; DeGenaro and Nyhan, 1971). This heightened sensitivity isassociated with the immature kidney’s decreased ability to control sodium levels. On a mg sodium perkg body weight basis, however, the sodium requirement for infants and children is greater than foradults (NRC, 1989a).
The elderly are also more sensitive to high sodium exposure because they have a higher incidenceof cardiovascular disease (including hypertension) than younger subjects (Sowers and Lester, 2000). In addition, since the elderly tend to have a higher taste threshold for salt, they may also have a higherdietary salt intake (Hyde and Feller, 1981; Stevens, 1996). African-Americans, in particular, are moresusceptible to sodium-induced adverse health effects because of high incidence of hypertension(Sullivan, 1991; Svetkey et al., 1996).
Individuals with decreased renal function comprise another group that is sensitive to high sodiumintake. One study demonstrates that 4,600 mg/day of sodium chloride significantly elevates systolicblood pressure in patients with chronic renal failure (Muntzel and Drueke, 1992). In addition, Muntzeland Drueke postulated that abnormal kidney function is a factor in salt retention by salt-sensitiveindividuals. Sodium retention has also been reported in rats given high doses of sodium chloride,following partial nephrectomy (Muntzel and Drueke, 1992). Dietary sodium restrictions arerecommended for individuals with acute or chronic renal problems and for those with nephroticsyndrome (Whitney, et al. 1987). Renal problems are associated with about 10% of the populationwith hypertension (Whitney, et al. 1987).
Among the sodium-sensitive population, dietary restrictions alone are insufficient for preventingadverse heath effects that result from high sodium levels. Programs for hypertensives include weightreduction, exercise, stress reduction, and adequate dietary potassium, calcium, and magnesium, inaddition to sodium restriction. As mentioned earlier, limiting cholesterol, dietary fat, and alcohol intakeis also recommended. At blood pressures over 95/160 mm Hg (diastolic/systolic), diet and behaviormodification are often combined with pharmaceutical measures.

Regulatory Determination Support Document for Sodium July 2003
29
4.5 Exposure and Risk Information
While nearly the entire public water system population is exposed to sodium through their drinkingwater, only about 7 million, or 8%, are exposed to water at concentrations above the 120 mg/Lbenchmark, a level that comprises about 10% of the dietary guideline for sodium. The dietary guidelinelevel, however, is habitually exceeded by most of the U.S. population by 1,100 to 2,100 mg/day(Abraham and Carroll, 1981; Dahl, 1960; Pennington et al., 1984; Karanja et al., 1999; Kurtzweil,1995).
4.6 Conclusion
Despite the evidence that sodium may have adverse health effects in humans by contributing tohypertension, data from studies indicate that the most effective hypertension reduction programs do notinvolve supplementation or restriction of a single element. Instead, a well balanced, nutritionally sounddiet combined with other behavioral changes such as exercise and stress reduction are the mosteffective measures. In addition, since sodium levels in drinking water are usually low, water from publicwater systems is unlikely to significantly contribute to adverse health effects. For these reasons,regulation may not present a meaningful opportunity for health risk reduction for persons served bypublic drinking water systems. However, the EPA may issue a Drinking Water Advisory to provideguidance to communities that may be exposed to drinking water contaminated with sodium chloride orother sodium salts. All CCL regulatory determinations and further analysis are formally presented in theFederal Register Notices (USEPA, 2002a; 67 FR 38222; and USEPA, 2003a; 68 FR 42898).
5.0 TECHNOLOGY ASSESSMENT
If a determination has been made to regulate a contaminant, SDWA requires development ofproposed regulations within 2 years of making the decision. It is critical to have suitable monitoringmethods and treatment technologies to support regulation development according to the schedulesdefined in the SDWA.
5.1 Analytical Methods
The availability of analytical methods does not influence EPA’s determination of whether or not aCCL contaminant should be regulated. However, before EPA actually regulates a contaminant andestablishes a Maximum Contaminant Level (MCL), there must be an analytical method suitable forroutine monitoring. Therefore, EPA needs to have approved methods available for any CCL regulatorydetermination contaminant before it is regulated with an NPDWR. These methods must be suitable forcompliance monitoring and should be cost effective, rapid, and easy to use. Sodium can be measuredby well-documented analytical methods (see Table 5-1).
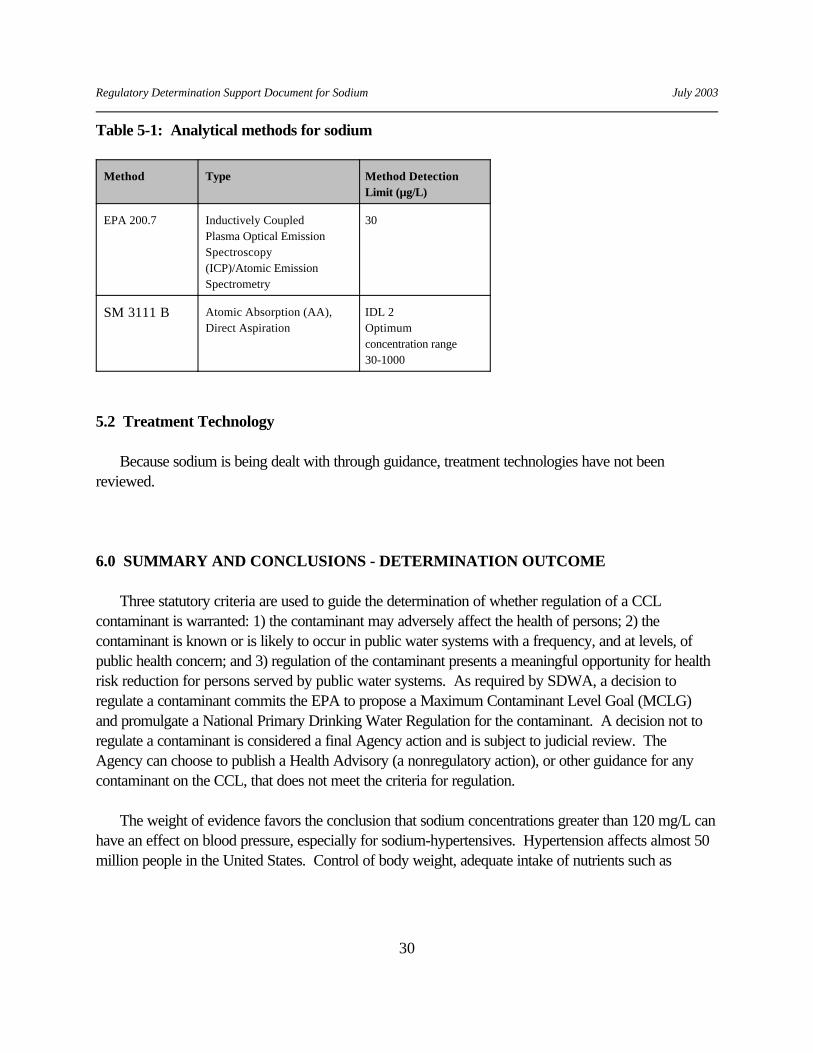
Regulatory Determination Support Document for Sodium July 2003
30
Table 5-1: Analytical methods for sodium
Method Type Method DetectionLimit (µg/L)
EPA 200.7 Inductively CoupledPlasma Optical EmissionSpectroscopy(ICP)/Atomic EmissionSpectrometry
30
SM 3111 B Atomic Absorption (AA),Direct Aspiration
IDL 2Optimumconcentration range30-1000
5.2 Treatment Technology
Because sodium is being dealt with through guidance, treatment technologies have not beenreviewed.
6.0 SUMMARY AND CONCLUSIONS - DETERMINATION OUTCOME
Three statutory criteria are used to guide the determination of whether regulation of a CCLcontaminant is warranted: 1) the contaminant may adversely affect the health of persons; 2) thecontaminant is known or is likely to occur in public water systems with a frequency, and at levels, ofpublic health concern; and 3) regulation of the contaminant presents a meaningful opportunity for healthrisk reduction for persons served by public water systems. As required by SDWA, a decision toregulate a contaminant commits the EPA to propose a Maximum Contaminant Level Goal (MCLG)and promulgate a National Primary Drinking Water Regulation for the contaminant. A decision not toregulate a contaminant is considered a final Agency action and is subject to judicial review. TheAgency can choose to publish a Health Advisory (a nonregulatory action), or other guidance for anycontaminant on the CCL, that does not meet the criteria for regulation.
The weight of evidence favors the conclusion that sodium concentrations greater than 120 mg/L canhave an effect on blood pressure, especially for sodium-hypertensives. Hypertension affects almost 50million people in the United States. Control of body weight, adequate intake of nutrients such as
Regulatory Determination Support Document for Sodium July 2003
31
potassium, calcium and magnesium, sodium restriction, exercise, and stress all influence blood pressure. In addition to hypertension, cholesterol, dietary fat and alcohol intake are risk factors for cardiovascularproblems.
Sodium is known to occur in nearly all public water systems and, in a few cases, at levels of publichealth concern for salt-sensitive hypertensives (greater than 120 mg/L). However, these concentrationsexceed the taste threshold of 30 mg/L and affected consumers would likely reduce their intake andimplement corrective measures.
Based on available monitoring data, 7.1 million people are exposed to sodium at levels above thebenchmark level of 120 mg/L, a concentration that would provide about 10% of the dietary guidelinefor sodium. The majority of sodium intake is from salt added to food during processing or preparation. An estimate of daily sodium intake in American diets, and median sodium concentrations in water, showthat water contributes only 0.8% of the total dietary sodium. Sensitive populations include the elderly,because blood pressure increases and taste sensitivity to salt decreases with age, infants and children,and African Americans. Sodium may have a stronger effect on hypertensive individuals with renaldisease. Those with normal blood pressure may be influenced by sodium to a lesser extent. Bloodpressure is influenced more by nutrients in the diet, lifestyle, and behavioral patterns rather than bysodium intake.
In conclusion, sodium generally occurs at low levels in drinking water, and when it occurs at highlevels the taste may be expected to cause people to reduce their consumption. In addition, drinkingwater is only a minor source of dietary sodium compared with food, and sodium is only one factoramong many that contributes to hypertension and heart disease. Therefore, regulation of sodium indrinking water is unlikely to represent a meaningful opportunity for health risk reduction. The mosteffective means to protect the health of PWS users is to identify groups who are more sensitive than thegeneral population, and provide dietary guidance through the public health community. The EPA mayissue an advisory to provide guidance to communities that may be exposed to elevated concentrationsof sodium chloride or other sodium salts in their drinking water. The advisory would provideappropriate cautions for individuals on low-sodium or sodium-restricted diets. In addition, EPApresently requires periodic monitoring of sodium at the entry point to the distribution system. Thisrequirement provides the public health community with information on sodium levels in drinking water tobe used in counseling patients and is the most direct route for gaining the attention of the affectedpopulation. All CCL regulatory determinations are formally presented in the Federal Register Notices(USEPA, 2002a; 67 FR 38222; and USEPA, 2003a; 68 FR 42898).
Regulatory Determination Support Document for Sodium July 2003
32
REFERENCES
Abraham, S. and M.D. Carroll. 1981. Fats, Cholesterol and Sodium Intake in the Diet of Persons1–74 Years: United States. Washington, DC: U.S. Department of Health, Education and Welfare(as cited in NRC, 1989a).
American Heart Association (AHA). 2000. Sodium: AHA Recommendation. Dallas, TX: AmericanHeart Association. Available on the internet at: http://www.americanheart.org/Heart_and_Stroke_A_Z_Guide/sodium.html
Armstrong, B.K., B.M. Margetts, M.G. McCall, C.W. Binns, N.A. Campbell and J.R.L. Masarei.1982. Water Sodium and Blood Pressure in Rural School Children. Arch. Environ. Health.37:236–245.
Brown, T.L., LeMay, H. Eugene, and Bruce E. Bursten. 1994. Chemistry: The Central Science.Sixth Edition. New Jersey: Prentice Hall. 1045 pp.
Calabrese, E.J. and R.W. Tuthill. 1977. Elevated Blood Pressure and High Sodium Levels in thePublic Drinking Water. Arch. Environ. Health. 35:200.
Calabrese, E.J. and R.W. Tuthill. 1981. The Influence of Elevated Levels of Sodium in DrinkingWater on Elementary and High School Students in Massachusetts. Sci. Total Environ.18:117–133.
Callaway, W. 1994. ReSExamining Cholesterol and Sodium Recommendations. Nutrition Today.29:32–36.
Cataldo, C.B. and E.N. Whitney. 1986. Nutrition and Diet Therapy: Principles and Practice. St.Paul, MN: West Publishing Co. Available on the internet at: http://www.ccohs.ca/ccohs.html
Creasey, S.C. 1972. Hydrothermal Alteration of Silicate Rocks–General Principles. In TheEncyclopedia of Geochemistry and Environmental Sciences. Ed. R.W. Fairbridge. NewYork: Van Nostrand Reinhold Co. pp. 561-570.
Dahl, L.K. 1960. Possible Role of Salt Intake in the Development of Essential Hypertension. InEssential Hypertension: An International Symposium. Ed. P. Cottier and K.D. Bock. Heidelberg, Germany: Springer-Verlag. pp. 53–65 (as cited in NRC, 1989a).
DeGenaro, F. and W.L. Nyhan. 1971. SaltSA Dangerous ‘Antidote.’ J. Pediatr. 78:1048–1049.

Regulatory Determination Support Document for Sodium July 2003
33
Drever, J.I. 1997. The Geochemistry of Natural Waters: Surface and GroundwaterEnvironments. Third Edition. New Jersey: Prentice Hall. 436 pp.
Elliott, P., M. Marmot, A. Dyer, J. Joossens, H. Kesteloot, R. Stamler, J. Stamler and G. Rose. 1989. The Intersalt Study: Main Results, Conclusions and Some Implications. Clin. and Exper. Hyper.A11:1025–1034.
Elton, N.W., W.J. Elton and J.P. Narzareno. 1963. Pathology of Acute Salt Poisoning in Infants. Am. J. Clin. Pathol. 39:252–264.
Fairbridge, R.W. 1972. Cyclic Salts. In The Encyclopedia of Geochemistry and EnvironmentalSciences. Ed. R.W. Fairbridge. New York: Van Nostrand Reinhold Co. pp. 216.
Faust, H.S. 1982. Effects of Drinking Water and Total Sodium Intake on Blood Pressure. Am. J.Clin. Nutr. 35:1459S1467.
Feldman, S. and E.F. Cruft. 1972. Evaporite Processes. In The Encyclopedia of Geochemistryand Environmental Sciences. Ed. R.W. Fairbridge. New York: Van Nostrand Reinhold Co. pp. 351-360.
Gauthier, B., R. Freeman and J. Beveridge. 1969. Accidental Salt Poisoning in Hospital Nursery. Aust.Pediat. J. 5:101–105.
Gornitz, V. 1972. Sodium: Element and Geochemistry. In The Encyclopedia of Geochemistry andEnvironmental Sciences. Ed. R.W. Fairbridge. New York: Van Nostrand Reinhold Co. pp.1096-1099.
Hackett, O.M. 1972. Groundwater. In The Encyclopedia of Geochemistry and EnvironmentalSciences. Ed. R.W. Fairbridge. New York: Van Nostrand Reinhold Co. pp. 470-476.
Harsha, D.W., L. Pao-Hwa, E. Obarzanek, N.M Karanja, T.J. Moore and B. Caballero. 1999. Dietary Approaches to Stop Hypertension: A Summary of Results. J. Am. Diet. Assoc.99(8):S35S S39.
Hyde, R.J. and R.P. Feller. 1981. Age and Sex Effects on Taste of Sucrose, NaCl, Citric Acid andCaffeine. Neurobiology of Aging. 2:315–318.
Intersalt Cooperative Research Group (ICRG). 1988. Intersalt: An International Study of ElectrolyteExcretion and Blood Pressure: Results for 24SHour Urinary Sodium and Potassium Excretion.BMJ 297:319–328.
Regulatory Determination Support Document for Sodium July 2003
34
Karanja, N.M., E. Obarzanek, L. Pao-Hwa, M.L. McCullough, K.M. Phillips, J.F. Swain, C.M.Champagne and K.P. Hoben. 1999. Descriptive Characteristics of the Dietary Patterns Used inthe Dietary Approaches to Stop Hypertension Trial. J. Am. Diet. Assoc. 99(8):S19SS27.
Karr-Dullien, V. and E. Bloomquist. 1979. The Influence of Prenatal Salt on the Development ofHypertension by Spontaneously Hypertensive Rats (SHR) (40462). Proc. Soc. Exp. Biol. Med.160:421–425.
Kostick, D.S. 1993. The Material Flow of Salt. Information Circular 9343. Washington, D.C.:U.S. Department of the Interior, Bureau of Mines. 31 pp.
Kostick, D.S. 1994. Minerals Yearbook, Volume 1–Metals and Minerals: Salt. Virginia: U.S.Geological Survey Minerals Information Center. Available on the Internet at: http://minerals.usgs.gov/minerals/pubs/commodity/myb/ Last modified August 30, 2000.
Kostick, D.S. 1995. Minerals Yearbook, Volume 1–Metals and Minerals: Salt. Virginia: U.S.Geological Survey Minerals Information Center. Available on the Internet at: http://minerals.usgs.gov/minerals/pubs/commodity/myb/ Last modified August 30, 2000.
Kostick, D.S. 1996. Minerals Yearbook, Volume 1–Metals and Minerals: Salt. Virginia: U.S.Geological Survey Minerals Information Center. Available on the Internet at: http://minerals.usgs.gov/minerals/pubs/commodity/myb/ Last modified August 30, 2000.
Kostick, D.S. 1997. Minerals Yearbook, Volume 1–Metals and Minerals: Salt. Virginia: U.S.Geological Survey Minerals Information Center. Available on the Internet at: http://minerals.usgs.gov/minerals/pubs/commodity/myb/ Last modified August 30, 2000.
Kostick, D.S. 1998. Minerals Yearbook, Volume 1–Metals and Minerals: Salt. Virginia: U.S.Geological Survey Minerals Information Center. Available on the Internet at: http://minerals.usgs.gov/minerals/pubs/commodity/myb/ Last modified August 30, 2000.
Kotchen, T.A. and D.A. McCarron. 1998. Dietary Electrolytes and Blood Pressure: A Statement forHealthcare Professionals from the American Heart Association Nutrition Committee. Circulation 98:613–617.
Kurtzweil, P. 1995. Scouting for Sodium and Other Nutrients Important to Blood Pressure.Washington, DC: U.S. Food and Drug Administration. Available on the internet at:http://www.americanheart.org/Heart_and _Stroke_A_Z_Guide/sodium.html Last modified July 21,2000.

Regulatory Determination Support Document for Sodium July 2003
35
Leahy, P.P., and T.H. Thompson. 1994. The National Water-Quality Assessment Program. U.S.Geological Survey Open-File Report 94-70. 4 pp. Available on the Internet at:http://water.usgs.gov/nawqa/NAWQA.OFR94-70.html Last updated August 23, 2000.
Madigan, Michael T., John M. Martinko, and Jack Parker. 1997. Brock Biology ofMicroorganisms. Eighth Edition. New Jersey: Prentice Hall. 986 pp.
McCarron, D.A. 1998. Diet and Blood Pressure SThe Paradigm Shift. Science 281:933–934.
Muntzel, M. and T. Drueke. 1992. A Comprehensive Review of the Salt and Blood PressureRelationship. Am. J. Hypertension 5:1S–42S.
National Institutes of Health (NIH). 1993. Working Group Report on Primary Prevention ofHypertension. NIH Publication No. 93-2669.
National Research Council (NRC). 1977. Drinking Water and Health. Washington, DC: NationalAcademy Press. pp. 400–411.
NRC. 1989a. Recommended Dietary Allowances. Washington, DC: National Academy of Sciences,National Academy Press. pp. 247–261.
NRC. 1989b. Diet and Health: Implications for Reducing Chronic Disease Risk. Washington, DC:National Academy Press. pp. 413–430.
Pennington, J.A.T., D.B. Wilson, R.F. Newell, B.F. Harland, R.D. Johnson and J.E. Vanderveen. 1984. Selected Minerals in Food Surveys, 1974 to 1981/82. J. Am. Diet. Assoc. 84:771–780 (ascited in NRC, 1989a).
Pomrehn, P.R., W.R. Clarke, M.F. Sowers, R.B. Wallace and R.M. Lauer. 1983. CommunityDifferences in Blood Pressure Levels and Drinking Water Sodium. Am. J. Epidemiol. 118:60–71.
Registry of Toxic Effects of Chemical Substances (RTECS). 2000. Database. Cincinnati, OH:National Institute for Occupational Safety and Health. Available on the internet at: www.ccohs.ca/
Ryker, S.J. and A.K. Williamson. 1999. Pesticides in Public Supply Wells of Washington State. U.S. Geological Survey Fact Sheet 122-96.
Sacks, F.M., L.P. Svetkey, W.M. Vollmer, L.J. Appel, G.A. Bray, D. Harsha, E. Obarzanek, P.R.Conlin, E.R. Miller III, D.G. Simons-Morton, N. Karanja and P.H. Lin. 2001. Effects on Blood
Regulatory Determination Support Document for Sodium July 2003
36
Pressure of Reduced Dietary Sodium and the Dietary Approaches to Stop Hypertension (DASH)Diet. N. Engl. J. Med. 344(1):53S55.
Salt Institute. 2000. SI Report. Alexandria, VA: Salt Institute. Available on the internet at:http://www.saltinstitute.org/news00-8.html
Sanchez-Castillo, C.P., S. Warrender, T.P. Whitehead and W.P. James. 1987a. An Assessment ofthe Sources of Dietary Salt in a British Population. Clin. Sci. 72:95–102. (As cited in NRC,1989a).
Sanchez-Castillo, C.P., W.J. Branch and W.P. James. 1987b. A Test of the Validity of the Lithium-Marker Technique for Monitoring Dietary Sources of Salt in Men. Clin. Sci. 72:87–94. (As citedin NRC, 1989a).
Sax, N.I. 1975. Dangerous Properties of Industrial Materials. Fourth Edition. New York, NY:Van Nostrand Reinhold Company, p. 1101.
Schmieder, R.E., F.H. Messerli, G.E. Garavaglia and B.D. Nunez. 1988. Dietary Salt Intake. ADeterminant of Cardiac Involvement in Essential Hypertension. Circulation 78:951–956.
Smith, R.A., R.B. Alexander, and M.G. Wolman. 1987. Water-Quality Trends in the Nations’ Rivers. Science. 235:1607-1615 (as cited in Kostick, 1993).
Sowers, J.R. and M. Lester. 2000. Hypertension, Hormones, and Aging. The Journal ofLaboratory and Clinical Medicine. 135:379–386.
Stamler, R. 1991. Implications of the Intersalt Study. Hypertension 17(Suppl I):IS16 – I S20.
Stevens, J.C. 1996. Detection of Tastes in Mixture with Other Tastes: Issues of Masking and Aging. Chem. Senses. 21:211–221.
Sullivan, J.M. 1991. Salt Sensitivity. Definition, Conception, Methodology, and Long-Term Issues.Hypertension 17(Suppl I): IS61– IS68.
Svetkey, L.P., S.P. Mckeown and A.F. Wilson. 1996. Heritability of Salt Sensitivity in BlackAmericans. Hypertension 28:854S858.
Takahashi, M., T. Kokubo, F. Furukawa, Y. Kurokawa, M. Tatematsu and Y. Hayashi. 1983. Effectof High Salt Diet on Rat Gastric Carcinogenesis Induced by N-Methyl-N1-Nitro-N-Nitrosoguanidine. Gann. 74:28–34.
Regulatory Determination Support Document for Sodium July 2003
37
Tatematsu, M., M. Takahashi, S. Fukushima, M. Hananouchi and T. Shirai. 1975. Effects in Rats ofSodium Chloride on Experimental Gastric Cancers Induced by N-Methyl-N1-Nitro-N-Nitrosoguanidine or 4-Nitroquinoline-1-Oxide. J. National Cancer Institute. 55:101–106.
Tuthill, R.W. and E.J. Calabrese. 1979. Elevated Sodium Levels in the Public Drinking Water as aContributor to Elevated Blood Pressure Levels in the Community. Arch. Environ. Health 37:197(as cited in USEPA, 1992).
Tuthill, R.W., C. Sonich, A. Okun and D. Greathouse. 1980. The Influence of Naturally andArtificially Elevated Levels of Sodium in Drinking Water on Blood Pressure in School Children. J.Environ. Pathol. Toxicol. 3:173–181.
US Environmental Protection Agency (USEPA). 1990. National Water Quality Inventory. EPAReport 440-4-90-003. 187 pp.
USEPA. 1993. R.E.D. FACTS Inorganic Halides. EPA Report 738-F-93-015. 5 pp. Availableon the Internet at: http://www.epa.gov/oppsrrd1/REDs/factsheets/4051fact.pdf Last modified:March 3, 1999.
USEPA. 1996. Emergency Planning and Community Right-to-Know Section 313, List of ToxicChemicals. Washington, DC: USEPA. Available on the Internet at:http://www.epa.gov/tri/chemls2.pdf Last modified March 23, 2000. Link to site at:http://www.epa.gov/tri/chemical.htm
USEPA. 1997. Announcement of the Draft Drinking Water Contaminant Candidate List; Notice. Federal Register 62, no. 193 (6 October): 52194.
USEPA. 1998a. Laws & Regulations. Washington, DC: Environmental Protection Agency.Available on the Internet at: http://www.epa.gov/reg5foia/pest/history.html Last modified August20, 1998.
USEPA. 1998b. Title III List of Lists: Consolidated List of Chemicals Subject to the EmergencyPlanning and Community Right-to-Know Act (EPCRA) and Section 112(r) of the Clean AirAct, as Amended. EPA Report 550-B-98-017. 36 pp.
USEPA. 1998c. Announcement of the Drinking Water Contaminant Candidate List; Notice. FederalRegister 63, no. 40 (2 March):10273.
USEPA. 1999. A Review of Contaminant Occurrence in Public Water Systems. Office of Water. EPA Report 816-R-99-006. 78 pp.

Regulatory Determination Support Document for Sodium July 2003
38
USEPA. 2000a. What is the Toxic Release Inventory? Washington, D.C.: USEPA. Available onthe Internet at: http://www.epa.gov/tri/general.htm Last modified February 28, 2000.
USEPA. 2000b. TRI Explorer: Geographic report. Washington, D.C.: USEPA. Available on theInternet at: http://www.epa.gov/triexplorer/geography.htm Last modified May 5, 2000.
USEPA. 2000c. TRI Explorer: Trends. Washington, D.C.: USEPA. Available on the Internet at:http://www.epa.gov/triexplorer/trends.htm Last modified May 5, 2000.
USEPA. 2000d. Water Industry Baseline Handbook. Second Edition (Draft). Washington, D.C:USEPA.
USEPA. 2003. Drinking Water Advisory: Consumer Acceptability Advice and Health EffectsAnalysis on Sodium. EPA 822-R-03-006. February 2003.
USGS. 2001. USGS National Water Quality Assessment Data Warehouse. Reston, VA: UnitedStates Geological Survey. Available on the Internet at:http://infotrek.er.usgs.gov/pls/nawqa/nawqa.home Last modified April 19, 2001.
Whitney, E.N., C.B. Cataldo and S.R. Rolfes. 1987. Understanding Normal and ClinicalNutrition. St. Paul, MN: West Publishing Co.
World Health Organization (WHO). 1993. Guidelines for Drinking-Water Quality. Vol 1.Recommendations. Second Edition. Geneva, Switzerland: WHO.

This page intentionally left blank.

Regulatory Determination Support Document for Sodium July 2003
40
Appendix A: Abbreviations and Acronyms
AA - atomic absorptionCAS - Chemical Abstract ServiceCCL - Contaminant Candidate ListCDC - Center for Disease Control and PreventionCERCLA - Comprehensive Environmental Response, Compensation & Liability ActCWS - community water systemDWEL - drinking water equivalent levelEPA - Environmental Protection AgencyEPCRA - Emergency Planning and Community Right-to-Know ActFIFRA - Federal Insecticide, Fungicide, and Rodenticide ActFQPA - Food Quality Protection ActFR - Federal Registerg/mol - grams per moleGW - ground waterHA - Health AdvisoryHAL - Health Advisory levelHRL - Health Reference LevelICP - inductively coupled plasmaICRG - Intersalt Cooperative Research GroupIDL - instrument detection levelIOC - inorganic compoundMCL - maximum contaminant levelMCLG - maximum contaminant level goalmEq/L - milliequivalent per litermg - milligrammg/kg-day - milligram per kilogram per daymm Hg - millimeter mercuryMRL - minimum reporting levelNa - sodiumNaCl - sodium chloride (salt)NAS - National Academy of the SciencesNAWQA - National Water Quality Assessment ProgramNDWAC - National Drinking Water Advisory CouncilNIH - National Institutes for HealthNIRS - National Inorganic and Radionuclide Surveynm - nanometerNPDWR - National Primary Drinking Water RegulationNRC - National Research Council
Regulatory Determination Support Document for Sodium July 2003
41
NTNCWS - non-transient non-community water systemOGWDW - Office of Ground Water and Drinking WaterPGWD - Pesticides in Ground Water DatabasepH - the negative log of the concentration of H+ ionsppm - part per millionPWS - public water systemRCRA - Resource Conservation and Recovery ActRTECS - Registry of Toxic Effects of Chemical SubstancesSARA - Superfund Amendments and Reauthorization ActSDWA - Safe Drinking Water ActSDWIS/FED - Federal Safe Drinking Water Information SystemSOC - synthetic organic compoundSW - surface water TRI - Toxic Release InventoryUCM - Unregulated Contaminant MonitoringUCMR - Unregulated Contaminant Monitoring Regulation/RuleUSEPA - United States Environmental Protection Agency USGS - United States Geological SurveyVOC - volatile organic compoundµg - micrograms>MCL - percentage of systems with exceedances>MRL - percentage of systems with detections


