319
NOTE This online version of the thesis may have different page formatting and pagination from the paper copy held in the Swinburne Library.

NOTE
This online version of the thesis may have different page formatting and pagination from the paper copy held in the Swinburne Library.

CONTAMINANT LEVELS
IN
RECYCLED PET PLASTIC
By
LIDIA KONKOL
A thesis submitted in fulfilment of the requirements for the
degree of Doctor of Philosophy
November, 2004
Environment and Biotechnology Centre
Swinburne University of Technology
Victoria 3122, Australia

Acknowledgments
ACKNOWLEDGMENTS
I would like to dedicate this thesis to my loving family members and partner for all their
support, understanding, optimism and encouragement throughout my academic years.
I am particularly grateful to my supervisors Dr R. F. Cross, Dr I. Harding and Dr E.
Kosior for their guidance and valuable suggestions. A special thank-you goes out to Dr
Reg Cross for motivating and assisting me in writing papers.
I would like to express my gratitude to my friend Larry Bautista from Philip Morris for
assisting me with the static headspace work and for being a great friend.
Finally I would like to thank my fellow postgraduate students and Swinburne staff,
especially Savithri Galappathie, Sheila Curtis and Andrew Smairl, for their friendship
throughout my academic years.
i

Preface
PREFACE
I hereby declare that, to the best of my knowledge, this thesis contains no material
previously written or published by another person except where reference is made in
the text. I also declare that none of this work has been previously submitted for a
degree or similar award at another institution.
ii

Table of contents
TABLE OF CONTENTS
ACKNOWLEDGEMENTS i
PREFACE ii
TABLE OF CONTENTS iii
LIST OF FIGURES x
LIST OF TABLES xv
ABBREVIATIONS xviii
ABSTRACT xx
CHAPTER 1: INTRODUCTION 1
CHAPTER 2: LITERATURE REVIEW 3
2.1 BACKGROUND 3 2.1.1 Definition of PET and its applications in the food industry 3
2.1.2 Manufacture of PET bottles 4
2.1.3 Improving gas barrier properties of PET 5
2.2 FOOD CONTACT CONSIDERATIONS FOR VIRGIN PET 7
2.2.1 Introduction 7
2.2.2 Sorption considerations in food contact applications 8
2.2.3 Factors contributing to the degree of sorption 9
2.2.3.1 Properties of sorbate 10
2.2.3.2 Polymer chemical and morphological properties 11
2.2.3.3 Solubility parameter 12
2.2.3.4 Polymer physical properties 13
2.2.3.5 Temperature 14
2.2.3.6 Time 15
2.2.4 Migration considerations in food contact applications 16
2.2.5 Factors affecting the extent of migration 18
iii
Table of contents
- External factors 18
- Polymer and migrant factors 19
2.2.6 Potential migrants resulting from the manufacture of PET 21
- Residual compounds resulting from manufacture identified in PET 21
2.2.7 Reaction by-products formed during PET manufacture 25
- Acetaldehyde 25
- Oligomers in PET 26
- Oligomer migration from PET 28
2.2.8 Additives 29
2.2.9 Global migration 30
2.2.10 Other compounds identified in PET 30
2.3 FOOD CONTACT CONSIDERATIONS FOR RECYCLED PET 31
2.3.1 Introduction to recycling 31
2.3.2 Modes of recycling 31
2.3.2.1 Re-use: Zeroth order recycling 32
2.3.2.2 Primary recycling 32
2.3.2.3 Physical reprocessing: Secondary recycling 32
- The Visy process 33
2.3.2.4 Tertiary recycling 33
2.3.3 Recycled PET for food contact purposes 34
2.3.3.1 Consumer misuse/reuse 35
2.3.3.2 Sorption from the original contents of the bottle 35
2.3.4 Threshold of regulation 39
2.3.5 Validation of recycling process – the challenge test 40
2.3.5.1 Introduction 40
2.3.5.2 Challenge test process 42
2.3.5.3 Challenge test studies 42
- Refillable plastic bottles 42
- Secondary recycled plastic bottles 44
2.3.6 Estimated level of real contaminants in recycled PET 47
2.3.7 Methods of reducing contamination 48
2.3.7.1 Functional barrier 48
iv

Table of contents
2.4 EXTRACTION AND ANALYSIS OF POLYMERS 50
2.4.1 Modes of extraction 50
2.4.2 Parameter optimisation 51
2.4.2.1 Time 51
2.4.2.2 Temperature 52
2.4.2.3 Pressure 54
2.4.2.4 Nature of extraction solvent 54
2.4.2.5 Particle size 57
2.4.2.6 Migrant shape/size 58 2.4.3 Modes of separation and analysis 59
2.5 PURPOSE OF THIS THESIS 60
2.6 OUTLINE OF THIS THESIS 62
CHAPTER 3: MATERIALS AND METHODS 64
3.1 METHOD FOR CHAPTER 4 64
3.1.1 Chemicals 64
3.1.2 Preparation of stock standards 67
3.1.3 Soxhlet calibration standards 67
3.1.4 Dissolution calibration standards 67
3.1.5 Gas chromatography-mass spectroscopy (GC-MS) analysis 68
3.1.6 Commercial Visy treatment of curbside PET 68
3.1.7 Laboratory preparation of polymer before analysis 69
3.1.8 Soxhlet extraction conditions 69
3.1.9 Sonication 70
3.1.10 Total dissolution extraction conditions 70
3.1.10.1 Total dissolution by TFA – Qualitative analysis 70
3.1.10.2 Total dissolution by TFA – Quantitative analysis 70
3.1.10.3 Total dissolution by HFIP – Qualitative analysis 70
v

Table of contents
3.1.11 Crystallinity analysis 71
3.2 METHOD FOR CHAPTER 5 71
3.2.1. Chemicals 71
3.2.2. Crystallinity analysis 71
3.3 METHOD FOR CHAPTER 6 71
3.3.1 Preparation of stock standards 71
3.3.2 Soxhlet calibration standards for external standardisation 72
3.3.3 SPME 72
3.3.4 Static Headspace (SHS) 73
3.3.5 Quantitative analysis by SHS 73
3.3.6 GC/MS Conditions – SPME 73
3.3.7 GC/MS Conditions – SHS 74
CHAPTER 4: SEMI-VOLATILE CONTAMINANTS 75
AND LEVELS OF OCCURRENCE IN WASHED AND
DRIED SHREDDED PET
4.1 GENERAL INTRODUCTION 75
4.1.1 Purpose of the chapter 75
4.1.2 Brief outline of chapter 76
4.1.3 Selecting the right extraction solvent for Soxhlet extraction 76
4.2 QUALITATIVE STUDY OF CONTAMINANTS IN WASHED 79
AND DRIED PET FLAKE
4.2.1 Introduction to Soxhlet extraction of washed and dried flake 79
4.2.2 Choosing a suitable low boiling solvent 79
4.2.3 GC/MS analysis of DCM extracts of washed and dried flake 84
4.2.4 Qualitative analysis of washed and dried flake extracted by 93
total dissolution
4.2.5 Running the extracts on polar column 98
vi

Table of contents
4.2.6 Possible origin of the components 99
4.3 QUANTITATIVE STUDY OF CONTAMINANTS IN WASHED 102
AND DRIED PET FLAKE
4.3.1 Introduction 102
4.3.2 Study of extraction kinetics for flake ground to 0-300 µm 103
4.3.3 Particle size variation 116
4.3.4 Kinetic studies for the larger particle sizes 121
4.3.5 Comparison of contaminant levels in different 70 g grabs from the 140
original 15 kg sample
4.3.6 Validation of the Soxhlet extraction methodology 142
4.3.6.1 Total dissolution compared with Soxhlet extraction 142
4.3.7 Particle size range and degree of crystallinity 148
4.3.8 Investigation of the relative levels of contaminants in the two types 153
of flake
4.3.9 Representative sampling 159
4.3.10 Levels of contaminants in flake and the threshold of regulation 160
CHAPTER 5: SEMI-VOLATILE CONTAMINANTS 162
AND LEVELS OF OCCURRENCE IN EXTRUDED PET PELLETS FROM CURBSIDE COLLECTION
5.1 GENERAL INTRODUCTION 162
5.1.1 Purpose of the chapter 162
5.1.2 Brief outline of this chapter 164
5.2 KINETICS OF SOXHLET EXTRACTION FROM EXTRUDED 165
AND ANNEALED PET
5.2.1 Pellets ground to 0-300 µm 165
5.2.1.1 Pellets ground to 0-300 µm: The relationship between 171
extraction kinetics and contaminant molecular weight.
5.2.2 Annealed pellets ground to >300-425µm 174
vii

Table of contents
5.2.3 Annealed pellets ground to >425-700 µm 176
5.2.4 Unground annealed pellets 178
5.2.5 The effect of particle size reduction upon measured contaminant levels 182
in extruded and annealed pellets
5.3 ANNEALED VERSUS AMORPHOUS EXTRUDED PELLETS 189
5.3.1 Kinetics of extraction from amorphous pellets 189
5.3.2 Variation of DCM uptake with PET crystalline structure 195
5.3.3 Contaminant diffusion coefficients out of amorphous and annealed PET 199
5.3.4 Contaminant loss during the annealing of pellets 204
5.3 FLATTENING AMORPHOUS PET PELLETS 205
5.4 LEVELS OF CONTAMINANTS IN PELLETS AND 208
THRESHOLD OF REGULATION
5.5 CONCLUSIONS 211
CHAPTER 6: VOLATILE CONTAMINANTS AND 213
LEVELS OF OCCURRENCE IN EXTRUDED PET FLAKE
AND PELLETS FROM CURBSIDE COLLECTION 6.1 GENERAL INTRODUCTION 213
6.1.1 Purpose of the chapter 213
6.1.2 Background to thermal extraction 213
6.1.3 Brief outline of chapter 216
6.2 QUALITATIVE SPME STUDY OF CONTAMINANTS 217
IN PET EXTRUDED PELLETS
6.2.1 Comparison of the compounds extracted by different fibres 217
6.2.2 Effect of temperature on extraction 223
viii

Table of contents
6.2.3 Effect of mass of sample on extraction 235
6.2.4 Effect of adsorption time 242
6.2.5 Effect of extraction time on extraction 243
6.3 QUANTITATIVE SPME AND STATIC HEADSPACE STUDY 249
OF RECYCLED PET
6.3.1 Quantitation using the CX/PDMS fibre 249
6.3.2 SPME using PDMS, an absorption fibre 249
6.3.3 Static headspace analysis (SHS) 253
6.3.4 Quantitative analysis of PET 258
6.3.5 Multiple headspace extraction (MHE) 258
6.3.6 External standardisation (ES) 260
6.4 CONCLUSION 262
CHAPTER 7: CONCLUSIONS 264
APPENDIX 268
BIBLIOGRAPHY 269
ix
List of figures
LIST OF FIGURES
Figure
2.1 Formation of PET (polyethylene terephthalate) 2
2.2 Structure of PEN 5
2.3 Drawing of the bottom part of a PET soft drink bottle 6
illustrating sorption, migration and permeation
2.4 A summary of the disadvantages of “flavour scalping” 8
2.5 Sorbate, polymer and external factors effecting sorption in PET 9
2.6 Formation of dimethyl terephthalate and terephthalic acid from 22
xylene
2.7 Formation of bis-(2-hydroxyethyl)terephthalate (BHET) 24
from dimethyl terephthalate and ethylene glycol
2.8 Formation of PET from BHET 25
2.9 Formation of acetaldehyde from PET 26
2.10 Cyclic oligomers identified in PET 27
2.11 Chemolysis reactions used in tertiary recycling 34
4.1 Plot of the number of mmole of solvent absorbed at 3 h versus 83
(δPET - δsolvent)

List of figures
4.2 Chromatogram of DCM extract for washed and dried flake 87
4.3 Mass spectrum and structure of (a) cyclic dimer and (b) dimer ether 92
4.4 Chromatogram of TFA/heptane extract for washed and dried flake 97
4.5 Chromatogram of HFIP extract for washed and dried flake 99
4.6 Schematic presentation of the three subsequent steps in solvent 105
extraction
4.7 Soxhlet extraction kinetic study of washed and dried flake ground to 106
0-300 µm. Compounds identified at levels below 200 ppb
4.8 Soxhlet extraction kinetic curves of trimethylnaphthalene isomers 107
extracted from washed and dried flake ground to 0-300 µm
4.9 Soxhlet extraction kinetic study of washed and dried flake ground 108
to 0-300 µm. Compounds identified at levels above 200 ppb
4.10 The standard deviations associated with data points defining 109
kinetic curves that do not follow the general trends of Figure 1
4.11 Soxhlet extraction kinetic study of washed and dried flake ground
to 0-300 µm. Ethylene glycol analysed on an EC-Wax Econo-cap
column
4.12 Ratio of amount extracted at 8 h (A8) to amount extracted after 24 h (Ae)
(as a percentage) versus contaminant molecular weight
4.13 “Venn diagram” grouping the contaminants according to their functional
group types
List of figures
4.14 Ratio of amount extracted at 8 h (A8) to amount extracted after 24 h (Ae)
(as a percentage) versus estimated solvent strength parameter
4.15 Amount of contaminant extracted from flake ground to different particle
sizes (compounds below 200 ppb)
4.16 Amount of trimethylnaphthalene contaminants extracted from flake ground
to different particle sizes
4.17 Amount of contaminant extracted from flake ground to different particle
sizes (compounds above 200 ppb)
4.18 The standard deviations associated with data points defining curves that do
not follow the general trends of Figure 4.15 – 4.17
4.19 Soxhlet extraction kinetics of flake ground to >300-425 µm. Contaminants
below 120 ppb
4.20 Soxhlet extraction kinetics of flake ground to >300-425 µm. Contaminants
between 120 ppb and 300 ppb
4.21 Soxhlet extraction kinetics of flake ground to >300-425 µm. Contaminants
above 400 ppb
4.22 Soxhlet extraction kinetics of flake ground to >300-425 µm.
Trimethylnaphthalene isomers
4.23 Soxhlet extraction kinetics of flake ground to >425-700 µm. Contaminants
below 100 ppb
4.24 Soxhlet extraction kinetics of flake ground to >425-700 µm.
Trimethylnaphthalene isomers

List of figures
4.25 Soxhlet extraction kinetics of flake ground to >425-700 µm. Contaminants
above 200 ppb
4.26 Soxhlet extraction kinetics of whole flake. Contaminants below 70 ppb
4.27 Soxhlet extraction kinetics of whole flake. Trimethylnaphthalene
isomers
4.28 Soxhlet extraction kinetics of whole flake. Contaminants between 70 ppb
and 200 ppb
4.29 Soxhlet extraction kinetics of whole flake. Contaminants above 200 ppb.
4.30 Soxhlet extraction kinetics of whole flake. Ethylene glycol
4.31 Log-log plot of levels of contaminants determined by total dissolution
versus levels extracted by sonication and comparison with the ideal
relationship (y=x): for flake ground to small particle sizes
4.32 Variation in contaminant levels between two 70 g grabs of flake from the
original 15 kg bag. Analyses were performed on PET ground to the 0-300
µm particle size in each case
4.33 Log-log plot of levels of contaminants determined by total dissolution
versus levels extracted by Soxhlet and comparison with the ideal
relationship (y=x): for flake ground to medium and large particle sizes and
for unground flake
4.34 Log-log plot comparing the contaminant concentrations extracted from
unground flake by TFA versus the amount extracted from unground flake by
Soxhlet extraction
List of figures
4.35 Percentage of amount extracted from the >425-700 µm particle size range to
the amount extracted from the 0-300 µm particle size range plotted versus
contaminant molar mass
4.36 Log amount extracted from crystalline particles versus log amount extracted
from amorphous particles, for each particle size range.
4.37 Log amount extracted from whole amorphous pellets versus log amount
extracted from flattened amorphous particles.
5.1 Soxhlet extraction kinetic study of annealed pellets ground to 0-300 µm.
Compounds identified at levels below 10 ppb.
5.2 Soxhlet extraction kinetic study of annealed pellets ground to 0-300 µm.
Trimethylnaphthalene isomers.
5.3 Soxhlet extraction kinetic study of annealed pellets ground to 0-300 µm.
Compounds identified at levels between 11 ppb and 130 ppb.
5.4 Percentage of contaminant extracted at 1 h versus molecular weight.
5.5 A log-log plot of the amounts of contaminants extracted at 24 h versus the
amounts extracted at 3 h for >300-425µm.
5.6 A log-log plot of the amounts of contaminants extracted at 24 h versus the
amounts extracted at 3 h for particles >425-700 µm.
5.7 Soxhlet extraction kinetic study of unground annealed pellets. Compounds
identified at levels below 2 ppb.
5.8 Soxhlet extraction kinetic study of unground annealed pellets. Compounds
identified at levels below 13 ppb.

List of figures
5.9 Soxhlet extraction kinetic study of unground annealed pellets. Compounds
identified at levels below 70 ppb.
5.10 Typical variations in contaminant levels measured from the same batch of
annealed pellets ground to the three particle sizes.
5.11 Extreme examples of the variation in contaminant levels.
5.12 An example of the experimental spread (means ± standard deviation) for
divergent measurements of a contaminant in the three particle sizes derived
from the same batch of annealed pellets.
5.13 Log-log plot of the amounts of contaminants extracted from >425-700 µm
particles versus the amounts extracted from 0-300 µm particles.
5.14 A log-log plot of the amounts extracted at 3 h versus the amounts extracted at
24 h for unground amorphous pellets.
5.15 Soxhlet extraction kinetic study of unground amorphous pellets. Compounds
identified at levels below 4 ppb.
5.16 Soxhlet extraction kinetic study of unground amorphous pellets. Compounds
identified at levels below 11 ppb.
5.17 Soxhlet extraction kinetic study of unground amorphous pellets. Compounds
identified at levels below 13 ppb.
5.18 Soxhlet extraction kinetic study of unground amorphous pellets.
Trimethylnaphthalene compounds.
5.19 Sorption kinetics of DCM into amorphous and annealed pellets.

List of figures
5.20 A plot of the (amount of DCM sorbed /amount sorbed at equilibrium) versus
the square root of time.
5.21 A plot of At/Ae (amount extracted/amount extracted at equilibrium from
annealed pellets) versus the square root of time (a representative plot;
naphthalene).
5.22 A plot of calculated diffusion coefficients versus molecular weights (for
annealed pellets).
5.23 A plot of fraction extracted at 2 h versus molecular weights (for amorphous
pellets).
5.24 A log-log plot of the amounts of contaminants extracted from amorphous
pellets versus the amounts extracted from ground annealed pellets.
6.1 Ground annealed pellets: contaminant area (abundance) versus extraction
temperature for three different particle sizes using the CX/PDMS fibre.
6.2 Effect of incubation temperature on extraction of 6g of unground
extruded pellets using the CX/PDMS fibre.
6.3 Effect of incubation temperature on extraction of 1g of unground
extruded pellets using the CX/PDMS fibre.
6.4 Effect of incubation temperature on extraction of 0.3g of unground
extruded pellets using the CX/PDMS fibre.
6.5 Effect of extraction time on abundance.
6.6 Superimposed chromatograms obtained from the analysis of pellets using the
PDMS (bold) and CX/PDMS (fine) fibres.
6.7 Effect of incubation temperature on extraction of 6g of unground extruded
pellets using the 100 µm PDMS fibre.

List of figures
6.8 Chromatograms for extruded pellets obtained by (a) SHS and (b) SPME using
the CX/PDMS fibre.
6.9 Effect of incubation temperature for the SHS of extruded PET pellets.
6.10 Multiple headspace analysis of flake ground to 425–700 µm.

LIST OF TABLES
Table
2.1 Comparative properties of PET versus PEN.
2.2 A list of FDA food simulants.
2.3 A list of EEC food simulants.
2.4 Threshold values for the maximum permitted contaminant
concentration in polymers and food simulant.
2.5 Surrogates used in a challenge test performed by Franz and Welle
(1999a).
2.6 The estimated level of contaminants in PET after each recycling stage.
2.7 Hildebrand solubility parameters for different solvents and polymers.
3.1 Contaminants identified in washed and dried PET flake and the
standards used.
4.1 Hildebrand solubility parameters of some solvents and PET.
4.2 Hildebrand solubility parameters of hexane, 2-propanol, ethanol and
PET.
4.3 Compounds identified in ground washed and dried PET flake [“x”
denotes presence of compound in virgin (V) and recycled (R) PET].
4.4 Compounds extracted from washed and dried flake by total dissolution
using TFA/heptane [“x” denotes presence of contaminant in virgin (V)
and recycled (R) PET].

4.5 Constituents of PET were also extracted by total dissolution using
HFIP [“x” denotes presence of contaminant in virgin (V) and recycled
(R) PET].
4.6 Soxhlet extract run on an EC-Wax Econo-cap column.
4.7 The percentages of naphthalene derivatives extracted at 8 h alongside
their molecular structure.
4.8 Contaminant levels (and standard deviations) [in ppb, in flake ground
to 0-300 µm] determined by total dissolution with TFA, compared to
extraction by sonication in DCM.
4.9 Contaminant levels (and standard deviations) [in ppb, in flake ground
to 0-300 µm] determined by total dissolution with TFA, compared to
extraction by sonication in DCM: anomalies for (a) m-cymene
[TFA>DCM] and (b) limonene, cineole and γ-terpinene [DCM>TFA].
(All levels are in ppb by mass.)
4.10 Flake ground to >300-425 µm particle size and extracted for 3 h and
then re-extracted for another 24 h.
4.11 Levels of contaminants (and their standard deviations) determined by
Soxhlet extraction with dichloromethane (DCM) compared with total
dissolution by trifluoracetic acid (TFA) followed by extraction with
heptane: for flake ground to medium and large particle sizes, and for
unground flake. (All levels are in ppb by mass.)
4.12 Levels of contaminants (and their standard deviations) determined by
Soxhlet extraction with dichloromethane (DCM) compared with total
dissolution by trifluoracetic acid (TFA) followed by extraction with
heptane: anomalies for (a) m-cymene [TFA>DCM] and (b) limonene,
cineole and γ-terpinene [DCM>TFA]. (All levels are in ppb by mass.)

4.13 Percentages of crystallinity for amorphous and crystalline fractions of
washed and dried flake ground to different particle sizes.
4.14 Percentages of crystallinity for two batches of unsegregated washed
and dried flake ground to different particle sizes.
4.15 Mass of amorphous and crystalline flake ground to different particle
sizes.
4.16 Levels of contaminants in amorphous and crystalline flake ground to
different particle sizes (analysed by sonication in DCM for 3 h). (All
levels are in ppb by mass.)
5.1 Amounts of contaminants extracted from annealed pellets
ground to 0-300 µm by Soxhlet extraction and sonication (standard
deviation, n=3 for 3 h; n=2 for 15 h).
5.2 Flattened and whole amorphous pellets extracted by sonication and
Soxhlet extraction.
5.3 Levels of contaminants in ground flake (0-300 µm), unground flake
and extruded pellets.
6.1 Compounds extracted by four different fibres from ground flake (x
indicates assignment and n/a = “not analysed” due to the inclusion of a
solvent delay time).
6.2 Area of benzene and limonene after reducing the fibre exposure time
from 30 minutes to 5 minutes.
6.3 Comparison of concentrations determined in flake and pellets by
Soxhlet

and static headspace analysis. Standard deviations are in parentheses. All
values are in ppb.
6.4 Concentrations (ppb) of three compounds determined by static headspace
but not Soxhlet. Standard deviations are in parentheses.

Abbreviations
ABBREVIATIONS
A list of abbreviations for words not defined in the main body of the thesis.
MDPE medium density polyethylene
LDPE low density polyethylene
LLPE linear low density polyethylene
PP polypropylene
PE polyethylene
PS polystyrene
HDPE high density polyethylene
PVC polyvinyl chloride
PMMA poly(methyl methacrylate)
MEG monoethylene glycol
DEG diethylene glycol
GPC gel permeation chromatography
TLC thin layer chromatography
HPLC high performance liquid chromatography
SFC supercritical fluid chromatography
MAE microwave accelerated extraction
SFE supercritical fluid extraction
ASE accelerated solvent extraction
HPLC-UV high performance liquid chromatography-
ultra violet detection
SEC size exclusion chromatography
GC/MS gas chromatography/mass spectrometry
GC/FID gas chromatography/flame ionisation
detection
BHT butylated hydroxy toluene
DEHP di-(2-ethyl hexyl) phthalate
DEP diethyl phthalate
DiOP diisooctyl phthalate
BEHA bis-(2-ethyl hexyl) adipate
xviii

Abbreviations
BHA 4-(1-methyl-1-phenylethyl)-phenol
Tinuvin P 2-(2’-hydroxy-5-
methylphenyl)benzotriazole
DiBP diisobutyl phthalate
DBP dibutyl phthalate
DOA dioctyl adipate
SEC-HPLC size exclusion chromatography-high
performance liquid chromatography
XRD X-ray Diffraction
SML Specific migration limit
xix

Abstract
ABSTRACT
The purpose of this thesis was to determine which contaminants were present in washed
and dried shredded poly(ethylene terephthalate) (PET, flake) obtained from curbside
collection and to determine whether their concentrations were above the US FDA
threshold of 215 ppb. Over thirty semi-volatile contaminants were extracted from the
treated flake by Soxhlet extraction using dichloromethane as a PET swelling solvent
and gas chromatography-mass spectroscopy for identification and quantification.
Soxhlet extraction of flake ground to 0-300 µm was effectively completed by 24 h,
whereas sonication reduced the extraction time to 3 h. In contrast Soxhlet extractions
on flake ground to a larger particle size range (>300-425 µm and >425-700 µm) were
completed within four hours, possibly due to less aggregation in the extraction thimble.
In the finely ground flake (0-300 µm) the levels of most contaminants were below 215
ppb, but six were not. Dodecanoic acid was present at about 1200 ppb, 2-butoxyethanol
was approximately 1000 ppb, limonene, benzophenone and methylsalicylate were above
800 ppb and 2-methylnaphthalene near 215 ppb. After analogous method development
the levels of all diffusible compounds in extruded PET pellets were below the threshold
of 215 ppb.
The Soxhlet extraction technique was validated by comparison with total dissolution by
TFA for two of the three particle size ranges obtained by grinding the PET flake (>300-
425 µm and >425-700 µm) and for the unground flake. Further validation was achieved
by the comparison of contaminant levels determined by total dissolution with TFA and
sonication with DCM using flake ground to the 0-300 µm size range. The levels of
contaminants were found to increase with decreasing particle size range, but XRD
measurements of degrees of crystallinity were similar for each PET particle size range,
thus showing that the differences in contaminant levels were not due to variable
percentages of the amorphous material from the tops and bottoms of shredded bottles,
relative to the amounts of crystalline PET from the mid-sections of the bottles. Hence it
was postulated that the variations in contaminant levels were due to selective grinding
of the more highly contaminated surfaces, whilst the larger particles incorporated the
less contaminated interior material.
xx

Abstract
The analysis of the more homogenous annealed (extruded) pellets indicated that
contaminant levels between the analogous particle size ranges were equivalent.
This observation validated our interpretation of the high levels of contaminants found in
finely ground flake being due to selective surface grinding where high levels are
expected.
When analysing volatiles, static headspace analysis was performed on flake and
extruded pellets due to the limitations surrounding SPME. External standardisation was
used as the method of quantification and the levels of toluene, undecane and p-xylene in
extruded pellets were found to be below 38 ppb and therefore within the 215 ppb FDA-
set threshold for flake and pellets.
xxi
Chapter 1
CHAPTER 1 INTRODUCTION
The accumulation of plastic waste in landfill together with the increasing market share
of plastic soft drink bottles has encouraged recycling industries around the world to
consider recycling post consumer PET (polyethylene terephthalate) for food contact
applications.
Although recycling addresses the environmental concerns regarding waste disposal,
there are serious health issues associated with the use of recycled polymers for soft
drink storage.
Due to the permeable nature of plastic, it is feared that recycled PET could contain
compounds sorbed during the initial use of plastic bottles. For example, the sorption of
flavour compounds during soft drink storage. More seriously, the polymer could be
contaminated with compounds sorbed during the consumer reuse of soft drink bottles
for storing automobile, household or garden chemicals.
These sorbed “post-consumer contaminants” could have the potential to re-migrate
from the recycled polymer into the beverage at concentrations detrimental to consumer
health.
To obtain accreditation for recycled bottle manufacture, recycling industries are
required to prove that the levels of post-consumer contaminants in their recycled PET
bottles are below the regulated thresholds that assure consumer safety. For example,
for recycled PET soft drink bottles to be granted food contact approval in Australia, the
cleansing efficiency of the recycling process must be such that the levels of
contaminants in the polymer falls below the US Food and Drug Administration (US
FDA) ‘threshold of regulation’ of 215 ppb (FDA 1992). If this condition is not
satisfied, the migrating level into soft drink simulant (10% ethanol) must be
demonstrated not to exceed 10 ppb (FDA 1992, Komolprasert et al. 1997, Begley
1997).
When monitoring the cleansing efficiency of a recycling process, researchers generally
adopt the “challenge test” approach specified by the US FDA (FDA 1992,
Komolprasert et al. 1997, Franz et al. 1998). This procedure involves deliberately
contaminating a PET batch with exaggerated levels of surrogate contaminants and then
analysing the decontaminating capability of the recycling process. Our co-workers
1

Chapter 1
Harding et al. (unpublished) have found that the level of surrogates remaining in PET
after recycling is sometimes above the 215 ppb threshold. Subsequent migration tests
into food simulants proved that – according to the US FDA definitions - the PET did
not pose a health risk when used as a food grade plastic (Cross et al. unpublished). In
order to ascertain whether the levels of real contaminants in recycled PET fall below
the FDA threshold, their analysis in treated post-consumer PET was instigated. Hence
the general aim of this thesis was to determine what volatile and semi-volatile
contaminants are present in post-consumer PET and whether the identified
contaminants exceed the 215 ppb “threshold of regulation” set by the US FDA in order
to satisfy food safety requirements.
2

Chapter 2
CHAPTER 2 LITERATURE REVIEW
2.1 BACKGROUND
2.1.1 Definition of PET and its applications in the food industry PET (polyethylene terephthalate) resin is a polyester polymer produced by the
reaction of ethylene glycol with either terephthalic acid or dimethyl terephthalate and
in the presence of catalysts including salts of manganese, cobalt, cadmium, calcium,
lead, zinc, antimony, titanium and germanium (Figure 2.1). Its manufacture involves
several steps, which are described in greater detail in Section 2.2.6.
Polyesters, such as PET, are produced worldwide by companies such as Du Pont,
Eastman, Monsanto, and Hoechst and are used in the manufacture of textile fibres,
film, bottles and molding compounds (Ulrich, 1993). In 1999, over 5 million tonnes
of PET was processed worldwide for these applications and the trend has been
growing due to the polymer’s superiority over glass for food packaging (Kosmidis et
al. 2001).
Figure 2.1: Formation of PET (polyethylene terephthalate).
+
HO(CH2)2OH +
O O
C OCO
terephthalic acid ethylene glycol
H2O
CH2CH2
O
CH2CH2
O
C OCO
O O
C OCOCH2CH2
PET
HH
catalysts
1

Chapter 2
The use of PET as a film and bottle has been successfully incorporated into the food-
packaging industry due to the polymer’s strength, light-weight, flexibility, clarity,
resistance to high temperature and its negligible permeability to carbon dioxide,
which is especially important in the packaging of carbonated soft drinks (Begley and
Hollifield 1990a, Ashby 1988).
Bottles, for storing soft drinks, mineral waters, edible oils, wines, fruit juices and
spirits, are one of the main uses of PET involving direct contact with foods (Ashby
1988). PET bottles are also used in non-food contact applications, such as storage for
toiletries, cosmetics and other household products (Ulrich 1993).
As it will not thermally deform below 220ºC, PET is used as a film for roasting bags
and containers for reheating, cooking and crisping food. Metallised PET film
(thermally conducting susceptor film) is used in microwave cooking for browning
applications such as pastries, potato fries and popcorn. In non-food contact
applications, PET film is used for X-ray and other photographic film, magnetic tape
and electrical insulation.
2.1.2 Manufacture of PET bottles
The manufacture of PET bottles involves two parts: injection moulding of the PET
resin and blow moulding of the resultant preforms. These steps can be performed
simultaneously as a one-stage process or separately as a two-stage process.
Injection moulding involves melting PET under vacuum and injecting the melt into
mould cavities. Rapid cooling then takes place and the preform, which possesses a
test-tube like form, is ejected (Pó et al. 1995).
Blow moulding involves heating and mechanically stretching the preform in its axial
direction and finally blow moulding it into the bottle shape using hot air (Pó et al.
1995).
During stretching and blow moulding, polymer chains align themselves closely in the
direction of the stretch, improving the gas barrier and mechanical properties (e.g.
tensile strength, Young’s modulus, elongation at break) of the bottle (Mc Evoy et al.
1998). The top and bottom of the bottle are amorphous, like the preform, whilst the
2

Chapter 2
mid-section is crystalline and biaxially oriented, resulting from the blow-moulding
stage of the bottle manufacture (Sadler et al. 1996, Nielsen 1994).
2.1.3 Improving gas barrier properties of PET
In the case of food packaging, oxygen and carbon dioxide permeation needs to be
minimised in order to prevent carbon dioxide loss during carbonated soft drink
storage, and oxygen entry, which can lead to bacterial spoilage, off-flavours and/or
colour change in the food/beverage.
Apart from the obvious changes to molecular orientation and crystallinity, the
addition of co-monomers during the formation of the PET resin can also improve
many of the final physical properties of the polymer. For example, the addition of
isophthalic acid, cyclohexane dimethanol, diethylene glycol, or 2,6-napthalene
dicarboxylic acid modifies the polymer’s crystallinity, its melt temperature and glass
transition temperature, its melt strength and melt viscosity, its tensile strength and
elasticity modulus and its gas permeability (Schumann and Thiele 1996).
In the beverage industry, PEN (polyethylene naphthalate)-PET co-polyesters and
blends are becomming popular since PEN (Figure 2.2) enhances the gas barrier
properties of PET. The improved gas barrier performance of PEN derives from the
double ring structure of the naphthalene molecule, which increases the intermolecular
bonds between polymer chains. These stronger intermolecular bonds give rise to
further improved properties of PEN over PET, which are shown in Table 2.1
(Schumann and Thiele 1996). The higher glass transition temperature and thermal
resistance of PEN makes this polymer extra suitable for use as oven containers.The
greater cost of dimethyl naphthalene dicarboxylic acid (required for PEN) compared
to dimethyl terephthalate (required for PET) limits the commercial use of the PEN
homopolymer (Pó et al. 1995). However by combining the economics of PET with
the superior properties of PEN, the container’s mechanical requirements are met at a
lower cost in relation to using PEN as a homopolymer.
Figure 2.2: Structure of PEN.
3

Chapter 2
O
OCH2CH2 CO
C O
O
C
O
OCH2CH2O C
CH2CH2
The gas permeation of PET bottles can be further reduced by a multilayer technique,
whereby a superior barrier material is sandwiched between two PET layers (e.g. the
use of nylon in PET beverage bottles). The presence of polyamides (PA), ethylene
vinyl alcohol (EVOH) or active oxygen absorbents in the centre layer will reduce the
level of gas permeation of the polymer bottle. PA and EVOH are sensitive to
moisture, therefore are protected from the aqueous environment by two outer layers of
PET (Feigenbaum et al. 1993).
An alternative method is to coat the PET walls with siloxane, epoxy resins or
amorphous carbon (e.g. the coating of PET beer bottles with an epoxy amine resin).
Table 2.1: Comparative properties of PET versus PEN.
Property PET PEN
Glass transition
temperature
69°C 113°C
Thermal resistance 120°C 155°C
Oligomer Extraction 15 mg/m2hr 2 mg/m2hr
Resistance to hydrolysis 50 hr 200 hr
Resistance to irradiation 2 MGY 11 MGY
Breakdown voltage 400 V/µm 400 V/µm
Tensile strength 45 kg/mm2 80 kg/mm2
Young’s modulus 1200 kg/mm2 1800 kg/mm2
CO2 permeation 16 [cm3mm/(m2d.bar)] 2 [cm3mm/(m2d.bar)]
O2 permeation 4 [cm3mm/(m2d.bar)] 0.5 [cm3mm/(m2d.bar)]
The addition of “barrier” additives to PET raises concerns during recycling, which
requires that the PET be of reasonable purity. The presence of “barrier” polymers in
post-consumer PET feed may have a detrimental effect on the final properties of
4

Chapter 2
recycled PET; therefore it is desirable that their levels are kept at a minimum and
seldom used.
PET recycling and the extent of its purification with respect to post-consumer
contamination will form the basis of this thesis in the area of food safety.
2.2 FOOD CONTACT CONSIDERATIONS FOR VIRGIN PET
2.2.1 Introduction
In the area of food-contact polymers there are three polymer-food interaction
mechanisms which could potentially affect the integrity of the food and/or polymer.
As already discussed, one of these mechanisms is the permeation of gases,
specifically carbon dioxide and oxygen through the package. The other two forms of
interaction, schematically illustrated in Figure 2.3, are:
• The migration of substances from the package into the food.
• The sorption of substances from the food into the package.
Figure 2.3: Drawing of the bottom part of a PET soft drink bottle illustrating sorption,
migration and permeation.
Yellow spheres: Aroma compounds
Green spheres: Migrants of polymer
Soft drink
PET bottle wall
Purple spheres: penetrants e.g. oxygen and carbon dioxide
Sorption
Re-migration
Permeation5

Chapter 2
Before PET is used in food contact applications, research must be undertaken
reinforcing the safety and suitability of the polymer as an item of food packaging.
This worldwide obligation erupted with the realisation that although plastics could be
used towards protecting food from bacterial and environmental contamination, they
themselves could also represent a source of contamination to the food by means of
migrating polymer constituents (Tice and McGuinness 1987). Additionally, unlike
glass, polymers can act as a sink removing some of the essential constituents of the
food (Paik 1992, Tavss et al. 1988, Gavara et al. 1997). Flavour constituents
(myrcene and limonene) have been shown to remain in PET and PC after washing and
this was confirmed by a strong smell of orange from the plastic bottles (Nielsen
1994). Such data not only indicates a potential problem of the flavour being lost on
storage, but also indicates the possibility of carry-over of flavour from one product to
another if the PET were to be re-used, a topic which will be discussed in detail
shortly.
2.2.2 Sorption considerations in food contact applications
One of the polymer-matrix interaction mechanisms, which could have an impact on
the integrity of the contacting media, is the sorption or “scalping” of food components
by polymers. For example, flavour compounds (e.g. terpinenes, esters, aldehydes and
alcohols) from orange juice or soft drink could sorb into the PET plastic in turn
affecting the organoleptic properties of the beverage, which is perceived as a loss in
fresh-like quality (Imai et al. 1990).
In addition, the sorbed components could act as migratory contaminants if the bottle is
recycled or reused for food contact applications (Nielsen 1994), which in turn could
have an impact on the taste and smell of the receiving medium. In subsequent
sections we will elaborate on this point by addressing the issues associated with
contaminants in recycled PET, arising from previous use and consumer abuse,
remigrating into soft drink.
Apart from affecting the organoleptic properties of food, flavour sorption has also
been shown to have an influence on the gas barrier (van Willage et al. 2002, Sadler
and Braddock 1991, Mannheim et al. 1987) and mechanical properties (Tawfik et al.
1998) of polymers. Fortunately, PET has the advantage of a low sorption capacity
6

Chapter 2
compared to polyolefins, PC (polycarbonate) and EVOH making it more suitable for
use as a food packaging (Nielsen et al. 1992, Nielsen 1994, van Willige et al. 2002,
Imai et al. 1990, Gavara et al. 1997). However, previous authors have concluded that
in spite of the very small extent of sorption, the physical properties of PET (Tawfik et
al. 1998), and the organoleptic properties (which are those associated with the five
senses) of the refill when the polymer is reused (Nielsen 1994), could still be affected.
Where gas barrier properties are concerned, van Willage et al. (2002) showed that
oxygen permeability in PET was not significantly affected by absorption of flavour
compounds. However, rubbery polymers with low glass transition temperatures (Tg)
such as LDPE and PP swelled in the presence of flavour compounds, increasing the
free volume and thus the oxygen permeability.
Figure 2.4: A summary of the disadvantages of “flavour scalping”.
Sorbed compounds could migrate during polymer reuse
Sorption could alter gas barrier and mechanical properties of PET
Disadvantages of sorption
Sorption could affect the organoleptic integrity of the food
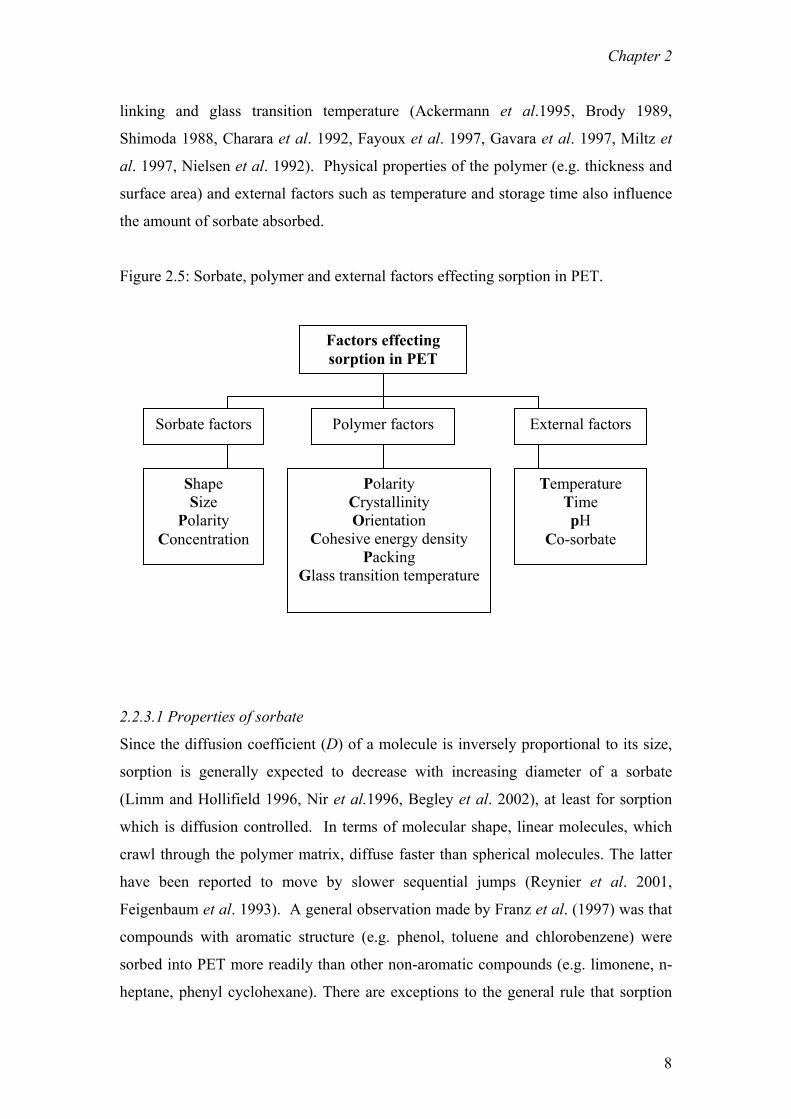
2.2.3 Factors contributing to the degree of sorption
The degree of sorption is dependent upon sorbate shape, size, polarity and
concentration of the sorbate (Sadler and Braddock 1991, Brody 1989, Nielsen 1991a,
Shimoda 1988, Gavara et al. 1997, Reynier et al. 2001) as well as polymer
morphological and chemical characteristics such as polarity, crystallinity, axial
orientation, cohesive energy density, packing of polymer chains, degree of cross-
7
Chapter 2
linking and glass transition temperature (Ackermann et al.1995, Brody 1989,
Shimoda 1988, Charara et al. 1992, Fayoux et al. 1997, Gavara et al. 1997, Miltz et
al. 1997, Nielsen et al. 1992). Physical properties of the polymer (e.g. thickness and
surface area) and external factors such as temperature and storage time also influence
the amount of sorbate absorbed.
Figure 2.5: Sorbate, polymer and external factors effecting sorption in PET.
Sorbate factors Polymer factors
Temperature Time pH
Co-sorbate
CO
Cohesi
Glass tra
Shape Size
Polarity Concentration
External factors
Factors effecting sorption in PET
2.2.3.1 Properties of sorbate
Since the diffusion coefficient (D) o
sorption is generally expected to d
(Limm and Hollifield 1996, Nir et a
which is diffusion controlled. In ter
crawl through the polymer matrix, d
have been reported to move by s
Feigenbaum et al. 1993). A general
compounds with aromatic structure
sorbed into PET more readily than o
heptane, phenyl cyclohexane). There
Polarity rystallinity rientation
ve energy density Packing
nsition temperature
f a molecule is inversely proportional to its size,
ecrease with increasing diameter of a sorbate
l.1996, Begley et al. 2002), at least for sorption
ms of molecular shape, linear molecules, which
iffuse faster than spherical molecules. The latter
lower sequential jumps (Reynier et al. 2001,
observation made by Franz et al. (1997) was that
(e.g. phenol, toluene and chlorobenzene) were
ther non-aromatic compounds (e.g. limonene, n-
are exceptions to the general rule that sorption
8

Chapter 2
decreases with increasing molecular size. Discrepancies in the relationship between
sorption and molecular size occur when molecular polarity plays a more important
role in sorption than sorbate volume. For example, Shimoda et al. (1988), Ikegami et
al. (1991) and Nielsen et al. (1992) observed that as the carbon number in the straight
chain of esters, aldehydes and/or alcohols increased, the degree of sorption also
increased until a certain carbon number is reached, beyond which sorption decreases.
The increase in sorption was explained in terms of polarity; the longer the chain, the
less polar the compounds and the easier the compounds are sorbed into non-polar
polymers (Nielsen et al. 1992). Shimoda et al. (1988) explained the subsequent
decline in sorption beyond an optimum carbon number in terms of steric hindrance.
From the results of these studies it can be concluded that a balance exists between the
effects of sorbate polarity and steric hindrance with increasing carbon number.
The importance of sorbate polarity on the degree of sorption has been demonstrated in
other cases. For example, it is argued that the lipophilic nature of limonene makes it
more inclined to sorb into polyolefins than into PET (Kwapong and Hotchkiss 1987).
In addition, polar volatiles such as short chain aldehydes and alcohols are sorbed into
polyolefins to a lesser extent than non-polar hydrocarbon compounds such as
limonene (Sadler and Braddock 1991, Charara et al. 1992). A similar dependence on
sorbate polarity was confirmed by Shimoda et al. (1988) who made the observation
that esters were sorbed into LDPE to a greater extent than aldehydes, which in turn
were sorbed more than alcohols. This sorption order was moreover observed for
MDPE but not for EVOH, which is hydrophilic and therefore more likely to sorb the
polar compounds (alcohols and aldehydes) than the terpene hydrocarbons (Ikegami et
al. 1991).
2.2.3.2 Polymer chemical and morphological properties
As mentioned earlier, diffusion is not only influenced by sorbate characteristics but
also by polymer character. A container that is crystalline, biaxially orientated, and
has both a high transition temperature and cohesive energy density (strong
intermolecular bonds) impedes diffusion due to the lack of free volume (“holes”) in
the polymer. The favourable cohesive energy, polarity and intermolecular packing of
PET provide a degree of resistance to sorption (or migration) whilst acting as a barrier
9

Chapter 2
to diffusion (Gavara et al. 1997, Arora and Halek 1994). In addition, the high glass
transition temperature of PET hampers the free vibration and rotational motion of
PET at room temperature, affecting the diffusion of sorbates (van Willige et al. 2002,
Paik 1992). By increasing the degree of crystallinity and orientation in PET the size,
shape and distribution of microcavities in PET will decrease, further obstructing the
path to diffusion (Nir et al. 1996, Miltz et al. 1997). It has been suggested that
diffusion of analytes only occurs in the amorphous regions of PET (Fayoux et al.
1997, Charara et al. 1992), therefore sorption is expected to occur most in the top and
bottom of a PET soft drink bottle, which is more amorphous than its biaxially
orientated mid-section (Sadler et al. 1996, Nielsen 1994, Jetten et al. 1999). Begley
et al. (2002) demonstrated the effect of polymer orientation and crystallinity on the
sorption of lindane into PET. It was observed that nine times less sorption occurred
into orientated and crystalline PET than into amorphous PET.
2.2.3.3 Solubility parameter
The difference in the extent of sorption of different types of compounds into a
polymer can be predicted by the similarities in Hildebrand solubility parameter (δ), or
cohesive energy density, between the sorbate and polymer. However, the effects of
hydrogen bonding and polarity as well as sorbate shape and size must also be taken
into account since these are sometimes ignored, or poorly treated, when calculating
solubility parameters (Nielsen et al. 1992, Konczal et al. 1992, Arora and Halek
1994). As shown by Paik (1992) the solubility parameter difference does not predict
well the relative solubility of more polar compounds, as can be the case with PET.
Equation 2.1 is used to calculate the solubility parameter (δ) for a substance where Le
is the molar latent heat of vaporisation of the liquid and V is the molar volume, both
at absolute temperature, T. The dimensions are (cal/cm2) ½, also called 1 Hildebrand
(1H) for convenience. If the Le value is not known it is calculated from Small’s molar
attraction constants, which could be obtained from the CRC Handbook of Chemistry
and Physics (Weast and Melvin, 1979).
δ = [(Le – RT)/V]1/2 Equation 2.1The difference in solubility parameters
between two components is described as the “heat of mixing”. The lower the heat of
10

Chapter 2
mixing (or difference in solubility parameters) the higher the solubility of a sorbate in
the polymer. This interaction leads to the swelling (or plasticisation) of a polymer,
which can increase its oxygen permeability (van Willige et al. 2002) or facilitate the
extraction of polymeric components. The theory of solvation has been applied to the
solvent extraction of migratory constituents out of polymers intended for food contact
applications (Vandenburg et al. 1999, Feigenbaum et al. 2002) and will be addressed
in subsequent sections of the current thesis.
Polymer swelling opens up the polymer structure and therefore facilitate sorption of
other components from the contacting solution. The effect of acetone, a PET-swelling
solvent, on the penetration of lindane has been already studied (Begley et al. 2002).
There have been a few studies undertaken explaining sorption results in terms of
differences in solubility parameter.
As demonstrated by Nielsen et al. (1992) PET absorbed smaller quantities of esters
and aldehydes than polyolefins (i.e. LDPE, LLDPE and PP) as a result of the large
solubility differences between the sorbates and PET. Although the solubility
parameters for alcohols matched those of PET, sorption was negligible probably
because of the hydrogen bonding differences between the alcohols and PET. In the
latter study, differences in the amount sorbed between the polyolefins resulted from
morphological differences between the different polymers, such as variations in
crystallinity and interchain packing. In terms of interchain packing, it was observed
that the longer the branches on a polymer the smaller the packing density and
therefore the greater the extent in sorption, as for LDPE.
In another study, Arora and Halek (1994) established that PET sorbed much more
fatty acids than PP. The opposite was true for the triglycerides, which were sorbed
into PP to a greater extent than into PET. The author attributed these observations to
similarities in solubility parameters as well as morphological effects such as
crystallinity and interchain packing enforced by the zig-zag planar structure of PET.
PP has a helical structure that does not pack as efficiently. These two studies
highlight the importance of considering factors such as polymer morphology and
sorbate hydrogen bonding as well as solubility parameters when interpreting the
extent of sorption into a polymer.
11
Chapter 2
2.2.3.4 Polymer physical properties
Other than polymer morphological and chemical properties, the polymer physical
properties such as surface area and film thickness also have an impact on the degree
of sorption (Ikegami 1991, Shimoda 1988, Nielsen 1994).
Ikegami (1991) and Shimoda (1988) both established that an increase in polymer
thickness caused a rise in the amount of compound sorbed. This result is expected
given that film thickness describes the sorbate capacity of a polymer, but only if
enough contact time has been involved such that capacity limits the extent of sorption
and not kinetic factors.
Nielsen (1994) observed the effects of increasing polymer surface area on the sorption
of limonene and myrcene into PET. With increasing polymer surface area, sorbate
diffusion occurs from more directions, resulting in a greater degree of sorption. An
increase in sorption with surface area, results in an improved rate of migration or
extraction. In this case, kinetic factors presumably allow for a greater sorption even
though the sorption capacity (polymer thickness) is the same. Alternatively, if
sorption is really an adsorption, rather than absorption, process then an increase in
surface area will genuinely increase the adsorption capacity [Harding and Healy
1979]. The effect of polymer surface area on extraction will be discussed in
subsequent chapters.
2.2.3.5 Temperature
External factors that influence sorption are time, temperature, pH and the presence of
co-sorbents (Fayoux et al. 1997).
Nielsen (1994) found that three times more limonene was sorbed into PET at 25°C
than at 4°C. Kwapong and Hotchkiss (1987) also observed that the sorption of
limonene into LDPE increased with temperature. This effect has been observed for a
number of adsorbates, for example benzene sorption into PET (Sadler et al. 1996).
The increase in sorption with temperature is attributed to a different equilibrium
constant and/or a faster diffusion process at higher temperatures. The reason behind
the latter stems from the fact that the diffusion coefficient (D) is exponentially related
to temperature (T) as indicated by the Arrhenius equation (Equation 2.2) (Cotton et al.
1993). The diffusion coefficient (whose units are cm2/s) of a sorbate/migrant depends
12
Chapter 2
on two factors controlled by temperature (whose units are K) - the vibrational motions
of the (a) polymer chains and (b) sorbates.
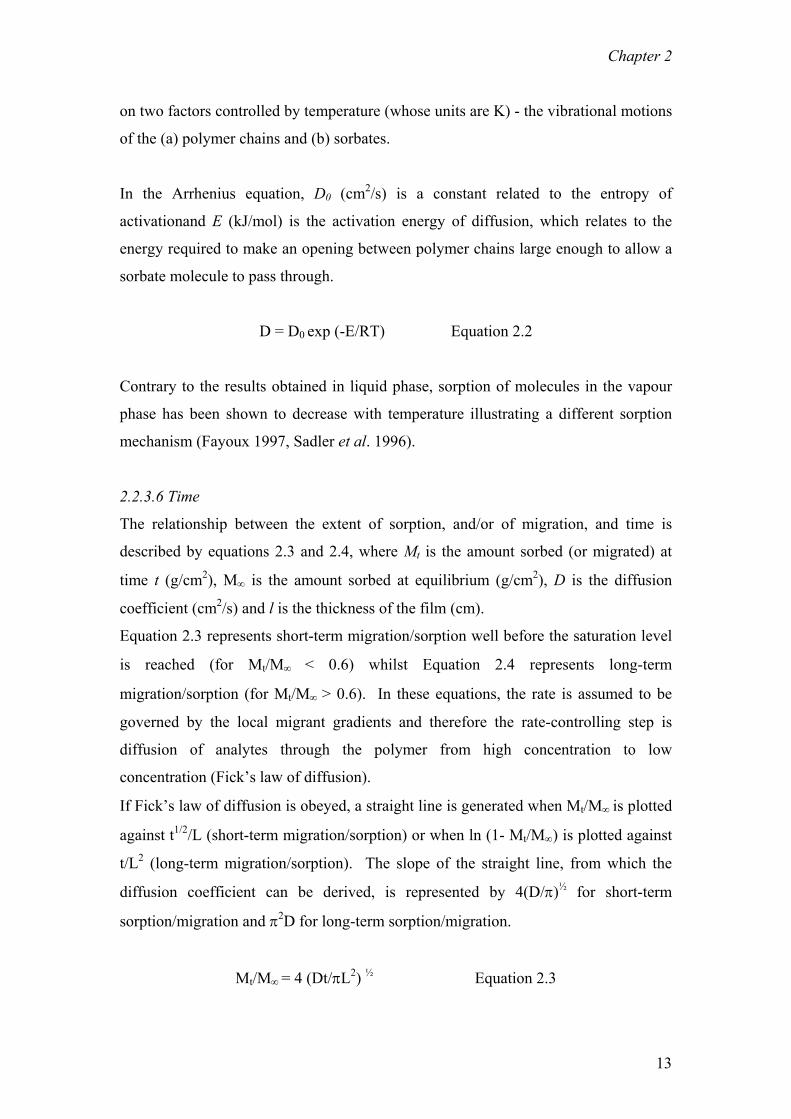
In the Arrhenius equation, D0 (cm2/s) is a constant related to the entropy of
activationand E (kJ/mol) is the activation energy of diffusion, which relates to the
energy required to make an opening between polymer chains large enough to allow a
sorbate molecule to pass through.
D = D0 exp (-E/RT) Equation 2.2
Contrary to the results obtained in liquid phase, sorption of molecules in the vapour
phase has been shown to decrease with temperature illustrating a different sorption
mechanism (Fayoux 1997, Sadler et al. 1996).
2.2.3.6 Time
The relationship between the extent of sorption, and/or of migration, and time is
described by equations 2.3 and 2.4, where Mt is the amount sorbed (or migrated) at
time t (g/cm2), M∞ is the amount sorbed at equilibrium (g/cm2), D is the diffusion
coefficient (cm2/s) and l is the thickness of the film (cm).
Equation 2.3 represents short-term migration/sorption well before the saturation level
is reached (for Mt/M∞ < 0.6) whilst Equation 2.4 represents long-term
migration/sorption (for Mt/M∞ > 0.6). In these equations, the rate is assumed to be
governed by the local migrant gradients and therefore the rate-controlling step is
diffusion of analytes through the polymer from high concentration to low
concentration (Fick’s law of diffusion).
If Fick’s law of diffusion is obeyed, a straight line is generated when Mt/M∞ is plotted
against t1/2/L (short-term migration/sorption) or when ln (1- Mt/M∞) is plotted against
t/L2 (long-term migration/sorption). The slope of the straight line, from which the
diffusion coefficient can be derived, is represented by 4(D/π)½ for short-term
sorption/migration and π2D for long-term sorption/migration.
Mt/M∞ = 4 (Dt/πL2) ½ Equation 2.3
13

Chapter 2
Mt/M∞ = (1-8/π2) exp (-π2Dt/L2) Equation 2.4
A plot of the natural log of the calculated diffusion coefficients versus the inverse of
temperature has been shown to result in a straight line, suggesting an Arrhenius
relationship between both variables for the migration (rather than sorption) of
antioxidants from polyolefins into fatty simulants (Lickly et al. 1990). A similar
Arrhenius plot was constructed for the sorption of acetone (Shan and Tsu-Shang
1999) and the sorption of benzene into PET (Patton et al. 1984). Deviation from
linearity can occur. For example, glassy polymers above their glass transition
temperature do not give a linear Arrhenius plot. This is because the activation energy,
which is given by the slope of the Arrhenius curve, does not vary in a linear fashion
with temperature for glassy polymers above their glass transition temperature (Begley
and Hollifield 1990a).
Fick’s law of diffusion is obeyed for amorphous rubbery polymers in the absence of
swelling. Diffusion kinetics for PET is not expected to follow Fick’s law of diffusion
because it is a glassy polymer. In fact, past researchers have observed a pseudo-
Fickian behaviour for dichloromethane sorption (Liu and Neogi, 1992) and other
organic solvent sorption into PET (Nir et al. 1996). The swelling stresses created by
the solvent penetration are thought to have contributed to a deviation from Fickian
behaviour. For pseudo-Fickian diffusion the “½” in Equation 2.3 is substituted by a
smaller fraction (< ½) whereas for non-Fickian diffusion it is replaced by “1”.
2.2.4 Migration considerations in food contact applications
Previous research has shown the presence of low molecular weight components in
virgin PET and other polymers that result from the polymers' original manufacture
(Monteiro et al. 1996, Kim et al. 1990, Costley et al. 1997, Ezquerro et al. 2003).
Many of the residual compounds could have high diffusibilities and thus the potential
to migrate into food by passing randomly through microscopic voids created by the
movement of polymer chains (Kashtock and Breder 1980, Startin et al. 1987, Morelli-
Cardoso et al. 1997, McNeal and Hollified 1993, Castle et al. 1996, Tawfik and
Huyghebaert 1988).
14

Chapter 2
The contamination of food by migratory components in PET raises health concerns
and/or could affect the food’s organoleptic properties. Even if these problems are
eventually shown not to create a significant health risk they could, if found to be true,
result in diminished sales due to negative consumer perception (Ackermann et
al.1995, Ezquerro et al. 2003). It is therefore desirable to monitor the safety of PET
by monitoring what contaminants can be extracted or migrated out of it. The former
involves quantitative analysis of contaminants present in the PET. The latter involves
contacting the polymer with a food, or food simulant, determining the quantity of
components migrating from the plastic and deciding whether the thresholds enforced
by the FDA or EEC are exceeded. Such tests are not quantitative measures of the
contaminants in PET but are realistic measures of the amount of contamination which
using PET might result in. In order to simplify the migration experiment in terms of
extraction and instrumental analysis, food simulants that reproduce migration are
usually used rather than foods themselves (Table 2.2 and Table 2.3 show a
comprehensive list of recommended food simulants). The storage conditions for
migration testing using these simulants are 40°C /10 days (ECC) and 49°C /10 days
(FDA). Alternative food simulants to those recommended by the FDA and ECC can
be used, provided migration tests are performed demonstrating their ability to
reproduce the food of interest (Baner et al. 1994a, Hamdani and Feigenbaum 1996,
Tawfik and Huyghebaert 1998). As demonstrated by Riquet and Feigenbaum (1997),
it is also possible to tailor the aggressivity of food simulants, using mixtures of
solvents.
Table 2.2: A list of FDA food simulants.
Food Type Recommended Food Simulating Solvent Aqueous and acidic foods
10% Ethanol (in specific applications water and 3% acetic acid simulant)
Low and high alcoholic foods 10 or 50% Ethanol
Fatty foods Food oil (e.g. corn oil), HB307, or Miglyol 812™1
1 HB307 is a mixture of synthetic triglycerides (primarily C10, C12,C14). Miglyol 812™ is derived from coconut oil, which also consists of triglycerides (C8,C10).
15

Chapter 2
Table 2.3: A list of EEC food simulants.
Food Type Recommended Food Simulating Solvent Aqueous foods with pH >4.5
Distilled water
Aqueous foods with pH < 4.5 3% acetic acid in water
Alcoholic beverages of alcoholic strength equal to or exceeding 5% volume
15% ethanol or 50%
Fatty foods Food oil (e.g. corn oil), HB307
2.2.5 Factors affecting the extent of migration
As with sorption, the extent of migration into food/simulant depends on external
factors (e.g. temperature, time and interactivity of matrix with the polymer) as well as
polymer characteristics (e.g. crystallinity, thickness and glass transition temperature)
and migrant factors (e.g. concentration, size, shape, polarity and solubility in the
food/simulant).
External factors
Migrating ability increases with temperature, time and in the presence of “aggressive”
or polymer-interactive foods, which could act as migrant extractants by swelling the
polymer (Ashby 1988). For example, Tawfik and Huyghebaert (1998) showed that
there was a relationship between the extent of styrene migration from polystyrene
cups into milk and the fat content of that milk (milk fat is a polymer interactive).
These authors also concluded that the level of migration depends on storage
temperature and time. Likewise, Snyder and Breder (1985) monitored the migration
of styrene from polystyrene into various solvents (potential food simulants), with
respect to time. The results were modelled using the standard migration equation
(Equation 2.3) and the diffusion coefficient was determined for migration into each
solvent. Solvent penetration by the more aggressive solvents (e.g. decanol and 50%
ethanol) contributed to an increase in styrene migration. This solvent penetration was
more pronounced at a higher temperature, (70°C compared to 40°C) and therefore so
was the migration of styrene. Since the migration equation is theoretically
inapplicable during solvent penetration, the diffusion coefficients calculated were
16

Chapter 2
thought of as “effective diffusion coefficients”. The most suitable fatty food simulant
at 70°C was 8% ethanol (decanol, 50% ethanol and 20% ethanol were too
aggressive).Lickly et al. (1990) studied the migration of an antioxidant from HDPE
and PP into a series of potential fatty food simulants and demonstrated that an
Arrhenius-type relationship existed between the diffusion coefficient and temperature
for the migration of antioxidant. Similarly, Goydan et al. (1990) found an Arrhenius
correlation between diffusion coefficient and temperature whilst studying the
migration of antioxidants from HDPE and LDPE into 95% ethanol, corn oil and
aqueous simulants (water and 8% ethanol). The amount migrating into the fatty
simulants (95% ethanol and corn oil) was higher than into aqueous simulants.Begley
and Hollifield (1990a) found an increase in the migration of cyclic trimer from PET
microwave susceptor trays into corn oil with increasing temperature however
concluded that the Arrhenius plot was non-linear above the PET glass transition
temperature (see Figure 2.10 for a definition of what is meant by "cyclic" trimer).
Baner et al. (1994a) and Vijayalakshmi et al. (1999) confirmed the kinetic "rule of
thumb" that the kinetic rate (proportional to the diffusion coefficient) doubles for
every 10°C increase in temperature for the migration of additives from polymers,
including PET. This indicates an Arrhenius type relationship between temperature
and diffusion coefficient for temperatures below 70°C.
Polymer and migrant factors
Other factors that influence the amount of migrant entering the food phase are
polymer crystallinity, thickness, and glass transition temperature of the polymer, as
well as migrant concentration, size, polarity and solubility in the food simulant of the
migrant (usually a contaminant). Miltz (1998) established that the diffusion
coefficient for the migration of toluene from PET into water increased with initial
toluene concentration. Hamdani et al. (1997) further demonstrated the mathematical
relationship describing the dependence of migration on migrant concentration in the
polymer (Equation 2.5). Equation 2.5, which directly relates migration to the initial
concentration in the polymer, is a derivation of Equation 2.3.
Mf,t/A = 2Cp,0(Dt/π)1/2 Equation 2.5
Mf,t = Amount of substance migrating into food at time t (g)
17

Chapter 2
A = Material’s food contact surface area (cm2)
Cp,0 = Initial concentration of migrant in the polymer (g/cm3)
D = Diffusion coefficient of the migrant in the polymer (cm2/s)
Castle et al. (1988) suggested the use of high molecular weight plasticisers to reduce
their migration into food, implying a dependence of molecular size on migration.
Baner et al. (1994b) modelled this effect showing, that diffusion decreased with
increasing molecular weight. A formula relating the diffusion coefficient of a migrant
to its molecular weight was developed in order to predict the extent of migration at
any given temperature and time (Equation 2.6). Begley and Hollifield (1990a)
observed that the percent migration of cyclic trimer oligomer migrating into corn oil
exceeded that of the cyclic tetramer which, in turn, exceed that of the cyclic hexamer.
This result is almost certainly attributable to differences in molecular size.
D ≤ 10,000 exp (A - a M – b 1/T) [cm2/s] Equation 2.6
D = diffusion coefficient in the polymer [cm2/s]
M = molecular weight of migrant
T = temperature in K
A = dimensionless polymer specific constant
a and b = constants
Hamdani and Feigenbaum (1996) and Feron et al. (1994) have shown that the polarity
and solubility of the migrant and therefore its affinity for the polymer-contacting
medium is a factor governing migration. For example, Hamdani and Feigenbaum
(1996) found that TEHTM [tris(2-ethylhexyl)trimellitate] migrates more into
isooctane and oil, but less into ethanol presumably because TEHTM prefers the more
non-polar solvents. The opposite was observed for ESBO (epoxidised soybean oil),
which contains polar groups and therefore migrates more into ethanol than into
isooctane and oil. Similarly, Devlieghere et al. (1998) observed that global (sum)
migration into fatty food simulants was higher than that into aqueous simulants. This
observation was attributed to the higher solubility of organic migrants into a fatty
medium compared with an aqueous one.
18

Chapter 2
Feron et al. (1994) suggested that the low solubility of lindane could be the limiting
factor for its remigration from the bottle into the soft drink simulant.
Riquet and Feigenbaum (1997) discussed the effects of hydrogen bonding on the
migration of amino TEMPO out of PVC containing ESBO, which interacts with the
migrant through hydrogen bonding. To encourage migration, a simulant is used that
competes for interaction with the migrant and displaces ESBO.
Ashby (1988) presented the effects of increasing film thickness and crystallinity on
the overall migration from PET into olive oil. Global migration was shown to
decrease with increasing crystallinity and orientation. Conversely, migration was
shown to increase in a linear fashion with increasing film thickness until a limiting
polymer thickness was reached beyond which the rate of migration became was
reduced. It was assumed that migration from thick samples was reduced because the
olive oil failed to penetrate the thicker sample. Baner et al. (1994a) also discussed
similar implications of film thickness on migration.
Begley and Hollifield (1990b) observed that crystalline PET trays exhibit lower
migration rates than paperboard PET trays and attributed this to differences in
polymer crystallinity.
Begley et al. (1995) concluded that migration was lower from a PET tray designed for
oven use than a nylon-roasting bag owing to the higher glass transition temperature of
PET.
2.2.6 Potential migrants resulting from the manufacture of PET
Components inherited during PET manufacture are the primary source of
contamination in PET food packaging situations, apart from
when the container is recycled or reused.
Potential migrants in virgin PET include compounds that are added to assist in
polymer formation or enhance the polymer’s final properties (e.g. additives, catalysts
and starting materials) and compounds that result from the extreme conditions of the
polymerisation process (e.g. monomers, oligomers, reaction bi-products, acetaldehyde
and additive breakdown products). In order to monitor the food safety of PET
containers, studies have been carried out to screen for components in the (virgin)
polymer which can migrate into its contacting food or food-simulant. From the
19

Chapter 2
results of these experiments and their comparison to set regulations, conclusions can
be drawn as to when, if at all, PET poses a threat to the consumer when used as a
food-grade plastic.
Residual compounds resulting from manufacture identified in PET
The manufacture of PET involves three steps, each having the potential for
introducing migratory components. The first stage involves the manufacture of
ethylene glycol, terephthalic acid and/or dimethyl terephthalate, all from crude oil
using catalysts, pressure and heat. In the case of the latter two compounds, p-xylene
from the naphtha fraction of crude oil is either oxidised to terephthalic acid or
oxidised and esterified (with methanol) to produce dimethyl terephthalate (Figure
2.6). Ethylene glycol is manufactured by oxidation of ethylene from the gas fraction
of crude oil to ethylene oxide (oxirane), which is subsequently hydrolysed with water.
The oxidation of ethene to oxirane takes place in the presence of a silver catalyst.
The potential migratory components resulting from this step are catalysts (cobalt-
manganese salt, silver); p-xylene and other components of crude oil; ethylene glycol;
terephthalic acid and/or dimethyl terephthalate; p-toluic acid; p-toluic acid methyl
ester; p-terephthalate; and monomethyl ester.
Figure 2.6: Formation of dimethyl terephthalate and terephthalic acid from xylene.
20

Chapter 2
CH3
CH3
COOH
COOH
CH3
COOH
CH3
COOCH3 COOCH3
COOH COOCH3
COOCH3
O2
O2
CH3OH HNO3 CH3OH
p-xylene
p-toluic acid p-toluic acidmethyl ester
p-terephthalatemonomethyl ester
dimethyl terephthalate
terephthalic acid
The presence of catalysts, p-xylene, ethylene glycol, terephthalic acid and dimethyl
terephthalate as residues in PET and as migrants in food/simulants is well
documented. For example, Freire et al. (1998) identified p-xylene, terephthalic acid,
dimethyl terephthalate and other volatile compounds in PET, including samples used
as multilayer films, bottles, susceptors and roasting bags. The levels of the volatiles
were concluded to be low, indicating no hazard to public health. Hillery et al. (1989)
identified the presence of terephthalic acid and ethylene glycol in a PET beverage
bottle, microwavable tray and two commercial resins. Both compounds were also
identified at acceptable levels in a commercial amber PET bottle wall (Kim et al.
1990). The migration of ethylene glycol from PET bottles into food simultant (3%
acetic acid) was also studied by Kashock and Breder (1980). The quoted levels of
ethylene glycol were 5 ppm and 0.1 ppm in the polymer and food simulant
respectively. The EEC regulation for the migration of ethylene glycol into food is 30
ppm, therefore this packaging is considered appropriate for food contact applications
in terms of ethylene glycol migration.
Morelli-Cardoso et al. (1997) performed a specific migration study concerning the
migration of ethylene glycol from PET bottles into aqueous food simulants (distilled
21

Chapter 2
water, 3% w/v aqueous acetic acid and 5% v/v aqueous ethanol. The levels of
ethylene glycol migrating were below the maximum method detection limit (2.2 ppm
for 3% aqueous acetic acid). Therefore, the PET bottles were concluded to be of a
suitable quality whilst demonstrating migration levels below the 30-ppm upper limit.
Morelli-Cardoso et al. (1997) performed a specific migration study concerning the
migration of ethylene glycol from PET bottles into aqueous food simulants (distilled
water, 3% w/v aqueous acetic acid and 5% v/v aqueous ethanol. The levels of
ethylene glycol migrating were below the maximum method detection limit (2.2 ppm
for 3% aqueous acetic acid). Therefore, the PET bottles were concluded to be of a
suitable quality whilst demonstrating migration levels below the 30-ppm upper limit.
Fordham et al. (1995) identified the presence of the cobalt metal ion amongst other
catalyst residues in PET and discovered that the level of this metal migrating into food
simulants was below the proposed EEC limit of 100 ppb. In fact, for cobalt, the levels
migrating into 3% acetic acid, 15% ethanol and olive oil were in the low ppt range.
The second stage of PET manufacture involves the formation of monomer BHET via
either the esterification of terephthalic acid with ethylene glycol or the
transesterification of dimethyl terephthalate with ethylene glycol (Figure 2.7) under
heat and high pressure. Catalysts are only used during transesterification and include
the acetates of calcium, manganese, cobalt, cadmium, lead or zinc. Since these
catalysts promote degradation of the polyester during polymerisation, phosphorous
compounds (inhibiting stabilisers) are later added to deactivate such unnecessary
function.
The potential migrants resulting from this step are the catalysts and any bis-(2-
hydroxyethyl)terephthalate (BHET) remaining after later steps [the latter has been
quantified in commercial PET by Begley and Hollifield (1989)]. Monohydroxy
ethylene terephthalic acid (MHET), a bi-product of this reaction, and terephthalic acid
were also quantified by these researches. The concentrations of terephthalic acid,
MHET and BHET in the beverage bottle were 6.9 ppm, 34.4 ppm and 49.1 ppm
respectively. The significance of these results with regards to potential human health
risks was not evaluated by Begley and Hollifield (1989). However, one can reason
that the level of terephthalic acid in the bottle wall does not threaten human health
because it is below the SML of 7.5 ppm. Since the food-contact regulations for
22

Chapter 2
MHET and BHET are not known, it is not known whether the levels of these
compounds in the bottle wall pose a health threat.
In 1990 Begley and Hollifield (Begley and Hollifield 1990b) determined the amount
of BHET migrating into oil from PET microwavable trays (0.046 µg/cm2) whilst
Shiono (1979) qualitatively identified this compound in commercial PET film.
Figure 2.7: Formation of bis-(2-hydroxyethyl)terephthalate (BHET) from dimethyl
terephthalate and ethylene glycol.
+ CH3OH2HOCH2CH2C OCO
O
CH2CH2OH
O
2 HO(CH2)2OH +CH3
O
CH3
O
C OCO
catalysts
The third, and final, stage of PET manufacture involves manufacture by melt
polymerisation (Figure 2.8) of the monomers followed by solid-state polymerisation.
The latter process is important in the production of beverage bottles since it involves
the vacuum and high temperature treatment of PET granules at low moisture and
oxygen levels. This treatment increases the molecular weight of the polymer and
removes migratory volatile reaction products such as acetaldehyde. Polymer
molecular weight, in addition to sidewall thickness, interchain bonding, crystallinity
and orientation are important factors that reduce the gas permeation of PET. An
added bonus of this procedure, however, is the removal of many volatile and semi-
volatile contaminants which would otherwise be significant migrants.
The catalysts used during melt polymerisation are usually substances of antimony,
germanium, titanium or lead. Ashby (1988) and Fordholm et al. (1995) studied the
migration of antimony and germanium from PET into food simulants and concluded a
low level of migration for these metals.
Figure 2.8: Formation of PET from BHET.
23

Chapter 2
O
CH2CH2OH
O
C OCO
CH2CH2 C OCO
OO
C OCO
O
CH2CH2
O
HO(CH2)OH+
CH2CH2
CH2CH2HO2
catalysts
2.2.7 Reaction by-products formed during PET manufacture
Compounds with a potential to migrate do not only include those directly involved in
the manufacture of PET, such as monomers and catalysts. Mobile molecules
originating from side reactions during polymer production could also migrate. In the
production of PET, by-products resulting from side reactions include acetaldehyde
and oligomers.
Acetaldehyde
Prolonged heat treatment during polymerisation results in the formation of carboxyl
and vinyl ester end-groups. A reaction between carboxyl and vinyl ester end-groups
generates vinyl alcohol, which exists as a tautomer with acetaldehyde (Figure
2.9).The reported organoleptic detection limits for acetaldehyde are very low ranging
from 4 to 65 ppb (Lorusso 1985), thus their presence in food contact containers such
as soft drink bottles raises particular concerns. For this reason acetaldehyde has been
analysed in PET bottles (Dong et al. 1980, Wyatt 1983, Franz and Welle 1999b) and
beverage simulants in contact with PET (Wyatt 1983, Lorusso et al. 1985, Ashby
1988, Trinh Vu-Duc 1998, Eberhartinger et al. 1990). Acetaldehyde levels in water
were found to be below the EEC standard value of 100 ppb (Lorusso et al. 1985,
Ashby 1988) when stored at 40°C for 10 days in PET bottles. However, the threshold
24

Chapter 2
was exceeded when stored for more than 30 days at this temperature (Lorusso et al.
1985). At room temperature, the latter sample was stable for up to six months.
Figure 2.9: Formation of acetaldehyde from PET.
+C OHC
O
CH2
+
O
CO
O
C OCH2CH2
OCH2CH2
CH3CHO
CHOHCH2
CH2CH2OHC
CH2
O
OHCC+C OH
Othermal degradation
C
O
CO
O
O
Oligomers in PET
Other reaction by-products formed during the manufacture of BHET and melt
polymerisation are oligomers. The analysis of oligomers in PET has been a long
existing, but highly problematic, objective. Extraction studies date back to 1954
(Hudgins et al. 1978), when the cyclic trimer (Figure 2.10) was extracted from PET
film. Since then most researchers have found that the major extractable original
component is the cyclic trimer (Goodman and Nesbitt 1960, Shiono 1979, St küppers
1992) although the "cyclic" dimer (Monteiro et al. 1996, Triantafyllou et al. 2002)
and higher molecular weight oligomers up to the cyclic decamer have also been
identified (Hudgins et al 1978, Begley and Hollifield 1989, Barnes et al 1995, Costley
et al. 1997). The presence of ether oligomer counterparts, which have one MEG unit
replaced by a DEG unit (Goodman and Nesbitt et al. 1960, Monteiro et al. 1996,
Triantafyllou et al. 2002), and linear oligomers (Hudgins et al. 1978, Begley and
Hollifield 1989) has also been reported. The overall level of oligomers in PET
generally does not exceed 3% (Goodman and Nesbitt 1960, Peebles et al. 1969,
Hudgins et al. 1978). Although the relative proportions of cyclic oligomers compared
with linear ones are not commonly quoted, it was observed from a liquid
25

Chapter 2
chromatogram produced by Begley and Hollifield (1989) that the areas of the peaks
representing the cyclic oligomers were larger than those for the linear oligomers.
In some of the early studies, separation of oligomers from the PET extract involved
fractional extraction (Goodman and Nesbitt 1960, Peebles et al. 1969). The
precipitated oligomers were then further separated by TLC and/or column
chromatography and identified by physical and chemical analysis. Nowadays, PET
extracts are separated and analysed more efficiently by GPC, HPLC and SFC, but not
generally by GC/MS, because of the low volatility of the higher molecular weight
oligomers (Dulio et al. 1995, Shiono 1979, Barnes et al. 1995). Oligomers have been
hydrolysed and methylated into dimethyl terephthalate prior to analysis by GC/MS
(Gramshaw et al. 1995).
Figure 2.10: Cyclic oligomers identified in PET.
C
C
O
OCH2CH2OC
C
O
OCH2CH2O
n
n=1 (dimer)
n=2 (trimer)
n=4 (pentamer)
O O
Extraction of oligomers from PET has also been simplified in terms of labour
intensity and solvent consumption, with the introduction of automated techniques
(MAE, SFE and ASE) to replace manual methods such as Soxhlet extraction and total
dissolution procedures often employed to extract oligomers from PET. Polymer
extraction methods will be discussed more specifically in subsequent sections.
26

Chapter 2
Oligomer migration from PET
Vacuum treatment during solid-state polymerisation decreases the amount of
oligomers present in PET by polymerising them into larger molecules. However
despite this polymerisation process, migration of oligomers into food and simulants
has been observed.
Begley et al. (1990) have studied the migration of PET oligomers from susceptor
packaging under actual microwave use conditions into food (popcorn, pizza, French
fries, fish sticks, and waffles). Food was extracted by solvent extraction and the
extract was separated and analysed by HPLC-UV. The cyclic trimer, tetramer and
pentamer were quantified and of the three oligomers the cyclic trimer migrated most,
whilst being the smallest in size (of the three cyclic oligomers) and the most abundant
of all oligomers in the polymer. The bulk of oligomers migrated from the PET bowl
into popcorn (31.3 µg/in2). French fries also had a high overall oligomer migration of
28.5 µg/in2 from susceptor packaging. However, these authors concluded that in a
previous study by Begley and Hollified (1990) it was observed that the level of
oligomers migrating into oil was five times the amount migrating into popcorn. This
result was attributed to the increased contact area with the oil compared to popcorn.
Castle et al. (1989) additionally determined the level of PET oligomer migration into
foods (e.g. lasagna, sausages, stewed apple), beverages and oil during microwave and
conventional cooking. Oligomers were measured as total levels whilst being
converted to terephthalic acid prior to separation and analysis by SEC and GC/MS.
Migration was higher for fatty foods and for susceptor packaging as opposed to the
PET tray because the former gets much hotter. The highest level of migration (1.47-
2.73 ppm) occurred into French fries that were microwave-heated in a susceptor
carton. Migration into aqueous beverages was slightly lower than that into the more
polymer-aggressive alcoholic beverages, with the levels in both cases falling below 80
ppb. Migration into food, beverage and oil was lower than the proposed global
migration limit of 10 mg/dm2 (60 ppm).
In another migration study, Buiarelli et al. (1993) identified the presence of the cyclic
dimer and its analogous ether in different brands of mineral water bottled in PET by
separating the solvent extract by HPLC and analysing the collected fractions by
GC/MS. The migrating levels of these compounds ranged from <10 ppb to 115.7 ppb
27

Chapter 2
for the cyclic dimer and from 42.8 ppb to 85.7 ppb for the analogous dimer ether.
2.2.8 Additives
Polymer additives such as plasticisers, thermal stabilisers, slip additives, light
stabilisers and antioxidants are added to polymers during manufacture in order to
improve their performance (O.-W. Lau and S.-K. Wong 2000, Nielsen 1991a).
Although PET has been reported to be relatively free from additives compared with
other polymers, some researchers have been able to identify, and in some cases
quantify, the presence of additives in food-grade PET and its contacting food medium.
Kim et al. (1990) analysed extracts from PET bottle using GC/MS and identified the
presence of fatty acids, the antioxidant BHT, and phthalate (e.g. DEHP, DEP, DBP,
DiOP) and adipate (BEHA) plasticisers. The concentrations of these potential
migrants, however, were all determined to be below the limits set by the FDA.
Monteiro et al. (1996) used an SEC-HPLC system followed by GC/MS to separate
and identify the components extracted from a PET bottle. The polymer extracts
consisted of plasticisers such as adipates, phthalates and erucamide; antioxidants
including BHA and BHT; and the UV stabiliser Tinuvin P. The amount of Tinuvin P
present in the top, body and bottom of PET bottles was determined and the author
concluded that there was no significant difference in the quantity in the different parts
of the bottle. Monteiro et al. (1998) later performed an analogous study without using
the SEC-HPLC system for separation prior to GC/MS analysis and obtained the same
result. The average level of stabiliser (Tinuvin P) in PET was determined to be 131
ppm, which was argued to be within the limits established by legislation [FDA?].
Buiarelli et al. (1993) also determined the amount of erucamide, added to polymers as
a plasticiser, migrating from PET bottles into mineral water, and the levels ranged
from 2.0 ppb to 182.0 ppb, depending on the brand of mineral water.
Freire et al. (1998) analysed volatiles in PET packaging materials and identified the
presence of DEHP - a plasticizer - and degradation products of BHT.
Nerin et al. (2000) also identified phthalate and adipate plasticisers including DEP,
DBP, DiBP and DOA. However their levels in PET were very low and the polymer
was therefore declared suitable for contact applications. Other compounds identified,
but not quantified in this study, were lubricants such as oleamide, erucamide and fatty
acid esters.
28

Chapter 2
2.2.9 Global migration
The migration studies discussed thus far were specific for the compounds of interest.
In order to determine whether the polymer poses a health risk when used as a food
grade plastic, the results from specific migration studies are compared to specific
migration limits (SML) enforced by the EEC and FDA for different migrants.
Alternatively, total migration tests, based on gravimetric determinations, can be
performed. The EEC and FDA both regulate global migration, enforcing a 60 ppb
and 50 ppb migration limit respectively.
Global migration usually involves the evaporation of the food simulant followed by
gravimetric analysis of the residue. Since heat is applied during simulant evaporation,
the resulting residue comprises of semi- and non-volatile compounds such as
oligomers. Monarca et al. suggested a method to account for volatile migrants, based
on freeze-drying prior to gravimetric analysis, however such techniques have not been
legislated for. Global migration results clearly depend on the nature of the extractant
or solvent. Gravimetric analysis is particularly applicable to aqueous and other polar
solvents. For non-polar solvents (oils), global migration usually involves weighing
the polymer before and after contact with oil. However, since oil has been shown to
absorb into the polymer, such weight difference techniques are subject to considerable
uncertainty (Baner et al. 1994a, Ashby 1988).
2.2.10 Other compounds identified in PET
Other than those already specified, compounds identified in virgin PET include
(Gramshaw et al. 1995):
Benzaldehyde
Butoxybenzene
2-Phenyl-1, 3-dioxolan
2-Methyl-1, 3-dioxolan
Dodecanoic acid
Dimethyl cyclohexane-1, 4-dicarboxylate
Toluene
Hexamethyl-cyclotrisiloxane
29
Chapter 2
Octamethyl-cyclotetrasiloxane
Decamethyl-cyclopentasiloxane
These compounds were extracted from PET by dynamic headspace at 200°C and
analysed by GC/MS. The author reported that PET had few migratable compounds
relative to the other polymers analysed [thermoset polyester, polyethersulphone,
poly(4-methyl-pent-1-ene)], again giving confidence in the use of PET as the plastic
of choice for food contact. The cyclic and linear siloxanes were assumed to be
constituents of silicon oil lubricants. The origins of the other compounds in this list
were not mentioned in by Gramshaw et al. (1995).
2.3 FOOD CONTACT CONSIDERATIONS FOR RECYCLED PET
2.3.1 Introduction to recycling
With the increasing market share of soft drink bottles made from PET, a means for
combating the amount of post-consumer PET bottles reaching landfills has become
more and more important. The obvious, and simplest, means is to reuse the PET
containers. Although this can, and is, done by the consumer there are considerable
barriers to the commercial reuse of PET containers. The most serious of these is the
inherent public health danger involved in reusing bottles which may have been mis-
used (and therefore considerably contaminated) prior to reuse.
A more viable, and commonly used, method is to recycle the PET, generally in non-
food contact applications such as clothing, pillow fillers, carpets, furniture, road
construction materials, automotive parts, film and food-contact and non-food contact
containers. Unlike reuse, the recycling of bottles for these purposes involves
destroying the original package and generating a new decontaminated resin.
About 25,000 tonnes of the 80,000 tonnes (31 per cent) of PET produced in Australia
each year is recycled, compared with about 50 per cent of all milk bottles (HDPE).
30

Chapter 2
2.3.2 Modes of recycling
There are three different methods for recycling post-consumer polymers – primary,
secondary and tertiary recycling. The reuse of post-consumer bottles is not
technically a form of recycling, as it does not involve destroying the original package,
but has been previously termed “zeroth order” recycling (US FDA 1992). Both
recycling and reuse have common goals - to decrease the build up of waste in landfills
– therefore they frequently appear as a part of the “recycling” category.
2.3.2.1 Re-use: Zeroth order recycling
Re-use involves visual and volatile screening of the post-consumer polymer batch
using colour scanners and “sniffers” prior to washing and sanitising the batch under
mild caustic, detergent and temperature conditions. The sanitised material can
practically only serve the function of its primary use (e.g. as a soft drink bottle) and
therefore must retain its structural integrity after washing. To ensure the bottles are
not distorted, the cleansing conditions (e.g. temperature) are milder during zeroth
order “recycling” than during other forms of recycling. Consequently, zeroth order
“recycling” is less capable of reducing contamination and therefore poses a
considerable health risk. For example, 45% of limonene and 31% of myrcene have
been removed from PET bottles by zeroth order recycling (Nielson 1994). In contrast
over 99% of model contaminants were removed from PET by secondary recycling
(Komolprasert and Lawson 1995, Franz et al. 1998).
2.3.2.2 Primary recycling
Primary recycling involves the physical reprocessing of industrial plant shavings and
off-cuts that have never had consumer exposure. Since they have not had consumer
exposure, they are unlikely to suffer from post-manufacture misuse and therefore have
a quality similar to that of virgin PET.
2.3.2.3 Physical reprocessing: Secondary recycling
Secondary recycling involves shredding the post-consumer polymer into flake, which
is then washed, dried and melted under vacuum before the polymer is reformed. Note
that the chemical structure of the polymer is not destroyed in this process. Secondary
recycling is more refining than zeroth order recycling and has greater economic
31

Chapter 2
incentive than tertiary recycling. Hence it is the most common form of recycling for
food contact purposes.
The Visy process
Visy Plastics has developed a novel, patented process for recycling PET. The Visy
secondary recycling process involves the following steps in sequence:
• The removal of outside contamination by tumbling the incoming bottles in hot
water (90-100°C) with cleaning agents (caustic soda and detergent) for a
typical time of 5 minutes. Further tumbling in a cylinder drains the water
containing dirt, contamination and labels.
• The use of molecular sensors to detect the presence of specific plastics.
Plastics such as PVC, HDPE, PP and PS are ejected after being detected by X-
ray absorption or infrared absorption.
• The grinding and intense washing of PET bottles. This involves grinding the
PET against rotating knives and a cutting screen in warm water (10-40°C)
containing caustic soda, surfactants and antifoaming additives. The flake is
then fed into the hot wash reactors, where it is washed in caustic detergent-
containing water for 10 – 20 minutes at 75-90°C.
• The sink-float separation of PP and PE from PET based on their differences in
density relative to water.
• The drying of the rinsed flake at 140-185°C in an atmosphere of flowing gas
for 5-8 hours.
• Melting and vacuum decontamination (extrusion).
• Subjecting the amorphous pellets to solid-state condensation to further
improve its purity for use in food-grade applications.
This process has been shown to result in "safe" PET suitable for recycle as a food
contact container. As a result, recycled PET is now included as raw feed stock in the
manufacture of food contact containers such as soft drink bottles. It is worth noting
that this use of secondary recycled PET coincided with the initial stages of this thesis.
32

Chapter 2
2.3.2.4 Tertiary recycling
Although tertiary recycling (also known as chemical reprocessing) is the best form of
recycling in terms of decontamination, it is seldom applied due to the process’ high
expense. Tertiary recycling involves destroying the polymer structure by
depolymerisation and regenerating monomers or oligomers, which are subsequently
purified via vacuum distillation and polymerised to regenerate the recycled PET resin.
The depolymerisation processes by hydrolysis, methanolysis, glycolysis and diolysis
remove any contaminants bound to the polymer chain. Figure (2.11) summarises the
main chemolysis reactions used in tertiary recycling (Scheirs 1998).
Figure 2.11: Chemolysis reactions used in tertiary recycling.
Glycolysis Methanolysis Hydrolysis
G H2O
+
Low MW
2.3.3 Recycled
There have b
manufacturers
food containers
manufacture in
combination o
Companies are
E
T
polyols E
PET for food contact pu
een two main reasons
to increase their market
. The first is simple e
creases and the cost
f the legislative, altru
more and more expected
MeOH
T A
BHE DM+ G
rposes
for an increase i
-share of secondary
conomics as, with ti
of recycling decre
istic, and consum
to undertake the "cr
TP
n
re
me
as
er
ad
+
EG
interest on behalf of
cycled PET for use as
, the cost of monomer
es. The second is a
pressures to recycle.
le to grave" philosophy
33

Chapter 2
of manufacture where the company is responsible for the ultimate fate of the product
(waste plastic). However, the recycling of plastics for food-contact purposes has
raised its own concerns regarding the contamination of food by foreign and unwanted
substances that may migrate from these plastic into the food.
The presence of such migratory contaminants in recycled PET could arise from
sorption during the initial use of the plastic and/or consumer misuse/reuse. Of less
current interest, but potentially even more serious, is the potential for recycled or
reused PET containers to pose a public health threat due to microbial contamination
(Devlieghere and Huyebaert, 1997).
2.3.3.1 Consumer misuse/reuse
PET containers such as soft drink bottles are often re-used by the consumer for storing
substances like pesticides, herbicides, automotive fuels, household chemicals and
industrial chemicals (5,27,91,94, 99)??. The chemical constituents of these substances
may sorb into PET bottles and consequently pose a health risk after the containers are
recycled and used for food purposes.
Although a potential exists for the consumer to contaminate the plastic bottle with
household and garden chemicals, in practice this happens rarely. In fact, it is
estimated that contamination from consumer misuse is as low as 1 bottle per 10,000
(Bayer 1997). Furthermore, the degree of sorption for any given contaminant depends
on the nature of that contaminant, as discussed in Section 2.2.3, is rarely higher than
5-10% and often as low as 0.1% (Bayer 1997). Fortunately, PET has the advantage of
having a relatively low diffusivity (Franz et al. 1998). This property of PET acts as a
double safety factor, not allowing a high degree of sorption whilst also not allowing a
high degree of migration of the contaminant into food.
Due to the dilution effect in the plastic bottle feed stream, contaminants in post-
consumer PET are not expected to arise from consumer misuse but more likely from
the original contents of the bottle.
Nonetheless, it can be argued that any such contamination is highly problematic to
secondary recycling (as opposed to simple reuse) since it might contaminate the entire
batch of recycled plastic and therefore pose a threat to a large number of consumers.
34
Chapter 2
2.3.3.2 Sorption from the original contents of the bottle
As indicated in former studies (253,256,260 [make sure you remember to change the
form of the references here]), contaminants in recycled plastic do not only arise from
consumer negligence. Other forms of contamination derive from the environment
[e.g. contamination of LDPE milk bottles by naphthalene in air (Lau and Wong
1994)] as well as the original contents of the plastic containers. For example, many
chemicals present in personal hygiene products, cleaning agents and foods and
beverages could also sorb into PET plastic. Not only do such components pose a
health risk, they could also influence the organoleptic properties of the re-filled
foodstuffs (Jetten et al. 1999). Greater than 99% of the Visy recycling stream
comprises of carbonated soft drink bottles, fruit juice and vegetable oil bottles and
less than 0.9% of the total stream derives from non-food bottles such as mouth wash,
shampoo and detergent bottles. Since the amount of bottles used for household
solvents and cleaners represent only 0.1% of all bottles, the majority of contaminants
are likely to result from food, although of course these contaminants are less likely to
provide a serious health risk compared with any which do arise from the non-food
bottles
Huber and Franz (1997) have used a dissolution approach to extract limonene at 3-
ppm levels from recycled PET. In the same study, Soxhlet extraction was used to
extract limonene from HDPE, PP, and PS at levels higher than in PET. All extracts
were analysed and quantified by GC/MS and the polymers were additionally
subjected to odour analysis. It was found that for direct food contact use these
materials would not be in compliance with the food law.
Franz and Welle (1999b) extracted volatile compounds from washed and dried flake,
intended for extrusion, by static headspace GC/FID. Limonene and acetaldehyde
were quantitatively evaluated and found to exceed the threshold of regulation (see
section 2.3.4) suggesting that the washed and dried PET was not suitable for food
contact applications. The levels of limonene in the treated PET ranged from 1.5 ppm
to 11.0 ppm.
35

Chapter 2
Bayer (2002) used headspace and total dissolution to extract a total of 121 different
compounds from five different post-consumer PET feed-streams, each containing
different proportions of food containers and non-food containers. Since some of the
compounds could be traced back to the original contents of specific containers, the
relative amounts of food containers and non-food containers in each of the feed-
streams could be ascertained. The concentrations of compounds present above a
certain integrated count were determined in two feed-streams after the commercial
washing process. Limonene, present at 18 ppm, was the predominant contaminant in
the “deposit” feed-stream (100% beverage bottles). Methyl salicylate, present at 15.3
ppm, was the predominant contaminant “food-grade" PET used in non-food
applications (100% non-food containers such as mouthwash, detergents, cleaners).
Both of these compounds could be traced back to the original use of the container -
soft drink and mouthwash respectively. With the maximum total concentration of
contaminants in washed PET at ~40 ppm, the author concluded that regardless of the
source of the feed-stream, this PET could be re-used in food contact applications.
Triantafyllou et al. (2002) used total dissolution and solvent extraction to extract
potential migrants from recycled PET. The contaminants identified by GC/MS were
mainly soft drink flavourings such as limonene, γ-terpinene and p-cymene, originating
from the initial use of the packaging. The levels of limonene, the predominant
species, in washed and dried PET flake ranged between 2.5 and 15 ppm. After solid
state post-condensation, there were no detectable amounts of limonene or other
potential migrants detected in the PET, emphasising the efficiency of the recycling
process.
Another polymer, which is recycled and widely used for food contact purposes, is
HDPE. However, HDPE is likely to contain a higher level of contaminants than PET
since it has lower barrier properties. Therefore the efficiency of the recycling process
in terms of decontaminating HDPE is very important if the recycled PET is to be used
for food contact purposes. The decontamination of HDPE represents the worst-case
36

Chapter 2
scenario relative to the cleansing of PET, since the latter is renown for having lower
sorption character compared with HDPE.
There have been numerous studies focussing on the extraction of contaminants from
recycled HDPE. Recycled (caustic washed and steam/air stripped) HDPE milk bottles
have been evaluated for food applications after Soxhlet extraction with
dichloromethane and GC-FID analysis (Devlieghere et al. 1998). In addition, global
and specific migration tests into aqueous and fatty food simulants have been
performed (Devlieghere et al. 1998). The major compounds identified in the treated
HDPE were characterised by an even number of carbon atoms (C12 to C22), which
were presumed to derive from an incomplete polymerisation reaction. Oxidised
hydrocarbons, possibly produced during the pelletization process, were also
identified. As a result of the similarities in migration levels and extraction
chromatograms between virgin HDPE and steam stripped HDPE the recycled PET
was considered comparable to the virgin material. Oxidised hydrocarbons are known
to be odour responsible; therefore their screening in polymers is practised (Ezquerro
et al. 2002, Hakkarainen et al. 1997)
In another study performed by Huber and Franz (1997), contaminants in recycled
(ground, washed and extruded) HDPE produced from household waste were extracted
by Soxhlet extraction with dichloromethane and analysed by GC/MS. Most of the
compounds identified originated from personal hygiene products and cleaning agents,
foods and beverages, and residues from other polymers. Examples of compounds
extracted include limonene and hexanal (aroma compounds), esters of myristic and
palmitic acids (compounds for personal hygiene and cosmetic products), toluene
(industrial cleaning agent or solvent) and hexyl salicylate (preservative).
The highest concentrations were identified for limonene, di(ethylhexyl) phthalate
(additive or residue from other polymers) and the isopropyl ester of myristic and
palmitic acids, present at concentrations between 50-200 ppm. Many of the aroma
and preservative compounds were detected at levels between 0.5 ppm and 10 ppm.
Due to the high content of contaminants, it is argued that recycled HDPE should only
be used as packaging for non-food products.
37
Chapter 2
Camacho and Karlsson (2001) determined the quality of recycled HDPE and PP by
GC-MS after microwave-assisted extraction. Examples of fragrance and flavour
compounds extracted include limonene, 3-carene and betamyrcene. Other compounds
identified were from the following groups of compounds: carboxylic acids, aromatic
hydrocarbons, aliphatic hydrocarbons, esters, alcohols and ketones. Many of the
substances identified rose from personal hygiene products, cleaning agents, foods and
beverages. Some compounds were identified in the virgin polyolefins as well as in
the recycled polyolefins (e.g. aliphatic and aromatic hydrocarbons).
The similarity of contaminants found in post-consumer PET compared to post-
consumer HDPE and the relationship between these contaminants and the original
ingredients of the bottle gives confidence to the assumption that most contaminants
arise from the "normal" use of plastic bottles and not consumer mis-use.
2.3.4 Threshold of regulation
In order to insure that contaminants in recycled PET are unlikely to induce toxic
effects, the FDA has considered toxicity data from a large range of compounds, from
which it has established a threshold level for contaminants in PET. The threshold
level is that which, after the inclusion of a 200 to 2,000-fold safety factor, might result
in a toxic effect. Compliance with the “threshold of regulation” effectively means
that contaminants in the container do not exceed a dietary concentration of 0.5 µg/kg
(0.5 ppb) when contacted with food (Begley 1997).
An estimate of the exposure of a contaminant in the diet requires a combination of
migration amounts (Mi) with food type distribution factors (ft) and the fraction of the
daily diet expected to contact specific packaging materials (consumption factors, CF).
The food type distribution factors represent the fraction of all food that is aqueous,
acidic, alcoholic and fatty. The concentration of the migrant in each type of food is
obtained by multiplying the individual ft value by the measured amount of migration
(Mi) in food type i. Multiplying the sum of the concentration of migrant in each type
of food by CF gives the concentration of the migrant in the total diet (Equation 2.7)
(Begley 1997). 4
Dietary Concentration = CF ×
(Mi × ft) Equation 2.7 1
Σi=
38

Chapter 2
From Equation 2.7, the maximum migration values that will produce a dietary
concentration of 0.5 ppb were calculated for PET, PS, PVC, HDPE, PP, LDPE and
PC (Table 2.4). Table 2.4 also lists the threshold values for the maximum permitted
contaminant concentration in the polymer, determined from the calculated maximum
migration amounts, assuming 100% migration and that 1 in2 polymer contacts 10 g of
food. A further assumption was that the mass-to-surface area ratio for PET is 460 mg/
in2.
10 ppb migration into food = 10 ng/g of food
=100 ng/10g of food
= 100 ng/ in2 of packaging
= 100 ng/460 mg of packaging
≈ 215 ng/g of packaging
Subsequently, if 215 ppb of contaminant were present in the PET container and if it
totally migrated into food, the concentration of the contaminant in the daily diet
would be 0.5 ppb. Therefore, to ensure safety from induce toxic effects, the level of
specific contaminants in PET should not exceed 215 ppb.
Table 2.4: Threshold values for the maximum permitted contaminant concentration in
polymers and food simulant.
Polymer Maximum
concentration in the
polymer (ppb)
Maximum migration
amount (ppb)
Polyethylene terephthalate (PET) 215 10
Polystyrene (PS) 180 6
Polyvinyl chloride (PVC) 90 5
High density polyethylene (HDPE) 123 4
Polypropylene (PP) 778 25
Low density polyethylene (LDPE) 92 3
Polycarbonate (PC) 256 10
39

Chapter 2
2.3.5 Validation of recycling process – the challenge test
2.3.5.1 Introduction
In Australia, the US FDA regulation for food-packaging safety is accepted. For PET
to be suitable for direct food contact applications, the FDA requests that the cleaning
efficiency of the recycling process be such that a maximum of 215 ppb of
contaminant remains in recycled PET and/or a maximum of 10 ppb migrates into the
food simulant (Begley 1997, Komolprasert et al. 1997).
Since the levels and types of contaminants can vary significantly from batch to batch
the US FDA does not rely on analysis of "real life" contaminants in PET. Rather,
they require a "challenge" test. This test involves deliberately contaminating PET
with model contaminants (“surrogates”) at exaggerated levels to simulate worst-case
consumer misuse, subjecting the contaminated PET to the proposed recycling process
and examining the cleansing efficiency of various recycling stages (US FDA 1992).
The surrogates are chosen such that they represent five general categories of
compounds (volatile and non-polar; volatile and polar; non-volatile and non-polar;
non-volatile and polar; metallic/organometallic), as well as range of functional groups
and molecular weights, in order to model all the different chemical and physical
properties of real-life contaminants (Franz and Welle 1997, US FDA 1992, Begley
1997, Jetten et al. 1999, Komolprasert and Lawson 1995).
As an example, the surrogates used in a challenge test performed by Franz and Welle
(1999a) are listed in Table 2.5. These surrogates correspond to the recommendations
of the FDA document “Points to consider for the Use of Recycled Plastics in Food
Packaging” (US FDA 1992). Model contaminants used in other challenge tests were
components of household pesticides such as malathion and diazinon (Komolpraset et
al. 1995), lindane, chloroform, 1,1,1-trichloroethane, 1-octadecanol, squalene, copper
(II)-2-ethylhexanoate and zinc stearate (Scheirs 1998, Franz et al. 1998, Komolprasert
and Lawson 1997, Bayer 1997).
40

Chapter 2
Table 2.5: Surrogates used in a challenge test performed by Franz and Welle (1999a).
Surrogate name Molecular
weight
Functional group Properties
Acetone 58.1 aliphatic ketone volatile, polar,
water soluble
Toluene 92.1 aromatic hydrocarbon volatile, non-polar
Chlorobenzene 112.6 halogenated aromatic
hydrocarbon
volatile, medium-
polar, very
aggressive to PET
phenylcyclohexane 160.3 aromatic hydrocarbon non-volatile, non-
polar
benzophenone 182.2 aromatic ketone non-volatile, polar
methyl stearate 298.5 aliphatic ester non-volatile, polar
2.3.5.2 Challenge test process
The challenge test process involves soaking the plastic (bottles or flake) in a cocktail
of surrogates for 2 week at 40°C. The mixture is then drained and the polymer is
subjected to the recycling process. The challenge test presents a worst-case scenario
because:
• 100% of the polymer is contaminated in the challenge test, whereas normally
0.01% (1 in 10,000) of misused bottles and 0.1% of household solvent/cleaner
bottles enter the recycling stream. Thus a safety factor of 10,000 and 1,000,
respectively, is incorporated.
• The challenge test solutions are more concentrated than any likely commercial
solution (source of contamination in the "real" world), a factor of 10 times the
anticipated strength.
2.3.5.3 Challenge test studies
A range of challenge tests has been performed in the area of zeroth order recycling
(bottle reuse) and secondary recycling (physical reprocessing). The challenge tests
41

Chapter 2
carried out in the area of zeroth order recycling mainly involve optimisation of the
washing procedure whilst those in the area of secondary recycling involve the
assessment of every recycling stage in terms decontamination. The efficiency of
secondary recycling with respect to decontamination is generally superior to zero
order recycling as evidence by the level of contaminants migrating into simulants
from “reused” bottles exceeded the 10 ppb migration threshold. Conversely,
migration from reprocessed PET bottles often does not exceed the migration threshold
(Cross et al. unpublished).
Refillable plastic bottles
Feron et al. (1994) contaminated refillable PET soft drink bottles with 62 test
substances and passed the bottles through sanitization by washing. Studies on the
migration of these contaminants into simulated soft drink were performed and it was
concluded, after a detailed hazard assessment, that none of the tested substances
migrated into the simulant at levels that would pose a health concern. The hazard
assessment involved comparing the Acceptable Daily Intakes (ADIs), set by the Joint
FAO/WHO Committee on Pesticide Residues, with the “maximum potential
exposure” (MPE) calculated from the amount migrated per bottle. Comparisons of
the MPEs with the estimated non-toxic doses (ENTDs) were also made during the
hazard assessment.
Nielson (1994) studied the effects of different washing procedures on the removal of
orange flavour components (myrcene and limonene) from PET bottles. In order to
study the effects of caustic soda concentration and temperature on decontamination,
the different washing conditions considered were:
• 1.5% NaOH solution, 60°C, 15 minutes.
• 3% NaOH solution, 60°C, 15 minutes.
• 1.5% NaOH solution, 70°C, 15 minutes.
It was found in this study that about 32% of the myrcene and 22% of the limonene
sorbed into the PET bottles were removed at 60°C at both caustic concentrations
(1.5% and 3% NaOH). Increasing the temperature by 10°C caused a further 13% and
42

Chapter 2
11% removal of myrcene and limonene respectively (i.e. a total of 45% of myrcene
and 31% of limonene were removed), again for both caustic concentrations. It was
therefore concluded that temperature plays a vital role in cleaning whilst the
concentration of caustic soda (given that it was fairly concentrated in the first place)
does not. Even so, the final concentrations of myrcene and limonene were very high
and the washed bottles were deemed inappropriate for refilling. In addition, it was
discovered that washing virgin PET bottles prior to filling decreased the level of the
flavour components sorbed, possibly due to the increase in crystallinity with washing.
Devlieghere et al. (1997) examined bottle wash processes in removing limonene and
chloroxylenol from PET and other polymers. The effect of temperature, caustic soda
and commercial additive concentration was determined. The residual contamination
after washing was determined by means of migration into a beverage simulant. It was
shown that caustic soda concentration and temperature had the greatest effect on
decontamination. In general, higher temperatures resulted in higher decontamination.
However above 75°C, and at high caustic concentration, the cleaning effectiveness
declined. For PET, the optimal washing conditions were 70°C and 2-2.8% (w/v)
NaOH. Washing the bottles prior to filling had no effect on the amount of surrogate
absorbed.
The levels of limonene and chloroxylenol migrating were high above the 10 ppb limit
set by the FDA; therefore the washed bottles would not be suitable for refill.
Komolprasert and Lawson (1997) simulated contamination of PET bottles with
various model contaminants (benzene, butyric acid, lindane and malathion) and
determined the effects of washing on their removal.
The results were that 26 - 49% of surrogates were removed after washing at 74ºC and
then drying with an IR lamp. Since the levels of the contaminants remaining (29 -818
ppm) exceeded the 215 ppb threshold, their migration into 8% aqueous ethanol was
also determined. The migrating levels of benzene (2000 ppb) and butyric acid (260
ppb) after 10 days at 49ºC exceeded the 10 ppb threshold.
43

Chapter 2
Secondary recycled plastic bottles
Komolprasert and Lawson (1995) intentionally contaminated PET chips and bottles
with benzene, tetracosane, lindane, butyric acid, malathion and copper (II) 2-
ethylhexanoate. In order to evaluate the efficiency of decontamination, the
contaminated chips were washed at 90°C with aqueous 4% NaOH and subsequently
dried for 4 hours at 160-170°C prior to extraction and analysis using chromatographic
or spectroscopic techniques. Such high temperatures are not used during zeroth order
recycling and might be expected to result in higher efficiencies of removal.
It was found that washing alone (without the addition of NaOH) removed 14 - 91% of
surrogates from the chips and 26 - 99% of surrogates from the bottles. Tetracosane
was the easiest to remove, whilst benzene was the most resistant to cleaning. It was
assumed that during sorption, the non-polar, non-volatile tetracosane remained on the
surface of PET whilst the non-polar, volatile benzene diffused into the PET, making it
less accessible to cleaning.
The addition of NaOH further increased the cleaning efficiency of the PET chips to 30
- 91%. However, caustic soda had no effect on reducing the level of tetracosane
removal from PET; its percentage removal remained at 91%. The combination of
washing and drying removed more than 99% of organic surrogates from the polymer
chips. Despite the high percentage removal, some contaminants exceeded the 215
ppb threshold (e.g. benzene 6.2 ppm, butyric acid 0.27 ppm, malathion 120 ppm).
Therefore, additional recycling steps (e.g. extrusion, solid-phase condensation) and
migration studies should be performed to further purify the polymer and determine
whether it is suitable for food contact use.
In another study, Komolprasert et al. (1997) deliberately contaminated PET chips
with benzene, butyric acid, dodecanoic acid, dodecane, octadecane, tetracosane,
diazinon, lindane, and copper (II) ethyl hexanoate. The contaminated polymer was
passed through the recycling process. The levels of contaminants in PET exceeded
the FDA threshold after extrusion. However, the level of the contaminant migrating
into heptane and 8% ethanol was below the 10 ppb threshold.
Franz et al. (1998) performed a further challenge test involving the deliberate
contamination of PET with surrogates at different concentration levels. The
44

Chapter 2
contaminated polymer was passed through the extrusion and solid phase condensing
stages of the recycling process. The latter stage involved the use of a 12-hour high
vacuum and temperature program. Efficient removal of the volatile compounds (e.g.
toluene and chlorobenzene) by extrusion was observed. Solid-phase condensation
further reduced the amounts of these contaminants to undetectable levels.
The removal of non-volatile compounds (e.g. phenyl cyclohexane, benzophenone,
octadecanol and methyl stearate) was less efficient. Residual levels were as high as
25 – 50% for these surrogates after extrusion. The subsequent condensation step
reduced these levels to 2 - 4% for all non-volatile compounds except benzophenone,
which had the highest residual level of 8%. Benzophenone has a similar solubility
parameter to PET, therefore is the most persistent to remove (Harding et al.
unpublished). The introduction of a wash and dry stage before feeding the
contaminated flake into the extruder results in an overall efficiency of more than 99%
for all surrogates, including benzophenone. Despite the high percent removal, the
levels of residual model contaminants exceeded the 215 ppb threshold due to the high
initial level of contamination. However, the authors concluded that since the real life
contamination levels fall in the low ppm range, the recycled material would
theoretically not exceed the threshold of regulation and thus be suitable for food
contact applications.
Franz and Welle (1999a) performed a challenge test study, whereby extraction and
migration experiments confirmed the suitability of the recycled PET material for all
types of foodstuffs. The flake, contaminated with six model contaminants (acetone,
toluene, chlorobenzene, phenylcyclohexane, benzophenone, methyl stearate), was
passed through four steps of the recycling process (washing, drying, re-extrusion and
solid-state polycondensation). Extraction was accomplished by total dissolution
whilst specific migration was measured into 95% ethanol, 10% ethanol and 3% acetic
acid. The extraction experiments showed that the removal of volatile compounds
such as acetone, toluene and chlorobenzene was more than 99.9% complete after the
dry stage of the recycling process. Phenylcyclohexane, which is non-volatile and
non-polar, exhibited the same degree of cleansing, but only after extrusion.
Benzophenone and methyl stearate, which are polar and non-volatile, were the most
challenging surrogates. After extrusion, the levels of benzophenone and methyl
45

Chapter 2
stearate remaining in the polymer were 1.46 ppm and 0.15 ppm respectively. These
levels decreased to 0.987 ppm for benzophenone and 0.069 ppm for methyl stearate
after bottle formation.
All compounds, other than benzophenone, fell below the 215 ppb threshold after the
extrusion step. The level of benzophenone exceeded the 215 ppb threshold even after
bottle formation. Fortunately, migration experiments demonstrated that the levels of
migration for all compounds, including benzophenone, fell below the 10 ppb FDA
threshold. Therefore, the FDA considered the recycled PET bottles suitable for food
contact use.
Of direct interest to this thesis is the Visy recycling process, which has also proven
efficient in the cleaning of surrogate compounds out of deliberately contaminated
PET intended for soft drink use. The polymer was passed through the recycling
process and analysed for residual contaminants after each cleansing stage. The
process, which included washing, drying and extrusion (with vacuum
decontamination), was found to be capable of removing from 95 – 99.7% of the
contamination. However, the level of contaminants in the recycled bottles again
exceeded the FDA threshold of 215 ppb, with benzophenone the most challenging
compound (20 ppm of benzophenone was present after bottle formation).
Fortunately, the level migrating into 10% ethanol fell below the 10 ppb threshold.
This final result made the recycled bottles suitable for soft drink applications, given
that the FDA is less concerned with the level of contaminant in the container than it is
with the amount migrating into food.
2.3.6 Estimated level of real contaminants in recycled PET
From the challenge test results obtained for the Visy recycling process and the
assumption that the challenge test included a safety factor 10,000, the realistic level of
contaminants (from consumer misuse) after each stage of the Visy recycling process
can be estimated, assuming the realistic levels in the treated polymer are 10,000 times
lower than the levels determined by the challenge test. The results for this estimation
(in ppb) are shown in Table 2.6. From this table the realistic levels of contaminants
resulting from consumer misuse in the recycled bottles do not exceed 2.0 ppb, which
is well within the threshold limit of 215 ppb.
46

Chapter 2
The number of bottles resulting from household solvent/cleaners is ten times the
number resulting from consumer misuse (1 bottle in 1000 bottles), therefore the levels
of contaminants in the recycled PET bottle resulting from non-food contact
applications is predicted not to surpass 20 ppb. This is further reduced to 2 ppb when
the exaggerated user strength factor of 10 is taken into account.
Table 2.6: The estimated level of contaminants in PET after each recycling stage.
Contaminant
Level of
contaminant in unwashed
PET flake (ppb)
Level of
contaminant in washed PET flake
(ppb)
Level of
contaminant after
extrusion (ppb)
Level of
contaminant after moulding
into bottles (ppb)
Chloroform 61.3 5.2
0.5 0.2
Toluene 176.8 36.1 < 0.5 < 0.5
Benzophenone 71.3 17.5 3.6 2.0
Methyl stearate
8.1 1.6 < 0.5 < 0.5
Copper octanoate
23.0 0.8 0.4 0.4
2.3.7 Methods of reducing contamination
Strategies to lower the amount of contaminant migration include blending the
recycled polymer with virgin resin or including a functional barrier in the bottle
structure. The latter involves inserting the post-consumer recycled material between
two layers of virgin resin. Thus there is a virgin polymer barrier between the food
and the recycled resin, whose presence will delay the migration of contaminants from
the recycled layer.
In Australia, Coca-Cola Amatil manufactures beverage bottles with 25% recycled
content whilst ACI Petalite manufactures multilayer (functional barrier) beverage
bottles.
47

Chapter 2
2.3.7.1 Functional barrier
Any functional barrier must reduce the contaminant migration to an acceptable level
that would not endanger the consumer. The degree of migration (Mt) through a
functional barrier depends on the contaminant diffusion coefficient (D), the thickness
of the virgin layer (l), the concentration of contaminant in the recycled layer (C0) and
the time (t). Equation 2.9 describes migration through a functional barrier, however it
is too complex for practical use and a simplified equation (Equation 2.8) describing
migration through a virgin layer has been developed (Begley and Hollifield 1993,
Kuznesof and Van Derveer ??).
τ = Dt/l2 Equation 2.8
Mt = Dt/l2 – 1/6 – 2/π
It was calculated, using E
bi-layer migration, that w
perspective on the diffusio
food), the amount migrati
thereby indicating that th
Hollifield 1993).
Compared to the migratio
the amount migrating from
any given concentration o
in the case of bi-layer p
concentration of less tha
contaminant in the recycle
layer packaging, the co
Alternatively, if the conce
µg/cm3, the migration lev
the bi-layer package.
Mitz et al. (1997) further
deliberately contaminated
∞
2 Σ (-1n/n2) exp (-n2π2Dt/l2) C0 l Equation 2.9quation 2.3 for monolayer migration and Equation 2.9 for
hen τ > 0.6 (τ is a unitless variable that provides a
n rate for a contaminant through the functional barrier into
ng begins to approximate that of the monolayer packaging
e functional layer has no barrier properties (Begley and
n=1
n level calculated from the monolayer migration equation,
a bi-layer package was calculated to be much smaller for
f contaminant in the recycled polymer layer. For example,
ackaging (for τ = 0.15), in order to obtain a migration
n 10 ppb in the food, the maximum concentration of
d PET must not exceed 100 µg/cm3. In contrast, for mono-
ntaminant concentration must not surpass 7.5 µg/cm3.
ntration of contaminant in a single-layer package were 100
el would be 130 ppb compared to the 10 ppb obtained for
observed that migration of the surrogate, toluene, from a
film was two orders of magnitude larger than that migrating
48

Chapter 2
from a multilayer packaging containing the same amount of surrogate in the centre
layer.
Begley and Hollifield (1995) studied the migration of diethylene glycol dibenzoate
(DEGDB) from spiked paperboard through a virgin PET layer into oil. The oil was
analysed with time and a graph of the amount of DEGDB migrated versus time was
plotted. The “lag-time” technique was used to calculate the diffusion coefficient.
This involved determining the lag-time from the plot of “amount migrated versus
time” and substituting the value into Equation 2.10 to calculate the diffusion
coefficient.
Lag time = l 2 /6D Equation 2.10
The calculated diffusion coefficient was entered into Equation 2.9, along with the
contaminant concentration in the recycled layer (C0), the time and various virgin layer
thicknesses, in order to calculate the amount migrating for different thicknesses of
virgin layer. It was found that for the migration of DEGDB not to exceed the FDA
threshold of 10 ppb in 1 hour, the thickness of the virgin layer must surpass 3 mm
when the initial concentration in the recycled resin is 10 ppm and the temperature is
150°C.
The above examples illustrate that equations 2.8, 2.8 and 2.10 can be used to estimate
the minimum thickness or the minimum percentage of a virgin functional barrier
required to give a safe product. Although this optimises expense on the part of the
manufacture, it is always more expensive to use a functional layer than not to. For
this reason, interest should also be applied to economical methods of cleaning
recycled PET such that it meets the requirements of a food contact product. Emphasis
also needs to be placed on the level of contaminants present in real examples of
recycled PET and methods for determining such.
2.4 EXTRACTION AND ANALYSIS OF POLYMERS
49

Chapter 2
2.4.1 Modes of extraction
The first step to the analysis of components in PET involves an extraction facilitated
by solvent strength, supercritical fluid state and/or temperature. Plastic samples have
been traditionally solvent extracted using Soxhlet extraction (Huber and Franz 1997a,
Costley et al. 1997, Kim et al. 1990), sonication (Pochivalov 2000, Nerin et al. 1998),
boiling under reflux (Vandenberg 1997) or total dissolution (Komolprasert and
Lawson 1997, Franz and Huber 1997, Nerin et al. 2000, Franz and Welle 1999a).
These techniques are either time consuming, use large quantities of solvents and/or,
due to the requirement of a post-extraction concentration step, are only applicable to
the analysis of semivolatile compounds. The desire to reduce extraction time and
solvent volume has triggered the development of automated extraction techniques.
These are microwave-assisted extraction (MAE) (Camacho and Karlsson 2001,
Costley et al. 1997), accelerated solvent extraction (ASE) (Vandenburg et al. 1997,
Lou et al. 1997) and supercritical fluid extraction (SFE) (Bartle et al. 1990, Lou et al.
1996, Nerin et al. 2000). Although very expensive in terms of equipment, these
techniques decrease analysis time and are less "man-power" intensive. They increase
the diffusion of analytes from the polymer matrix into the extraction fluid by using
several complementary kinetic parameters, including temperature, pressure and
suitable polymer-swelling solvents. By heating the sample in a closed system at
elevated pressures, the extractant and volatile components are not lost during the
automated extraction. Subsequent analysis is thus more reliable than non-automated
extractions. Furthermore, when extracting polymers in the traditional way, additional
headspace techniques are necessary to account for the omitted volatile components.
Examples of headspace methods applied in the polymer industry are static (Dong et
al. 1980, Komoprasert and Lawson 1995, Hakkarainen et al. 1997, Paik 1992) and
dynamic headspace (Komoprasert et al. 2001, Komoprasert et al. 1994, Bayer 2002),
solid phase microextraction (SPME) (Bart 2001, Hakkarainen et al. 1997) and thermal
desorption analysis (TDA) (Komolprasert et al. 2001, Bayer 2002).
Another advantage of automated techniques over the long-established traditional
extractions is that large volumes of solvent are unnecessary. Apart from the economic
advantage this provides, there are also advantages in terms of toxicology and that the
concentration of organic interferences from solvent impurities in the extract is
reduced.
50

Chapter 2
Despite these advantages of techniques, the conventional approach is often viewed to
be more attractive in terms of equipment availability/pricing and for the analysis of
thermolabile compounds (Camacho and Karlsson 2001, Eskilsson and Björklund
2000). Another disadvantage of the automated methods is that the PET particles can
fuse or collapse at temperatures > 125ºC whilst undergoing a swelling effect with the
solvent. This behaviour, which impinges on polymer surface area, has been shown to
cause a decline in the extraction efficiency (Eskilsson and Björklund 2000,
Vandenburg et al. 1997, Lou et al. 1997).
2.4.2 Parameter optimisation
Each of the mentioned extraction techniques requires method validation in the quest
to optimise extraction. In the area of polymer extraction, the external parameters that
affect the degree of extraction are time, temperature, pressure, particle size, flow rate
and the nature of extraction solvent. Polymer and migrant properties affecting the
level of extraction are shape and size (Garde et al. 1998) as well as polymer
crystallinity (Spell and Eddy 1960) and glass transition temperature (St. Küppers
1992). These have already been discussed in terms of migration studies and the same
principles apply to efficiency of analysis:
2.4.2.1 Time
Extraction involves the mass transfer of analytes though the bulk polymer matrix into
the extracting solvent. The movement of compounds through the polymer into the
solvent takes time, depending on the migrant’s ability to diffuse.
The time required to reach a plateau concentration in the solvent is considered the
optimum because such a plateau is assumed to be due to reaching total extraction
(Feigenbaum et al. 2002).
Wim and Swarin (1975) monitored the Soxhlet extraction process with respect to time
for two additives from polypropylene pellets and concluded that a plateau was
reached by 24 hours (using tetrahydrofuran as the extracting solvent). Similarly,
Komolprasert et al. (2001) extracted PET sheets by Soxhlet using dichloromethane
for 24, 48, 72 and 96 hours, and concluded that the optimum extraction time was 24 h.
Shorter extraction times were not considered in that study.
51
Chapter 2
Kinetic extraction studies can be used to determine the diffusion coefficients during
extraction. Feigenbaum et al. (2002) determined the “effective” diffusion coefficient
for the solvent extraction of aromatic migrants out of different polymers using
Equation 2.3 and the plot of per cent migrated versus time. These values were
calculated for comparative purposes only, as they have no direct physical meaning.
The optimisation of polymer extraction with respect to time has been carried out
during heat-facilitated extractions such as SFE (Garde et al. 1998), ASE (Lou et al.
1997), MAE (Camacho and Karlsson 2000) and SPME (Ezquerro et al. 2002).
Temperature is a diffusion enhancing parameter, therefore extraction time is reduced,
compared with Soxhlet extraction, during high temperature extraction. However, it
was discovered that extraction yields decreased with time during MAE of MDPE
(middle density polyethylene) at high temperatures due to the thermal degradation of
the analyte (Camacho and Karlsson 2000). Therefore extended time periods during
high temperature extraction could prove to be unfavourable for thermolabile
compounds.
2.4.2.2 Temperature
The rate of diffusion follows an exponential Arrhenius form with temperature, where
rate ∝ A exp (-E/RT), as described in Section 2.2.3.5. This indicates that increasing
the temperature should exponentially increase the diffusion rate. Temperature also
increases the solubility of the solutes in the extractant and reduces their interaction
with the polymer surface (Lou et al. 1997).
The temperature of Soxhlet extraction is restricted to the boiling point of the
extracting solvent; therefore unless a high boiling point solvent is used, extraction can
be time consuming (Lou et al. 1997). Therefore high boiling point solvents such as
xylene and 1-methyl naphthalene have been used for the extraction of oligomers from
PET (Hudgins et al. 1978, Costley et al. 1997, Cooper and Semlyen 1973). Hudgins
et al. (1978) concluded that extraction in a “Parr Bomb” using chloroform was a more
efficient way of extracting oligomers out of PET than Soxhlet extraction with
chloroform or xylene. This is because chloroform, recognized as a PET swelling
solvent, was heated above its boiling point under high pressure.
52

Chapter 2
Similarly automated solvent extractions such as MAE, SFE and ASE are performed in
closed systems and often at high pressures, which allow the solvent to be heated well
above its normal boiling point without the loss of volatile analytes. Therefore, the
ideal solvent, which frequently has a low boiling point, can be used at high extraction
temperatures.
Lou et al. (1997) and Vanderburg et al. (1999) extracted polymeric samples by ASE.
It was postulated by Lou et al. (1997) that when diffusion is the rate-limiting step, as
opposed to solubility, the effects of temperature on the amount extracted are
prominent. Conversely, when solvent flow rate has a positive effect on extraction, the
extraction rates are controlled by solubility. The extraction of an additive
(caprolactam) from nylon-6 and oligomers from PBT [poly(1,4-butylene
terephthalate)] was monitored with increasing temperature and flow rate. Since the
amount extracted increased with temperature, but not with flow rate, it was argued
that the ASE extraction rate was controlled by diffusion as opposed to solubility.
Similarly, higher temperatures lead to higher extractions rates for SFE of polymers,
where solubility in the supercritical fluid is not rate limiting. However, increasing the
temperature decreases the density of the supercritical fluid, which inevitably makes
solubility the rate-limiting factor. Thus, extraction initially increases with
temperature until the supercritical fluid density decreases such that solubility becomes
rate limiting (Lou et al. 1996). The temperature at which the amount extracted starts
to decline depends on the properties of the analyte and the matrix as well as the
supercritical fluid pressure and flow rate (Lou et al. 1996).
St. Küppers (1992) observed a sharp increase in the amount of trimer oligomer
extracted from PET at the glass transition temperature. Diffusion at the Tg is
accelerated because this is the temperature when the polymer structure changes from
its rigid glassy form to a rubbery form, relieving the diffusion of analytes through the
matrix. However, St. Küppers (1992) also demonstrated that after the Tg has been
reached, the amount of trimer extracted began to stabilise indicating that extraction
has become solubility-limited. Higher pressures and the addition of modifier were
shown to increase amount of trimer extracted at high temperatures, probably due to
the enhanced solubility initiated by these two parameters.
53

Chapter 2
2.4.2.3 Pressure
Pressure has been shown to have a positive effect on the SFE of polymers, especially
when the extraction rate is solubility limited (e.g. at high temperatures), increasing the
supercritical fluid density, which in turn improves the solubility (St Küppers 1992,
Lou et al. 1996).
Increased pressure can also increase the degree of plasticisation of the polymer, thus
increasing diffusion and the extraction rate (Vandenberg et al. 1997). For example,
the swelling of nyon-6 and PBT caused by the high-pressured supercritical fluid, was
the reason for the absence of a sharp rise in extraction recovery at the Tg (Lou et al.
1996). This is because the pasticisation of polymers by CO2 lowers the Tg
(Vandenberg et al. 1997).
Daimon and Hirata (1991) performed the selective extraction of additives from PP by
adjusting pressure and temperature. The authors found that different additives could
be extracted at different temperatures and pressures, depending on the diffusivity and
solubility of the additive. Similarly, St Küppers (1992) selectively extracted
oligomers from the surface of PET fibres. The temperature and pressure was then
increased to further extract oligomers from the inner core of the polymer matrix.
2.4.2.4 Nature of extraction solvent
The nature of the solvent is usually chosen such that it interacts with the polymer,
thereby swelling it. However, swelling the polymer at high temperatures can be
detrimental to extraction efficiency because it can lead to the coalescence of the
ground polymer particles, reducing their surface area (Vandenburg et al. 1999). It is
also possible for the fused polymer to lose viscosity and block instrument transfer
lines.
Vandenburg et al. (1999) has designed an ASE method to prevent the coalescence of
polymer particles at high temperatures which makes use of the chemical capatability
between the polymer and solvent. Since the swelling of a polymer can be described in
terms of the Hildebrand solubility parameter similarity between the solvent and the
polymer (Table 2.7), the initial part of the method involves extracting the polymer at
high temperatures with a solvent whose solubility parameter differs from that of the
54

Chapter 2
polymer (i.e. a poor solvent for the polymer). The temperature at which maximum
extraction occurs without polymer coalescence is determined and used. A solvent
with a solubility parameter similar to that of the polymer is then added (in increments)
causing the polymer to swell and enhancing diffusion. An optimum amount of
swelling solvent was determined before the onset of coalescence.
Costey et al. (1997) had identified that dichloromethane, theoretically the best solvent
for PET, fused the polymer at 120°C. Therefore Vandenburg et al. (1999) first
optimised the extraction temperature using hexane, a poor solvent for PET, and then
added ethyl acetate, a good solvent for PET. It was found that significant swelling did
not occur at 190°C until 100% ethyl acetate was reached.
Due to the swelling capability of dichloromethane and chloroform towards PET, these
chlorinated solvents are often used in neat form during Soxhlet extraction/maceration
(Shiono 1979, Komolprasert et al. 2001, Triantafyllou et al. 2002) or as modifiers
during SFE (St Küppers 1992).
Modifiers in SFE are important for two reasons: (a) they can swell the polymer,
thereby enhancing diffusion and (b) they can increase the solvent strength of the
supercritical extractant thus increasing solubility (Lou et al. 1996).
The addition of dichloromethane (DCM) into the supercritical fluid has been shown to
have a positive effect on the solubility of cyclic trimer in the extractant at high
temperatures (St Küppers 1992). The sorption of DCM into the PET matrix caused
high oligomer extraction at low temperatures. Methanol and isopropyl alcohols, on
the other hand, were found to be poor modifiers for PET and completely prevented
extraction.
The effects of modifiers have also been studied during the SFE of other polymers
(Lou et al. 1996). It was found that the effects of modifiers on the extraction rate are
different depending on whether diffusion or solubility governs the extraction rate.
Modifiers were determined to be more effective at lower temperatures, when the
extraction rate is diffusion limited. At high temperatures, modifiers sometimes have a
negative effect on extraction. At low temperatures and in diffusion-limited situations,
the contact time between the polymer and the modifier is important because polymer
55

Chapter 2
swelling is a slow process. The modifier amount is another important factor in
diffusion and solubility limited situations.
Garde et al. (1998) optimised the extraction of antioxidants from PP. Two modifiers
were tested - hexane to swell the polymer and liberate the antioxidants and methanol
to increase the solubility of the antioxidants in the supercritical fluid at high
temperature.
Spell and Eddy (1960) emphasized the importance of the nature of the solvent during
the shake-flask extraction of additives from PE pellets. These authors found that 2.5
hours were required to recover the antioxidant Santanox [4,4-thio-bis(6-tert-m-
cresol)] using carbon disulfide whereas 76 hours was required to recover the
antioxidant using iso-octane. Similarly, Wims and Swarin (1975) extracted additives
from talc-filled PP using tetrahydrofuran (THF), chloroform and DCM. The most
efficient extraction solvent was THF. It gave complete recovery in 24 hours as
opposed to the 72 hours required using chloroform. Using DCM only 50% of the
additives were extracted in 24 hours. Lou et al. (1997) also observed the effects of
using different solvents when extracting compounds from nylon-6 and PBT.
Methanol for nylon-6 and chloroform for PBT were more efficient than hexane in
Soxhlet extraction. However, extraction with hexane was improved at elevated
temperatures, suggesting that a poor extraction solvent in a Soxhlet extraction could
be a good solvent in ASE at high temperatures, which facilitate diffusion.
The nature of solvents used during total dissolution extraction depends on the analytes
of interest. The extraction of non-polar compounds out of the PET matrix involves
dissolving the polymer in trifluoroacetic acid (TFA) and partitioning the liberated
analytes into hexane/heptane (Bayer 2001, Komolprasert and Lawson 1995). Polar
compounds are usually extracted by dissolving the PET in a mixture of
hexafluoroisopropanol (HFIP)/DCM followed by polymer precipitation with
methanol/acetone/isopropanol (Begley and Hollifield 1989, Triantafyllou et al. 2002,
Komolprasert et al. 1995). An alternative method for extracting polar compounds
involves dissolving PET in TFA and partitioning the liberated analytes into methyl
tertiarybutyl ether (MTBE) (Bayer 2001, Barnes et al. 1995).
56

Chapter 2
The advantage of dissolution and re-precipitation over liquid-solid extraction is that
(theoretically) no analyte remains bound in the polymer network. This is because the
solvent effectively breaks up the polymer matrix. Therefore optimisation of
diffusion-enhancing parameters is not necessary.
Table 2.7: Hildebrand solubility parameters for different solvents and polymers.
Material Solubility
parameter (Mpa1/2)
Material Solubility
parameter (Mpa1/2)
Hexane 14.9 Ethanol 26.0
Cyclohexane 16.8 Methanol 29.7
Ethyl acetate 18.6 Polypropylene 16.6
Chloroform 19.0 PVC 19.5
Dichloromethane 19.8 PET 20.5
Acetone 20.3 Nylon 6,6 28.0
2-Propanol 23.8 PMMA 19.0
2.4.2.5 Particle size
As mathematically demonstrated in Equation 2.11, the amount of analyte migrating
from a polymer into a solvent is inversely proportional to the path length (L), i.e.
Amount migrating ∝ D/L2 Equation 2.11
Therefore, a decrease in L causes an increase in the amount of analyte migration. In
order to reduce the path length for the mass transfer of analytes from the polymer core
to its surface, the particle size is generally reduced by cryogenic grinding or flattening
prior to extraction (Garde et al. 1998, Lou et al. 1997, Vandenburg et al. 1997, Bartle
et al. 1990, Hunt and Dowle 1991). In the area of polymer extraction, grinding is a
widely accepted sample preparation technique for path length reduction (Huber and
Franz 1997 a, b, Nielson 1991, Daimon and Hirata 1991). Another advantage of
grinding polymer samples is that it reduces the inhomogeneous distribution of
57

Chapter 2
analytes when small masses of samples are used (Daimon and Hirata 1991, Hunt and
Dowle 1991).
Work by Perlstein (1983) and Spell and Eddy (1960) demonstrated that powdering
PVC and PE pellets had a positive effect on Soxhlet and shake-flask extraction time
and recovery. In addition, Spell and Eddy (1960) found that extraction time required
for complete recovery was also affected by polymer density and crystallinity.
Garde et al. (1998) have presented the effect of decreasing path length on the SFE of
antioxidants from PP. These authors observed that, in general, as particle diameter
decreased, the extraction percentage increased. However, since extraction from films
was lower than that from powder, results were better correlated with surface to
volume ratio rather than directly to size. Ashraf-Khorassani et al. (1991) and Hunt
and Dowle (1991) also found that faster SFE of additives is obtained as the surface
area of the PE and PVC matrix increases.
2.4.2.6 Migrant shape/size
As Soxhlet extraction is mainly diffusion-limited, extraction recovery and time is
dependent on migrant size. This is because D ∝ M as shown in Equation 2.6. Apart
from molecular weight, migrant shape and interaction with the polymer could also
play a role towards its diffusion through the polymer matrix. It has been shown by
Spell and Eddy (1960) that during the solvent extraction of antioxidants out of PE,
diffusion of BHT was faster than that of Santonox possibly due to the larger MW of
the latter. Similarly, Perlstein (1983) found that for this reason Uvinul N-539 was
extracted more efficiently than Tinuvin 320 and Cyasorb UV-9 from PVC.
Garde et al. (1998) extracted antioxidants from PP by SFE and demonstrated that
differences in extraction recoveries were caused by the different diffusivity of each
antioxidant. The antioxidants that were the largest in size and/or had voluminous
groups were the slowest to diffuse through the PP matrix into the extraction fluid. An
increase in temperature could assist the diffusion of the larger compounds through the
PP matrix. Daimon and Hirata (1991) presented the effect of temperature on the
selective SFE of antioxidants out of PP.
58

Chapter 2
In addition, Daimon and Hirata (1991) showed that, in SFE, antioxidant size could
impinge on solubility, which in turn could affect the amount extracted. Therefore, the
pressure of the supercritical fluid must rise in order to increase solubility and thus
facilitate the extraction of the larger, less soluble compounds. The manipulation of
pressure and temperature in extracting antioxidants of interest underlines the high
selectivity of SFE.
Similarly, Lou et al. (1996) showed the effect of oligomer size on solubility during
the SFE of dimer and trimer from PBT. It was found that the amount of the dimer
extracted was the highest at 150°C and for the trimer at 110°C. Therefore, the
extraction of the larger and less-soluble trimer becomes solubility-limited at a lower
temperature (i.e. when the density of the supercritical fluid is higher).
2.4.3 Modes of separation and analysis
Once the polymer is solvent extracted, the extract is generally concentrated by solvent
evaporation prior to instrumental separation and analysis.
The most common instrumental forms of extract separation and analysis are
HPLC/UV and GC/MS.
HPLC is used in the analysis of non-volatile, polar and/or thermolabile polymer
constituents such as oligomers, residual reactants and their bi-products (e.g.
terephthalic acid, MHET and BHET) and additives.
In the absence of HPLC, the structures of non-volatile and polar compounds could be
chemically made suitable for GC analysis. Kim et al. (1990) demonstrated that polar
compounds such as ethylene glycol and terephthalic acid could be made more volatile
by derivatisation (trimethylsilylation) to esters/ethers prior to GC analysis (Atkinson
and Calouche 1971). Furthermore, involatile oligomers could be broken down into
dimethyl terephthalate by hydrolysis and subsequent methylation prior to GC analysis
(Gramshaw et al. 1995, Castle et al. 1990, Castle et al. 1988). The more volatile low
molecular weight oligomers of PET (dimer and dimer ether) have been successfully
identified by GC/MS without chemical modification (Buirelli et al. 1993, Monteiro et
al. 1996).
59

Chapter 2
Size exclusion chromatography (SEC) can be used to "clean up" extracts that require
removal of the higher molecular weight compounds prior to GC and HPLC analysis
(Monteiro et al. 1996, Staetin et al. 1987, Gramshaw et al. 1995, Gilbert et al. 1982,
Castle et al. 1989, Shiono 1979). In a similar way, fractions can be collected during
HPLC and further separated and identified by GC-MS analysis (Biuarelli et al. 1993).
SEC has very poor resolution and therefore is not recommended as a single means of
separation and analysis (Munteanu et al. 1987), although some authors have separated
and quantitated polymer additives in this way (Shiono 1979).
Compounds extracted by SFE have been analysed by GC (Nielsen et al. 1992, 1991b,
Garde et al. 1998), HPLC (Bartle et al. 1991) and SFC (Bartle et al. 1991, Ashraf-
Khorassani and Levy 1990) in the past. SFC extends the range of molar mass above
that available by GC and has advantages in separation efficiency compared with
HPLC, especially of closely related compounds such as oligomers (Bartle et al. 1991).
2.5 PURPOSE OF THIS THESIS
The general purpose of this thesis is to determine what volatile and semi-volatile
contaminants are present in post-consumer PET and whether the identified
contaminants exceed the 215 ppb “threshold of regulation” set by the US FDA in
order to satisfy food safety requirements (the “threshold of regulation” is discussed in
Section 2.3.4). Although this threshold level was originally established as the upper
limit of contamination for challenge compounds (surrogates) in recycled PET, it is
analogously used in this thesis as a regulation for actual contaminants in recycled
PET.
Migration testing, such as that performed on virgin and recycled PET in the past (see
Sections 2.2.4 - 2.2.10 for virgin PET and Section 2.3.5.3 for recycled PET) was not
performed in this study because the levels of “contaminants” identified in recycled
Visy PET were very low (in the low ppb range); therefore the level migrating was
expected to be below the 10 ppb threshold set by the FDA for migration.
60

Chapter 2
The “contaminants” which are expected to be predominantly present in post-consumer
PET are those sorbed during the initial use of the container such as soft drink
additives (e.g. limonene, benzoic acid, γ-terpinene, carvone) and
mouthwash/detergent/shampoo additives (e.g. cineole, menthone, methyl salicylate),
as contamination from consumer reuse/misuse is less likely. In fact it is estimated that
contamination from consumer misuse is as low as 1 bottle per 10,000 (Section
2.3.3.1) whilst in contrast greater than 99% of the Visy recycling stream comprises of
carbonated soft drink bottles, fruit juice and vegetable oil bottles (Section 2.3.3.2).
Bayer (2002) has already identified the mentioned soft drink and
mouthwash/detergent/shampoo additives, amongst many other chemicals including
alcohols, aldehydes, ketones, esters, carboxylic acids, aromatics and alkanes, in post-
consumer PET using thermal and total dissolution extraction methods.
The presence of compounds inherited during the initial manufacture of PET (e.g.
monomers, additives, oligomers, breakdown products) may also be identified during
the screening of post-consumer PET. Sections 2.26 – 2.2.8 discussed these
compounds and their earlier detection in PET and food simulants.
Nerin et al. (2003) also identified numerous compounds in recycled PET flakes.
These were classified by chemical group: aroma compounds (e.g. limonene and p-
cymene), aliphatic aldehydes (e.g. hexanal, heptanal, octanal, nonanal and decanal),
aromatic aldehydes (e.g. benzaldehyde), esters (e.g. vinylbenzoate, methyl
dodecanoate and methyl stearate), aliphatic acids (acetic acid, hexanoic acid and
nonanoic acid), aromatic compounds (e.g. p-xylene, isopropyltoluene and toluene),
alkanes (e.g. dodecane), plasticisers (e.g. dibutylphthalate and dioctylphthalate),
ketones (e.g. benzophenone) and alcohols (e.g. dodecanol and hexadecanol). Similar
compounds were identified by Bayer et al. (2002) in an independent study, therefore
it is highly likely that a selection of these compounds will be identified in the post-
consumer PET we extracted.
The decontamination efficiency of the Visy secondary recycling process will be
determined in our study after extracting the post-consumer PET following each PET-
cleansing stage, as carried out previously during challenge tests (see Section 2.3.5.3).
Soxhlet extraction, sonication, total dissolution and headspace analysis (SPME and
static headspace analysis) will be the extraction techniques used to isolate the
contaminants from the polymer matrix prior to their instrumental analysis (see Section
61

Chapter 2
2.4 for a description of the extraction methods). The polymer will be ground to
different particle size ranges to facilitate extraction and all extracts will be run on a
GC/MS (which accounts for the volatile and semi-volatile contaminants) and
quantified using calibration standards. The involatile compounds cannot be
accounted for by these techniques. Therefore, some other means of analysis such as
HPLC should be considered in future work.
Throughout our study there will be a major focus drawn on extraction method
development in the quest to determine optimum extraction conditions. Time, particle
size and temperature are three external parameters that will be monitored for the
different extraction techniques used throughout this thesis. The effects of polymer
and “contaminant” properties on the level of extraction such as contaminant shape and
size as well as polymer crystallinity and orientation will be studied in order to obtain a
broad overview of the extraction process, which is comparable to migration.
References will be made to Equation 2.3, which relates the amount of contaminant
migrated to time and the diffusion coefficient.
In summary, the general aim of the thesis is to determine what contaminants are
present in recycled PET and whether the levels exceed the FDA threshold of
regulation for food-contact use. In fulfilling this aim, extraction method development
will be carried out involving the solvent extraction of different particle sizes for
different time intervals. Temperature optimisation will be carried out in the area of
headspace analysis. The effects of polymer crystallinity on extraction will also be
investigated.
2.6 OUTLINE OF THIS THESISThe results of this thesis are segregated into three
separate chapters (Chapter 4, 5 and 6). The first chapter of this series (Chapter 4)
involves the Soxhlet extraction and GC/MS screening of the washed and dried flake
for foreign components.
The chapter discusses the method development and the quantitative results found
from the extraction of semivolatile contaminants from washed and dried PET flake,
using Soxhlet extraction.
62

Chapter 2
The primary goal of Chapter 4 was to exhaustively extract contaminants from treated
curbside PET. Two parameters – particle size and time – were varied in search of the
optimum conditions. The Soxhlet extraction technique was validated by comparison
with total dissolution using TFA.
The second chapter of this series (chapter 5) presents the Soxhlet extraction kinetics
of annealed extruded pellets ground to three different particle size ranges. The effect
of particle size on the level of contaminant extracted was subsequently investigated.
In addition, the amorphous pellets were flattened using a hydraulic press (pressure = 8
tons) to reduce the path-length of the amorphous pellets prior to extraction.
Whole amorphous and annealed extruded pellets were extracted with time and the
effects of crystallinity on extraction and sorption kinetics were discussed.
The aim of Chapter 6 is to account for the volatile contaminants present in recycled
PET using headspace techniques (static headspace analysis and SPME). Extraction
temperature optimisation was the main focus of this chapter.
63

Chapter 3
CHAPTER 3 MATERIALS AND METHODS
3.1 METHOD FOR CHAPTER 4 3.1.1 Chemicals
The standards used are presented in Table 3.1. In this Table, Aldrich standards were
purchased from Milwaukee, WI, USA; Ajax standards from Auburn, NSW, Australia;
May and Baker standards from Dagenham, England; Lancaster standards from
Eastgate, White Lund, Morecambe, England; BDH Chemicals from Poole, England;
and Merck from Hohenbrunn, Germany.
Other chemicals purchased were dichloromethane (99.5%), heptane (99.5%), acetone
(99.5%), ethyl acetate (99.5%), isopropanol (99.7%), ethylene glycol (99%) and
trifluoroacetic acid (TFA, 99%). These solvents were manufactured by Merck
(Kilsyth, Victoria, Australia) whilst hexafluoroisopropanol (HFIP, 99.5%), hexane
(95%) and chloroform (99.8%) were manufactured by Fluka biochemika (Neu-Ulm,
Switzerland), LabScan (Bangkok, Thailand) and BDH chemicals (Poole, England)
respectively.
Table 3.1: Contaminants identified in washed and dried PET flake and the standards used.
Contaminant Retention Time
Selected Ion
Standard used Purity Company
2-Butoxyethanol 5.77 100 2-Butoxyethanol 95% Ajax Chemicals
1,2,4-, Trimethylbenzene
7.90 105 1,2,4-, Trimethylbenzene
99% Aldrich
m-Cymene*
8.82 119 o-Cymene* 99% Aldrich
(R)-(+)-Limonene
8.96 136 (R)-(+)-Limonene 97% Aldrich
Cineole
9.06 154 Cineole 99% Aldrich
γ-Terpinene
10.76 93 γ-Terpinene 97% Aldrich
3-Ethyl-o-xylene*
10.80 119 o-Cymene* 99% Aldrich
64
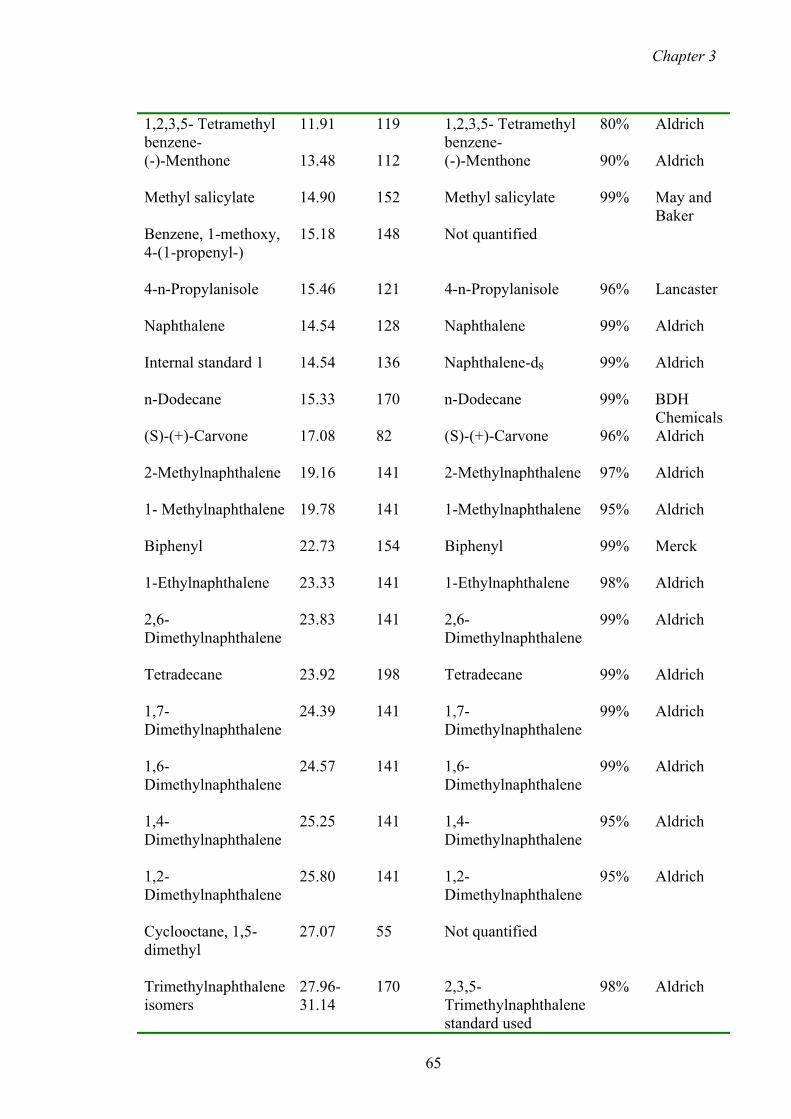
Chapter 3
1,2,3,5- Tetramethyl benzene-
11.91 119 1,2,3,5- Tetramethyl benzene-
80% Aldrich
(-)-Menthone
13.48 112 (-)-Menthone 90% Aldrich
Methyl salicylate 14.90 152 Methyl salicylate 99% May and Baker
Benzene, 1-methoxy, 4-(1-propenyl-)
15.18 148 Not quantified
4-n-Propylanisole
15.46 121 4-n-Propylanisole 96% Lancaster
Naphthalene
14.54 128 Naphthalene 99% Aldrich
Internal standard 1
14.54 136 Naphthalene-d8 99% Aldrich
n-Dodecane 15.33 170 n-Dodecane 99% BDH Chemicals
(S)-(+)-Carvone
17.08 82 (S)-(+)-Carvone 96% Aldrich
2-Methylnaphthalene 19.16 141 2-Methylnaphthalene
97% Aldrich
1- Methylnaphthalene 19.78 141 1-Methylnaphthalene
95% Aldrich
Biphenyl
22.73 154 Biphenyl 99% Merck
1-Ethylnaphthalene
23.33 141 1-Ethylnaphthalene 98% Aldrich
2,6- Dimethylnaphthalene
23.83 141 2,6-Dimethylnaphthalene
99% Aldrich
Tetradecane
23.92 198 Tetradecane 99% Aldrich
1,7- Dimethylnaphthalene
24.39 141 1,7-Dimethylnaphthalene
99% Aldrich
1,6- Dimethylnaphthalene
24.57 141 1,6- Dimethylnaphthalene
99% Aldrich
1,4- Dimethylnaphthalene
25.25 141 1,4- Dimethylnaphthalene
95% Aldrich
1,2- Dimethylnaphthalene
25.80 141 1,2- Dimethylnaphthalene
95% Aldrich
Cyclooctane, 1,5-dimethyl
27.07 55 Not quantified
Trimethylnaphthalene isomers
27.96-31.14
170 2,3,5-Trimethylnaphthalene standard used
98% Aldrich
65
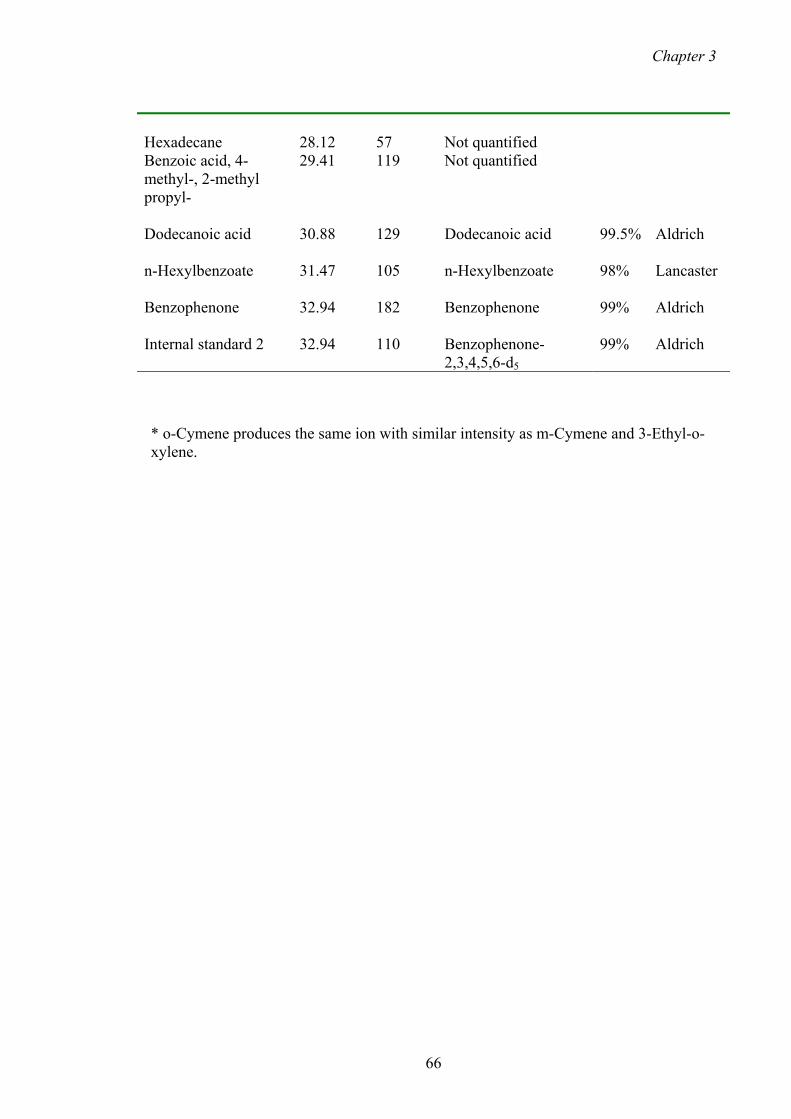
Chapter 3
Hexadecane 28.12 57 Not quantified Benzoic acid, 4-methyl-, 2-methyl propyl-
29.41 119 Not quantified
Dodecanoic acid
30.88 129 Dodecanoic acid 99.5% Aldrich
n-Hexylbenzoate
31.47 105 n-Hexylbenzoate 98% Lancaster
Benzophenone
32.94 182 Benzophenone 99% Aldrich
Internal standard 2 32.94 110 Benzophenone-2,3,4,5,6-d5
99% Aldrich
* o-Cymene produces the same ion with similar intensity as m-Cymene and 3-Ethyl-o-xylene.
66

Chapter 3
3.1.2 Preparation of stock standards
Removable needle, teflon-tipped plunger, Hamilton (Reno, Nevada, USA) gastight
microsyringes of 25 µl; 50 µl; 100 µl; 250 µl; 500 µl; 1000 µl were used for all
sampling and transfers. Approximately 100 ppm solutions of each contaminant and
internal standard were prepared using an analytical balance and separate volumetric
flasks, using DCM as the solvent. Aliquots from each of these flasks were then pooled
together, resulting in one stock calibration standard (SCS) comprising all contaminants,
each at 1 ppm.
3.1.3 Soxhlet calibration standards
Appropriate amounts of the combined SCS were individually diluted for each
contaminant to eight different concentrations to create a calibration curve that
bracketed the unknowns. A 30 µl aliquot of a 75 ppm deuterated internal standard
solution was added before the calibration standards were made up to the mark with
DCM. The two internal standards (naphthalene-d8 and benzophenone-2,3,4,5,6-d5)
eluted at the extremes of the gas chromatogram and were structurally related to some of
the compounds identified in PET. The calibration standards were then concentrated in
the same way as the polymer extracts (see Section 3.1.8 “Soxhlet extraction
conditions”) and analysed by GC/MS. R2 for the standard curves exceeded the value of
0.99, which is approved by the U.S. FDA and the U.S. Environmental Protection
Agency (EPA) (US EPA, 1996).
3.1.4 Dissolution calibration standards
Different amounts of the 1 ppm stock calibration solution were added to separate
containers, each containing 20 ml TFA and 30 µl of the 75 ppm internal standard
solution. The spiked TFA was then extracted with 2 X 20 ml volumes of heptane. The
extracts were combined, washed with milli-Q water, dried over anhydrous sodium
sulphate and concentrated as for the PET samples (see Section 3.1.10 “Total
Dissolution Extraction Conditions”). R2 for the standard curves once again exceeded
0.99.
67

Chapter 3
3.1.5 Gas chromatography-mass spectroscopy (GC-MS) analysis
For the analysis of less polar contaminants, GC-MS was performed using a Hewlett
Packard 5890 Series II gas chromatograph coupled to a Hewlett Packard 5971A mass
spectrometer. Ultrahigh purity helium carrier gas (BOC gases, NSW, Australia) was
used. Qualitative analysis was achieved in TIC mode whilst SIM mode was required
for quantitative analysis for sensitivity and selectivity. The selected ions chosen for
each contaminant are presented in Table 3.1.
Gas chromatograph conditions: Column, DB-5MS, 30 m x 0.25mm, 0.25 µm film
thickness (J. & W. Scientific, USA); injection port temperature, 250°C. The initial
oven temperature was 35°C for 1min. Temperature programming was then employed
at 10°C/min until 70°C and at 3°C/min until 280°C (final hold time 25 mins).
MS conditions: solvent delay, 5 mins; temperature, 280°C.
For the analysis of more polar contaminants, GC/MS was performed using a Hewlett
Packard 6890 gas chromatograph coupled to a Hewlett Packard 5973 mass
spectrometer. Ultrahigh purity helium carrier gas (BOC gases, NSW, Australia) was
used. Qualitative analysis was achieved in TIC mode whilst SIM mode was required
for quantitative analysis. Only 2-butoxyethanol and ethylene glycol were quantified by
SIM (the selected ions were 100 and 31 for 2-butoxyethanol and 1,2-ethanediol
respectively).
Gas chromatograph conditions: Column, EC-Wax Econo-cap, 30 m x 0.25mm, 0.25
µm film thickness (Alltech Associates, Inc., Deerfield, IL); injection port temperature,
250°C; Split ratio, 1:1. The initial oven temperature was 60°C. Temperature
programming was then employed at 12°C/min until 220°C (final hold time 5 mins).
MS conditions: solvent delay, 5.4 mins; temperature, 250°C.
3.1.6 Commercial Visy1 treatment of curbside PET
The curbside stock, contaminated with polypropylene (PP) from closures and neck
rings, was shredded (by an industrial cutter) and intensely washed with detergent for
10-20 minutes at 75-95 °C under caustic conditions. After the flake was washed, the
1 The recycling process utilised by Visy is the subject of international patent application PCT/AU00/016131 and Australian patent application PQ2946.
68

Chapter 3
excess wash water was removed by centrifugation. Subjecting the flake to a sink-float
separation eliminated the PP and PE contaminants, which have a lower density than
PET.
The PET was then dried using air and elevated temperatures (140-185°C) for 5-8 hours.
3.1.7 Laboratory preparation of polymer before analysis
All analyses on washed and dried PET flake throughout our studies were performed on
samples taken from a single (approximately 15 kg) bag collected from the Visy
recycling plant (Reservoir, Vic, Australia) in June 2000. Each sample of washed and
dried PET flake (a random grab of approximately 70g) was cryogenically ground with
liquid nitrogen using a steel blender (CBL20, Breville, Botany, NSW, Australia).
Grinding involved chipping the flake against the walls of the blender. The ground
material was subsequently separated into three different particle size ranges using
manual sieves: 0-300 µm (small, around 4.6% of the total ground material by weight),
300-425 µm (medium, about 2.5%) and 425-700 µm (large, approximately 5.9%).
There was a large amount of ungrounded chipped flake remaining in the blender after
each grinding. (In the vicinity of 87% of the total material subjected to grinding). This
residue was not reduced in particle size, irrespective of the time of grinding.
3.1.8 Soxhlet extraction conditions
A cellulose Soxhlet extraction thimble (25 mm x 80 mm, Whatman, Maidstone,
England) was filled with 10 g of washed and dried PET flake ground to the small
particle size range (0-300µm). The ground flake was extracted for different times (8 h,
16 h, 24 h, 48 h and 72 h) using 200 ml of boiling DCM. Extractions were performed as
single measurements for 8 h and 16 h; duplicates for 24 h and 72 h; and triplicates for
48 h. A 50 µl microsyringe was used to transfer 30 µl of internal standard solution (75
ppm) to the extract before the DCM was distilled off to provide a 10 ml concentrate.
The extract was further concentrated to approximately 1 ml under a stream of nitrogen
and filtered through a SGE Teflon membrane syringe filter (pore size 0.45 µm,
Ringwood, Victoria, Australia) prior to GC-MS analysis.
Masses of the medium and large particle size ranges (7 g and 6 g respectively) were
analogously extracted for 24 h prior to further kinetic studies.
69

Chapter 3
3.1.9 Sonication
Small flake (1.5-5 g) was ground and sonicated for 3 h in 70 ml DCM with occasional
swirling to prevent aggregation. A 30 µL aliquot of internal standard solution (75 ppm)
was added to the PET/DCM mixture prior to sonication (Ultrasonics, Sydney, NSW,
Australia, 50Hz). The sonicated mixture was vacuum filtered with intermittent
washings using DCM. The mother liquor was concentrated and filtered as for the
Soxhlet extracts prior the GC-MS analysis.
3.1.10 Total dissolution extraction conditions
3.1.10.1 Total dissolution by TFA – Qualitative analysis
Extraction of the PET polymer by TFA dissolution for qualitative analysis involved
sonicating 10 g of polymer (virgin PET pellets, washed and dried flake, and extruded
pellets) in 50 ml of TFA until it completely dissolved. The TFA extract was then
extracted with three 35 ml portions of heptane, which were drawn off into another
container, washed twice with 50 ml of milli-Q water, passed over anhydrous sodium
sulphate and concentrated to 10 ml using a fractional distillation apparatus. The
volume of the concentrate was further reduced to 1 ml with a stream of nitrogen before
GC-MS analysis
3.1.10.2 Total dissolution by TFA – Quantitative analysis
Ground PET flake (1.5 g – 5 g) was dissolved in TFA. The volume of the latter was
equivalent to 10 times the mass of plastic. A 30 µl aliquot of internal standard solution
was added to the PET/TFA solution, which was subsequently sonicated until total
dissolution of the polymer (approximately 1 hour). The mixture was shaken with a
volume of heptane equivalent to that of TFA. The layers were allowed to separate
before drawing off the top layer (heptane) into another container. This procedure was
repeated once again and the extracts were combined.
The heptane layer was washed twice with milli-Q water, passed over anhydrous sodium
sulphate and concentrated to 10 ml using a fractional distillation apparatus. The
volume of the concentrate was further reduced to 1 ml with N2 before GC-MS analysis.
3.1.10.3 Total dissolution by HFIP – Qualitative analysis
HFIP (25 ml) was added to 10g of PET together with 50 ml of dichloromethane. The
mixture was sonicated for 2 hours before an additional 190 ml of dichloromethane was
70

Chapter 3
added. The extract was precipitated with 300 ml of methanol, filtered under vacuum
and the supernatant was evaporated to 10 ml by fractional distillation and then to 1 ml
under a stream of nitrogen before GC- MS analysis.
3.1.11 Crystallinity analysis
Differential scanning calorimetry (DSC) was performed in a nitrogen atmosphere on a
2920 DSC manufactured by TA instruments. The ramp conditions were: 10°C/min
from 50°C to 300°C.
X-ray diffraction patterns were collected on a Siemans D-5000 automated diffraction.
An aluminium sample holder and graphite monochromator (26.6 °) were used. Since
the SIROQUANT databank did not include the structure of PET, a graphite structure
was used to simulate the main peaks in the PET XRDs.
3.2 METHOD FOR CHAPTER 5
3.2.1. Chemicals
The chemicals used, procedures for the preparation of standards and curbside samples,
and, extraction and GC/MS analysis conditions were all as described in Section 3.1.
3 2.2 Crystallinity analysis
See Section 3.1.11.
3.3 METHOD FOR CHAPTER 6
3.3.1 Preparation of stock standards
Removable needle, teflon-tipped plunger, Hamilton gastight microsyringes (Reno,
Nevada, USA) of 25 µl; 50 µl; 100 µl; 250 µl; 500 µl; 1000 µl were used for all
sampling and transfers.
As described previously (Section 3.1.2), 100 ppm of each selected standard was
prepared separately in DCM. Appropriate volumes of these standards were then pooled
into one standard flask in order to produce a 1-ppm calibration standard. Additional
chemicals that were investigated by SHS in PET were undecane (>99%, Aldrich,
Milwaukee, WI, USA), toluene (>99%, Fluka chemika, Neu-Ulm, Switzerland) and p-
xylene (99+%, Sigma-Aldrich, Milwaukee, WI, USA).
71

Chapter 3
3.3.2 Soxhlet calibration standards for external standardisation
A five-point calibration curve was constructed from the pooled stock calibration
standard. Volumes of 20 µl, 50 µl, 75 µl, 100 µl, 150 µl and 250 µl were placed in
headspace 20 ml vials, half filled with glass beads (size = 2mm x 2mm) to simulate
similar headspace volumes as for the samples.
3.3.3 SPME
A manual SPME holder was used with four different fibre types; 100 µm and 7 µm
PDMS, 75 µm CX/PDMS, and 85 µm PA. All of these fibres including the holder were
purchased from Supelco (Bellefonte, PA, USA).
In the first experiment approximately 3 g of washed and dried flake (ground to 425µm –
700 µm) was placed in 25 ml static headspace vial and capped. The vial was heated in a
temperature-controlled paraffin oil bath set at 90°C for 15 minutes and then the
CX/PDMS fibre was immersed into the headspace and allowed to equilibrate for 30
minutes. The fibre was then subjected to GC/MS analysis. This procedure was
repeated for the remaining fibres and the results were qualitatively compared. The
CX/PDMS fibre was chosen for the extraction temperature optimisations.
Due to the heterogeneous nature of flake, temperature optimisations were performed on
the more homogenous annealed extruded pellets ground to three different particle size
ranges (0-300 µm; 300-425 µm and 425-700 µm), in a pursuit to determine the optimum
extraction temperature and particle size. Approximately 8 g of annealed ground and
unground pellets were placed in headspace sample vials and capped. In an attempt to
determine maximum extraction, heating was carried out at different temperatures (90°C,
130°C, 160°C, 194°C, 214°C, 238°C, 260°C) for one hour using a laboratory oven. The
samples were then immediately transferred into an oil bath thermostatted at 90°C and
the CX/PDMS fibre was immersed into the headspace for 30 minutes prior to GC/MS
analysis. The individual areas for each selected ion were plotted against extraction
temperature for the three ground particle sizes and the unground pellets. To confirm
the distinctive shapes of the curves, the thermodynamic procedure was repeated for
unannealed extruded pellets. In this case many more temperature measurements were
taken and the resultant extraction the thermodynamic were comparable to that of the
annealed pellets.
72

Chapter 3
In an attempt to reduce the degree of competitive adsorption, smaller quantities (0.3g
and 1 g) of ground annealed PET were analysed for different times. A shorter fibre
exposure time of 5 mins was also considered.
In order to determine whether similar competitive effects arise when using “absorption”
fibres, extraction thermodynamics were similarly studied on extruded PET pellets using
PDMS (100µm).
3.3.4 Static Headspace
With the CX/PDMS fibre undergoing competitive adsorption, another technique was
sought for the analysis of volatile contaminants in recycled PET. SHS does not
incorporate the use of a sorbent therefore it was selected as an alternative means of
extraction.
As for the SPME investigation, the first step to SHS analysis was to optimise the
extraction temperature in an attempt to attain exhaustive extraction. In this case 6 g of
pellets were heated for an hour at 70°C, 90°C, 120°C, 140°C, 180°C and 200°C and
then analysed by SHS. Since extraction was incomplete during the course of this study,
a set temperature and time were selected for quantitative analysis (See Section 3.3.5).
3.3.5 Quantitative analysis by SHS
Multiple headspace extraction was the first quantitative method investigated. This
method involved heating 0.3 g of ground washed and dried flake (425 µm –700 µm) at
180°C for 30 minutes and then analysing the headspace. The same sample was then
reheated at 30-minute intervals and re-analysed until the attainment of 190 mins.
Pellets and ground-annealed pellets (425 µm –700 µm) were extracted.
As unsatisfactory outcomes eventuated, no standardisation procedure was finalised for
the multiple headspace extraction method.
External standaridisation involved extracting pellets, ground flake, virgin PET and
external standards (glass beads spiked with undecane, toluene and p-xylene) at 180°C
for 20 minutes. All samples were analysed in triplicate.
73

Chapter 3
3.3.6 GC/MS Conditions – SPME
GC/MS was performed using a Hewlett Packard 5890 Series II gas chromatograph
coupled to a Hewlett Packard 5971A mass spectrometer. Ultrahigh purity helium
carrier gas (BOC gases, NSW, Australia) was used. Qualitative analysis was achieved
in TIC mode.
Gas chromatograph conditions: Column, DB-5MS, 30 m x 0.250mm, 0.25 µm film
thickness (J. & W. Scientific, USA); injection port temperature, 250°C. The initial
oven temperature was 35°C for 1min. Then temperature programming was employed
at 10°C/min until 70°C and at 3°C/min until 280°C (final hold time 25 mins).
MS conditions: solvent delay, 2 mins; temperature, 280°C.
3.3.7 GC/MS Conditions – SHS
Static Headspace GC/MS was performed using a Hewlett Packard 6890 gas
chromatograph coupled to a Hewlett Packard 5973 mass spectrometer and an
automated HS apparatus (HP 7694E) directly coupled to the GC. Ultrahigh purity
helium carrier gas (BOC gases, NSW, Australia) was used. Qualitative analysis was
achieved in TIC mode whilst SIM mode was required for quantitative analysis. The
selected ions (SI) were: 55, 78, 69, 91, 104, 105, 120, 77, 119, 67, 57, 115, 93, 128,
141, 121, 56, 81, 170, 154, 73, 98, 100. The compounds that were investigated were 1-
methylethyl benzene (SI = 105, 120), m-cymene (SI = 119), Cyclopentane, 1-methyl-2-
propyl- (SI = 57), 1,2,4-trimethylbenzene (SI = 105), naphthalene (SI = 128), 2,4,6-
trimethyloctane (SI = 57), benzaldehyde (SI =105, 120), 3-ethyl-o-xylene (SI = 119),
cineole (SI = 154), propylanisole (SI = 121), biphenyl (SI = 154), propylbenzene (SI =
91, 120), 2-ethylfuran (SI = 81), limonene (SI = 69), toluene (SI = 91) and 1,2,3,5-
tetramethylbenzene (SI = 119) and p-xylene (SI = 91).
Gas chromatograph conditions: Column, HP-5MS, 30 m x 0.25mm, 0.25 µm film
thickness (Alltech); injection port temperature, 250°C; Split ratio, 2:1. The initial oven
temperature was 35°C (initial time: 1 minute). Temperature programming was then
employed at 20°C/min until 270°C (final hold time 2 mins).
MS conditions: solvent delay, 2 minsϕ; temperature, 250°C.
ϕ A solvent delay was included to exclude the air peak from the chromatogram.
74
Chapter 4
CHAPTER 4 SEMI-VOLATILE CONTAMINANTS AND LEVELS OF OCCURRENCE IN
WASHED AND DRIED SHREDDED PET
4.1 GENERAL INTRODUCTION
4.1.1 Purpose of the chapter
The general purpose of the work in the following chapter was to determine which
contaminants are present in washed and dried shredded PET (flake) obtained from curbside
collection and to determine whether their concentrations are above the US FDA threshold
of 215 ppb. The steps undertaken in achieving this goal – qualitative analysis and
extraction method development - have been segregated into two sections (Section 4.2 and
Section 4.3) of the existing chapter.
The quantitative results presented in this chapter (for the extraction of washed and dried
flake) are the first step in determining whether recycled PET is suitable for food contact
use. In subsequent chapters extraction of contaminants from further treated (extruded) PET
will be addressed and each recycling stage will be assessed with respect to its
decontamination efficiency, as previously carried out during challenge tests (Franz and
Welle 1999a, Harding et al. unpublished).
It is presumed that the concentrations of the semi-volatile and non-volatile contaminants in
recycled PET would represent a “worst case scenario” surpassing the levels of volatile
contaminants, which are more likely to be removed by the high temperatures and vacuum
extrusion used during recycling.
Therefore, from a consumer-safety perspective, it would conceivably be of greater
significance to recognize the levels of semi-volatiles and non-volatiles in recycled PET.
Soxhlet extraction, ASE, MAE and SFE are extraction methods generally used to extract
semi-volatiles and non-volatiles from polymers. Throughout this thesis the Soxhlet
extraction method has been selected as the principal extraction technique alongside GC/MS
analysis such that the presence of semi-volatile compounds in washed and dried flake could
be identified and quantified. The analysis of non-volatile contaminants in post-consumer
PET will not be initiated, as the gas chromatograph is limited to the analysis of volatile and
75

Chapter 4
semi-volatile compounds. In future work it may be desirable to analyze non-volatile
compounds in recycled PET plastic by liquid chromatography, even though the migration
of large compounds into food is slow relative to the diffusion of smaller, more volatile
compounds through the polymer matrix.
4.1.2 Brief outline of chapter
The first main theme of this chapter (Section 4.2) discusses the Soxhlet extraction and
GC/MS screening of the washed and dried flake for foreign components. Dichloromethane,
the recommended extraction solvent for PET, was used because it is known to swell the
polymer matrix and potentially enhance the diffusion of its constituents (Feigenbaum et al.
2002). This behaviour is attributed to the solubility parameter similarity between DCM and
PET (Vandenburg et al. 1999, St. Küppers 1992) and the large diffusion coefficient of
DCM in PET (Sadler et al. 1996). Huber and Franz (1997a) employed a similar extraction
and screening method to identify the contaminants in recycled (ground, washed and
extruded) HDPE produced from household waste.
Comparisons of the post-consumer PET extracts with the virgin PET extracts were made in
order to decide which components are foreign and which are hereditary to the polymer, and
hence not regarded as post-consumer contaminants.
Two total dissolution techniques were employed in order to theoretically extract any
contaminants that could be entrapped in the polymer matrix and therefore not accessible by
the Soxhlet extraction solvent. It was proposed that highly interactive solvents such as
TFA and HFIP extract contaminants out of the polymer matrix more indiscriminately.
The second main theme of this chapter (Section 4.3) discusses the method development and
the quantitative results found from the extraction of semivolatile contaminants from washed
and dried PET flake, using Soxhlet extraction.
The primary goal of Section 4.3 was to exhaustively extract contaminants from treated
curbside PET. Two parameters – particle size and time – were varied in search of the
optimum conditions. The Soxhlet extraction technique was validated by comparison with
total dissolution using TFA.
76

Chapter 4
4.1.3 Selecting the right extraction solvent for Soxhlet extraction
Some other solvents, which are expected to be suitable extraction solvents as a result of
their compatible solubility coefficients with PET, are acetone, xylene, 1,4-dioxane,
chloroform, ethyl acetate and meta-cresol (Table 4.1). Although the swelling action of
acetone has been documented (Moore and Sheldon 1961, Begley et al. 2002) and xylene,
1,4-dioxane and chloroform have been used to extract oligomers from PET (Hudgins et al.
1978, Costley et al. 1997, Goodman and Nesbitt 1960), the higher boiling points of these
solvents, relative to dichloromethane, was the initial deterrent to their use during the current
investigation. Low boiling point extraction solvents were sought to prevent the loss of
analytes through volatisation during extraction and solvent removal (evaporation) prior to
GC/MS analysis.
Table 4.1: Hildebrand solubility parameters of some solvents and PET (Vandenburg et al.
1999, Brandrup and Immergut 1989, Weast and Melvin 1979).
Material Solubility
parameter (δ
Mpa1/2)
Boiling point (°C)
Xylene 18.2 140
Ethyl acetate 18.6 77
Chloroform 19.0 61
Dichloromethane 19.8 40
Acetone 20.3 56
1,4- Dioxane 20.5 101
m-Cresol 20.9 203
PET 20.5
Nonetheless, from Table 4.1, the boiling points of acetone and chloroform are reasonably
low (56°C and 61°C respectively), even though they exceed the boiling point of DCM
(40°C). As a result, the likelihood of semi-volatile contaminant loss would still be
expected to be negligible during extraction using acetone and chloroform. However,
77

Chapter 4
acetone and chloroform were not selected as extraction solvents in preference to DCM
because:
1. Costley et al. (1997) reported that DCM was more efficient than acetone during the
microwave extraction of cyclic trimer out of PET. St Küppers (1992) made an analogous
observation whilst extracting cyclic trimer from PET by SFE using four different modifiers
(methanol, isopropyl alcohol, DCM and acetone). Only the DCM modifier gave an
increase in the amount of trimer extracted.
2. Chloroform has a greater molecular weight than DCM, and therefore was expected to
diffuse through PET at a slower rate.
3. Besides the higher boiling point of ethyl acetate compared to DCM (77°C and 40°C
respectively), another reason why ethyl acetate was not considered as the prime extraction
solvent in preference to DCM was that according to Vandenburg et al. (1999) and Costley
et al. (1997), DCM swelled PET to the point of fusion at a lower temperature (120°C) than
that of ethyl acetate (190°C) under high pressure conditions. This led to the assumption that
DCM could be more powerful than ethyl acetate in swelling PET.
In the extraction of non-volatile components from PET, the use of higher boiling solvents
could be advantageous during Soxhlet extraction, especially if the solvents boil above the
Tg of the polymer (69°C for PET). Above the Tg, a glassy polymer becomes rubbery,
which facilitates extraction through the increased movement of polymer chains. Since the
Tg is reduced when a polymer is plasticized, a solvent that swells PET but boils a few
degrees below the original Tg could also be effective. Alternatively, the extraction
temperature could be increased above the boiling point of the solvent in an accelerated
solvent extractor, without the loss of volatiles. Due to the unavailability of automated
extraction techniques such as ASE, SFE and MAE, solvent extraction was performed by
means of manual extraction methods (e.g. total dissolution and Soxhlet extraction).
78

Chapter 4
4.2 QUALITATIVE STUDY OF CONTAMINANTS IN WASHED AND DRIED PET
FLAKE
4.2.1 Introduction to Soxhlet extraction of washed and dried flake
In order to efficiently extract PET by Soxhlet extraction, an appropriate solvent must be
used; one which swells the polymer matrix and liberates the potential migrants. The
extracted constituents could then be separated and identified by GC/MS.
As mentioned in Section 4.1.3, a relatively low boiling solvent with a solubility parameter
similar to that of PET is the initial criterion for selecting the right solvent for the extraction
of semi-volatiles. However, the solubility parameter is not the only decisive factor that
impinges on the extent of polymer swelling. Other contributing factors are solvent
molecular shape, size and affinity towards the polymer functional groups. In Section 4.1.3,
it was reasoned from previous extraction studies that DCM would be a more suitable
extraction solvent than ethyl acetate, chloroform and acetone, despite all of these solvents
having similar solubility parameters to that of PET (Table 4.1). It is believed that DCM is
more efficient in swelling PET than the other solvents and the reasons behind this
presumption are not solely related to the solubility parameter.
4.2.2 Choosing a suitable low boiling solvent
In order to confirm the hypothesis that DCM swells PET more readily than three solvents
with similar δ to PET (acetone, ethyl acetate, chloroform) and three solvents with dissimilar
δ to PET (hexane, ethanol, 2-propanol), a simple gravimetric experiment was undertaken
during which extruded PET pellets were subjected to each of the test solvents and the
polymer was weighed after a particular exposure time. Similar gravimetric swelling
experiments have been performed for PET in the past (Moore and Sheldon 1961, Begley et
al. 2002, Jameel et al. 1981). The disadvantage of weight uptake measurements is that they
can be altered by weight loss due to the migration of polymer constituents (Feigenbaum et
al. 1991). It is assumed that the level of migration is low relative to the extent of sorption
due to PET being relatively free of mobile compounds such as additives (Sauvant et al.
1995, Castle et al. 1989).
79

Chapter 4
The solvent swelling effects of PET pellets were visually identified for solvents with
solubility parameters similar to that of PET (dichloromethane, acetone, ethyl acetate and
chloroform). These solvents lead to solvent-induced crystallization of the amorphous
pellets thus causing them to transform from transparent to opaque.
DCM and chloroform produced the greatest degree of opaqueness of all the solvents tested.
The color change instigated by the sorption of acetone and ethyl acetate was minor relative
to the chlorinated solvents. No color change was observed for isopropanol, hexane and
ethanol, emphasizing the lack of interaction with the polymer.
The solvent induced crystallization of PET by acetone and dimethylformamide have been
reported in the past (Jameel et al. 1981, Ouyang et al. 1998, Moore and Sheldon 1961).
Crystallinity in polymer swelling solvents theoretically occurs because the solute lowers the
Tg and provides enough mobility to the polymer chain segments for them to form crystals
(Liu and Neogi 1992).
Figure 4.1 is a plot of the number of mmole of solvent absorbed at 3 h (Soxhlet extraction)
versus the difference in solubility parameters between PET and the corresponding solvent
(δPET - δsolvent). It is interesting to note that although the solubility parameter difference
between PET and acetone is smaller than that between PET and any other solvent, the
number of mmoles of acetone absorbed by PET is six times lower than for DCM and over 4
times lower than for chloroform. A possible explanation for the stronger affinity of DCM
towards PET could be attributed to the smaller molecular size of DCM compared with
acetone. Using a computer molecular modeling program (Sybyl 6.8), the volume of acetone
(59.6 A3) was calculated to be 10.2 A3 greater than that of DCM (49.4 A3).
80

Chapter 4
Figure 4.1: Plot of the number of mmole of solvent absorbed at 3 h versus (δPET - δsolvent).
0
10
20
30
40
50
60
-7 -6 -5 -4 -3 -2 -1 0 1 2 3 4 5 6 7
PET - solvent
amou
nt s
orbe
d (m
mol
es)
Hexane Acetone Dichloromethane ChloroformEthyl Acetate 2-Propanol Ethanol
Since chloroform (60.8 A3) and acetone (59.6 A3) were calculated to have similar
molecular sizes, the rationale behind chloroform’s superior sorption by PET cannot be
linked to size. A more credible explanation is related to functional groups’ interactions.
Chloroform has acidic properties in the Lewis sense and could potentially solvate the basic
carbonyl polymer groups. Moore and Sheldon (1961) have already demonstrated that
hydrogen bonding between acidic liquids and basic polymer groups cause greater polymer
swelling than analogous interactions between basic ketones such as acetone and the acidic
hydrogen atoms of the CH2 groups adjacent to oxygen atoms in PET. The aggressiveness
of chlorinated and fluorinated compounds (e.g. trichloroethane, chlorobenzene,
trichloroacetic acid, HFIP and TFA) towards PET has been documented (Demertzis et al.
1997, Franz and Welle 2002, Chidambaram et al. 2003); therefore the superior sorption
action of DCM and chloroform by PET is not surprising. One exception, where contact
with a chlorinated compound did not result in any swelling was with carbon tetrachloride
(Moore and Sheldon 1961). This solute did not absorb into PET presumably because of its
large molecular size, low solubility parameter relative to PET (∆δ = 2.9 Mpa1/2) and the
absence of an “acidic” proton to interact with “basic” polymer groups.
81

Chapter 4
Ethylacetate, which is clearly larger than acetone, chloroform, DCM and has a basic ketone
group and larger ∆δ, does not absorb appreciably.
Swelling occurs in liquids whose solubility parameters do not differ vastly. It is likely that
the remaining solvents in Figure 4.1 (hexane, 2-propanol, ethanol) did not absorb into PET
efficiently because of the large differences in solubility parameters (Table 4.2). The
difference in solubility parameter (∆δ) between each of the solvents in Table 4.2 and PET
exceeds 3, which is considered significant in the interactive sense.
Table 4.2: Hildebrand solubility parameters of hexane, 2-propanol, ethanol and PET
(Vandenburg et al. 1999).
Material Solubility parameter (Mpa1/2)
Hexane 14.9
2-propanol 23.8
Ethanol 26.0
PET 20.5
Refluxing the pellets (7 g) with equal volumes of DCM, chloroform, ethyl acetate and
acetone and weighing the pellets after a 10-minute exposure time provided a similar
sorption order to that obtained by a 3 h Soxhlet extraction (with one exception). The
number of moles of DCM, chloroform, ethyl acetate and acetone sorbed were 19.3 mmol,
14.8 mmol, 2.80 mmol and 2.51 mmol, respectively. Therefore, the amount of DCM and
chloroform absorbed during reflux exceeded the amount of ethyl acetate and acetone
absorbed, as for the Soxhlet extraction.
However, the amount of ethyl acetate absorbed approximated the amount of acetone sorbed
during reflux. In contrast, during Soxhlet extraction, the level of acetone absorbed (7.76
mmole) exceeded the level of ethyl acetate absorbed (4.31 mmole) by the pellets. During
Soxhlet extraction, the extraction temperature may not be equivalent to the boiling point of
the solvent, since the boiled solvent condenses before dropping into the extraction thimble.
Therefore, the extraction temperature is not expected to be a major parameter controlling
the differences in the sorption of acetone and ethyl acetate during Soxhlet extraction.
82

Chapter 4
Instead, the solubility difference (∆δ) and sorbent molecular size could be affecting the
amount of ethyl acetate and acetone sorbed during Soxhlet extraction. Since ∆δ and
molecular size are smaller for acetone (∆δ = 0.2 Mpa1/2) than is for ethyl acetate (∆δ = 1.9
Mpa1/2), the level of acetone absorbed by the pellets is higher.
During reflux (as opposed to Soxhlet extraction), the extraction temperature is equivalent to
the boiling point of the solvent, since the polymer pellets are in direct contact with the
refluxing solvent. Therefore, both ∆δ and extraction temperature could have an effect on
the degree of sorption during reflux. Since the boiling point of ethyl acetate (77°C) is
higher than that of acetone (56°C), the amount of ethyl acetate absorbed approximated the
amount of acetone absorbed, despite the latter solvent having a smaller ∆δ and molecular
size.
An observation that was made during the reflux sorption analysis was that the pellets
clumped together and turned white after the addition of DCM or chloroform. However,
when the pellets were in contact with ethyl acetate and acetone, they were slightly opaque
and separated from one another in solution. The DCM and chloroform reflux extracts were
either cloudy (chloroform) or contained white solid particles (DCM), whereas the ethyl
acetate and acetone were clear. The white particulates could be extracted oligomers, which
may be more soluble in chloroform than in DCM. Weighing the white solid particles after
evaporating off the solvent supported the supposition that chloroform extracted more
oligomers from PET than DCM, possibly due to solubility effects. The percentage (by
mass) of solid extracted was 0.46%, 1.13%, 0.05%, and 0.06% for DCM, chloroform, ethyl
acetate and acetone respectively.
Since DCM showed the best swelling character during the sorption studies, it was selected
as the solvent for the Soxhlet extraction of washed and dried flake. A solvent that swells
the polymer appreciably would presumably extract the “freely diffusible” substances which
are dissolved in the amorphous region of the polymer matrix. However, “sorbed” or
“bound” substances localized at active sites or “holes” within the glassy polymeric matrix
may not migrate into the extraction solvent. Total dissolution using aggressive solvents
such as TFA and HFIP would theoretically dissipate the polymer chains away from each
other and extract the entrapped components. However, past researchers have not
83

Chapter 4
investigated the efficiency of total dissolution towards extracting constituents confined in
“holes” of the polymer matrix. There is the chance that some contaminants may be
entrapped in “holes” of entangled chains or crystallites, whose attraction forces cannot be
overwhelmed by interaction with the solvent. Undissipated polymer chains may not be
visually identified, hence just because the polymer appears totally dissolved, in reality there
may be some polymer chains grouped together.
The presence of PEN as a co-polymer of PET could further complicate extraction. PEN
increases glass transition temperature, improves static chain packing and decreases local
segmental mobility (Mc Dowell et al. 1998). The reduction in local scale mobility and
rotational motion of the bulky, stiff 2,6-naphthalate units results in a lower free volume and
thus lower diffusion coefficients of penetrants and migrants (Mc Dowell et al. 1998). Also
the strong intermolecular forces between chains of PEN may inhibit solvent penetration and
therefore the extraction of molecules that are “entrapped” in cavities between the PEN
chains. In this case, a contaminant could be residing in a cavity waiting for an unlikely
neck opening to another cavity. Mc Dowell et al. (1998) demonstrated that the diffusivity
and solubility of acetone in PET/PEN decreased with the increased level of PEN. In
addition, samples rich in PEN could not be dissolved in TFA. The strong intermolecular
bonds may be preventing solvent molecules from establishing adequate interactions with
the whole polymer, thus preventing the molecules being carried off into solution.
The components entrapped in the polymer are likely to be those originating from the
original manufacture of the polymer. These could be localised between the biaxially
orientated chains during bottle manufacture. Post-consumer contaminants are likely to
diffuse throughout the amorphous region of the polymer and therefore have the potential to
be extracted by DCM, unless washing and drying at mild temperatures leads to thermally
induced crystallization, thus potentially trapping the formerly “diffusible” substances.
Theoretically, diffusion is not feasible in crystalline domains of the polymer matrix.
4.2.3 GC/MS analysis of DCM extracts of washed and dried flake
Qualitative analysis of washed and dried flake involved extracting the ground flake (0-300
µm) by Soxhlet for 24 h and analyzing the concentrated DCM extract by GC/MS. The GC
84

Chapter 4
chromatograms of the flake and blank extracts were superimposed and the peaks with mass
spectra unique to the washed and dried flake are indicated in Figure 4.2, which is a
chromatogram of the flake extract. It was anticipated that by grinding the polymer to a
smaller particle size, the path length for contaminant extraction would be reduced. This
would result in increased extraction efficiency and henceforth, improved detection of the
extracted contaminants.
Figure 4.2: Chromatogram of DCM extract for washed and dried flake.
The peak numbers in Figure 4.2 correspond to the compounds in Table 4.3. The PET
cyclic dimer and its corresponding ether eluted after 30 minutes. The peaks that were not
assigned in Figure 4.2 were present in the blank and therefore are not exclusive to the flake.
85
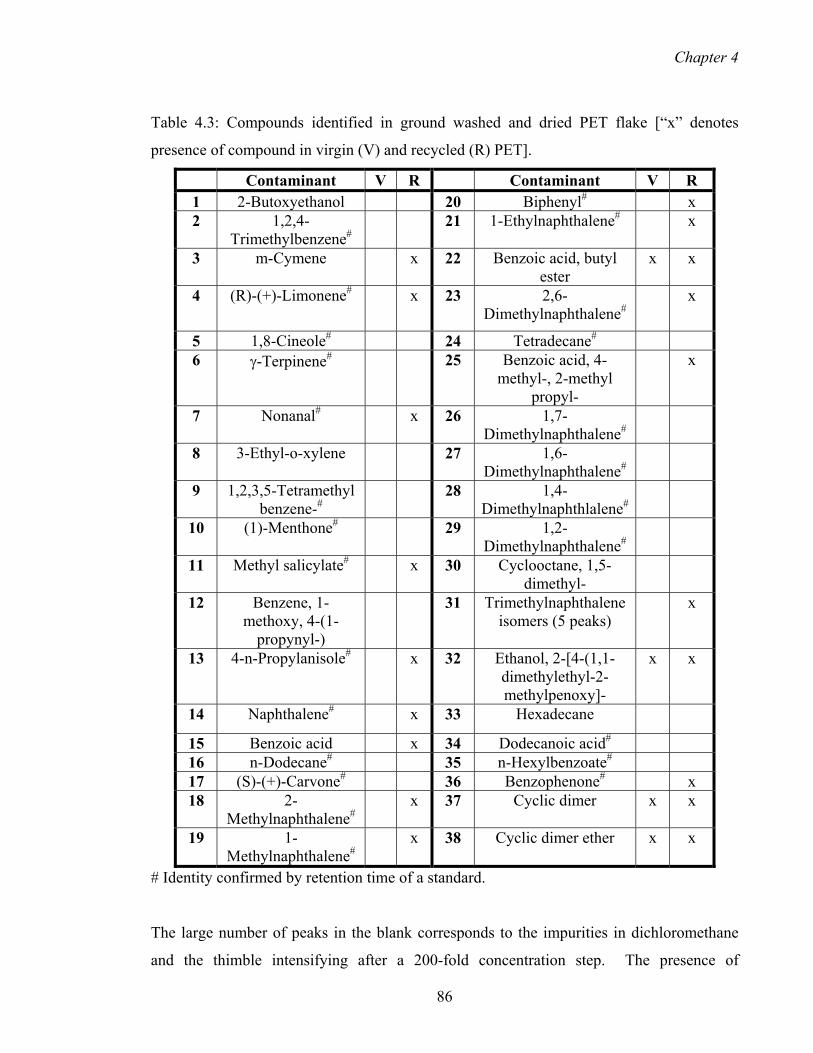
Chapter 4
Table 4.3: Compounds identified in ground washed and dried PET flake [“x” denotes
presence of compound in virgin (V) and recycled (R) PET].
Contaminant V R Contaminant V R 1 2-Butoxyethanol 20 Biphenyl# x 2 1,2,4-
Trimethylbenzene# 21 1-Ethylnaphthalene# x
3 m-Cymene x 22 Benzoic acid, butyl ester
x x
4 (R)-(+)-Limonene# x 23 2,6-Dimethylnaphthalene#
x
5 1,8-Cineole# 24 Tetradecane# 6 γ-Terpinene# 25 Benzoic acid, 4-
methyl-, 2-methyl propyl-
x
7 Nonanal# x 26 1,7-Dimethylnaphthalene#
8 3-Ethyl-o-xylene 27 1,6-Dimethylnaphthalene#
9 1,2,3,5-Tetramethyl benzene-#
28 1,4-Dimethylnaphthlalene#
10 (1)-Menthone# 29 1,2-Dimethylnaphthalene#
11 Methyl salicylate# x 30 Cyclooctane, 1,5-dimethyl-
12 Benzene, 1-methoxy, 4-(1-
propynyl-)
31 Trimethylnaphthalene isomers (5 peaks)
x
13 4-n-Propylanisole# x 32 Ethanol, 2-[4-(1,1-dimethylethyl-2-methylpenoxy]-
x x
14 Naphthalene# x 33 Hexadecane
15 Benzoic acid x 34 Dodecanoic acid# 16 n-Dodecane# 35 n-Hexylbenzoate# 17 (S)-(+)-Carvone# 36 Benzophenone# x 18 2-
Methylnaphthalene# x 37 Cyclic dimer x x
19 1-Methylnaphthalene#
x 38 Cyclic dimer ether x x
# Identity confirmed by retention time of a standard.
The large number of peaks in the blank corresponds to the impurities in dichloromethane
and the thimble intensifying after a 200-fold concentration step. The presence of
86
Chapter 4
interfering peaks during chromatography is one of the disadvantages of solvent extraction.
Thermal extraction methods (e.g. static headspace, SPME, thermal desorption analysis) are
employed to circumvent solvent interferences and reduce sample preparation and extraction
time. However, they are not as suitable as the solvent extraction methods for the analysis
of semi-volatiles and non-volatiles. Automated solid-fluid techniques such as SFE and
ASE utilize smaller amounts of solvent compared with manual techniques such as Soxhlet
extraction and ultrasonication, therefore are expected to generate extracts with less
interference. Despite this advantage, Soxhlet extraction was selected as the prime
extraction method due to the unavailability of the alternatives. The fact that Soxhlet
extraction involves the replenishment of the sample compartment with fresh extraction
solvent at regular time intervals makes it more appealing than ultrasonication, whose
extraction efficiency could succumb to the effects of a decreasing concentration gradient
with time.
In addition, Soxhlet extraction of non-volatile components using a high boiling solvent,
could be more beneficial than ultrasonication, whose extraction temperature would not
reach that imposed by Soxhlet extraction. This theory assumes the effects of temperature
on diffusion and solubility during solvent extraction is greater than that of ultrasonic waves.
The compounds that were identified in ground virgin PET (particle size = 0-300 µm) or
recycled (extruded) PET pellets are denoted by an “x” in Table 4.3. Those compounds that
are not detected in the virgin polymer are considered foreign (“contaminants”) to the post-
consumer PET. As indicated in Table 4.3, there were 34 contaminant peaks exclusively
identified in the post-consumer PET. Five trimethylnaphthalene isomers were identified,
however they are grouped together as “trimethylnaphthalene isomers” (peak 31) because
they were not unequivocally distinguished from one another. Due to the similarity in mass
spectra for the trimethylnaphthalene isomers, there was not enough confidence in the MS
library search results to distinguish between the isomers. Ideally, standards should be run
to unequivocally distinguish between the isomers.
This large number of “contaminants” identified (34) is not surprising due to the permeable
nature of PET (relative to glass) and the history of the pre-used containers. However, Huber
and Franz (1997a) extracted 74 contaminants from extruded HDPE granules by the same
87

Chapter 4
extraction method and GC/MS. This result underlines the higher permeability of HDPE
relative to PET and/or suggests that a more diverse range of packaging types enter the
HDPE recycling stream providing alternative sources of contamination relative to the PET
recycling stream, whose feed is generally limited to beverage bottles. Devlieghere et al.
(1997) also observed that polyolefins (PP, HDPE) and PVC retained significantly more
contaminants compared with the more polar polymers (PC and PET). It is presumed that
the favorable cohesive energy, polarity, intermolecular packing and high Tg of PET provide
superior resistance to contaminant sorption (Gavara et al. 1997, Arora and Halek et al.
1994, Van Willige et al. 2002, Paik 1992).
Table 4.3 implies that virgin PET is relatively free of semi-volatile migratory compounds.
This finding supports the well-established fact that virgin PET is generally free of additives
compared with other, less stable polymers, which require additives to maintain their
stability and improve their flexibility. In fact Eastman, the manufacturer of the virgin PET
analysed in the current study, have acknowledged the absence of additives in their polymer.
Therefore the presence of mobile components in virgin PET is only expected to arise from
the polymer’s original manufacture (e.g. starting materials, monomers, reaction by-
products), as already presented by researchers (St Küppers 1992, Begley and Hollifield
1989).
Although PET has the reputation for being generally free of additives and other mobile
compounds, there have been some solvent extraction studies (e.g. maceration with
dichloromethane; Soxhlet extraction with ethanol) that have found hydrocarbons, BHT,
BHA, Erucamide, Tinuvin P, phthalates and adipates in PET bottles (Monteiro et al. 1996,
Kim et al. 1990, Van Lierop 1997). As a result, PET obtained from different manufacturers
could contain different mobile constituents, depending on what the producer adds to the
polymer during its manufacture. Provided these constituents are not transferred into food at
levels that could endanger human health or affect the quality of food, their presence in PET
is not of great concern.
Since the post-consumer PET bottles that enter the recycling stream derive from an
extensive range of virgin PET manufacturers, some of the compounds identified in the
washed and dried flake, but not in our virgin PET, could nonetheless arise from the original
88

Chapter 4
manufacture of the polymer, depending on its source. However, it is impossible to analyze
the different virgin PET available in order to unequivocally verify whether the migrants
derive from post-consumer use or original polymer manufacture.
As presented in Table 4.3, two low molecular weight cyclic oligomers (peaks 37 and 38 in
Table 4.3), possibly formed during melt polymerization, were identified in the virgin and
post-consumer PET. These oligomers were presumed to be that of the cyclic dimer (peak
37) and dimer ether (peak 38), whose mass spectra and structures are shown in Figures 4.3
(a) and (b). The mass spectra for these peaks are not present in the spectral library.
However, they are closely matched with those reported by Buiarelli et al. (1993) and
Monteiro et al. (1996). These authors suggested that the ions of m/e 341 and m/e 385 in
the mass spectra could be due to M-43 (i.e., M – CH2CHO). Another prominent ion in both
spectra was m/e 296, which could be due to the (CO [C6H4COOC H2]2) fragment.
The remaining two compounds identified in virgin PET (peaks 22 and 32, Table 4.3) could
have possibly resulted from the degradation, oxidation, recombination and rearrangement
of the starting materials. Their library match results were only about 72 and 40 per cent for
peaks 22 and 32 respectively, therefore the identification of these compounds was not
reliable and speculation on their origin will not be pursued. Conversely, the assignment of
the “contaminant” peaks in Table 4.3 by computer matching on the MS database was more
reliable. For all significant peaks, the highest probability match was assumed for the
assignments of identity by the database. For 83% of peaks there was a greater than 90%
confidence limit, whilst for 13% the confidence limit was 80-90% and for the remaining
4% the confidence limit was <80% but >70%. Standards were purchased for most of these
compounds and identity was confirmed by coincidence of retention time. This was
especially important for the naphthalene isomers, which had different retention times but
similar mass spectra. As mentioned earlier, of all the naphthalene isomers identified, only
the trimethylnaphthalene isomers were not distinguished from one another by means of
standards.
89

Chapter 4
Figures 4.3: Mass spectrum and structure of (a) cyclic dimer and (b) dimer ether.
(a)
O
CH2CH2 O
C O
O
C
C O C O
O CH2CH2 O
(b)
O
CH2CH2 O
C O
O
C
C OO
C OO
CH2 CH2 O CH2 CH2
The number and the relative area of contaminants identified in recycled PET were
reproducibly lower than that in the ground flake. At this stage, the reasons behind this
observation could be two-fold: (a) the extraction efficiency from extruded pellets is lower
than that from the powdered flake, and (b) the extrusion step of the recycling process
further reduces the level of contaminants in the post-consumer PET. As concluded from
90

Chapter 4
subsequent chapters of the current thesis, the likely reason for this observation is (b), seeing
that the Soxhlet extraction method has been demonstrated to be exhaustive for “freely
diffusible” contaminants in PET. Extrusion has already been shown to be effective in
reducing the levels of contaminants in post-consumer washed and dried PET, especially the
levels of volatile contaminants, which readily volatilise under extrusion conditions
(Triantafyllou et al. 2002, Harding et al. unpublished).
Compounds directly involved in polymer formation such as ethylene glycol, terephthalic
acid, dimethyl terphthalate, BHET and MHET were not identified in the Soxhlet extracts
for one or a combination of the following reasons:
(a) The compounds are too polar (e.g. alcohols and carboxylic acids), therefore must be
derivatised and/or run on a more polar column (e.g. EC-Wax Econo-cap column) to
improve GC/MS sensitivity (Kim et al. 1990, Atkinson et al. 1971). For example,
dicarboxylic acids tend to give poor gas chromatographic peaks, broadening and
tailing and are therefore derivatised to their trimethylsilyl or methyl derivatives
(Atkinson et al. 1971, Gramshaw 1995). Previously, HPLC has been a successful
technique for analyzing all of these compounds - other than ethylene glycol, which
does not posses a chromophore - without derivatisation (Begley and Hollifield
1989).
(b) The components are entrapped within the polymer matrix and cannot be
accessed/extracted by the solvent. Total dissolution techniques are employed to
disperse the polymer matrix and extract these compounds.
(c) The level of these compounds is below the limit of detection.
(d) The compounds may be held in the polymer matrix by hydrogen bonding, whose
attraction forces cannot be overcome by the presence of a non-polar or weakly polar
extraction solvent.
91

Chapter 4
(e) Interfering peaks may have obscured the presence of these compounds in the
GC/MS chromatogram. An extraction method that uses smaller quantities of
solvent (e.g ASE or SFE) or no solvent (e.g. thermal extraction techniques) should
be used to exclude interfering peaks from analysis.
Other compounds that have been previously detected in virgin PET are p-xylene
acetaldehyde, high molecular weight oligomers and metal catalysts. These compounds
were not identified in our extracts for the following reasons:
(a) High molecular weight oligomers are non-volatile and therefore unlikely to be
identified by GC/MS. HPLC is normally used to separate and analyse oligomers
(Begley and Hollifield 1989). In some cases oligomers can be broken down by
hydrolysis; methylation of the hydrolysed extracts then makes them appropriate for
GC analysis (Gramshaw et al. 1995).
(b) Acetaldehyde is very volatile (boiling point = 21ºC), therefore volatilises during
extraction, prior to GC/MS analysis. Acetaldehyde is normally analysed by static
headspace to avoid loss during extraction (Dong et al. 1980, Wyatt 1983, Franz and
Welle 1999b).
(c) p-Xylene could be co-eluting with the solvent peak, which is not analysed by the
MS. Thermal extraction techniques (e.g. static headspace, SPME) could be used to
analyse p-xylene and other volatile compounds that co-elute with the solvent peak.
(d) Metals cannot be identified by GC/MS. Spectroscopic methods such as atomic
absorption (AA), or inductively coupled plasma (ICP) must be employed for the
analysis of metals in the acid-digested extract of PET.
These points underline the limitations of the Soxhlet extraction technique and GC/MS
method and call for a diverse range of techniques to be used in order to cover all types of
constituents in PET.
92

Chapter 4
4.2.4 Qualitative analysis of washed and dried flake extracted by total dissolution
In order to theoretically extract any compounds resisting Soxhlet extraction from the PET
matrix, the washed and dried flake was first dissolved in either TFA (for the analysis of
non-polar compounds) or HFIP (for the analysis of polar compounds) to disperse the
polymer matrix and theoretically release the entrapped contaminants. The components
were then solvent extracted with heptane for the analysis of non-polar compounds in the
case of TFA dissolution. For HFIP, methanol was added to re-precipitate the polymer prior
to GC/MS analysis, as outlined in Chapter 3 (Section 3.1.10.3).
The dissolution technique has been readily used for the extraction of surrogate compounds
from PET during challenge tests (Komolprasert and Lawson 1995, Harding et al.
unpublished). Dissolution of polymers involves two stages. Firstly, solvent molecules
gradually diffuse into the polymer producing a swollen gel. This gel then gradually
disintegrates as yet more solvent enters the gel and as the molecules of solvated polymer
gradually leave the gel and are carried out into solution. This latter stage is sped up by
ultrasonication, which has been used in our method.
Cross-linking, crystallinity, hydrogen bonding and the absence of chain branching could
hinder the polymer dissolution (Nicholson 1991). Therefore, it is unclear whether the
dissolution procedure is 100% effective towards extracting contaminants from PET; the
contaminants could be residing in “holes” between polymer chains, which may not be
readily accessed by the solvent. However, one can assume the extraction efficiency for the
total dissolution is at least the same, if not greater, than that for Soxhlet extraction using
non-dissolving solvents such as DCM.
Table 4.4 lists the compounds extracted from washed and dried flake by total dissolution
using TFA and followed by liquid-liquid extraction with heptane.
93

Chapter 4
Table 4.4: Compounds extracted from washed and dried flake by total dissolution using
TFA/heptane [“x” denotes presence of contaminant in virgin (V) and recycled (R) PET].
Contaminant V R Contaminant V R 1 m-Cymene x 12 Benzene, 1-methyl-4-
(1-methylethyl)-2 -nitro
x
2 Nonanal x 13 1,7-Dimethylnaphthalene
x
3 Benzene, 1-methoxy, 4-(1-propynyl-)
x 14 1,6-Dimethylnaphthalene
4 Naphthalene x 15 Benzoic acid, 4-methyl-, 2-
methylpropyl-
x
5 4-n-Propylanisole x 16 1,4-Dimethylnapthlalene
x
6 2-Methylnaphthalene x 17 1,2-Dimethylnaphthalene
x
7 1-Methylnaphthalene x 18 Trimethylnapthalene isomers (5 peaks)
8 1,2-Ethanediol, dibenzoate
x x 19 Benzophenone x
9 Biphenyl x 20 Cyclic dimer x x 10 1-Ethylnaphthalene x 21 Cyclic dimer ether x x 11 2,6-
Dimethylnaphthalene x
The corresponding chromatogram for the heptane extract is shown in Figure 4.4. The
cyclic dimer and its corresponding ether are not present in Figure 4.4 because they eluted
later in the chromatogram (after 30 minutes). A total of 21 compounds were identified in
the flake’s chromatogram after it was superimposed with the blank’s chromatogram. The
discrepancy in the number of components determined by Soxhlet extraction (38 peaks) and
total dissolution using TFA (21 peaks) could have occurred due to any of the following
reasons:
(a) The TFA is aggressive and therefore could cause some contaminants to breakdown.
Nerin et al. (2002) addressed the severity of the total dissolution procedure towards
limonene in view of the lack of GC/MS response.
94

Chapter 4
(b) Heptane has more interfering impurity peaks than DCM, even though it was
distilled prior to liquid-liquid extraction. Selected ion monitoring (SIM) with
retention time coincidence has been used in the next section (Section 4.3) to verify
the presence of some contaminants identified in the total ion chromatogram (TIC) of
the Soxhlet extract.
(c) The concentrations of some contaminants in the ground flake (extracted by Soxhlet)
could be greater than in the unground flake (extracted by total dissolution).
Despite the discrepancy in the number of contaminants extracted by both techniques, the
presence of many contaminants in post-consumer flake extracted by Soxhlet extraction was
confirmed by the identification of the same contaminants in the heptane extract.
Figure 4.4: Chromatogram of TFA/heptane extract for washed and dried flake.
The compounds extracted by total dissolution with TFA but not by means of Soxhlet
extraction are peak 8 (1,2-ethanediol, dibenzoate) and peak 12 [benzene, 1-methyl-4-(1-
methylethyl)-2 –nitro]. Peak 8 was also present in virgin PET; therefore it is assumed to be
a polymerization by-product. Peak 12 was absent from virgin PET, however in its absence,
a similar compound (benzene, 3-dimethyl-2-nitro-) was identified in virgin PET.
95

Chapter 4
Therefore, the likelihood of peak 12 being a contaminant in flake was weakened by the
presence of the analogue in virgin PET. There exists the possibility that the components
corresponding to peaks 8 and 12 are entrapped through electrostatic bonding or in “holes”
within the polymer matrix and therefore cannot be extracted unless aggressive solvents
such as TFA disperse the polymer’s structure.
The constituents of PET were also extracted by total dissolution using HFIP, as performed
in past studies (Begley and Hollifield 1989, Triantafyllou et al. 2002, Komolprasert et al.
1995). The compounds identified in the flake extract after comparison with the blank are
presented in Table 4.5. The corresponding peaks are presented in the flake chromatogram
in Figure 4.5.
Table 4.5. Constituents of PET were also extracted by total dissolution using HFIP [“x”
denotes presence of contaminant in virgin (V) and recycled (R) PET].
Contaminant V R Contaminant V R 1 Benzoic acid 5 Benzene, 1,1’-(1,2-
ethenediyl) bis- x x
2 Methyl salicylate 6 Terephthalic acid, methyl vinyl ester
x x
3 Isoquinoline x x 7 Dimer x x 4 Benzophenone x 8 Dimer ether x x
The number of compounds identified in the HFIP extract was much lower than the numbers
determined in the Soxhlet and TFA/heptane (total dissolution) extracts. This could be a
consequence of the large number of interfering peaks in the HFIP extract resulting from the
large volumes of solvents used during extraction. Most of the compounds listed in Table
4.5, apart from peak 5, contain polar functional groups, for which the extraction method is
supposedly specific. Another way of extracting polar compounds by total dissolution was
reported by Bayer (2002), who dissolved the PET in TFA and partitioned the polymer
constituents into methyl tertiarybutyl ether.
96
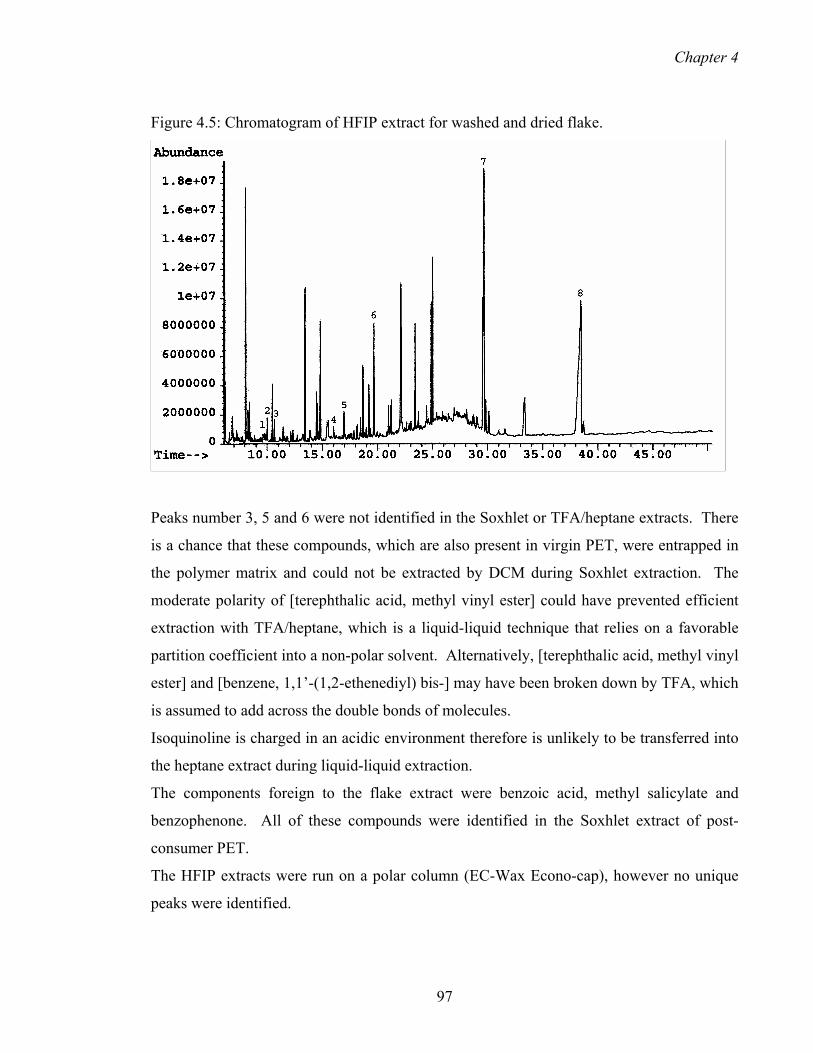
Chapter 4
Figure 4.5: Chromatogram of HFIP extract for washed and dried flake.
Peaks number 3, 5 and 6 were not identified in the Soxhlet or TFA/heptane extracts. There
is a chance that these compounds, which are also present in virgin PET, were entrapped in
the polymer matrix and could not be extracted by DCM during Soxhlet extraction. The
moderate polarity of [terephthalic acid, methyl vinyl ester] could have prevented efficient
extraction with TFA/heptane, which is a liquid-liquid technique that relies on a favorable
partition coefficient into a non-polar solvent. Alternatively, [terephthalic acid, methyl vinyl
ester] and [benzene, 1,1’-(1,2-ethenediyl) bis-] may have been broken down by TFA, which
is assumed to add across the double bonds of molecules.
Isoquinoline is charged in an acidic environment therefore is unlikely to be transferred into
the heptane extract during liquid-liquid extraction.
The components foreign to the flake extract were benzoic acid, methyl salicylate and
benzophenone. All of these compounds were identified in the Soxhlet extract of post-
consumer PET.
The HFIP extracts were run on a polar column (EC-Wax Econo-cap), however no unique
peaks were identified.
97

Chapter 4
4.2.5 Running the extracts on polar column
The Soxhlet extract for the flake and blank (with DCM) were analysed on an EC-Wax
Econo-cap (polyethylene glycol) column. The compounds identified in the flake are listed
alongside their chromatogram retention times in Table 4.6.
Table 4.6: Soxhlet extract run on an EC-Wax Econo-cap column.
Retention time
Contaminant Retention Time
Contaminant
1 5.883 Limonene 14 13.299 1-Methylnaphthalene 2 5.980 Cineole 15 13.724 Cyclopropane, nonyl-3 6.233 Benzene, 1-ethyl-2-
methyl- 16 13.893 Dimethylnaphthalene
isomer 4 6.765 m-Cymene 17 14.165 Dimethylnaphthalene
isomer 5 6.915 Benzene, 1,3,5-
trimethyl- 18 14.219 Dimethylnaphthalene
isomer 6 7.002 Undecane 19 14.138 Biphenyl 7 8.257 Ethanol, 2-butoxy-# 20 14.138 Biphenyl, 3-methyl- 8 9.166 1-Hexanol, 2-ethyl- 21 15.128 Trimethylnaphthalene
isomer 9 9.245 Tritetracontane 22 15.068 Trimethylnaphthalene
isomer 10 10.647 1,2-Ethanediol# 23 19.189 Benzophenone 11 12.216 Methyl salicylate 24 19.630 Benzoic acid, butyl
ester 12 12.626 Benzene, 1-methoxy
4-(1-propenyl)- 25 20.221 Dodecanoic acid
13 12.93 2-Methylnaphthalene # Identity confirmed by retention time of standard.
Many of the contaminants identified were also observed on a semi-polar 5% phenyl
polymethylsiloxane column (Table 4.3), however there were several exceptions. These
exceptions were peaks 6, 8, 9, 10, 20. The different selectivity of the column may have
contributed to the separation of these peaks away from interfering peaks. For example, [1-
hexanol, 2-ethyl-] (peak 8) was identified as a co-eluting peak (with m-cymene) on the non-
polar column whilst it was totally separated on the polar column.
The identification of 1,2-ethanediol was also possible on the polar column. The high
polarity of this compound could have made it less compatible on the non-polar column. It
98

Chapter 4
is proposed that due its the lack of interaction with the stationary phase 1,2-ethylene glycol
eluted early in the run, during the solvent delay time. This compound is normally
derivatised prior to analysis when using a non-polar column (Kim et al. 1990). However,
Morelli-Cardoso et al. (1997) and Kashock and Breder (1980) analysed it in aqueous food
simulants by GC using a polar column (EC-Wax Econo-cap).
Other polar compounds involved in the manufacture of PET (e.g. terephthalic acid, BHET,
MHET) were not identified.
The identities of most compounds in Table 4.6 were not confirmed by coincidence in
retention time with standards. Therefore, the dimethylnaphthalene and
trimethylnaphthalene isomers were not distinguished from each other.
4.2.6 Possible origin of the components
As already mentioned in Section 2.3.3, foreign components in post-consumer PET (prior to
recycling) could arise from three possible sources – the original use of the packaging,
consumer abuse/misuse and microbial contamination. Ironically, contaminants could also
be introduced during recycling (e.g. labels running during the wash and dry stage of the
recycling process, contamination from detergents etc).
Many of the compounds identified in PET flake (Table 4.3) could be traced back to the
original contents of the PET container. For example, methyl salicylate, menthone, (+)-
carvone and 1,8-cineole are found in mouthwash whilst limonene and γ-terpinene are
constituents of soft drinks. Some of these compounds could also have been mixed into
household cleaners, such as dishwashing detergents, in order to transmit a citrus fragrance
or provide antiseptic properties (Bayer 2002). All of these compounds have been reported
as contaminants in post-consumer PET by other researchers (Bayer 2002, Franz and Welle
1999b).
There were other contaminants whose origin was not so evident, such as naphthalene and
its methyl ethyl derivatives. Naphthalene has already been identified in low-density
polyethylene (LDPE) at 0.7 and 2 ppm levels (Lau and Wong 1994, 1995). It was
presumed in those studies that naphthalene contamination resulted from a polluted
environment, for example, from lacquer, paint and mothballs. Gramshaw et al. (1995)
99
Chapter 4
identified naphthalene in poly(ethersulphone) and thermoset polyester. The possible origin
of these two compounds was not discussed.
Naphthalene, along with 1-methylnaphthalene and 1,6-dimethylnaphthalene, was also
detected in PET multilayer films (Freire et al. 1998). The origin of these naphthalene
derivatives was suggested to be printing inks, but we have extracted the only evident source
of printing inks (labels) and have not detected naphthalenes. From our knowledge of the
industry, PET sources, etc. it is believed that the above origins are not responsible for the
presence of naphthalenes in our PET. In 1998 Coca Cola Australia manufactured two
million bottles from poly(ethylene naphthalate) at its Newcastle plant (NSW). Two years
later when we sampled the washed and dried flake, there can be little doubt that a
significant amount of PEN would still be in curbside collections as old PEN bottles. The
alkylnaphthalene isomers and naphthalene in PEN could also have formed during the
preparation of 2,6-dimethylnaphthalene, a precursor of 2,6-naphthalene dicarboxylic acid,
which is reacted with ethylene glycol to produce PEN.
Additionally, it is possible that there were some naphthalene-based acids present as
impurities in feedstock at the point of manufacture. As virgin PET is imported into
Australia from several Southeast Asian countries, we have been unable to establish the
veracity or frequency of this. In the one batch of virgin PET we have monitored, there
were no naphthalenes.
It is also feasible that naphthalene sulphonate derivatives could have been used during the
wash process (in detergents) as emulsifiers.
Dodecanoic acid – which we will see later to be the highest-level contaminant from the
washed and dried shredded flake – does not appear to have any logical source associated
with the PET per se. The very high levels consistently detected suggest to us that it is
probably derived from detergents used in the washing process. However, we do not have
any data to verify this. Kim et al. (1990) identified three fatty acids (palmitic acid, oleic
acid and stearic acid) in a commercial amber PET bottle wall. Gramshaw et al. (1995)
identified dodecanoic acid in PET and other fatty acids in thermoset polyester and
poly(ethersulphone) (e.g. hexanoic acid, heptanoic acid, benzoic acid). Benzoic acid was
also identified in the Visy washed and dried flake, presumably as a break down product of
terephthalic acid. Benzoic acid is occasionally added as a preservative to soft drink such as
100

Chapter 4
Coca Cola, thus there was a chance that this compound diffused into PET during soft drink
storage. Bayer (2002) reported the occurrence of benzoic acid amongst many other
compounds in PET feedstock entering the recycling stream. Other compounds that were
identified by this author and that were also present in our analysis of washed and dried
flake were methyl salicylate, (+)-carvone, 1,8-cineole, p-cymene, limonene, (γ)-terpinene,
nonanal, undecane, hexadecane, benzophenone, menthone, [1-hexanol, 2-ethyl-] and
[benzene, 1-methoxy, 4-(1-propenyl-)]. A total of 121 components were identified from
five feedstock materials by thermal desorption GC/MS analysis. The absence of interfering
solvent peaks could account for the large number of components identified by thermal
analysis relative to the solvent extraction carried out in the current chapter.
Benzophenone is primarily used as a photoinitiator and fragrance enhancer; therefore it is
often used in polymer production and added to beverages. This compound, however, was
not present in the virgin PET we analysed, therefore the latter source seemed more likely.
Nevertheless, the virgin PET used to make the post-consumer soft drink bottles could have
originated from a diverse range of manufacturers that use benzophenone in their PET
production.
Benzophenone was used as a ‘non-volatile polar surrogate’ during challenge tests and is
generally the most challenging compound to be removed by recycling (Harding et al.
unpublished, Franz et al. 1998, Franz and Welle 1999a). As benzophenone has a low
volatility and similar solubility parameter to PET, it is not surprising that it was the most
persistent (Harding et al. unpublished).
Another high-level contaminant, 2-butoxyethanol, could logically be derived from the
ethylene glycol PET reagent during degradation of PET, especially at elevated
temperatures. On the other hand, this contaminant was not present in the virgin PET we
have analysed. Gramshaw et al. (1995) identified 2-ethoxyethanol in thermoset polyester
and speculated that it could be a solvent residue.
101
Chapter 4
4.3 QUANTITATIVE STUDY OF CONTAMINANTS IN WASHED AND DRIED
PET FLAKE
4.3.1 Introduction
Unless contaminant levels are proven to be acceptably low (i.e., below the US FDA
threshold of 215 ppb), post-consumer PET could pose a health threat to the consumer if the
components migrate into food. Therefore, before food-contact safety could be officially
declared, the level of each contaminant in recycled PET must be determined and proven to
fall below the threshold of regulation. If the levels are above 215 ppb, migration testing
into food simulants should be instigated and the amount of each contaminant migrating
must not exceed 10 ppb to assure food safety.
The purpose of this section was to determine the level of foreign components in washed
and dried flake. Soxhlet extraction was the prime extraction method used because it
accounted for the identification of more contaminants relative to the total dissolution
extraction methods (Section 4.2). In addition, DCM is not as aggressive as TFA and HFIP,
which could lead to the molecular breakdown of some polymer constituents (e.g.
limonene).
Soxhlet extraction involves the diffusion of components out of the core of the polymer
matrix into the extraction solvent; therefore the amount of contaminant extracted out of
PET is dependent on three diffusion related parameters: particle size, temperature and time.
The effects of particle size and time on extraction were investigated in this section and the
optimum conditions were selected for further extractions of washed and dried flake.
Other processes that impede extraction once the contaminants defuse to the surface of the
polymer particles is their transfer from the surface and solubility in DCM. As shown in
Figure 4.6, the polymer particles are thought to be in contact with a stagnant layer of
solvent through which the contaminants have to pass to enter the “free” solvent. Lou et al.
(1997) suggested that raising the temperature could increase diffusion of contaminants
through the stagnant layer and improve solubility in DCM. It is also thought that
102

Chapter 4
sonication could improve migration through the stagnant layer. Sonication will be another
solvent extraction technique addressed throughout this thesis.
Figure 4.6: Schematic presentation of the three subsequent steps in solvent extraction.
M
Stagnant solvent layer
Polymer particle
The temperature used during Soxhlet extraction
which is 40°C. Using a solvent with a higher
temperature, however this was not considere
components, as discussed in Section 4.1.3. Th
already been demonstrated during the SFE, M
Lou et al. 1997; St. Küppers 1992; Camacho an
4.3.2 Study of extraction kinetics for flake grou
During this investigation the washed and drie
size efficiently possible (0-300 µm). The grou
specified in Figures 4.7-4.10, which display th
contaminants in ground washed and dried flak
that 24 h was adequate to completely extract
As seen in Figure 4.7, the two possible excepti
both of which appear not to have reached max
of extraction times. However, as illustrated
incomplete extraction of both contaminants i
realized that the error bars represent only one
determined is approximately twice as large.
103
DC
was restricted to the boiling point of DCM,
boiling point could increase the extraction
d due to the concern with losing volatile
e effects of temperature on extraction have
AE and ASE of polymers (Lou et al. 1996;
d Karlsson 2000).
nd to 0-300 µm
d flake was ground to the smallest particle
nd polymer was then extracted for the times
e kinetics of the extraction process for the
e. From this kinetic study it was observed
most contaminants out of the ground flake.
ons are 4-n-propylanisole and (-)-menthone,
imum extraction throughout the entire range
in Figure 4.10, error bars indicate that the
s probably incorrect, especially when it is
standard deviation and the range of values

Chapter 4
Figure 4.7: Soxhlet extraction kinetic study of washed and dried flake ground to 0-300 µm.
Compounds identified at levels below 200 ppb.
0
20
40
60
80
100
120
140
160
180
200
0 20 40 60 8Time (hours)
Am
ount
Ext
ract
ed (p
pb)
0
1,2,4-Trimethylbenzene Dodecane1,6-Dimethylnaphthalene 2,6-Dimethylnaphthalene1,7-Dimethylnaphthalene n-Hexylbenzoate1-Methylnaphthalene TetradecaneCineole 1,4-Dimethylnaphthalenegamma-Terpinene Naphthalene4-n-Propylanisole 1-EthylnaphthaleneBiphenyl (-)-Menthone1,2-Dimethylnaphthalene m-Cymene3-Ethyl-o-xylene 1,2,3,5-, tetramethylbenzene
104

Chapter 4
Figure 4.8: Soxhlet extraction kinetic curves of trimethylnaphthalene isomers extracted
from washed and dried flake ground to 0-300 µm.
0
5
10
15
20
25
30
35
40
0 20 40 60 8
Time (hours)
Con
cent
ratio
n (p
pb)
0
Trimethyl Naphthalene Isomer 1 Trimethyl Naphthalene Isomer 2Timethyl Naphthalene Isomer 3 Trimethyl Naphthalene Isomer 4Trimethyl Naphthalene Isomer 5 Trimethyl Naphthalene Isomer 6
105

Chapter 4
Figure 4.9: Soxhlet extraction kinetic study of washed and dried flake ground to 0-300 µm.
Compounds identified at levels above 200 ppb.
0
200
400
600
800
1000
1200
1400
0 20 40 60 8
Time (hours)
Am
ount
Ext
ract
ed (p
pb)
0
Dodecanoic Acid 2-Butoxy Ethanol
Limonene Methyl salicylate
2-Methyl Naphthalene Benzophenone
106
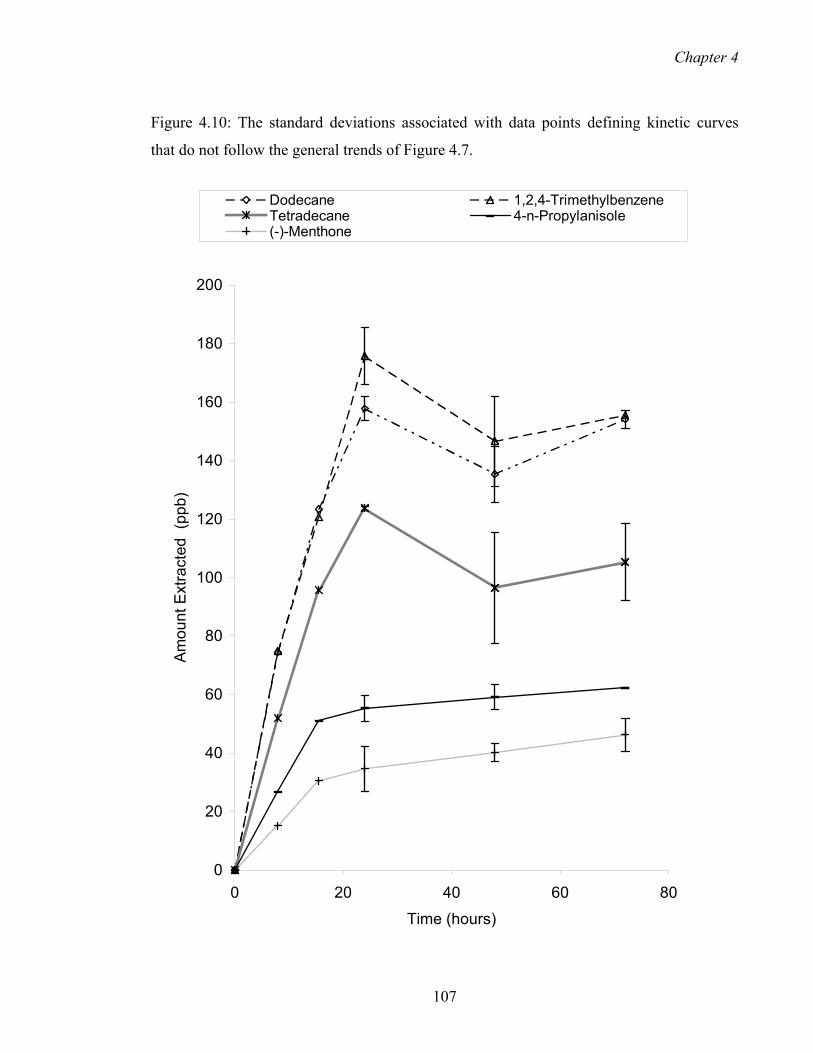
Chapter 4
Figure 4.10: The standard deviations associated with data points defining kinetic curves
that do not follow the general trends of Figure 4.7.
0
20
40
60
80
100
120
140
160
180
200
0 20 40 60 8
Time (hours)
Am
ount
Ext
ract
ed (
ppb)
0
Dodecane 1,2,4-TrimethylbenzeneTetradecane 4-n-Propylanisole(-)-Menthone
107

Chapter 4
Student t-tests comparing the amounts of n-propylanisole extracted at 24 and 48h, 48 and
72 h, and, 24 and 72 h yielded tcalc values of 0.97, 1.28 and 2.28, respectively. As the t
values at the 5% confidence level are either 2.78 or 3.28 (depending upon the number of
replicate analysis at each time), the differences in the amounts extracted are not significant.
The same is true for (-)-menthone where the equivalent tcalc values for the same number of
replicates are 1.18, 1.40 and 1.90. Figure 4.10 also displays the error bars for the analytes
exhibiting erratic recoveries verses time (in Figure 4.7) and whose irregular shapes are an
indication of irreproducibility. Again the student t-tests confirm that there is no significant
difference at the 5% level.
Similarly, Wim and Swarin (1975) monitored the extraction process of two additives from
polypropylene pellets and concluded that a plateau was reached by 24 h (using
tetrahydrofuran as an extracting solvent). Komolprasert et al. (2001) extracted PET sheets
with DCM for 24, 48, 72 and 96 hours, and concluded that the optimal extraction was 24 h.
Shorter extraction times were not considered in that study.
Further documentation of extraction kinetics of polymers by Soxhlet extraction is scarce.
There has been, however, greater emphasis in optimizing other, more time efficient
extraction techniques in polymer research, such as SFE (Bartle et al. 1990, Daimon and
Hirata 1991, Hunt and Dowle 1991).
The extraction kinetics of ethylene glycol are shown in Figure 4.11. Ethylene glycol is
unlikely to be a post-consumer contaminant and presumably originates from the original
manufacture of virgin PET. The apparent source of this ethylene glycol in the polymer may
explain why the amount extracted (approximately 30 ppm) exceeded that of all the
contaminants quantified. It is not unusual that the level of a compound inherited by the
polymer exceeded those that diffused into the PET bottle during its commercial use. This is
because ethylene glycol is directly added to PET during manufacture and therefore its
concentration in the polymer is not limited by its diffusion coefficient, as it is during
sorption in commercial use. The EEC regulation for the migration of ethylene glycol into
food is 30 ppm, therefore from these results, the washed and dried ground flake could be
considered appropriate for food contact applications in terms of ethylene glycol migration
since the amount extracted with DCM (30 ppm) is expected to surpass the level of the
actual migration into soft drink (i.e. the level of migration is expected to fall below 30
108

Chapter 4
ppm). This is because DCM is a more efficient extraction medium than soft drink whilst
causing polymer swelling.
Figure 4.11: Soxhlet extraction kinetic study of washed and dried flake ground to 0-300
µm. Ethylene glycol analysed on an EC-Wax Econo-cap column.
0
5000
10000
15000
20000
25000
30000
35000
0 10 20 30 40 50 60 70
Time (hours)
Am
ount
Ext
ract
ed (p
pb)
Ethylene Glycol
The dense packing of the polymer particles in the extraction thimble along with the
swelling or “softening” instigated by the solvent may have caused agglomeration of the
polymer particles. During polymer swelling the polymer chains become mobile and the
consequential softening or dissolution of the particle surface could result in the particles
blending into one another, especially if they are crammed side-by-side.
This coalescence was observed when attempting to remove the packed particulate matter
from the thimble – the particles were clumped together and no longer independent of one
another. Therefore, it was proposed that having PET fine particles in the extraction thimble
could have paradoxically extended the duration of extraction due to the decrease in the
surface area resulting from particulate fusion. Further extraction studies in this section will
validate this theory.
109

Chapter 4
A plot of the percentages of extraction at 8h (A8/Ae) versus contaminant molecular weight
is presented in Figure 4.12 (for compounds in figures 4.7-4.10). Note that in this plot
averages of the dimethylnaphthalene and trimethylnaphthalene isomers have been taken.
Figure 4.12: Ratio of amount extracted at 8 h (A8) to amount extracted after 24 h (Ae) (as a
percentage) versus contaminant molecular weight.
y = -0.0016x2 + 0.3438x + 30.955R2 = 0.6098
20
25
30
35
40
45
50
55
100 120 140 160 180 200 220 240Molecular Weight
(A8/
Ae)
*100
A R2 value of 0.61 for a second order polynomial of best fit indicates a weak correlation
between the variables. A linear fit (y = -0.18x + 73.11) gave a lower R2 value of 0.58.
110

Chapter 4
A better correlation would be expected if solvent penetration did not govern the rate of
contaminant migration, as it does in our case where the solubility parameters of DCM and
PET are closely matched. When this is not so, migration is generally Fickian and
predominantly dependent on the diffusion coefficient of the contaminant molecule, which is
proportional to size (Riquet et al. 1991, Feigenbaum et al. 1993). When a polymer is
swollen it is expected that there is less discrimination in the diffusion of migrants with
different size because the polymer matrix is more open up.
There are, however, other factors besides molecular weight that effect diffusion. These
include molecular shape and thus effective volume, and, functional group interactions
between the contaminant and the polymer.
The effective volumes of the naphthalene derivatives will be determined by their cross-
sectional areas perpendicular to the direction of diffusion and therefore there will be
differences in the resistance to diffusion, depending upon which cross sectional area is
presented. Table 4.7 lists the percentages of naphthalene derivatives extracted at 8 h and
alongside their molecular structure. Assuming diffusion in the horizontal direction, the
naphthalene derivative which is expected to have the most difficulty diffusing through the
polymer matrix (horizontally) is 1,4-dimethylnaphthalene because it has two methyl
substituents “para” to each other, increasing its effective volume and thus hindering its
movement between polymer chains in the horizontal direction.
Yet the fraction of 1,4-dimethylnaphthalene extracted at 8 hours (48.0%) was higher than
that of 2,6-dimethylnaphthalene (39.9%), 1,2-dimethylnaphthalene (44.6%), 1-
ethylnaphthalene (45.5%), and 1,7-dimethylnaphthalene (46.9%). The lowest percentage
extracted was observed for 2,6-dimethylnaphthalene (39.9%), which is likely to have a
smaller effective volume than 1,4-dimethylnaphthalene.
The fastest diffusion was expected for naphthalene since it has no substituents that could
obstruct its movement. In our study, the highest percentage extracted was observed for 1,6-
dimethylnaphthalene (51.0%). Therefore, in conclusion, the effective volumes of
naphthalene derivatives were not shown to have an impact on their level of extraction.
111
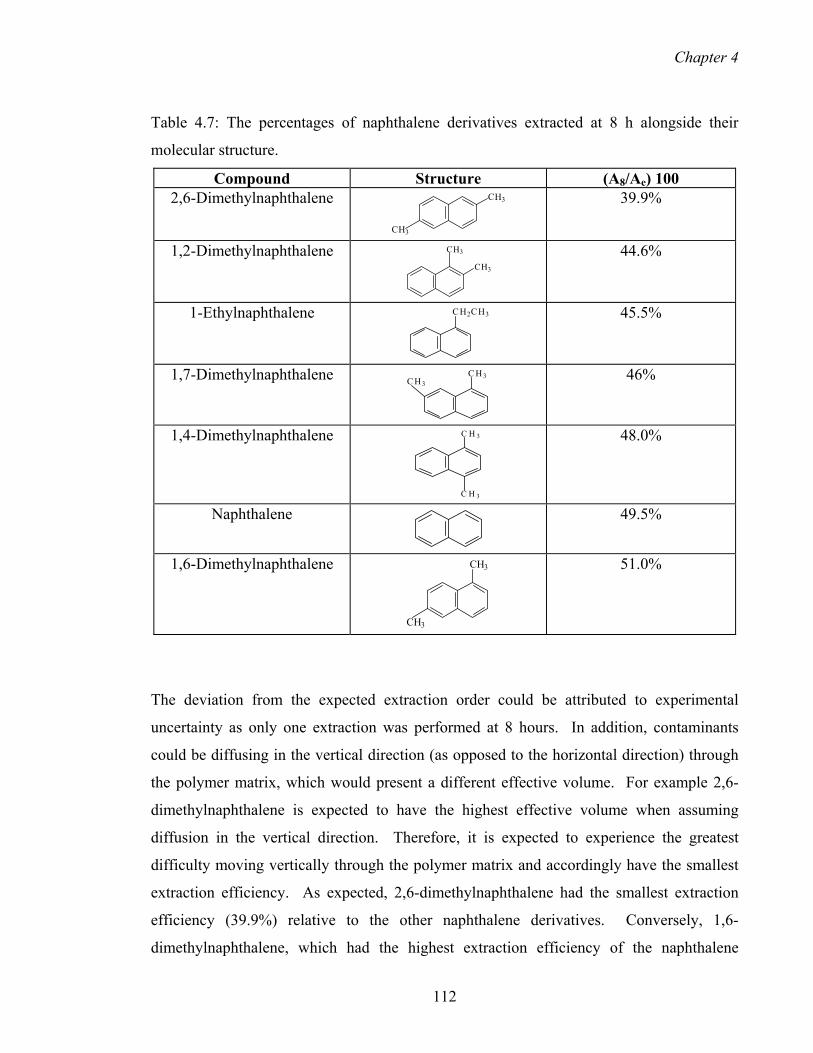
Chapter 4
Table 4.7: The percentages of naphthalene derivatives extracted at 8 h alongside their
molecular structure.
Compound Structure (A8/Ae) 100 2,6-Dimethylnaphthalene CH3
CH3
39.9%
1,2-Dimethylnaphthalene CH3
CH3
44.6%
1-Ethylnaphthalene CH2CH3
45.5%
1,7-Dimethylnaphthalene C H3C H3
46%
1,4-Dimethylnaphthalene C H 3
C H 3
48.0%
Naphthalene
49.5%
1,6-Dimethylnaphthalene CH3
CH3
51.0%
The deviation from the expected extraction order could be attributed to experimental
uncertainty as only one extraction was performed at 8 hours. In addition, contaminants
could be diffusing in the vertical direction (as opposed to the horizontal direction) through
the polymer matrix, which would present a different effective volume. For example 2,6-
dimethylnaphthalene is expected to have the highest effective volume when assuming
diffusion in the vertical direction. Therefore, it is expected to experience the greatest
difficulty moving vertically through the polymer matrix and accordingly have the smallest
extraction efficiency. As expected, 2,6-dimethylnaphthalene had the smallest extraction
efficiency (39.9%) relative to the other naphthalene derivatives. Conversely, 1,6-
dimethylnaphthalene, which had the highest extraction efficiency of the naphthalene
112

Chapter 4
derivatives listed in Table 4.7, was expected to have a lower extraction percentage than
naphthalene, 1,4-dimethylnaphthalene and 1-ethylnaphthalene. Once again, no clear
correlation between effective volume and percent extracted was observed for diffusion of
naphthalene derivatives in the vertical direction (as opposed to the horizontal direction).
The rate of diffusion is expected to be an average of the overall rate with all molecular
orientations.
In order to establish whether a correlation exists between contaminant polarity and percent
extracted Figure 4.12 was converted into a “Venn diagram”, grouping the contaminants
according to their functional group types (Figure 4.13). From Figure 4.13 it could be seen
that all the non-polar (hydrocarbons) are much more rapidly extracted, the weakly polar
ethers not quite as fast, the moderately polar ketones are extracted more slowly again and
the dodecanoic acid with the highly polar carboxylic group is extracted much more slowly
again. The highly polar methyl salicylate and the moderately polar other ester (n-hexyl
benzoate) are the two obvious exceptions to this. Otherwise there is a clear trend that
shows an unequivocal dependence upon polarity. To test the strength of this dependence
the percent extracted was plotted against an estimated solvent strength parameter for each
of the contaminants (Figure 4.14). The solvent parameter for each contaminant was
estimated from the solvent strength parameter of a representative compound sharing the
same functional group (Johnson and Stevenson 1979).
A correlation coefficient (R2) of 0.50 for Figure 4.14 implies significant scatter about the
quadratic fit and a weak correlation. The fact that there is a negative gradient suggests that
there may be functional group interactions taking place between the contaminant and the
polymer, causing a decrease in percent extracted as contaminant polarity increases. A
quadratic fit rather than a linear fit was selected because a higher correlation coefficient
was obtained with the former (R2 = 0.46 for linear fit y = -9.3091 + 48.555; R2 = 0.50 for
quadratic fit y = 4.16x2 - 17.3x +50.33).
113
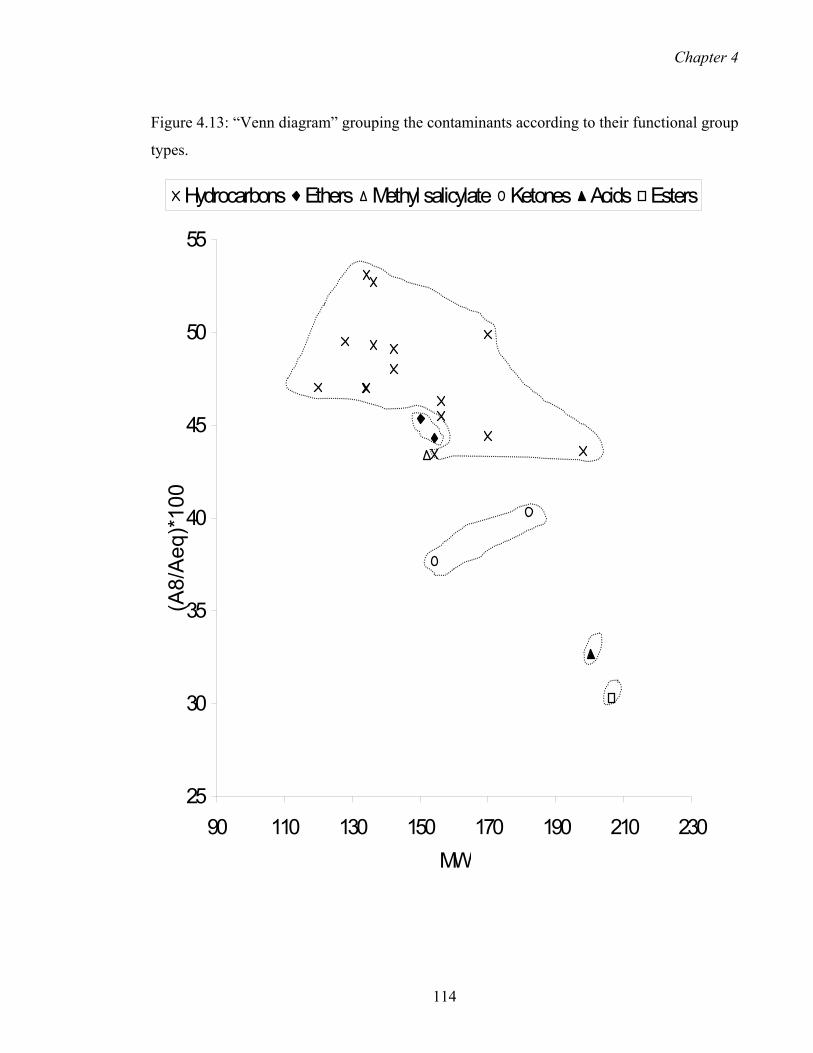
Chapter 4
Figure 4.13: “Venn diagram” grouping the contaminants according to their functional group
types.
25
30
35
40
45
50
55
90 110 130 150 170 190 210 230MW
Hydrocarbons Ethers Methyl salicylate Ketones Acids Esters(A
8/A
eq)*
100
114

Chapter 4
Figure 4.14: Ratio of amount extracted at 8 h (A8) to amount extracted after 24 h (Ae) (as a
percentage) versus estimated solvent strength parameter.
y = 4.1648x2 - 17.3x + 50.328R2 = 0.4971
20
25
30
35
40
45
50
55
0 0.5 1 1.5 2 2Estimated solvent strength parameter
(A8/
Ae)
100
.5
4.3.3 Particle size variation
In order to determine whether the Soxhlet extraction rate was limited by diffusion, larger
particle sizes were extracted for 24 h. It was presumed that larger PET particles sizes
would give rise to longer diffusion paths for the mass transfer of contaminants from the
polymer core to its surface. The rate of diffusion is proportional to D/L2, where D is the
diffusion coefficient and L is the length of the shortest dimension (Vandenburg et al. 1997).
115

Chapter 4
Therefore, increasing L should theoretically decrease the rate of diffusion out of the matrix.
Work by Perlstein (1983) and Spell and Eddy (1960) support this theory. It was concluded
in their studies that powdering the PVC and PE pellets respectively had a positive effect on
extraction time and recovery. Ashraf-Khorassani et al. (1991) and Salafranca et al. (1999)
also found that faster SFE is obtained as the surface area of the polyolefin matrix increases.
Figures 4.15 – 4.17 show a general decrease in the amount of contaminant extracted as
particle size increases. The large decrease in measured contaminant levels from the
smallest particle size (0-300 µm) to the intermediate particle size (>300-425 µm) is clear
and consistent (for 16 of the 19 contaminants), whilst the effect of increasing the particle
size further to the large sizes (>425-700 µm) is much smaller – and due to this reduced
difference between the levels for these two particles sizes – is only clear for just over half
of the contaminants. However, a student t-test on the means of the contaminant levels for
the 19 analytes shown in Figure 4.15 for the medium and large particle sizes yields tcalc =
2.53. As t = 2.10, a significant decrease in the amount extracted between the medium and
large particles is supported (at the 5% level). Figure 4.16 is an equivalent plot for the six
trimethylnaphthalene isomers and the large decrease in contaminant levels from small to
medium particle sizes, followed by a small decrease to large particle sizes is visually
unambiguous in this case. For the six contaminants extracted at greater than 200 ppb, the
results (Figure 4.17) are more scattered, but are generally consistent with the above
interpretation of the data in Figures 4.15 and 4.16. For the small number of exceptions to
the general trends, these tend to be for analytes with large standard deviations in the
amounts extracted (Figure 4.18). [Further extraction work on extruded (recycled) PET
pellets has provided smaller standard deviations for many compounds, presumably due to
the contaminants being uniformly blended into the polymer network within the melt phase
prior to pellet manufacture. This work will be presented in the next chapter].
116

Chapter 4
Figure 4.15: Amount of contaminant extracted from flake ground to different particle sizes
(compounds below 200 ppb).
0
20
40
60
80
100
120
140
small medium large
particle size
Am
ount
Ext
ract
ed a
fter 2
4h (p
pb)
Dodecane 1,6-Dimethylnaphthalene2,6-Dimethylnaphthalene 1,7-Dimethylnaphthalenen-Hexylbenzoate 1-MethylnaphthaleneTetradecane Cineole1,4-Dimethylnaphthalene gamma-TerpineneNaphthalene 4-Propylanisole1-Ethylnaphthalene Biphenyl(-)-Menthone 1,2-Dimethylnaphthalenem-Cymene 3-Ethyl-o-xylene1,2,3,5-Tetramethylbenzene
117

Chapter 4
Figure 4.16: Amount of trimethylnaphthalene contaminants extracted from flake ground to
different particle sizes.
0
5
10
15
20
25
30
35
small medium large
particle size
Am
ount
Ext
ract
ed a
fter 2
4h (p
pb)
Trimethyl Naphthalene Isomer 1 Trimethyl Naphthalene Isomer 2
Trimethyl Naphthalene Isomer 3 Trimethyl Naphthalene Isomer 4
Trimethyl Naphthalene Isomer 5 Trimethyl Naphthalene Isomer 6
118
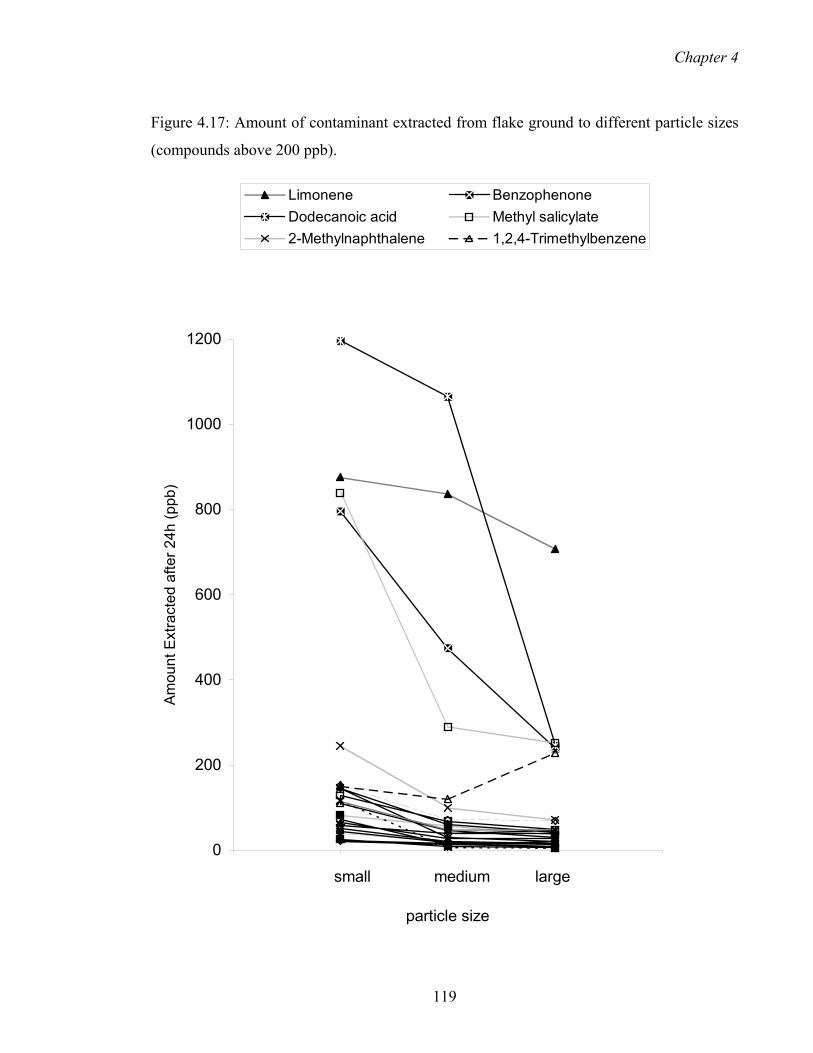
Chapter 4
Figure 4.17: Amount of contaminant extracted from flake ground to different particle sizes
(compounds above 200 ppb).
0
200
400
600
800
1000
1200
small medium large
particle size
Am
ount
Ext
ract
ed a
fter 2
4h (p
pb)
Limonene BenzophenoneDodecanoic acid Methyl salicylate2-Methylnaphthalene 1,2,4-Trimethylbenzene
119

Chapter 4
Figure 4.18: The standard deviations associated with data points defining curves that do not
follow the general trends of Figure 4.15 – 4.17.
0
50
100
150
200
250
300
350
small medium large
particle size
Am
ount
Ext
ract
ed (p
pb)
gamma-Terpinene1,2,3,5-Tetramethylbenzene1,2,4-Trimethylbenzene3-Ethyl-o-xylene
120

Chapter 4
4.3.4 Kinetic studies for the larger particle sizes
Figures 4.19-4.22 show results for the kinetics studies on the >300-425 µm particle size
range. Due to single measurements being taken at each extraction time in this case℘, the
plots are not as well defined as those in Figures 4.7-4.11. However, for each analyte the
values appear to fluctuate about a mean and thus indicate that extraction was completed
before the first 4 hours of Soxhlet extraction. Similar kinetic trends were observed for the
unground flake (Figure 4.26-4.29), which are also single measurements at each extraction
time. For the >425-700 µm ground flake (Figures 4.23-4.25), however, there were only
three points taken, one for each extraction time (1 h, 3 h and 24 h). Therefore, it is difficult
to determine whether ascending trends (e.g. for biphenyl, naphthalene, dodecanoic acid) are
due to sample variation or an increase in extraction efficiency with time. There are also a
few compounds (e.g. 1,7-dimethylnaphthalene, 2,6-dimethylnaphthalene, 1-
methylnaphthalene, 1,4-dimethylnaphthalene, 1-ethylnaphthtalene, 1,2,3,5-
tetramethylbenzene) that do not appear to be fully extracted until 3 h. Some other
compounds (e.g. dodecane, tetradecane, trimethylnaphthalene isomer 7) show descending
extraction trends with time, which may result from sample variation. Student t-tests were
performed in order to determine whether a significant difference exists between the mean
contaminant concentrations at 1 h and 3 h; 3 h and 24 h; and 1 h and 24 h and the tcalc
values were 0.07, 0.16 and 0.08 respectively. Since the t-test value is 2.042 at the 5%
confidence level, it can be concluded that, in general, there is no significant difference in
the amount of contaminant extracted at the three different times.
The extraction kinetics of dimethylterephthalate (Figure 4.29) and ethylene glycol (Figure
4.30) in unground flake were also determined. Despite both of these compounds arising
from the polymer’s original manufacture, the sample-to-sample variation (i.e. standard
deviation) of these compounds was large.
These compounds were present at higher concentrations in the ground flake (0-300 µm).
The levels were 12 ± 3 ppm (unground flake) and 38 ± 7 ppm (flake ground to 0-300 µm)
for ethylene glycol and 2.3 ± 1.3 ppm (unground flake) and 3.8 ± 0.2 ppm (flake ground to
0-300 µm) for dimethylterephthalate.
℘ Replicates at each time are unnecessary if the points are fluctuating about a mean behaviour and generating a general trend.
121

Chapter 4
Figure 4.19: Soxhlet extraction kinetics of flake ground to >300-425 µm. Contaminants
below 120 ppb.
0
20
40
60
80
100
120
0 10 20 30 40 50 60Time (hours)
Am
ount
Ext
ract
ed (p
pb)
1,2,4-Trimethylbenzene 1,7-Dimethylnaphthalene2,6-Dimethylnaphthalene Cineole1-Methylnaphthalene Tetradecane1,6-Dimethylnaphthalene Dodecanoic acidm-Cymene gamma-TerpineneNaphthalene 1,4-Dimethylnaphthalene1-Ethylnaphthalene Biphenyl4-Propylanisole (-)-Menthone1,2-Dimethylnaphthalene Benzene, 1,2,3,5, Tetramethyl-3-Ethyl-o-xylene n-Hexylbenzoate
122

Chapter 4
Figure 4.20: Soxhlet extraction kinetics of flake ground to >300-425 µm. Contaminants
between 120 ppb and 300 ppb.
0
50
100
150
200
250
300
0 10 20 30 40 50 60Time (hours)
Am
ount
Ext
ract
ed (p
pb)
2-Methylnaphthalene Dodecane Methyl salicylate
123

Chapter 4
Figure 4.21: Soxhlet extraction kinetics of flake ground to >300-425 µm. Contaminants
above 400 ppb.
0
200
400
600
800
1000
1200
0 10 20 30 40 50 60
Time (hours)
Am
ount
Ext
ract
ed (p
pb)
Limonene Benzophenone
124

Chapter 4
Figure 4.22: Soxhlet extraction kinetics of flake ground to >300-425 µm.
Trimethylnaphthalene isomers.
0
2
4
6
8
10
12
14
16
0 10 20 30 40 50 60Time (h)
Am
ount
Ext
ract
ed (p
pb)
Trimethylnaphthalene Isomer 1 Trimethylnaphthalene Isomer 2Trimethylnaphthalene Isomer 3 Trimethylnaphthalene Isomer 4Trimethylnaphthalene Isomer 5 Trimethylnaphthalene Isomer 6Trimethylnaphthalene Isomer 7
125

Chapter 4
Figure 4.23: Soxhlet extraction kinetics of flake ground to >425-700 µm. Contaminants
below 100 ppb.
0
10
20
30
40
50
60
70
80
90
100
0 5 10 15 20 25
Time (h)
Am
ount
Ext
ract
ed (p
pb)
Dodecane m-Cymene2-Methylnaphthalene 1,7-DimethylnaphthaleneTetradecane gamma-Terpinene2,6-Dimethylnaphthalene 1,6-Dimethylnaphthalene1-Methylnapthalene 4-Propylanisole1,2,4-Trimethylbenzene Naphthalene1,4-Dimethylnaphthalene (-)-MenthoneBiphenyl 1-Ethylnaphthalene1,2-Dimethylnaphthalene 3-Ethyl-o-xylene1,2,3,5-Tetramethylbenzene n-Hexylbenzoate
126

Chapter 4
Figure 4.24: Soxhlet extraction kinetics of flake ground to >425-700 µm.
Trimethylnaphthalene isomers
127
3
5
7
9
11
13
15
0 5 10 15 20 25Time (h)
Am
ount
Ext
ract
ed (p
pb)
Trimethyl Naphthalene Isomer 1 Trimethyl Naphthalene Isomer 2Trimethyl Naphthalene Isomer 3 Trimethyl Naphthalene Isomer 4Trimethyl Naphthalene Isomer 5 Trimethyl Naphthalene Isomer 6Trimethyl Naphthalene Isomer 7

Chapter 4
Figure 4.25: Soxhlet extraction kinetics of flake ground to >425-700 µm. Contaminants
above 200 ppb.
0
200
400
600
800
1000
1200
1400
0 5 10 15 20 25Time (h)
Am
ount
Ext
ract
ed (p
pb)
Limonene Benzophenone Dodecanonic Acid
128

Chapter 4
Figure 4.26: Soxhlet extraction kinetics of whole flake. Contaminants below 70 ppb.
0
10
20
30
40
50
60
70
2 4 6 8 10 12 14 16 18 20 22 24Time (h)
Am
ount
Ext
ract
ed (p
pb)
1,2,3,5-, tetramethyl benzene Naphthalene1-Ethylnaphthalene Biphenyl3-Ethyl-o-xylene 2,6- Dimethylnaphthalene1,4- Dimethylnaphthalene 1-Methylnaphthalene1,2- Dimethylnaphthalene Dodecanen-Hexylbenzoate Tetradecane(-)-Menthone 1,2,4-, Trimethylheptane
129
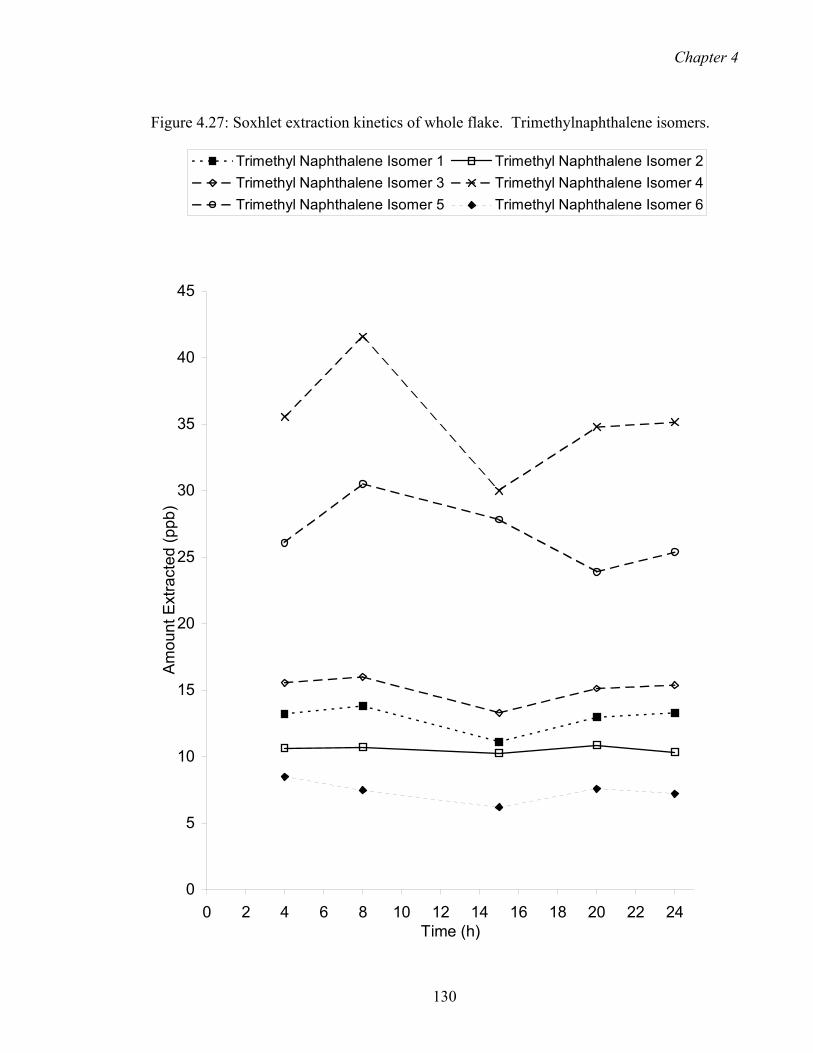
Chapter 4
Figure 4.27: Soxhlet extraction kinetics of whole flake. Trimethylnaphthalene isomers.
0
5
10
15
20
25
30
35
40
45
0 2 4 6 8 10 12 14 16 18 20 22 24Time (h)
Am
ount
Ext
ract
ed (p
pb)
Trimethyl Naphthalene Isomer 1 Trimethyl Naphthalene Isomer 2Trimethyl Naphthalene Isomer 3 Trimethyl Naphthalene Isomer 4Trimethyl Naphthalene Isomer 5 Trimethyl Naphthalene Isomer 6
130

Chapter 4
Figure 4.28: Soxhlet extraction kinetics of whole flake. Contaminants between 70 ppb and
200 ppb.
0
20
40
60
80
100
120
140
160
180
200
0 2 4 6 8 10 12 14 16 18 20 22 24Time (h)
Am
ount
Ext
ract
ed (p
pb)
m-Cymene1,7-, Dimethylnaphthalene & 1, 6 Dimethylnaphthalene2-MethylnaphthaleneDodecanoic Acid
others
131
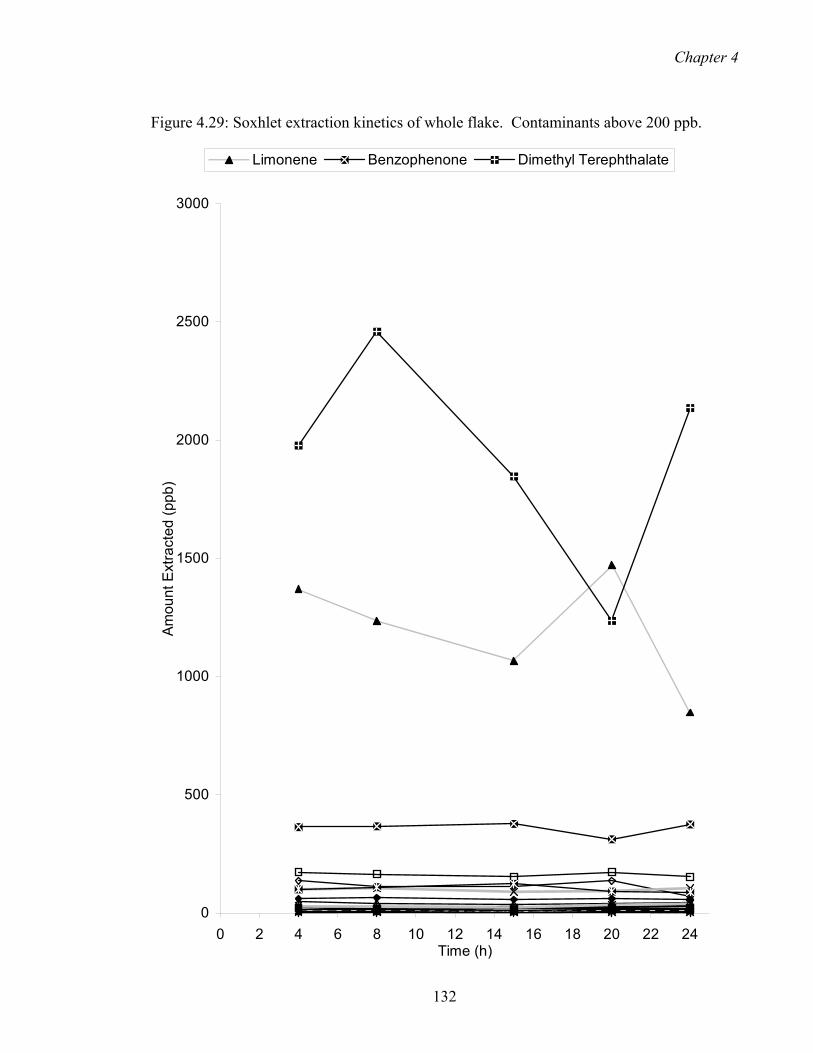
Chapter 4
Figure 4.29: Soxhlet extraction kinetics of whole flake. Contaminants above 200 ppb.
0
500
1000
1500
2000
2500
3000
0 2 4 6 8 10 12 14 16 18 20 22 24Time (h)
Am
ount
Ext
ract
ed (p
pb)
Limonene Benzophenone Dimethyl Terephthalate
132

Chapter 4
Figure 4.30: Soxhlet extraction kinetics of whole flake. Ethylene glycol.
0
2000
4000
6000
8000
10000
12000
14000
16000
0 5 10 15 20 25Time (h)
Am
ount
Ext
ract
ed (p
pb)
Ethylene Glycol
133

Chapter 4
Kashtock and Breder (1980) extracted ethylene glycol (15 ppm) by Soxhlet extraction (with
DCM) out of unused PET bottles ground to 700 µm particles. Likewise Kim et al. (1990)
extracted approximately 15 ppm of ethylene glycol from a commercial amber PET bottle
wall by Soxhlet extraction (with ethanol).
The results are contrary to expectation based upon path length as the larger particles size
ranges are extracted sooner (by Soxhlet) than the 0-300 µm particle size range.
We assume that for the 0-300 µm particle size range, packing in the extraction thimble was
more compact than for the larger particle sizes and thus, due to hampered solvent access
and polymer aggregation, equilibrium was not attained until 24 h. To confirm this theory, a
sample of the 0-300 µm particle size was dispersed in DCM and sonicated for 3h with
intermittent stirring to reduce coagulation. As shown in Table 4.8, the concentrations
obtained for the DCM sonicaton extractions were mostly equivalent to those obtained by
total dissolution for the 0-300 µm particle size1, thus demonstrating complete extraction in
3 h by sonication. In fact a gradient of 0.96 (Figure 4.31) was obtained for a plot of amount
extracted by total dissolution versus the amount extracted by sonication for the small
particle size. [Vandenburg et al. (1999) also noted the inhibition of extraction caused by
excessive close packing and used sand as a dispersant to prevent PVC pellets from
coagulation in an ASE thimble]. Comprehensive comparisons between the ultrasonication
and the Soxhlet extraction methods were made during the extraction of extruded pellets and
the results are presented in Chapter 5. In contrast, the effects of coagulation was not
observed for the finely ground crystallized extruded pellets, possibly due to their higher
crystallinity relative to the flake.
The results in Table 4.8 and Figure 4.31 exclude the small number of compounds that could
not be analysed by total dissolution. These compounds are presented in Table 4.9 (a) and
(b). Limonene, cineole and γ-terpinene are assumed to react with TFA, which might
explain their absence from chromatograms. Likewise, Nerin et al. (2000) addressed the
severity of another total dissolution procedure (using dimethylformamide) towards
limonene in view of the lack of GC/MS response. Komolprasert et al. (1995) also discussed
the decomposition of malathion and diazinon during total dissolution with
1 This excludes the small number of compounds that cannot be analysed by the total dissolution technique. These will be discussed in Section 4.3.6 on “Validation of extraction procedures”.
134

Chapter 4
Figure 4.31: Log-log plot of levels of contaminants determined by total dissolution versus
levels extracted by sonication and comparison with the ideal relationship (y=x): for flake
ground to small particle sizes.
y = 0.9616x + 0.0781R2 = 0.9846
0
0.5
1
1.5
2
2.5
3
3.5
4
0 0.5 1 1.5 2 2.5 3 3.5 4
Log [Amount Extracted by Sonication (ppb)]
Log
[Am
ount
Ext
ract
ed b
y To
tal D
isso
lutio
n (p
pb)]
0-300 um Linear (0-300 um)
y=x
135

Chapter 4
Table 4.8: Contaminant levels (and standard deviations) [in ppb, in flake ground to 0-300
µm] determined by total dissolution with TFA, compared to extraction by sonication in
DCM.
1,2,4- Trimethyl-benzene
3-Ethyl-o-xylene
1,2,3,5- Tetramethyl-benzene
(-)-Menthone Methyl salicylate
4-n-propylanisole
DCM TFA DCM TFA DCM TFA DCM TFA DCM TFA DCM TFA 81.3 (11.4)
87.4 (7.9)
14.9 (1.7)
13.3 (1.0)
33.4 (2.9)
21.7 (0.9)
6.1 (0.2)
9.8 (1.1)
552 (64)
616 (99)
39.1 (5.2)
40.0 (3.6)
Naphthalene Biphenyl 2-Methyl
naphthalene
1-Methyl naphthalene
1-Ethyl naphthalene
2,6- Dimethyl naphthalene
DCM TFA DCM TFA DCM TFA DCM TFA DCM TFA DCM TFA 88.8 (3.1)
77.9 (1.3)
56.3 (1.9)
56.1 (2.7)
304 (25)
300 (26)
158 (13)
145 (3)
60.5 (2.6)
58.9 (2.6)
148 (1)
145 (4)
1,7- Dimethyl naphthalene & 1,6- Dimethyl naphthalene
1,4- Dimethyl naphthalene
1,2- Dimethyl naphthalene
Trimethyl naphthalene isomer 1
Trimethyl naphthalene isomer 2
Trimethyl naphthalene isomer 3
DCM TFA DCM TFA DCM TFA DCM TFA DCM TFA DCM TFA 437 (8)
417 (5)
76.6 (10)
84.3 (3.5)
31.7 (4.7)
31.0 (2.8)
21.6 (2.8)
23.7 (2.9)
18.2 (2.4)
20.7 (2.0)
25.5 (1.9)
24.8 (1.3)
Trimethyl naphthalene isomer 4 & 5
Trimethyl naphthalene isomer 6
Trimethyl naphthalene isomer 7
Benzophenone
DCM TFA DCM TFA DCM TFA DCM TFA 43.1 (2.7)
46.7 (2.4)
28.9 (3.5)
29.4 (2.1)
11.6 (0.3)
15.8 (0.7)
1236 (66)
1234 (135)
136

Chapter 4
Table 4.9: Contaminant levels (and standard deviations) [in ppb, in flake ground to 0-300
µm] determined by total dissolution with TFA, compared to extraction by sonication in
DCM: anomalies for (a) m-cymene [TFA>DCM] and (b) limonene, cineole and γ-
terpinene [DCM>TFA]. (All levels are in ppb by mass.)
(a)
m-Cymene
Particle size
DCM TFA
Small
(0-300 µm)
54.4
(0.0)
500
(58)
(b)
Limonene
Cineole γ-Terpinene Particle size
DCM TFA DCM TFA DCM TFA
Small (0- 300 µm)
1121 (40)
ND 94.5 (9.5)
ND 55.6 (3.7)
ND
137

Chapter 4
hexafluoro-2-isopropanol (HFIP). In additional studies limonene and cineole were
presumed to degrade in the presence of HFIP, due to their absence from chromatograms.
It is presumed that the double bonds of limonene and γ-terpinene react with the carbonyl
group of TFA, forming polar compounds, which may not be extracted by the non-polar
heptane. The presence of electron withdrawing fluorine atoms on the carbon adjacent to
the carbonyl group of TFA exert a positive charge on the carbonyl carbon, which is
prepared for nucleophilic attack.
The reason behind the large concentrations determined by TFA relative to DCM for m-
cymene is not so obvious. It is assumed that the TFA causes the breakdown of other
compounds (analogs of m-cymene) in the flake, forming m-cymene. There is also the
possibility that m-cymene is trapped between polymer chains and only released after the
total dissolution procedure which destroys the polymeric network and breaks some chains.
However, the latter proposition seems unlikely because none of the other contaminants
have behaved in an analogous way to m-cymene and there is no distinct feature of m-
cymene, which would lead to the nonconforming results.
In another kinetic experiment, the >300-425 µm particle size was extracted for 3 h and then
re-extracted for another 24 h with DCM by Soxhlet extraction (Table 4.10). There was no
significant increase in the amount extracted, indicating that extraction was completed after
the first extraction. Nielson et al. (1997) analogously confirmed that sorbed surrogate
contaminants were completely extracted in the first extraction from PET by shaking with
DCM for 24 h.
138

Chapter 4
Table 4.10: Flake ground to >300-425 µm particle size and extracted for 3 h and then re-
extracted for another 24 h.
Contaminant
Level of contaminant
from 1st extraction (ppb)
Level of contaminant
from 2nd extraction (ppb)
Percent increase from
3h to 24h
Limonene 725.6 7.6 1.0 Cineole 29.5 ND ND
m-Cymene 50.0 4.3 8.6 3-Ethyl-o-xylene 13.1 0.4 3.1
γ-Terpinene 32.3 0.3 0.9 1,2,3,5-, Tetramethyl
benzene 10.2 0.5 4.9
Menthone 17.1 1.0 5.8 Dodecane 105.7 1.4 1.3
Naphthalene 28.7 0.5 1.7 Methyl salicylate 498.1 1.8 0.4 4-n-Propyl anisole 41.4 0.4 1.0
Biphenyl 22.1 0.2 0.9 Tetradecane 73.5 5.2 7.1
2-Methylnaphthalene 123.8 0.6 0.5 1-Methylnaphthalene 64.4 0.6 0.9 1-Ethylnaphthalene 28.4 0.2 0.7
2,6- Dimethylnaphthalene 103.4 1.0 1.0 1,7- Dimethylnaphthalene 82.9 0.6 0.7 1,6- Dimethylnaphthalene 68.3 0.6 0.9 1,4- Dimethylnaphthalene 18.4 0.2 1.1 1,2- Dimethylnaphthalene 10.4 0.2 1.9
Tetradecane 105.7 1.4 1.3 Trimethylnaphthalene
Isomer 1 10.3 ND ND
Trimethylnaphthalene Isomer 2
9.7 ND ND
Trimethylnaphthalene Isomer 3
12.3 ND ND
Trimethylnaphthalene Isomer 4
10.6 ND ND
Trimethylnaphthalene Isomer 5
7.7 ND ND
Trimethylnaphthalene Isomer 6
12.4 ND ND
n-Hexylbenzoate 4.1 0.2 4.9 Lauric acid 151.3 6.4 4.2
Benzophenone 231.1 1.3 0.6
139

Chapter 4
4.3.5 Comparison of contaminant levels in different 70 g grabs from the original 15 kg
sample
The data in Table 4.8 and Figures 4.7-4.10 enable us to gain some insight into the
variability of the distribution of contaminants. The data in Figures 4.7-4.10 were obtained
from one random grab, grinding and analysis, whilst the Table 4.8 results were obtained
from a later random 70 g grab. As both 70 g grabs were taken from the original 15 kg sack
of washed and shredded PET sampled continuously from the recycling plant in June 2000,
the differences represent a very short-term variation in composition. Figure 4.32 is a plot
of the amount extracted from 0-300 µm particles derived from the later 70 g grab (by
sonication with DCM), versus the amount extracted from the 0-300 µm particles derived
from the earlier 70g grab (by Soxhlet with DCM). The log-log mode has been used to even
out the distribution of data points and allow equal inspection of the majority of the points
occurring at the low levels of contamination. The most obvious feature of this plot is that
the line of best fit to the points (continuous line, y = 1.0539x – 0.1265) and the theoretical
line of perfect agreement – on average – between the separate grabs (dashed line, y=x) are
virtually coincident. In fact, without the low-lying outlier of the set, it is unlikely that any
difference could be discerned. This is perhaps not surprising. The 15 kg of shredded PET
(from which both grabs were taken) would be derived from a finite albeit large number of
bottles and the two grabs, with many hundreds of flakes each (est. 1800), would
substantially contain differing proportions of the same bottles. On the other hand, R2 =
0.84 indicates significant scatter around the line of best fit, as can readily be seen.
Furthermore, it must be remembered that the log-log scale has the effect of appearing to
minimize difference. For example, the two most concentrated contaminants at the top
right-hand end of the plot lie about 0.2 log units above and below the y = x line and are thus
around 1.58 times larger and smaller (respectively) in the later grab than in the earlier grab.
A 58% difference is considerable, although the majority of contaminants are not present in
the two grabs in levels that are this different. [It should be noted that the spread of data in
Figure 4.32 is far more than can be attributed to differences in extraction efficiencies of
alternative extraction techniques. This is apparent from both Table 4.8 and from validation
studies to be presented in the next section (Section 4.3.6)].
140

Chapter 4
Figure 4.32: Variation in contaminant levels between two 70 g grabs of flake from the
original 15 kg bag. Analyses were performed on PET ground to the 0-300 µm particle size
in each case.
y = 1.0539x - 0.1265R2 = 0.8362
0
0.5
1
1.5
2
2.5
3
3.5
4
0 1 2 3 4
Log[amount extracted from earlier grab (ppb)]
Log[
amou
nt e
xtra
cted
from
late
r gra
b (p
pb)]
0-300 um Linear (0-300 um)
y=x
141

Chapter 4
4.3.6 Validation of the Soxhlet extraction methodology
4.3.6.1 Total dissolution compared with Soxhlet extraction
Table 4.11 shows the results of Soxhlet extraction using DCM compared with levels
obtained by total dissolution using TFA and subsequent partitioning into heptane (for
extraction from the two larger particle size ranges and from the unground flake).
The values in Table 4.11 are for those contaminants with very similar concentrations
determined by both methods [with the exception of the concentrations in column TFA (2)
whose inconsistent results will be discussed later]. Amongst the data, excluding the values
in column TFA (2), there are clearly two extreme outliers, but only in the case of the analysis
on the unground flake (methyl salicylate and lauric acid). The relationships between the
results for the two methods are the opposite for these two contaminants, and because the
data is so extreme, we have excluded them from further considerationφ.
Figure 4.33 is a plot of the amount extracted after total dissolution versus that extracted by
Soxhlet, excluding the values in column TFA (2). The log-log mode has again been used to
even out the distribution of data points and allow equal inspection of the majority of the
results, which occur at the lower levels of contamination. And again the most obvious
features of these plots are that the data sets overlap strongly with each other and with the
theoretical line for perfect agreement between the techniques (y=x), and the R2 values are
reasonable – especially for the two particle size ranges, for which the regression lines are
not significantly different. On the other hand, the data for the unground PET flake is more
scattered. This is to be expected, as the small number of flakes analysed by each technique
are more likely to have different contaminant levels, whereas the large number of small
particles obtained after grinding will more closely approach a representative sample by
averaging over a mass approximately 10 times as large. Once again, the need for particle
size reduction is demonstrated (Cross 2000).
There are some exceptions to the general agreement between concentrations obtained by
total dissolution and those determined by Soxhlet [Table 4.12 (a) & (b)]. For the medium
particle size (>300-425 µm), the large particle size (>425-700 µm) and the unground flake,
respectively, the contaminant levels (in ppb) determined by Soxhlet were 918±162,
φ Methyl salicylate is very polar and its extraction in heptane poor. Conversely, lauric acid is better extracted in heptane (after TFA dissolution) than by Soxhlet extraction with DCM.
142
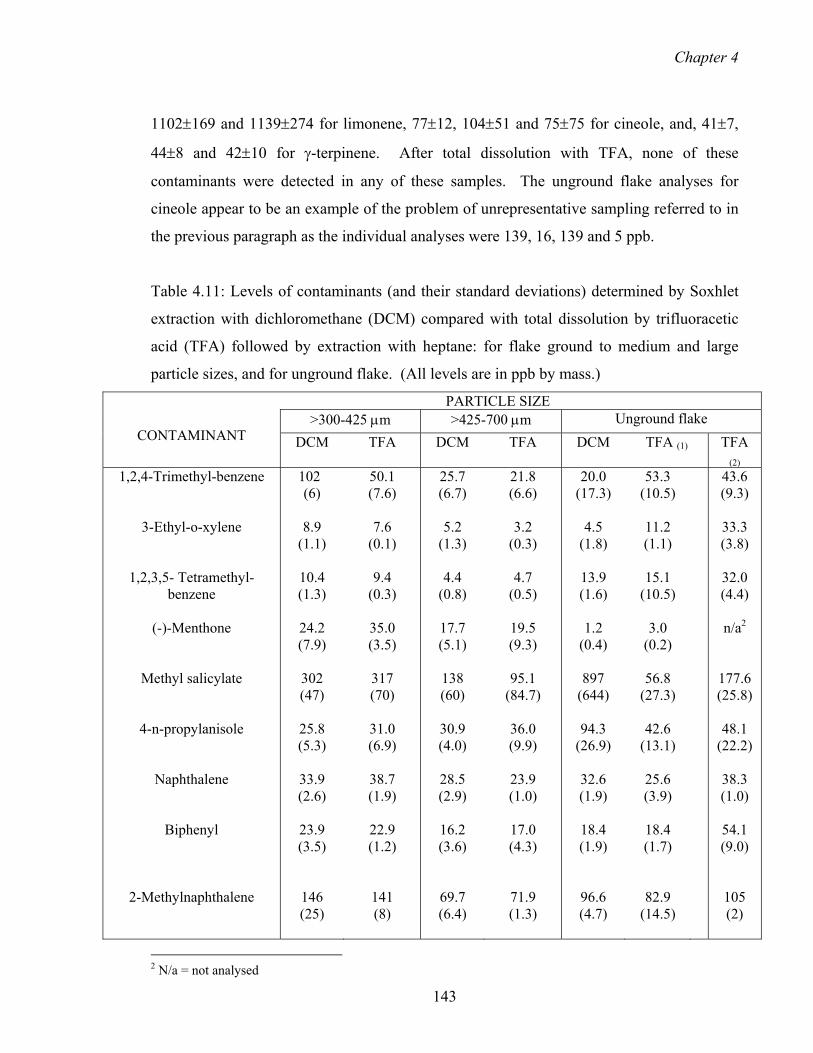
Chapter 4
1102±169 and 1139±274 for limonene, 77±12, 104±51 and 75±75 for cineole, and, 41±7,
44±8 and 42±10 for γ-terpinene. After total dissolution with TFA, none of these
contaminants were detected in any of these samples. The unground flake analyses for
cineole appear to be an example of the problem of unrepresentative sampling referred to in
the previous paragraph as the individual analyses were 139, 16, 139 and 5 ppb.
Table 4.11: Levels of contaminants (and their standard deviations) determined by Soxhlet
extraction with dichloromethane (DCM) compared with total dissolution by trifluoracetic
acid (TFA) followed by extraction with heptane: for flake ground to medium and large
particle sizes, and for unground flake. (All levels are in ppb by mass.)
PARTICLE SIZE >300-425 µm >425-700 µm Unground flake
CONTAMINANT DCM TFA DCM TFA DCM TFA (1) TFA (2)
1,2,4-Trimethyl-benzene
3-Ethyl-o-xylene
1,2,3,5- Tetramethyl-benzene
(-)-Menthone
Methyl salicylate
4-n-propylanisole
Naphthalene
Biphenyl
2-Methylnaphthalene
102 (6)
8.9
(1.1)
10.4 (1.3)
24.2 (7.9)
302 (47)
25.8 (5.3)
33.9 (2.6)
23.9 (3.5)
146 (25)
50.1 (7.6)
7.6
(0.1)
9.4 (0.3)
35.0 (3.5)
317 (70)
31.0 (6.9)
38.7 (1.9)
22.9 (1.2)
141 (8)
25.7 (6.7)
5.2
(1.3)
4.4 (0.8)
17.7 (5.1)
138 (60)
30.9 (4.0)
28.5 (2.9)
16.2 (3.6)
69.7 (6.4)
21.8 (6.6)
3.2
(0.3)
4.7 (0.5)
19.5 (9.3)
95.1
(84.7)
36.0 (9.9)
23.9 (1.0)
17.0 (4.3)
71.9 (1.3)
20.0 (17.3)
4.5
(1.8)
13.9 (1.6)
1.2
(0.4)
897 (644)
94.3
(26.9)
32.6 (1.9)
18.4 (1.9)
96.6 (4.7)
53.3 (10.5)
11.2 (1.1)
15.1
(10.5)
3.0 (0.2)
56.8
(27.3)
42.6 (13.1)
25.6 (3.9)
18.4 (1.7)
82.9 (14.5)
43.6 (9.3)
33.3 (3.8)
32.0 (4.4)
n/a2
177.6 (25.8)
48.1
(22.2)
38.3 (1.0)
54.1 (9.0)
105 (2)
2 N/a = not analysed
143

Chapter 4
1-Methylnaphthalene
1-Ethylnaphthalene 2,6-Dimethylnaphthalene
1,7- & 1,6- Dimethylnaphthalene
1,4- Dimethyl naphthalene
1,2- Dimethyl naphthalene
Trimethyl naphthalene
isomer 1
Trimethyl naphthalene isomer 2
Trimethyl naphthalene
isomer 3
Trimethyl naphthalene isomer 4 & 5
Trimethyl naphthalene
isomer 6
Trimethyl naphthalene isomer 7
Benzophenone
Lauric acid
n-Hexyl benzoate
74.0 (7.6)
26.6 (4.2)
84.3
(13.6)
206 (6)
37.3 (4.5)
17.3 (3.2)
10.0 (1.0)
10.9 (1.1)
12.1 (2.2)
19.0 (2.3)
13.3 (1.7)
6.6
(0.8)
664 (106)
62.2
(10.2)
3.1 (0.2)
73.5 (2.4)
27.3 (2.3)
88.9
(11.6)
192 (20)
39.9 (3.3)
19.8 (1.3)
11.9 (1.2)
11.7 (1.8)
12.8 (1.2)
23.6 (1.9)
15.7 1.4)
7.7
(0.8)
663 (55)
53.5 (9.8)
3.6
(1.2)
38.9 (1.3)
13.6 (0.5)
43.5 (2.2)
99.5 (7.0)
21.4 (1.7)
12.1 (1.4)
6.3
(0.7)
6.2 (0.5)
8.0
(0.8)
11.4 (0.9)
8.2
(0.5)
3.6 (0.4)
311 (5)
703
(101)
2.1 (0.2)
35.8 (2.7)
13.7 (0.7)
46.1 (1.6)
98.3 (1.0)
20.6 (1.3)
13.4 (0.6)
6.4
(0.4)
5.2 (0.7)
5.8 (1)
12.6 (0.9)
8.2
(0.9)
4.1 (0.3)
275 (12)
570
(119)
3.5 (2.2)
46.8 (5.0)
21.0 (1.5)
69.0
(12.2)
136 (24)
21.4 (3.7)
10.7 (0.5)
6.2
(0.8)
5.4 (0.6)
7.9
(1.4)
14.1 (2.5)
8.9
(1.5)
4.2 (0.8)
309 (24)
12.0 (0.9)
18.9
(15.0)
42.5 (6.9)
18.6 (3.1)
62.2 (4.5)
119 (18)
25.3 (2.5)
9.1
(1.5)
6.6 (1.2)
4.5
(1.1)
5.1 (1.6)
11.4 (2.7)
6.9
(1.4)
3.6 (1.1)
258 (32)
683
(310)
16.0 (0.5)
66.1 (5.8)
53.1 (6.3)
211 (32)
242 (24)
83.7 (8.1)
27.9
(18.8) 41.7 (3.3)
33.2 (5.9)
33.3 (4.1)
57.0 (6.5)
36.1 (3.2)
14.1 (1.4)
257 (24)
740
(235)
2.9 (1.5)
144

Chapter 4
Figure 4.33: Log-log plot of levels of contaminants determined by total dissolution versus
levels extracted by Soxhlet and comparison with the ideal relationship (y=x): for flake
ground to medium and large particle sizes and for unground flake.
y = 0.8535x + 0.1821R2 = 0.8952
y = 0.9332x + 0.1098R2 = 0.9655 y = 0.9513x + 0.0488
R2 = 0.9806
0
0.5
1
1.5
2
2.5
3
3.5
0 0.5 1 1.5 2 2.5 3 3.5
LOG(Amount Extracted by Soxhlet (ppb))
LOG
(Am
ount
Ext
ract
ed b
y To
tal D
isso
lutio
n (p
pb))
unground >300-425 um>425-700 um Linear (unground)Linear (>300-425 um) Linear (>425-700 um)
y=x
145

Chapter 4
Table 4.12: Levels of contaminants (and their standard deviations) determined by Soxhlet
extraction with dichloromethane (DCM) compared with total dissolution by trifluoracetic
acid (TFA) followed by extraction with heptane: anomalies for (a) m-cymene [TFA>DCM]
and (b) limonene, cineole and γ-terpinene [DCM>TFA]. (All levels are in ppb by mass.)
(a)
m-Cymene
Particle size
DCM TFA Medium
(> 300-425 µm)
46.5 (4.4)
439.9 (4.2)
Large (> 425-700 µm)
67.4 (16.0)
439.1 (41.4)
Whole flake 77.2 (4.1)
650.7 (107.6)
(b)
Limonene
Cineole γ-Terpinene Particle size
DCM TFA DCM TFA DCM TFA Medium
(> 300-425 µm)
918 (162)
ND 76.5 (12.3)
ND 40.5 (7.0)
ND
Large (> 425-700
µm)
1102 (169)
ND 104.3 (50.7)
ND 43.6 (8.4)
ND
Whole flake
1139 (274)
ND 78.6 (79.0)
ND 41.8 (10.3)
ND
There was an independent occasion on the same batch of flake, during which unground
flake was extracted in triplicate for a second time by total dissolution using TFA (Table
4.11; see column TFA(2)). However, this time, the levels of most contaminants
reproducibly exceeded those determined by Soxhlet extraction for the unground flake in
Table 4.11.
146

Chapter 4
Figure 4.34 is a log-log plot comparing the contaminant concentrations extracted from
unground flake by TFA on the two different occasions (average of triplicate values for each
contaminant) versus the amount extracted from unground flake by Soxhlet extraction (all
values in Table 4.11). From this graph it can be seen that on the second occasion the level
of contaminants extracted from unground flake by total dissolution exceeded the amount
extracted by Soxhlet extraction. Conversely, on the first occasion the level of contaminants
extracted from unground flake by total dissolution approximated the amount extracted by
Soxhlet extraction. Amongst the data there were three outliers, which have been excluded
from the plot (n-hexyl benzoate, lauric acid and methyl salicylate).
It is possible that, due to sample-to-sample variation, the unground flake extracted by total
dissolution the second time could have contained a higher level of contaminants. For
example, the higher level of naphthalene derivatives could be resulting from the presence of
more polyethylene naphthalate (PEN) in the unground flake extracted the second time by
total dissolution. However, this does not explain the discrepancy for the other compounds.
The gradient of 0.62 in Figure 4.34 suggests that - on average - about 62% of each
contaminant was extracted during the Soxhlet extractions relative to the second set of total
dissolution extractions. However, a correlation coefficient (R2) of 0.64 indicates that the
points are extremely scattered about the line of best fit. The reasons behind the discrepancy
between the first and second set of total dissolution extractions are not known.
On full inspection of the data in Table 4.11, it is interesting that the level of benzophenone
was reproducibly equivalent for all extractions. However, given the relatively small
standard deviations in the multiple extractions (10% for the flake), experimental error
should logically be discounted and the equivalence for the two total dissolutions should be
attributed to coincidence.
147
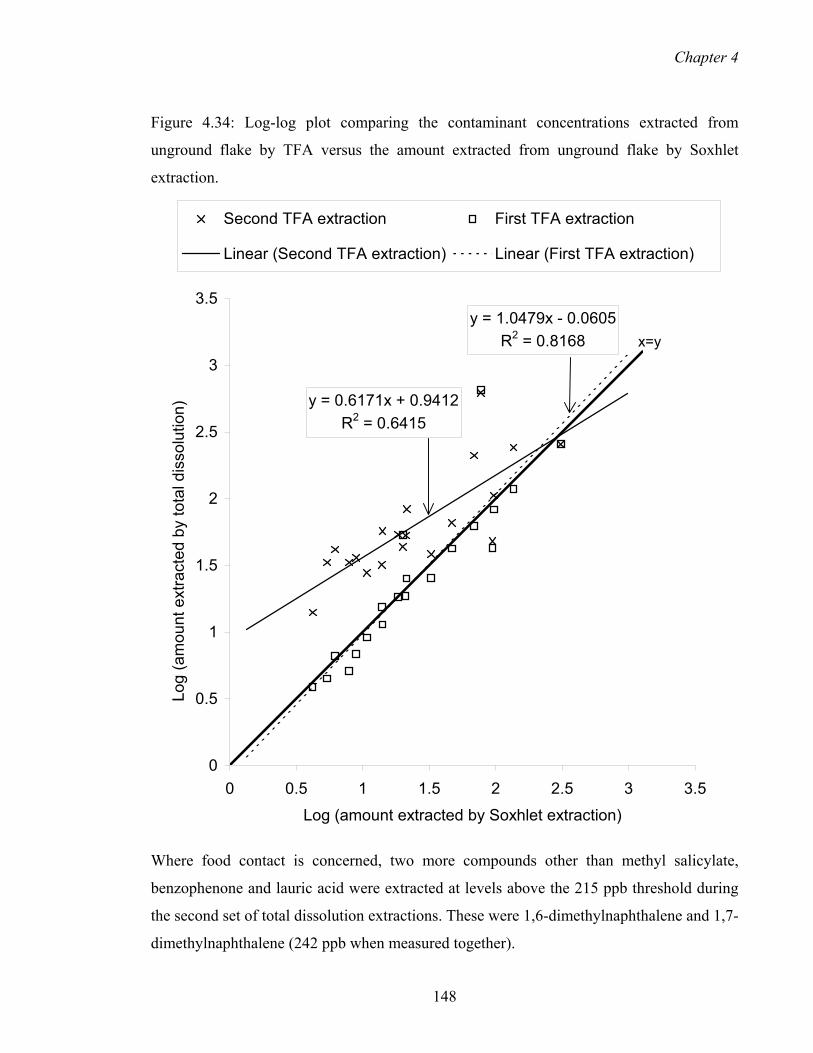
Chapter 4
Figure 4.34: Log-log plot comparing the contaminant concentrations extracted from
unground flake by TFA versus the amount extracted from unground flake by Soxhlet
extraction.
y = 0.6171x + 0.9412R2 = 0.6415
y = 1.0479x - 0.0605R2 = 0.8168
0
0.5
1
1.5
2
2.5
3
3.5
0 0.5 1 1.5 2 2.5 3 3.5
Log (amount extracted by Soxhlet extraction)
Log
(am
ount
ext
ract
ed b
y to
tal d
isso
lutio
n)
Second TFA extraction First TFA extraction
Linear (Second TFA extraction) Linear (First TFA extraction)
x=y
Where food contact is concerned, two more compounds other than methyl salicylate,
benzophenone and lauric acid were extracted at levels above the 215 ppb threshold during
the second set of total dissolution extractions. These were 1,6-dimethylnaphthalene and 1,7-
dimethylnaphthalene (242 ppb when measured together).
148

Chapter 4
4.3.7 Particle size range and degree of crystallinity
The observed differences in concentration of the contaminants with the PET particle size
could have resulted from the grinding procedure selectively milling the less crystalline
uniaxially orientated fractions (bottle top and bottom) more readily than the more
crystalline biaxially orientated part (bottle mid-section) of the flake. Although polymer
brittleness is renowned for increasing with polymer crystallinity (Schumann and Thiele
1996), the biaxial orientation of the bottle mid-section prevents it from rapid grinding.
Conversely, despite being more amorphous, the bottle top and bottom is uniaxially
orientated and possesses some crystallinity (Table 4.13), which allows the polymer to
acquire brittleness for superior grinding.
The more amorphous regions could potentially be more contaminated than the crystalline
and biaxially oriented regions, as discussed in previous sorption studies (Mitz et al. 1997).
In the current study, DSC experiments confirmed that (the thicker and more transparent
flakes from) the top and bottom are more amorphous than are (the thinner and more opaque
flakes from) the midsection (Table 4.13), and, as can be seen from Table 4.14, the grinding
process appears not to alter the average degrees of crystallinity of the particles in each of
the particles size ranges.
However, for typical ‘grabs’ of the PET flake without segregation into the top and bottom
material and the mid-section flakes, XRD showed there to be little difference in percentage
crystallinity between each particle size range. In particular, it is clear from Table 4.14 that
there was no significant difference in percent crystallinity between the small and medium
particle size ranges, for which the contaminant levels were most different (Figures 4.15-
4.16). Therefore, crystallinity does not account for the differences in contaminant
concentrations between each size here. Furthermore, where there does appear to be a small
but clear increase in percentage crystallinity (between the medium and large-sized
particles), differences in contaminant levels are minimal (but do decrease), so the degree of
crystallinity could be a contributing factor in this case, albeit a weak one.
The other clear aspect of Table 4.14 is that the unsegregated, ground PET has a degree of
crystallinity much closer to that of amorphous flake (tops and bottoms of the bottles, Table
4.13) than to the midsections of the bottles. Assuming that the crystallinity values in Table
4.14 are a simple average of the components given in Table 4.13, then (averaged over the
149

Chapter 4
two batches), there is 93% of the amorphous material in the two smaller particle size ranges
(0-300 µm, >300-425 µm) in the unsegregated, ground PET and 70% in the large particle
size range (>425-700 µm). The calculations for these percentages are shown in the
appendix 2. The percentage of amorphous material in the unsegregated ground flake was
also estimated gravimetrically by randomly obtaining a handful of flake, segregating the
flake into ‘amorphous’ and ‘crystalline’ material by visual inspection, and then separately
grinding the material, sieving it into the three particle size ranges and weighing the isolated
particles. The masses of each of the particle size ranges for the crystalline and amorphous
flake are shown in Table 4.15. The percentages resulting from the amorphous fraction of
the random handful of flake were calculated to be 68%, 64% and 57% for the small,
medium and large particle size ranges respectively. This experiment further shows that the
amorphous material of the flake is more easily ground than the biaxially oriented crystalline
material, considering the initial amount of crystalline and amorphous material was 48g and
19g respectively.
Table 4.13: Percentages of crystallinity for amorphous and crystalline fractions of washed
and dried flake ground to different particle sizes.
Mid section of bottle crystallinity
(75.4% by mass in total sample)
Top and bottom of bottle crystallinity
(24.6% by mass in total sample)
Ground to 0-300 µm
48.41 % 19.61 %
Ground to >300-425 µm
51.85 % 19.22 %
Ground to >425-700 µm 48.93 % 12.94 % Table 4.14: Percentages of crystallinity for two batches of unsegregated washed and dried
flake ground to different particle sizes.
Batch 1 Batch 2
Ground to 0-300 µm
20.6 % 22.8 %
Ground to >300-425 µm
20.9 % 22.2 %
Ground to >425-700 µm 23.0 % 23.6 %
150

Chapter 4
Table 4.15: Mass of amorphous and crystalline flake ground to different particle sizes.
Amorphous (19 g) Crystalline (48 g)
% Due to amorphous
Ground to 0-300 µm
1.61 g (8.5%) 0.75 g (1.6%) 68
Ground to >300-425 µm
1.59 g (8.4%) 0.88 g (1.8%) 64
Ground to >425-700 µm 3.12 g (16.4%) 2.41 g (5.0%) 57
Ungrounded
12.7 g (67%)
43.9 g (91%)
22
Similarly, from Table 4.13, given that the original percentage of the more amorphous
material was only 24.6%, there is no doubt that flakes derived from the softer, amorphous
sections of the top and bottom of the PET bottles are selectively ground in the particle size
reduction process. However, as the degrees of crystallinity are generally the same for each
particle size range (Table 4.14), differences in crystallinity do not account for differences in
contaminant concentrations between each particle size.
It is therefore suggested that the increase in contaminant concentration with smaller particle
size could be attributed to the size reduction process selectively grinding the highly
contaminated surface of the flake to 0-300 µm. The material ground to larger particles
sizes would then contain a proportionately larger quantity of material derived from the
interior of the plastic where it is less likely to have significant contact with impurities.
As a possible test of the hypothesis, the percentages extracted from the largest particle size
relative to that extracted from the smallest particles size have been plotted versus
contaminant molecular weight in Figure 4.35.
Two of the 32 compounds (1,2,4-trimethyl benzene and 3-ethyl-o-xylene) have percentages
greater than 100. As these are two of the compounds with large standard deviations (A0-300
µm/A>300-425 µm = 1.5 ± 0.7 for both compounds) and are contrary to the general trend, they
have been eliminated. Also, for simplicity, the results for the four dimethylnaphthalene
isomers have been averaged to yield one representative point on the graph. Similarly, the
ratios for the six trimethylnaphthalene isomers have been averaged.
151

Chapter 4
Figure 4.35: Percentage of amount extracted from the >425-700 µm particle size range to
the amount extracted from the 0-300 µm particle size range plotted versus contaminant
molar mass.
y = 630.52e-0.018x
R2 = 0.4326
0
10
20
30
40
50
60
70
80
90
100
100 120 140 160 180 200 220Contaminant MW
100(
Am
ount
Ext
ract
ed fr
om 4
25-7
00 u
m/A
mou
nt in
< 3
00 u
m)
There is a weak negative correlation (R2 = 0.43), but one that is consistent with the original
contamination process of the PET bottles, if the small particles are disproportionately
derived from the surface of the bottles.
The alternative possible explanation for the correlation in Figure 4.35 lies in the diffusion
of contaminants into crystalline regions being smaller than into amorphous regions of the
bottle and decreasing as the size of the contaminant increases (Begley et al. 2002).
However, as we have already pointed out, the data in Table 4.14 indicates that there is no
significant change in crystallinity between the small and medium size particles where the
152
Chapter 4
decrease in contaminant levels is large. On the other hand, the small increase in
crystallinity between the medium and large size particles may contribute to the small
decrease in contaminant levels. (The equivalent plot of the percentage extracted from the
medium particle size relative to that extracted from the smallest particle size versus
contaminant molecular weight had R2 close to 0.25, demonstrating a weaker correlation.)
4.3.8 Investigation of the relative levels of contaminants in the two types of flake
Washed and dried flake was segregated into amorphous and crystalline particles, ground
individually to the three particle size ranges and then analysed by the sonication method.
Figure 4.36 is the log-log plot of amounts of contaminants in the more crystalline particles
versus the amounts in the amorphous particles for each particle size range and presents an
overview of the comparison.
The group of points centrally located below the lines of best fit are all related to three
compounds: cineole, (-)-menthone and n-hexylbenzoate, the last of which compounds is
also responsible for the two points on the baseline near the origin. (See Table 4.16 for
individual details.) Analyses for these compounds would be clearly compromised by the
selective grinding of the amorphous PET flakes because of the very different levels
apparent in the amorphous and crystalline flake. A much more rigorous procedure would
be required for representative sampling in these cases (Cross 2000). For the rest of the
contaminants, the vast majority of the data points are uniformly spread about the ideal
(y=x) line in a random fashion, although, given the log-log scale it is clear that thee are still
significant differences in the measured values for some contaminants.
Close examination of Table 4.16 shows, for example, that cymene and limonene seem to be
absorbed more strongly onto the crystalline phase and would again require more careful
sampling procedures after sample size reduction. (Triplicate Soxhlet analyses of unground
flake after segregation into the amorphous and more crystalline shreds strongly support this
finding, with 100x(the amount in the more crystalline material/the amount in the
amorphous phase) = 314% for limonene and 514% for cymene.) A possible explanation for
this finding is that these compounds derive from soft drink and the contact times between
them and the crystalline and amorphous parts of the bottle are not the same (the top of the
bottle, which is amorphous is not usually in permanent contact with the soft drink).
153

Chapter 4
For 2-methylnaphthalene and 1-ethylnaphthalene Table 4.16 indicates a slight bias towards
absorption into the amorphous phase and the triplicate Soxhlet analyses again support the
findings, with 74% and 70% respectively being found in the more crystalline phase, relative
to the amorphous phase. On the other hand, from Table 4.16 the six trimethylnaphthalene
isomers appear to be ideal analytes in that there is negligible discrimination between the
levels measured in the two phases, and, for the remainder of the contaminants there appears
not to be clear discrimination. In these cases, the tripicate Soxhlet analyses generally
indicated the amorphous phase to be favored, with relative amounts in the more crystalline
phase varying between 62% and 86%.
154

Chapter 4
Figure 4.36: Log amount extracted from crystalline particles versus log amount extracted
from amorphous particles, for each particle size range.
y = 1.1436x - 0.3332R2 = 0.8395
y = 1.034x - 0.1084R2 = 0.9051
y = 0.9148x + 0.0256R2 = 0.8079
0
0.5
1
1.5
2
2.5
3
3.5
4
0 1 2 3 4
log [Amount in Amorphous]
log
[Am
ount
in C
ryst
allin
e]0-300 um >300-425 um>425-700 um Linear (0-300 um)Linear (>300-425 um) Linear (>425-700 um)
y=x
155

Chapter 4
Table 4.16: Levels of contaminants in amorphous and crystalline flake ground to different particle sizes
(analysed by sonication in DCM for 3 h). (All levels are in ppb by mass.)
Amorphous Flake (top and bottom of the bottle)
Crystalline Flake (midsection of the bottle)
Contaminants
0- 300 µm
>300-425 µm
>425-700 µm
0-300 µm
>300-425 µm
>425-700 µm
1,2,4-, Trimethylbenzene
42.5 17.7 14.0 31.9 18.8
12.5
m-Cymene 54.0 34.4 33.1 100.7 62.3 46.4
(R)-(+)-Limonene
786.7 410.9 286.7 1133 460.7 407.5
Cineole
42.1 48.9 116.5 10.7 10.1 6.3
γ-Terpinene
61.1 34.4 28.5 61.1 23.1 18.8
3-Ethyl-o-xylene
10.7 5.4 4.2 8.9 4.3 3.1
Benzene, 1,2,3,5- tetramethyl-
21.4 13.7 11.7 18.7 10.3 8.6
(-)-Menthone
53.7 25.7 22.4 11.8 37.3 4.1
Methyl salicylate
n/a n/a n/a n/a n/a n/a
4-n-Propylanisole
40.8 17.4 15.0 36.6 30.5 29.3
Naphthalene
93.8 35.5 29.6 81.0 43.9 30.7
n-Dodecane 211.3 122.4 172.9 192.1 135.7 142.9
2-Methylnaphthalene
174.7 94.9 82.8 155.1 66.7 70.2
1- Methylnaphthalene
225.9 121.6 68.6 257.3 68.1 50.3
Biphenyl
30.9 11.9 12.6 23.4 15.6 13.7
1-Ethylnaphthalene
63.0 28.9 22.0 56.3 26.2 17.8
2,6- Dimethylnaphthalene
157.6 71.2 46.9 159.9 57.6 46.9
156

Chapter 4
Tetradecane
284.4 196.3 225.6 313.8 192.3 238.9
1,2- Dimethylnaphthalene
84.5 50.9 26.1 102.0 37.6 19.3
1,7- & 1,6-Dimethylnaphthalene
407.5 216.3 155.0 468.8 166.3 112.5
1,4- Dimethylnaphthalene
161.8 85.0 51.9 201.2 56.1 36.6
Trimethylnaphthalene Isomer 1
29.7 14.7 10.5 30.6 13.5 10.5
Trimethylnaphthalene Isomer 2
22.5 10.7 6.6 24.9 9.1 7.2
Trimethylnaphthalene Isomer 3
31.8 18.3 11.3 28.4 13.9 11.2
Trimethylnaphthalene Isomer 4
20.1 10.7 6.8 23.4 10.4 6.5
Trimethylnaphthalene Isomer 5
22.6 9.2 5.6 23.4 8.8 6.2
Trimethylnaphthalene Isomer 6
29.1 16.0 9.4 33.3 13.7 8.7
Dodecanoic acid
n/a n/a n/a n/a n/a n/a
n-Hexylbenzoate
33.3 2.3 0.0 3.4 0.0 0.0
Benzophenone 955.2 473.9 578.4 1164.2 720.1 453.4
However, there are some further compounds indicated by the triplicate Soxhlet analyses to
be favored more in the more crystalline phase: lauric acid 143%, n-hexyl benzoate 221%,
1,2,4,-trimethylbenzene 164% and 3-ethyl-o-xylene 118%. However, notwithstanding the
Soxhlet analysis being averages of triplicates, where these do not agree with the results in
Table 4.13, care should be taken in placing too much emphasis upon them since the
sampling error is likely to be significant. In three cases (cineole, methyl salicylate and 4-n-
157

Chapter 4
propylanisole) the measured values varied by as much as an order of magnitude, with the
ranges for the two phases overlapping. These are clear examples of the heterogeneity
between flakes. Thus we believe the Table 4.16 data to be generally more reliable.
The gradients of the individual plots in Figure 4.36 approximate 1, but can be seen to
systematically decrease as the particle size increases. However, the intercepts tend to
compensate for the deviations in the gradients relative to 1, and we interpret these
deviations in the gradient as the result of the relatively few data points at the extremities of
the sets, combined with the effects of outliers. Generally, the levels of contaminants in the
crystalline and amorphous particles resemble each other, so that the selective grinding of
the amorphous flake will not lead to significant errors in the analysis for most of the
contaminants.
The detailed sonication data in Table 4.16 very strongly support the Soxhlet data in Figures
4.15-4.17 in that the levels of contaminants in both amorphous and crystalline PET
decreased significantly from the 0-300 µm particle size range to the larger particle size
ranges. In turn, the hypothesis of selective grinding of the more contaminated flake surface
to a smaller size relative to the less contaminated inner core was further strengthened.
In order to circumvent the effect of selective grinding when studying the influence of path-
length on extraction, the amorphous PET from the washed and dried flake was flattened
using a hydrolytic press and extracted by DCM sonication. The GC/MS results for this
extract were compared to those determined for the unflattened (amorphous) flake, which
were also extracted by sonication.
Figure 4.37 is the log-log plot of amounts of contaminants in the unflattened particles
versus the amounts in the flattened particles for each particle size range. The gradient of
this plot approximates unity, indicating that there is negligible difference in the amount of
contaminant extracted from unflattened amorphous pellets relative to the flattened
amorphous pellets. This result further supports the presumption that the variation in
contamination with particle size could have resulted from selective grinding rather than a
decrease in extraction efficiency with increasing particle path length.
158

Chapter 4
Figure 4.37: Log amount extracted from whole amorphous pellets versus log amount
extracted from flattened amorphous particles.
y = 0.9897xR2 = 0.9659
-0.5
0
0.5
1
1.5
2
2.5
3
3.5
-0.5 0 0.5 1 1.5 2 2.5 3 3.5
Flattened amorphous (log conc)
Who
le a
mor
phou
s (lo
g co
nc)
4.3.9 Representative sampling
Obtaining representative samples small enough for analysis, from bulk materials that are
heterogeneous in nature, is always problematic and multi-layered (Cross 2000). For used
PET, first there is the heterogeneity of the bulk shredded, washed and dried, curbside
collected material. This heterogeneity is itself bi-faced; the bottles have variable histories
and thus contaminant profiles and concentrations and the amorphous PET in the tops and
bottoms of the bottles may or may not contain the same levels of contaminants as the
midsections of the same bottles (Table 4.16). Putting aside the low frequency occurrences
of contamination by pesticides, herbicides and other poisons, lubricating oils etc. – all of
which would be diluted and eventually internalized in the recycling extrusion process, and
none of which have been detected in these studies – a large sample of shredded flake is
required to reasonably represent the variable histories of the collected bottles. From the
159

Chapter 4
previous section, it seems that some contaminants are more concentrated in either of the
structurally different parts of the bottle and some are not. Therefore it depends upon the
contaminants of interest as to whether the material from the tops and bottoms of the bottle,
and the shredded midsections must be sampled in proportion to their amounts. If
proportional sampling is needed, the second problem is how to achieve it, although the
sampling of bulk materials is well understood (Smith and James 1981).
Whichever is the case, particle size reduction is generally essential. Our analyses of
unground flake by alternative methods led to far greater discrepancies than were observed
for the same procedures compared for the large or medium sized particles (Figure 4.33).
This is simply a reflection of the number of particles (flakes) sampled. The only way to
circumvent this problem and eliminate the need for particle size reduction is analyse the
same mass of material as would be used to generate the ground material. In terms of
dissolution or sonication this involves economically and environmentally unacceptable
amounts of solvents, but with the capital-expensive accelerated solvent extraction, large
volume extraction cells are a very attractive alternative that removes the need for particle
size reduction and the subsequent sampling of the distribution of particle sizes generated.
Disregarding the few contaminants at the top of Table 4.11 (that tend to be misleading) and
those in column TFA (2), for the majority of compounds in this study, the levels of
contaminants in the unground flake appear to lie between those measured in the medium
and large sized particles or not far below that range of concentrations. Therefore, from
Table 4.16 there are two compounds whose levels relative to the FDA threshold will
depend upon the particle sizes analysed; 1-methylnaphthalene and the 1,6- and 1,7-
dimethylnaphthalene isomers, if measured together.
4.3.10 Levels of contaminants in flake and the threshold of regulation
The contaminants identified in the flake above the 215 ppb FDA threshold were limonene,
methyl salicylate, benzophenone, lauric acid and dodecanoic acid. Benzophenone, a well-
known surrogate used in challenge tests, has been reported by researchers in the past to be
the most difficult analyte to remove, possibly due to the good solubility match between
benzophenone and PET (Franz et al. 1998, Harding et al. unpublished). Limonene has
been found to occur at low ppm levels (1.5 ppm to 11.0 ppm) in washed and dried
160

Chapter 4
commercial flake by Franz and Welle (1999b). Bayer (2002) reported even higher levels of
limonene (18 ppm) and methyl salicylate (15.3 ppm) after commercially washing the PET.
Triantafyllou et al. (2002) identified limonene in washed and dried PET flake at levels
between 2.5 and 15 ppm. Despite the high concentrations obtained for limonene, PET has
been shown to absorb the least amount of aroma components compared with low-density
polyethylene, and an ionomer (Gavara et al. 1997). Van Willige et al. (2002) obtained
similar results for the sorption of flavor compounds onto PET, low-density polyethylene,
polypropylene and polycarbonate. Fortunately, PET has the advantage of having a low
sorption capacity compared to polyolefins, PC (polycarbonate) and EVOH making it more
suitable for use as a food packaging (Nielsen et al. 1992, Nielsen 1994, Van Willige et al.
2002, Imai et al. 1990, Gavara et al. 1997).
The amounts of contaminants obtained by Soxhlet extraction represent the maximum level
of migration. In the actual contact situation such an amount may never be attained, or
excessively long-term storage may be required to reach that level. During the challenge
tests carried out by Visy (Harding et al. unpublished, Cross et al. unpublished) it was
observed that the levels of contaminants present in deliberately contaminated washed and
dried flake exceeded the real levels of contaminants determined during this study; yet the
recycled material was deemed suitable for food contact use due to low migration levels.
In the next Chapter we will examine whether the levels of these contaminants exceed the
FDA threshold after extrusion into pellets.
161

Chapter 5
CHAPTER 5 SEMI-VOLATILE CONTAMINANTS AND LEVELS OF OCCURRENCE IN
EXTRUDED PET PELLETS FROM CURBSIDE COLLECTION
5.1 GENERAL INTRODUCTION
5.1.1 Purpose of the chapter It was reported by Harding et al. (unpublished) that the wash stage of the Visy Plastics
recycling process removes surrogate contaminants by 75.5 % - 96.5%. The subsequent
extrusion step, which involves melting the washed and dried shredded PET (flake)
under vacuum, further reduced the residual contamination levels, achieving overall
reduction of the initial levels by 93.8% - 99.7%. Therefore this latter stage is viewed as
an important treatment in terms of decontaminating simulated post-consumer PET. It
should be realised, however, that high removal efficiency does not always result in a
low residual concentration. As determined previously by Cross et al. (unpublished),
further migration experiments were necessary because the level of each surrogate in the
final recycled material nonetheless exceeded the 215 ppb threshold. It was concluded in
that paper that the level of each “specific” contaminant migrating into a soft drink
simulant proposed by the FDA (10% ethanol) was within the maximum migration
specification of 10 ppb, deeming the material suitable for food-contact use. Other
researchers have reported similar results from their migration studies (Franz and Welle
1999a, Komolprasert et al. 1997).
In terms of food contact approval these were encouraging results, however the reality
was that the levels of specific surrogate chemicals in the recycled material were still
above the 215 ppb threshold.
It has been already shown in Chapter 4 that the levels of most contaminants in curbside
washed and dried shredded PET (flake) were below the 215 ppb limit. Contaminants
exceeding this limit were limonene, methyl salicylate, benzophenone, lauric acid and a
total of the dimethylnaphthalene derivatives. It was anticipated that the level of these
contaminants would decrease below 215 ppb after extrusion of the flake due to the
extreme temperature and vacuum conditions involved in this treatment and the low
levels of post-consumer contaminants in washed and dried flake. The major reason
why the concentration of the challenge compounds (surrogates) was not reduced below
215 ppb (Harding et al. unpublished) is because the initial concentrations used in
162

Chapter 5
challenge tests are intentionally exaggerated to represent a worst-case scenario (FDA
1992, Komolprasert et al. 1997, Franz et al. 1998). Such large concentrations from
consumer misuse/reuse are not expected to occur in real life. In fact, a 10-fold safety
factor is fixed per bottle with 100% of the bottles deliberately contaminated with
challenge chemicals (FDA 1992). In a real situation it is estimated that 0.1% of bottles
(1 in 1000 bottles) is contaminated by consumer abuse whilst the contaminant level
resulting from the portion of bottles used for household cleaners and detergents is 1%
(1 in 100 bottles). Therefore a factor of 1,000 - 10,000 is included in the overall
challenge test.
This chapter focuses on the optimization of the Soxhlet extraction of contaminants from
extruded (melted at 170-215°C under vacuum) PET pellets before and after they are
thermally crystallised in the quest to determine whether these high temperature
purification steps decontaminate curbside washed and dried flake to acceptable
contaminant levels (below 215 ppb).
As was the case in our studies of the washed and dried flake (Chapter 4), the
parameters optimised (for the pellets) were particle size and extraction time in an effort
to ensure complete recovery. As already shown in Chapter 4, extraction with DCM
was considered appropriate for the extraction of free, diffusible contaminants out of
washed and dried flake; therefore it was subsequently used as the extraction solvent for
extruded PET pellets. In addition, as presented in Chapter 4, weight uptake
experiments confirmed that DCM was the most aggressive solvent towards swelling
PET pellets (relative to hexane, acetone, chloroform, ethyl acetate, 2-propanol and
ethanol).
It was suggested in previous papers (Feigenbaum et al. 2002, Riquet and Feigenbaum
1997) that if a solvent is soluble in a plastic, it opens up the polymer matrix and
therefore facilitates the diffusion of potential migrants. Sorption rates (i.e., diffusion
coefficients) of DCM into amorphous and crystallised PET pellets were determined
assuming Fickian behaviour and discrepancies were interpreted in terms of differences
in polymer morphology. Analogously, extraction rates (i.e., diffusion coefficients) of
contaminants out of amorphous and crystallised PET into DCM were determined.
163

Chapter 5
5.1.2 Brief outline of this chapter
This chapter presents the Soxhlet extraction kinetics of annealed extruded pellets
ground to three different particle size ranges (0-300µm, >300-425µm and >425µm -
700µm). The effects of extraction time and particle size on the levels of contaminants
extracted were subsequently investigated.
Whole amorphous and annealed extruded pellets were extracted with time and the
effects of crystallinity on contaminant extraction and DCM sorption kinetics were
discussed using calculated diffusion coefficients.
In addition, the amorphous pellets were flattened using a hydraulic press (pressure = 8
tons) to reduce the path-length of the amorphous pellets prior to extraction. The effect
of flattening on the levels of contaminants was studied.
Finally, comparisons in contaminant levels were made between washed and dried flake
and extruded (amorphous) pellets, and conclusions were drawn regarding the use of the
recycled material for food-contact purposes.
164

Chapter 5
5.2 KINETICS OF SOXHLET EXTRACTION FROM EXTRUDED AND
ANNEALED PET
The importance of reducing polymer particle size in extraction studies is well
documented (Perlstein 1983, Spell and Eddy 1960, Ashraf-Khorassani et al. 1991).
Smaller particle sizes give rise to shorter diffusion paths for the mass transfer of
contaminants to the surface of the polymer particle. Therefore extraction is normally
more rapid when PET is ground (Vandenburg et al. 1997).
Since completely amorphousφ extruded pellets are not naturally brittle enough to grind
(polymer brittleness increases with crystallinity), the effect of particle size on the
extraction of amorphous pellets – and thus the examination of possible variations in
concentrations on the surface and in the bulk – could not be determined. Hence in order
to assist with the grinding process, amorphous pellets were made brittle by thermal
crystallization known as “annealing”, which involves heating the pellets in an oven set
at 150ºC for 1 hour with occasional stirring. Successful grinding meant that the effect
of pellet size reduction on the extraction kinetics of extruded PET could be examined.
Furthermore, since the annealing of extruded PET pellets normally precedes soft drink
bottle manufacture, the levels of contaminants determined in heat-treated extruded PET
are highly relevant. Hence it is of interest to determine whether “annealing” is an
efficient decontamination step.
5.2.1 Pellets ground to 0-300 µm
In our first experiments, finely ground annealed pellets (0-300 µm) were Soxhlet
extracted for 1, 3, 8, 24, 48 and 72 h to determine the minimum time required for
exhaustive extraction of contaminants. Figures 5.1 – 5.3 indicate that 1 h Soxhlet
extraction is clearly inadequate to entirely extract contaminants out of the fine-ground
pellets. All of the plots exhibit (at least) a localized maximum at 3 h, most display a
minimum at 8 h followed by higher values at 24 and 48 h and finally a reduced value at
72 h. These features appear to be artifactual and are no doubt due to a combination of
the fact that only a single experiment was done to determine each point, and, the
presence of some sample heterogeneity between the samples used for each time interval.
It seems clear that 3 h is sufficient for total extraction and that the best estimates of the φ The reference by Schumann and Thiele (1996) states that the PET melt and polymer chips are completely amorphous. They can then be made crystalline by temperature or mechanical deformation.
165

Chapter 5
levels of the contaminants from these experiments will be the average of the last five
data points.
Figure 5.1: Soxhlet extraction kinetic study of annealed pellets ground to 0-300 µm.
Compounds identified at levels below 10 ppb.
0
2
4
6
8
10
12
0 5 10 15 20 25 30 35 40 45 50 55 60 65 70 75
Time (h)
Am
ount
Ext
ract
ed (p
pb)
m-Cymene Cineole3-Ethyl-o-xylene 1,2,3,5-Tetramethylbenzene(-)-Menthone Dodecane4-n-Propylanisole Tetradecane2-Methylnaphthalene 1-Methylnaphthalene1-Ethylnaphthalene 2,6-Dimethylnaphthalene1,7-Dimethylnaphthalene 1,6-Dimethylnaphthalene1,4-Dimethylnaphthalene 1,2,4-Trimethylbenzenen-Hexylbenzoate 1,2-Dimethylnaphthalenegamma-Terpinene
166

Chapter 5
Figure 5.2: Soxhlet extraction kinetic study of annealed pellets ground to 0-300 µm.
Trimethylnaphthalene isomers.
0
0.5
1
1.5
2
2.5
3
0 10 20 30 40 50 60 70
Time (h)
Am
ount
Ext
ract
ed (p
pb)
Trimethylnaphthalene Isomer 1 Timethylnaphthalene Isomer 2Trimethylnaphthalene Isomer 3 Trimethylnaphthalene Isomer 4Trimethylnaphthalene Isomer 6 Trimethylnaphthalene Isomer 5
167
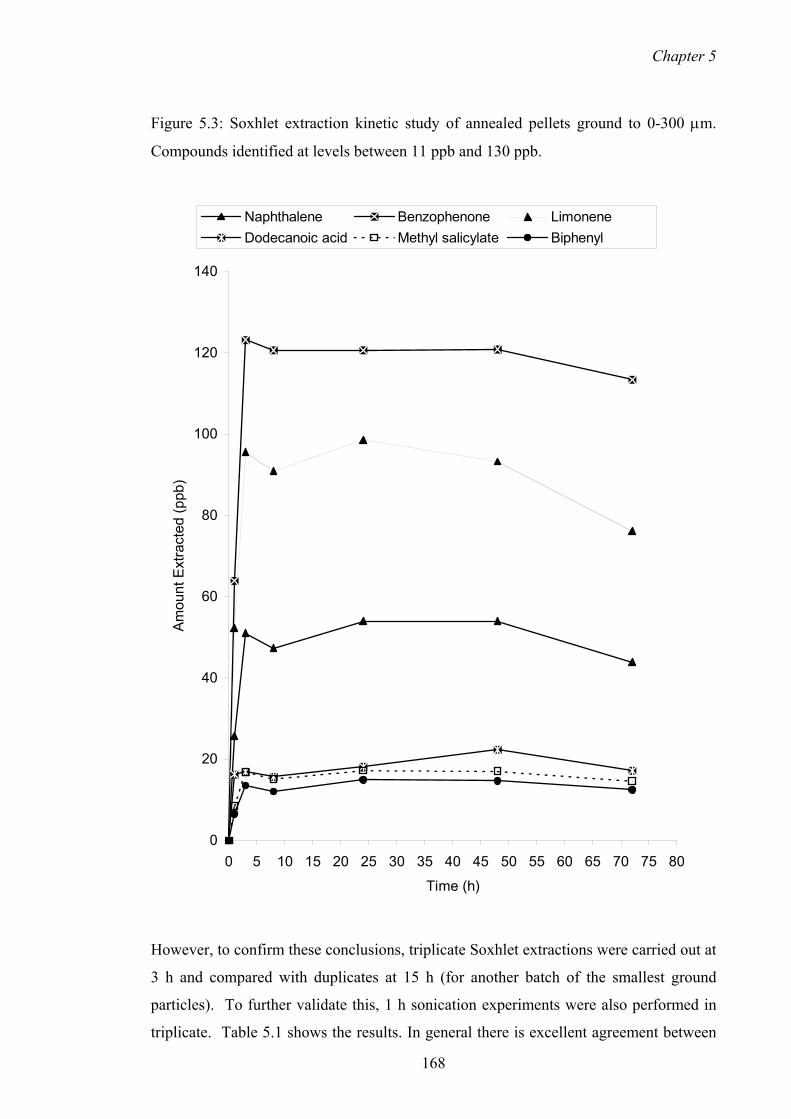
Chapter 5
Figure 5.3: Soxhlet extraction kinetic study of annealed pellets ground to 0-300 µm.
Compounds identified at levels between 11 ppb and 130 ppb.
0
20
40
60
80
100
120
140
0 5 10 15 20 25 30 35 40 45 50 55 60 65 70 75 80
Time (h)
Am
ount
Ext
ract
ed (p
pb)
Naphthalene Benzophenone LimoneneDodecanoic acid Methyl salicylate Biphenyl
However, to confirm these conclusions, triplicate Soxhlet extractions were carried out at
3 h and compared with duplicates at 15 h (for another batch of the smallest ground
particles). To further validate this, 1 h sonication experiments were also performed in
triplicate. Table 5.1 shows the results. In general there is excellent agreement between
168
Chapter 5
the 15 h Soxhlet extractions and sonication results, indicating that complete extraction
has occurred under these conditions. And for 27 of the 30 compounds, student t-tests
comparing the amounts of contaminants extracted at 3 h and 15 h yielded tcalc values
lower than the tref value of 2.78 at a 5% confidence level. These results confirmed that a
3 h Soxhlet extraction was adequate to extract 90% of the investigated contaminants
from the finely ground (0-300 µm) annealed pellets.
For the remaining three compounds - benzophenone, 1-ethylnaphthalene and
trimethylnaphthalene isomer 2 - the tcalc values were 3.45, 5.20 and 3.29 respectively.
Therefore the tref value of 2.78 was exceeded, implying that extraction was unachievable
in 3 h for these compounds. However, a closer examination of the extraction kinetics
(Figures 5.1 - 5.3) does not reveal any significant difference between these three
compounds and the rest. We conclude that 3 h is sufficient for the full extraction of all
contaminants from the small particles.
Comparatively, extraction by sonication proved to be more time efficient relative to
Soxhlet extraction, reducing the extraction time to 1 h (Table 5.1). A possible
explanation for this result is attributed to the compact packing of the polymer powder in
the Soxhlet extraction thimble compared to particulate dispersion during sonication.
When polymer particles are isolated from each other in DCM there is greater solvent
accessibility into the polymer matrix and hence migration is facilitated. This
accessibility is hindered when the particles are crammed together as there is less surface
area exposed for the solvent to penetrate.
It is also possible that the agitating motion of the sonication process moves solvent into
the polymer matrix and therefore liberates contaminants out of it more readily than by
Soxhlet extraction.
Contrary to the Soxhlet extraction of fine-ground annealed pellets (particle size = 0-300
µm) that took 3 h to extract, Soxhlet extraction of fine-ground flake was not completed
until 24 h (Chapter 4, Section 4.3.2). This may have resulted from the ground flake
being slightly more amorphous (percent crystallinity = 20.6-22.8%) than the powdered
annealed pellets (percent crystallinity = 24.4%) thus undergoing coalescence during
swelling.♣
♣ Another possible explanation for the faster extraction of the fine-ground annealed pellets relative to the fine-ground flake is that depending on the shape and size of the particles, the effective contact time with DCM is different due to the different effective surface of the particles.
169

Chapter 5
Table 5.1: Amounts of contaminants extracted from annealed pellets ground to 0-300 µm
by Soxhlet extraction and sonication (standard deviation, n=3 for 3 h; n=2 for 15 h).
1,2,4- Trimethyl-benzene
3-Ethyl-o-xylene
1,2,3,5- Tetramethyl-benzene
(-)-Menthone
Methyl salicylate
4-n-propyl anisole
3 h Soxhlet 6.2 (0.3) 1.2 (0.1) 0.9 (0.0) 2.4 (0.2) 14 (2) 6.6 (0.3) 15 h Soxhlet 6.3 (0.1) 1.2 (0.1) 0.9 (0.1) 2.6 (0.1) 15 (1) 6.9 (0.1) 1 h Sonication 6.9 (0.9) 1.3 (0.2) 0.9 (0.0) 2.6 (0.1) 15 (0) 6.8 (0.1)
m-Cymene
Limonene Cineole γ-Terpinene Naphthalene Biphenyl
3 h Soxhlet 10.5 (0.3) 131 (22) 6.9 (0.3) 6.6 (1.0) 50 (1) 16 (1) 15 h Soxhlet 9.9 (0.9) 117 (4) 6.8 (0.6) 5.3 (0.2) 50 (1) 17 (0) 1 h Sonication 11 (1) 122 (0) 7.3 (0.3) 5.4 (0.3) 50 (0) 15 (1)
2-Methyl naphthalene
1-Methyl naph.
1-Ethyl naph.
2,6- Dimethyl naph.
1,7- & 1,6- Dimethyl naph.
1,4- Dimethyl naph.
3 h Soxhlet 9.5 (0.3) 4.6 (0.3) 2.7 (0.1) 6.8 (0.3) 19 (1) 1.9 (0.2) 15 h Soxhlet 11 (1) 5.2 (0.3) 3.0 (0.0) 7.8 (0.0) 21 (0) 1.9 (0.1) 1 h Sonication 9.9 (0.8) 5.1 (0.6) 2.5 (0.1) 6.9 (0.5) 20 (1) 1.9 (0.2)
1,2- Dimethyl naph.
Trimethyl naphthalene Isomer 1
Trimethyl naph. Isomer 2
Trimethyl naph. Isomer 3
Trimethyl naph. Isomer 4
Trimethyl naph. Isomer 5
3 h Soxhlet 1.6 (0.0) 1.2 (0.1) 1.3 (0.1) 1.4 (0.1) 1.3 (0.1) 1.2 (0.1) 15 h Soxhlet 1.7 (0.1) 1.2 (0.1) 1.6 (0.1) 1.7 (0.2) 1.5 (0.1) 1.5 (1.4) 1 h Sonication 1.7 (0.1) 1.2 (0.1) 1.5 (0.1) 1.5 (0.2) 1.5 (0.1) 1.4 (0.0)
Trimethyl naph. Isomer 6
Benzo- phenone
Tetradecane Lauric acid⊕
n- Hexyl benzoate
Dodecane
3 h Soxhlet 1.9 (0.1) 80 (2) 15 (6) 44 (21) 5.3 (1.4) 16 (5) 15 h Soxhlet 2.2 (0.3) 92 (5) 9.2 (2.7) 42 (25) 5.0 (0.5) 15 (4) 1 h Sonication 2.2 (0.1) 91 (4) 15 (5) 53(7) 4.0 (0.5) 18 (5)
⊕ Lauric acid is also known as “dodecanoic acid”.
170

Chapter 5
This fusion of the fine-ground flake was observed when attempting to empty the
extraction thimble following Soxhlet extraction.
The tight packing of the fine powder in the Soxhlet thimble enhances this fusing effect,
which has been observed by others in the presence of high temperature during
accelerated solvent extraction (Eskilsson and Björklund 2000, Vandenburg et al. 1997,
Lou et al. 1997).
5.2.1.1 Pellets ground to 0-300 µm: The relationship between extraction kinetics and
contaminant molecular weight.
A plot of the amounts of contaminants extracted (from annealed pellets ground to 0-300
µm) at 1h divided by the amounts extracted at equilibrium (an average of five values at
3, 8, 24, 48 and 72 h) versus the contaminant molecular weight is presented in Figure
5.4. The extraction levels for the dimethyl naphthalene isomers and trimethyl
naphthalene isomers have been averaged. At a first glance, there does not appear to be a
correlation between both parameters. However, when the three points signifying >80%
extraction are excluded, we obtain a weak correlation coefficient (R2) of 0.39 for the
remaining points.
It is presumed that a better R2 would be attained in the absence of solvent penetration
(polymer swelling), as migration into non-swelling solvents is predominantly dependent
on the diffusion coefficient, which is inversely proportional to the size of the molecule
(equation 5.1).
Q = -D(dc/dx) (5.1)
In equation 5.1, Q is the amount of contaminant exiting the PET during a time unit; D is
the diffusion coefficient of the contaminant in the plastic; and -dc/dx is the
concentration gradient along the depth of PET (Feigenbaum et al. 1993).
171

Chapter 5
Figure 5.4: Percentage of contaminant extracted at 1 h versus molecular weight.
30
40
50
60
70
80
90
100
110
120
80 100 120 140 160 180 200 220
Contaminant MW
100(
Am
ount
at 1
h/A
mou
nt a
t equ
ilibr
ium
)
At the other extreme, when the solvent totally swells the packaging material, the
concentration of the migrants in the solvent is governed by the partition coefficient (γ)
between the solvent and plastic (equation 5.2) because diffusion through the polymer
matrix is no longer the rate-determining step. Contaminants are expected to diffuse out
of the polymer at the same rate, irrespective of their size. This is because the size of the
transient voids in-between the PET polymer chains increase with the penetration of
DCM and result in less discrimination towards the movement of analytes through the
matrix. In fact the efficiency of extraction is determined by the equilibrium distribution
into the solvent. The maximum possible concentration of migrant in the solvent, C*f is
given by:
172

Chapter 5
C*f = CoPγVf/(VP+γVf ) (5.2)
where VP and Vf are the volumes occupied by the plastic and the solvent respectively, γ
is the partition coefficient of the migrant between the plastic and solvent and CoP is the
initial concentration of the migrant in the polymer (Feigenbaum et al. 1993).
In our study partial swelling was expected at the one-hour extraction time interval
therefore only a weak correlation between percentage extracted and molecular weight
was observed. This weak correlation presumably indicates that migration of
contaminants from PET into DCM is a process intermediate between the purely kinetic,
diffusion-controlled case and the thermodynamic, partitioning alternative. The other
factor contributing to the extraction rate (as well as the partitioning) is the analyte
polarity. After the exclusion of one outlier (for dodecanoic acid), a plot equivalent to
that of Figure 5.4 but with contaminant polarity (estimated solvent strength parameter)
on the abscissa, led to a weaker correlation coefficient (R2) of 0.31. Therefore,
contaminant polarity did not greatly contribute to the fraction extracted.
The three isolated points in Figure 5.4, signifying >80% extraction, happen to be for
straight chain organic compounds. It was postulated that the efficient extraction of
these linear compounds relative to the cyclic compounds resulted from the ability of
elongated molecules to diffuse faster in polymers. This result underlines the potential
significance of molecular shape on extraction efficiency. Reynier et al. (2001)
observed that size is not the only factor contributing towards the diffusion of
compounds in polymers. Other parameters that correlate with the diffusion coefficient
include the compound’s minimum cross section, shape, interaction with the polymeric
matrix and its flexibility. In terms of molecular shape, linear molecules - which crawl
through the polymer matrix - diffuse faster than spherical molecules. The latter have
been reported to move by slower sequential jumps (Reynier et al. 2001).
A less pronounced tendency towards the extraction of linear contaminants was observed
in our previous studies on flake (Chapter 4, Section 4.3.2). Therefore the possibility of
the isolated points in Figure 5.4 being outliers was not ruled out, keeping in mind that
the values at 1h represent single measurements.
173
Chapter 5
5.2.2 Annealed pellets ground to >300-425µm
The kinetics of extraction from particles ground to this size were not determined.
Rather, after the extensive investigations of the kinetics of extraction from small
particles (0-300 µm, previous section), the kinetics of extraction from the large particles
(>425-700 µm, next section) were completed and 3 h was again found to be sufficient
for complete extraction. Hence it was clearly indicated that only 3 h would be
necessary to quantitatively extract the medium sized particles.
Figure 5.5 is a log-log plot of the amounts of contaminants extracted from >300-425 µm
particles versus the amounts extracted from 0-300 µm particles, yielding a gradient of
0.994. As can be seen from Figure 5.5, there is significant scatter even with R2 = 0.985,
particularly when the log-log nature of the plot is taken into account. Nonetheless, the
gradient implies that the variables on average are in reasonable agreement with each
other, and generally demonstrates that further particle size reduction (from >300-425
µm to 0-300 µm) did not systematically influence the level of contaminants.
174

Chapter 5
Figure 5.5: A log-log plot of the amounts of contaminants extracted from >300-425 µm
particles versus the amounts extracted from 0-300 µm particles.
y = 0.9937xR2 = 0.9849
-0.5
0
0.5
1
1.5
2
2.5
3
-0.5 0 0.5 1 1.5 2 2.5 3
Log
[am
ount
in >
300-
425
um (p
pb)]
Log[amount in 0-300 um (ppb)]
x=y
175

Chapter 5
5.2.3 Annealed pellets ground to >425-700 µm
Kinetic studies for a different batch of annealed pellets ground to >425-700 µm were
carried out. Figure 5.6 is a log-log plot of the amounts of contaminants extracted at 3 h
versus the amounts extracted at 24 h, with the exception of one outlier; dodecanoic acid
again. Although this outlier was excluded from this plot, student t-tests on the raw data
established that there was no significant difference between the amount extracted at 3 h
and 24 h at the 5% confidence level (tcal = 0.89; tref = 2.57).
Log-log plots are used throughout this thesis to even out the distribution of data points
and allow equal inspection of most of the results, which occur at low concentrations.
As shown on Figure 5.6, the theoretical line of perfect agreement between both
extraction times (y=x) is superimposed on the experimental line, demonstrating that on
average there is an insignificant difference between both extraction times. Thus
contaminant extraction was generally completed in 3 h. The correlation coefficient (R2)
of 0.99 suggests minimum scatter. There is only one point (for n-hexylbenzoate with
coordinates 0.73, 0.44) that is clearly above the line of best fit. However, once again,
student t-tests on the raw data established that there was no significant difference in the
amount of this contaminant extracted at 3 h and 24 h at the 5% confidence level (tcal =
1.96; tref = 2.57) due to the great spread in the 24 h data for n-hexyl benzoate (2.8 ± 2.2
ppb).
176

Chapter 5
Figure 5.6: A log-log plot of the amounts of contaminants extracted at 24 h versus the
amounts extracted at 3 h for particles >425-700 µm.
y = xR2 = 0.989
-0.5
0
0.5
1
1.5
2
2.5
-0.5 0 0.5 1 1.5 2 2.5
log (amount extracted at 24 h)
log
(am
ount
ext
ract
ed a
t 3 h
)y=x
177

Chapter 5
5.2.4 Unground annealed pellets
Figures 5.7 - 5.9 are plots demonstrating the extraction kinetics of contaminants from
unground annealed pellets. Some compounds, which show similar trends, were
excluded from these plots for the sake of clarity. The curves are modeled by a three
parameter exponential function1, generally giving correlation coefficients (R2) between
0.81-0.99. As indicated by the dashed lines in Figure 5.7, complete extraction (±
random experimental error) was achieved in 7.6 h. One exception was benzophenone
(Figure 5.9), where the amount extracted appears to still be increasing at 24 h. This
conclusion is heavily dependent upon the last data point collected – and of course, may
be due to sampling variation since fresh pellets are necessarily utilized for the extraction
done for each time interval. On the other hand, benzophenone may not have been fully
extracted from the large-size particles (>425-700 µm). Hence, there is doubt about the
complete extraction of benzophenone in 7.6 h, but we did not investigate this further.
The levels of the elongated compounds (dodecane, tetradecane and dodecanoic acid) did
not exceed the levels identified in the blank. Therefore their extraction kinetics were
not studied in the pellets.
The less favorable kinetics for the annealed pellets relative to their ground counterparts
is attributed to the larger path length for the pellet. DCM takes longer to diffuse into the
matrix and contaminants are slower to diffuse out, thus there is a decrease in overall rate
of mass transfer.
1 Sigmaplot software package was used to generate the curves using the function y = y0 + a(1-bx).
178

Chapter 5
Figure 5.7: Soxhlet extraction kinetic study of unground annealed pellets. Compounds
identified at levels below 2 ppb.
0
0.5
1
1.5
2
0 2 4 6 8 10 12 14 16 18 20 22 24Time (h)
Am
ount
Ext
ract
ed (p
pb)
1,2,3,4-Trimethylbenzene (-)-Menthone
n-Propylanisole 2-Methylnaphthalene
1-Ethylnaphthalene
179

Chapter 5
Figure 5.8: Soxhlet extraction kinetic study of unground annealed pellets. Compounds
identified at levels below 13 ppb.
0
2
4
6
8
10
12
14
0 2 4 6 8 10 12 14 16 18 20 22 24
Time (h)
Am
ount
Ext
ract
ed (p
pb)
m-Cymene Cineole
3-Ethyl-o-xylene Biphenyl
gamma-Terpinene Trimethylnaphthalene Isomer 1
1,2,4-Trimethylnapthalene
180

Chapter 5
Figure 5.9: Soxhlet extraction kinetic study of unground annealed pellets. Compounds
identified at levels below 70 ppb.
0
10
20
30
40
50
60
70
80
0 2 4 6 8 10 12 14 16 18 20 22 24 26 28
Time (h)
Am
ount
Ext
ract
ed (p
pb)
Limonene Naphthalene Benzophenone
181

Chapter 5
5.2.5 The effect of particle size reduction upon measured contaminant levels in
extruded and annealed pellets
Figures 5.10 (a and b) and 5.11 are plots of the contaminant levels measured in each
particle size range (small, 0-300 µm; medium, >300-425 µm; large, >425-700 µm)
derived from the same batch of extruded pellets after annealing and grinding. Figure
5.10 (a) and (b) contains typical plots representative of the majority of analytes. It can
be seen that there is no regular pattern to the variations from one particle size to the
next, and most importantly, no discernable trend. This result is different to that
observed for washed and dried PET flake (Chapter 4), where the contaminant levels
dropped by anywhere between two and six times from the small to medium size
particles; small decreases were then systematically observed from the medium to large
particles. The rationale behind this observation was explained in terms of the grinding
process selectively grinding the more contaminated surface of flake to the smallest
particle size. The larger particle size consists of the inner core of the flake, which is
theoretically less contaminated.
Figure 5.10 (a) and (b) indicates that melting during the extrusion process gives rise to a
more-or-less uniform distribution of the contaminants throughout the pellets and the
degree of grinding or any bias towards the surface is irrelevant. Figure 5.11 shows the
extreme examples of variability of contaminant levels between particle sizes. The
worse case is for tetradecane, but as Figure 5.12 shows, the standard deviations are so
large for the small and medium particle size that no particular meaning can be attached
to these results and the general conclusion drawn from Figure 5.10 – that there is no
systematic dependence upon particle size – remains valid.
In order to further demonstrate that, on average, particle size reduction (from >425-700
µm to 0-300 µm) did not systematically influence the level of contaminants, a log-log
plot of the amounts of contaminants extracted from >425-700 µm particles versus the
amounts extracted from 0-300 µm particles was plotted (Figure 5.13). Given the
significant scatter (R2 = 0.953) the gradient of 0.952 in Figure 5.13 can be taken to
imply that the variables, on average, are in reasonable agreement with each other, and
generally support the theory that particle reduction did not influence the level of
contaminants.
182

Chapter 5
Figure 5.10: Typical variations in contaminant levels measured from the same batch of
annealed pellets ground to the three particle sizes.
(a)
2
3
4
5
6
7
8
9
10
11
12
Medium
Am
ount
Ext
ract
ed (p
pb)
1,2,4-Trimethylbenzene (-)-Menthone4-n-Propylanisole m-CymeneCineole gamma-Terpinene2-Methylnaphthalene 1-Methylnapththalene1-Ethylnaphthalene 2,6-Dimethylnaphthalenen-Hexyl benzoate
Small Large
183

Chapter 5
(b)
0
0.5
1
1.5
2
2.5
Medium
Am
ount
Ext
ract
ed (p
pb)
3-Ethyl-o-xylene1,2,3,5-Tetramethylbenzene1,4-Dimethylnaphthalene1,2-Dimethylnaphthalene
LargeSmall
184

Chapter 5
Figure 5.11: Extreme examples of the variation in contaminant levels.
5
7
9
11
13
15
17
19
21
23
Am
ount
Ext
ract
ed (p
pb)
Methyl salicylateBiphenyl1,7- & 1,6- DimethylnaphthaleneTetradecaneDodecane
Small LargeMedium
185

Chapter 5
Figure 5.12: An example of the experimental spread (means ± standard deviation) for
divergent measurements of a contaminant in the three particle sizes derived from the
same batch of annealed pellets.
0
5
10
15
20
25
30
Am
ount
Ext
ract
ed (p
pb)
Tetradecane
Small Medium Large
186

Chapter 5
Figure 5.13: Log-log plot of the amounts of contaminants extracted from >425-700 µm
particles versus the amounts extracted from 0-300 µm particles.
y = 0.9523xR2 = 0.9533
-0.5
0
0.5
1
1.5
2
2.5
3
-0.5 0 0.5 1 1.5 2 2.5 3
Log[amount in 0-300 um (ppb)]
Log
[am
ount
in >
425-
700
um (p
pb)]
x=y
187

Chapter 5
The three compounds that are significantly below the line of best fit in this plot are
dodecanoic acid, dodecane and tetradecane. Student t-tests were performed comparing
the amounts of these contaminants extracted from the 0-300 µm and >425-700 µm
particles and the calculated t values at the 5% confidence level were lower than the
reference t value of 2.45 for all the compounds except dodecane (tcal = 2.97). Therefore
the difference in the amounts extracted from both particle sizes was significant only for
this compound.
An analogous plot to that of Figure 5.13, except correlating the amounts of
contaminants extracted from the 0-300 µm and >300-425µm particles was shown in
Figure 5.5 and a similar conclusion was reached (see Section 5.2.2).
188

Chapter 5
5.3 ANNEALED VERSUS AMORPHOUS EXTRUDED PELLETS
5.3.1 Kinetics of extraction from amorphous pellets
Particle size is not the only factor influencing migration rate. It is an established fact
that percent crystallinity plays an important role in polymer extractions and in migration
and sorption studies (Nir and Ram 1996, Nielsen, 1994). In order to confirm this
theory, extraction kinetics were carried out on amorphous PET pellets. Figure 5.14 is a
log-log plot of the amounts of contaminants extracted at 3 h versus the amounts
extracted at 24 h for amorphous pellets. A gradient of 0.985 suggests both variables are
in excellent agreement with each other. The correlation coefficient (R2=0.993) of
Figure 5.14 is very good; the only point significantly below the line of best fit,
signifying incomplete extraction at 3 h was for n-hexylbenzoate. However, due to the
large size of the experimental error, t-tests for this compound verified that there was no
significant difference in the amounts extracted during both times at the 5% confidence
level (tcal = 2.39; tref = 2.57).
Therefore, extraction was generally completed in 3 h for the amorphous pellets,
compared to 7.6 h for the annealed pellets♣. Further experiments concluded that
extraction time could not be reduced below 3 h for the amorphous pellets (Figures 5.15-
5.18).
It was postulated that variations in polymer crystallinity cause differences in polymer
swelling and thus influence the extraction kinetics. As polymer crystallinity increases
the shapes and sizes of microcavities available for solvent movement decreases,
affecting the extraction kinetics (Limm and Hollifield, 1996).
♣ Even benzophenone was extracted in 3 h from the amorphous pellets, as for all of the other compounds (Figure 5.14, data points 2.06, 2.03, arrowed). For the annealed (and more crystallized) pellets, there was some doubt from the raw data (Figure 5.9) as to whether benzophenone was completely extracted even after 24 h. The above result from the amorphous less crystallized pellets again indicates that the 24 h data point for benzonphenone in Figure 5.9 is erroneous.
189

Chapter 5
Figure 5.14: A log-log plot of the amounts extracted at 3 h versus the amounts extracted
at 24 h for unground amorphous pellets.
y = 0.9845xR2 = 0.9929
-0.5
0
0.5
1
1.5
2
2.5
3
-0.5 0 0.5 1 1.5 2 2.5 3
log (amount extracted at 24 h)
log
(am
ount
s ex
tract
ed a
t 3 h
)
y=x
Benzophenone
190

Chapter 5
Figure 5.15: Soxhlet extraction kinetic study of unground amorphous pellets.
Compounds identified at levels below 4 ppb.
0
0.5
1
1.5
2
2.5
3
3.5
4
0 1 2 3 4 5 6 7 8
Time (mins)
Am
ount
Ext
ract
ed (p
pb)
(-)-Menthone 2-Methylnaphthalene1-Methylnaphthalene 4-n-Propylanisolegamma-Terpinene 2,6-Dimethylnaphthalene3-Ethyl-o-xylene 1,2,3,5-Tetramethylbenzene1,4-Dimethylnaphthalene 1,2-Dimethylnaphthalene
191

Chapter 5
Figure 5.16: Soxhlet extraction kinetic study of unground amorphous pellets.
Compounds identified at levels below 11 ppb.
0
2
4
6
8
10
12
0 1 2 3 4 5 6 7 8
Time (mins)
Am
ount
Ext
ract
ed (p
pb)
Cineole Dodecane 1,7-Dimethylnaphthalene Biphenyl
192

Chapter 5
Figure 5.17: Soxhlet extraction kinetic study of unground amorphous pellets.
Compounds identified at levels below 13 ppb.
0
5
10
15
20
25
30
35
40
45
50
0 1 2 3 4 5 6 7 8
Time (mins)
Am
ount
Ext
ract
ed (p
pb)
Benzophenone Naphthalene1,2,4-Trimethylbenzene Tetradecane
193

Chapter 5
Figure 5.18: Soxhlet extraction kinetic study of unground amorphous pellets.
Trimethylnaphthalene compounds.
0
0.2
0.4
0.6
0.8
1
1.2
0 1 2 3 4 5 6 7
Time (mins)
Am
ount
Ext
ract
ed (p
pb)
8
Trimethyl Naphthalene Isomer 1 Trimethyl Naphthalene Isomer 2
Trimethyl Naphthalene Isomer 3 Trimethyl Naphthalene Isomer 4
Trimethyl Naphthalene Isomer 5 Trimethyl Naphthalene Isomer 6
194

Chapter 5
5.3.2 Variation of DCM uptake with PET crystalline structure
It has been postulated that variation in polymer crystallinity causes differences in
polymer swelling and thus influence the extraction kinetics. As polymer crystallinity
increases the shapes and sizes of microcavities available for solvent movement
decreases, slowing the extraction kinetics (Limm and Hollifield 1996). Thus it would
be expected that DCM is more aggressive towards the more amorphous PET and
weight-uptake experiments were carried out on amorphous and crystalline PET.
The DCM sorption kinetics for the amorphous and annealed pellets are shown in Figure
5.19 and demonstrate that maximum sorption is achieved at significantly different
times. For the amorphous pellets maximum sorption was achieved in 2 h and maximum
extraction in 3 h, compared to approximately 15 h (maximum sorption) and 7.6 h
(maximum extraction) for the more crystallized (annealed) pellets. The maximum
sorbed amount was also greater for amorphous pellets (≈ 4 g) compared to crystallised
pellets (≈ 3 g). It was observed that the amorphous pellets turned white during the
course of sorption due to solvent-induced crystallisation.
The kinetics of sorption is described by Equation 5.3 where n = 0.5 for Fickian
diffusion, n < 0.5 for pseudo-Fickian diffusion and n = 1 for non-Fickian diffusion. In
order to compare diffusivities an approximation of the diffusion coefficient (D) was
made assuming Fickian behaviour despite Liu and Neogi (1992) observing pseudo-
Fickian behaviour for semicrystalline PET due to the elastic stresses of swelling.
At/Ae ≅ 4(Dt/πL2)n (5.3)
In Equation 5.3 At is the amount sorbed at time t, Ae is the amount sorbed at
equilibrium, D is the diffusion coefficient and L is the thickness of the pellet.
195
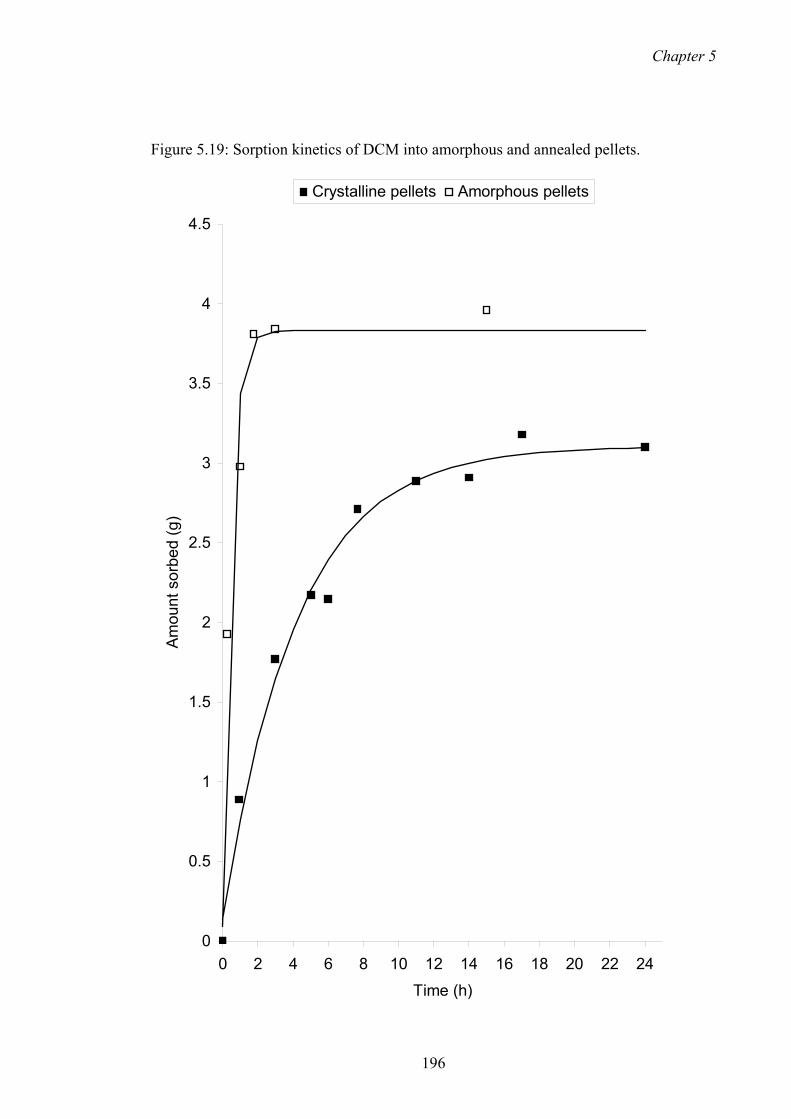
Chapter 5
Figure 5.19: Sorption kinetics of DCM into amorphous and annealed pellets.
0
0.5
1
1.5
2
2.5
3
3.5
4
4.5
0 2 4 6 8 10 12 14 16 18 20 22 24
Time (h)
Am
ount
sor
bed
(g)
Crystalline pellets Amorphous pellets
196

Chapter 5
Figure 5.20 is a plot of At/Ae (amount sorbed at time t/amount sorbed at equilibrium)
versus the square root of time for amorphous and crystalline pellets. From the slopes of
the steep portions of these curves, with the aid of equation 5.3 and n= 0.5, setting
L=0.35 cm the D for the sorption of DCM into amorphous pellets (D = 7.75 x 10⁻³
cm2/h) was calculated to be about 4 times greater than that for the annealed pellets (D =
1.87 x 10⁻³ cm2/h). This result agrees with the longer extraction times required for the
extraction of contaminants out of the annealed pellets.
Feigenbaum et al. (2002) performed an analogous study for polyolefins. The D values
for DCM sorption ranged between 4.68 x 10⁻⁴ cm2/h and 1.33 x 10⁻³ cm2/h. Our D
values for PET exceeded these values, possibly due to the better solubility compatibility
between DCM and PET. Vandenburg et al. (1999) reported that the solubility parameter
(δ) difference between PET and DCM (∆δ = 0.7 Mpa1/2) is significantly smaller than
between polypropylene and DCM (∆δ = 3.2 Mpa1/2).
Similarly, Nir and Ram (1996) studied the sorption kinetics of toluene, benzyl alcohol,
heptane and propylene glycol (as solvents) in amorphous and biaxially oriented PET
film. Our estimated D values for the sorption of DCM into PET were higher than those
quoted for the mentioned solvents by the latter authors. The D values determined by Nir
and Ram (1996) ranged between 1.08 x 10⁻⁶ cm2/h (for benzyl alcohol sorption in
biaxially oriented PET) and 5.40 x 10⁻⁶ cm2/h (for benzyl alcohol sorption in amorphous
PET). No detectable sorption was observed for heptane and 1,2-propanediol. The
larger solubility parameter differences between the PET and the non-chlorinated
solvents could be responsible for the smaller diffusion coefficients obtained by Nir and
Ram (1996).
197

Chapter 5
Figure 5.20: A plot of the (amount of DCM sorbed /amount sorbed at equilibrium)
versus the square root of time.
198
0
0.2
0.4
0.6
0.8
1
1.2
0 1 2 3 4 5
Square root time (h)
At/A
e
6
Crystalline pellets Amorphous pellets

Chapter 5
5.3.3 Contaminant diffusion coefficients out of amorphous and annealed PET
The results in Figure 5.7-5.9 (Soxhlet extraction kinetic study of annealed pellets) were
re-plotted as At/Ae (amount extracted/amount extracted at equilibrium) versus the square
root of time. Figure 5.21 is an example of a representative plot for naphthalene.
Figure 5.22 is a plot of the calculated diffusion coefficients for each contaminant
(determined from the slopes in curves analogous to that of Figure 5.21) versus the
reciprocal of molecular weight in the annealed pellets. A linear line was fitted with a
weak correlation (R2) of 0.61 after the exclusion of 2 outliers and the points for the
linear molecules, which were extracted before 2 hours (dodecane, tetradecane and
dodecanoic acid).
The average D was calculated to be 2.51 x 10⁻³ cm2/h for the contaminants included in
Figure 5.22.
For the amorphous (un-annealed) pellets the average calculated D was 8.00 x 10⁻³
cm2/h. Figure 5.23 is a plot of the calculated diffusion coefficients for each contaminant
(determined from the slopes in curves analogous to that of Figure 5.21) versus the
reciprocal of molecular weight in the amorphous pellets. A linear line (with a positive
slope) was fitted with a weak correlation (R2) of 0.50.
The D values for amorphous (un-annealed) and annealed pellets indicate that diffusion
is more rapid in amorphous pellets than in the more crystalline annealed pellets. The
relationship Dannealed = Damorph.(1-Xcryst.)℘ (see Appendix 3 for derivation) can be used to
calculate the “effective” diffusion coefficient for crystalline pellets (DC) assuming
diffusion occurs only in amorphous regions of the annealed pellets. When substituting
the diffusion coefficient for amorphous (un-annealed) pellets (Damorph. = 8.00 x 10⁻³
cm2/h) and the fraction crystallinity for the annealed pellets (Xannealed = 0.24) into this
equation, the predicted (“effective”) Dannealed for annealed pellets equals 6.08 x 10⁻³
cm2/h. In summary, assuming the un-annealed pellets are 100% amorphous (Schumann
and Thiele 1996) and have a diffusion coefficient of 8.00 x 10⁻³ cm2/h, then a 24%
crystalline pellet would give an “effective” diffusion coefficient of 6.08 x 10⁻³ cm2/h,
assuming diffusion only takes place in the amorphous regions of the pellet.
℘In this equation (1-X) signifies the fraction of amomphous region in the pellet. Damorph. and Dannealed signify the diffusion coefficients in the amorphous and annealed pellets respectively.
199

Chapter 5
The experimental Dannealed was 2.51 x 10⁻³ cm2/h, which is 2.4 times smaller than the
predicted (“effective”) value. The discrepancy between the experimental and predicted
value may have resulted from the DCM inducing greater crystallinity in annealed pellets
than in amorphous pellets (Nir and Ram, 1996).
Figure 5.21: A plot of At/Ae (amount extracted/amount extracted at equilibrium from
annealed pellets) versus the square root of time (a representative plot; naphthalene).
y = 0.3837x - 0.0707R2 = 0.9788
0
0.2
0.4
0.6
0.8
1
1.2
1.4
0 0.5 1 1.5 2 2.5 3 3.5 4 4.5 5 5.5
square root time (h)
At/A
e
200

Chapter 5
Figure 5.22: A plot of calculated diffusion coefficients versus the reciprocal of
molecular weights (for annealed pellets).
y = 1.0841x - 0.005R2 = 0.6135
0
0.0005
0.001
0.0015
0.002
0.0025
0.003
0.0035
0.004
0.0045
0.005 0.006 0.007 0.008 0.009
1/MW
Diff
usio
n co
effic
ient
(cm
2/h)
201

Chapter 5
Figure 5.23: A plot of calculated diffusion coefficients versus the reciprocal of
molecular weights (for amorphous pellets).
y = 3.4641x - 0.015R2 = 0.4698
0
0.002
0.004
0.006
0.008
0.01
0.012
0.014
0.016
0.005 0.0055 0.006 0.0065 0.007 0.0075 0.008 0.0085
1/MW
Diff
usio
n co
effic
ient
(cm
2/h)
5.3.4 Contaminant loss during the annealing of pellets
In earlier work with surrogates specified by the US FDA challenge test (Harding et al.
unpublished), the effect of moulding the PET into bottles (after the vacuum extrusion at
the conclusion of the recycling process) indicated a diminution in the levels of semi-
202

Chapter 5
volatile contaminants. There were two alternative vacuum extrusion processes utilized
and the levels of benzophenone decreased from 33 to 21 ppm in one case and from 36 to
19.7 ppm in the other. Methyl stearate was the second semi-volatile surrogate in our
study, but its level was below the limit of quantitation (of 5 ppm) for the GC-FID
method used before moulding. Thus on the basis of the benzophenone results, the
moulding process – and from the analytical perspective in our current studies – the
annealing carried out to impart hardness to the extruded pellets to allow grinding before
sampling and analysis, decreases in contaminant levels would be expected.
Figure 5.24 is a log-log plot of the amount of contaminant extracted from amorphous
pellets versus the amount extracted from ground-annealed pellets. The gradient of
0.9827 for the regression is so close to the ideal value of 1.000 (x=y), and with the
correlation between the two sets of data so strong (R2 = 0.9928), the plot demonstrates
that the levels of contaminants measured are in excellent agreement with one another.
Nonetheless, since it is a log-log plot, small deviations from the x=y line are more
significant than is apparent. In the worst case (the data point 0.591, 0.730), there is a
38% difference. However, for this point and for the other deviating points that lie
below the x=y line, the annealed pellets have higher contaminant levels (than those
pellets not subjected to heat treatment; the amorphous pellets). This can only be
explained by significant variations in some initial contaminant levels in PET from
which the sub-batches were drawn. However, the majority of contaminants have very
similar levels in the amorphous and the annealed pellets. Therefore our conclusions are
that semi-volatile contaminant loss is insignificant during annealing of extruded pellets
at 150°C and this post-extrusion step is not an important purification step.
203

Chapter 5
Figure 5.24: A log-log plot of the amounts of contaminants extracted from amorphous
pellets versus the amounts extracted from ground annealed pellets.
y = 0.9827xR2 = 0.9928
-0.5
0
0.5
1
1.5
2
2.5
3
-0.5 0 0.5 1 1.5 2 2.5 3
log[amount extracted from ground (annealed) pellets (ppb)]
log[
amou
nt e
xtra
cted
from
am
orph
ous
pelle
ts (p
pb)]
x=y
5.3 FLATTENING AMORPHOUS PET PELLETS
Apart from grinding, flattening could also reduce the path-length of a PET pellet prior
to extraction. Since amorphous pellets are not brittle enough to grind unless heat-
treated (i.e., annealed), an alternative means of reducing pellet path-length was sought
involving flattening the pellets using a hydraulic press (8 tons). The extraction results
for the whole and flattened amorphous pellets are shown in Table 5.2. Flattening
significantly effected the extraction of some compounds, namely, 3-ethyl-o-xylene,
1,2,3,5-tetramethyl benzene, naphthalene, biphenyl, 2-methyl naphthalene, 1-methyl
204

Chapter 5
naphthalene, 1-ethyl naphthalene, the dimethyl naphthalene isomers and
trimethylnaphthalene isomers. And the compound that was most dramatically affected
by the flattening process was biphenyl; whose level in flattened pellets averaged 60
times the level in whole pellets. The levels of all other compounds in the flattened
pellets did not exceed five fold the level in non-flattened pellets. Only biphenyl
exceeded the 215 ppb threshold in the flattened pellets.
Interestingly, as mentioned in Section 5.2.5, grinding did not have this effect on the
amount extracted. Therefore it was proposed that extraction was not primarily diffusion
controlled. It may have been that the mechanical action of the flattening process
dispersed the polymer chains away from each other, releasing trapped contaminants.
Not all compounds (e.g. the flavor compounds such as limonene, cineole, γ-terpinene)
were affected by this mechanical action because not every contaminant is trapped
between the polymer chains. It is possible that the compounds, which are trapped
between polymer chains, derive from the original manufacture of the polymer. The
highly variable nature of the results for the flattened pellets may be attributed to
partially irreproducible flattening of the PET pellets.
Table 5.2: Flattened and whole amorphous pellets extracted by sonication and Soxhlet
extraction. (concentrations in ppb.)
m-Cymene
Limonene Cineole 3-Ethyl-o-xylene
1,2,3,5- Tetramethyl benzene
(-)-Menthone
4-n-propyl anisole
3h sonication
5.4 (0.4)
87.0 (5.4)
17.1 (0.5)
2.6 (0.1)
8.8 (0.2)
3.9 (0.4)
3.9 (0.0)
24h Soxhlet (whole pellets)
5.7 (0.1)
100.2 (7.3)
14.9 (0.1)
2.3 (0.1)
10.6 (1.1)
2.8 (0.2)
4.1 (0.1)
Sonication (flat pellets) 1h 3h 15h 28h 48h
4.9 4.8 5.6 5.6 9.1
81.8 84.2 87.1 85.8 82.5
14.8 15.5 16.9 16.5 17.3
7.3 7.8
10.0 10.5 8.2
14.3 18.8 11.0 18.9 18.6
2.8 2.5 2.2 2.5 2.3
4.1 4.4 4.9 4.6 4.5
205

Chapter 5
Naphthalene Biphenyl 2-Methyl Naph.
1-Methyl Naph.
1-Ethyl Naph.
2,6-Dimethyl Naph.
1,7- & 1,6- Dimethyl Naph.
3h sonication
18.7 (2.6)
9.1 (0.8)
12.3 (1.0)
7.4 (0.8)
3.0 (0.3)
9.0 (0.3)
24.4 (0.0)
24h Soxhlet (whole pellets)
21.1 (2.2)
8.6 (0.3)
13.5 (1.4)
7.6 (0.5)
2.7 (0.2)
8.4 (0.1)
23.0
(1.7)
Sonication (flat pellets) 1h 3h 15h 28h 48h
76.9 71.2
112.5 101.7 51.4
494.5 372.8 845.6 676.0 152.7
43.6 41.4 53.7 56.3 45.3
23.7 19.3 29.5 24.8 16.7
7.9 7.7
13.0 11.3 6.0
15.9 17.9 19.6 18.7 15.7
36.9 38.9 38.0 40.4 37.2
1,4- Dimethyl Naph.
1,2- Dimethyl Naph.
Trimethyl Naph. isomer 1
Trimethyl Naph. isomer 2
Trimethyl Naph. isomer 3
Trimethyl Naph. isomer 4
Trimethyl Naph. isomer 5
3h sonication
6.1 (0.4)
4.2 (0.1)
2.1 (0.3)
2.6 (0.0)
2.1 (0.3)
2.5 (0.5)
3.1 (0.2)
24h Soxhlet (whole pellets)
5.2 (0.3)
4.1 (0.3)
1.7 (0.1)
2.3 (0.2)
2.1 (0.2)
2.4 (0.1)
2.7 (0.0)
Sonication (flat pellets) 1h 3h 15h 28h 48h
8.7 9.8 8.5 8.0 7.4
6.1 7.7 6.8 6.8 6.1
4.3 4.0 4.3 5.1 ND
4.2 3.5 4.1 4.6 ND
3.7 3.2 4.1 3.9 ND
4.5 3.2 4.3 4.9 ND
4.7 5.2 5.2 6.8 ND
Trimethyl Naph. isomer 6
Benzophenone γ-Terpinene Dodecane Tetradecane
3h sonication 3.5 (0.3)
28.8 (3.2)
3.5 (0.1)
26.4 (7.4)
29.4 (16.9)
24h Soxhlet (whole pellets)
3.7 (0.1)
35.4 (1.1)
4.5 (2.0)
14.8 (7.2)
8.4 (5.4)
Sonication (flat pellets) 1h 3h 15h 28h 48h
6.9 6.4 6.8 8.1 ND
37.6 36.3 45.2 44.3 40.6
2.4 2.5 2.6 3.0 4.9
26.0 36.8 26.7 52.7 36.3
18.2 17.4 27.3 46.7 34.8
206

Chapter 5
5.4 LEVELS OF CONTAMINANTS IN PELLETS AND THRESHOLD OF
REGULATION
Table 5.3 gives an overview of measured contaminant levels in curbside collected PET.
In general, the levels of contaminants measured in the ground flake (0-300 µm)
exceeded those in unground flake and extruded pellets. However, there were three
exceptions where the levels in the ground flake were not the lowest (limonene, methyl
salicylate and 4-n-propylanisole). This anomaly could be justified by batch-to-batch
variation.
The generally higher concentrations in the ground flake (0-300 µm) relative to the
unground flake were presumed to have arisen from the selective grinding of the surfaces
of the washed and dried flake to the smallest particle size (Chapter 4). These
concentrations represent the worst-case scenario for the washed and dried flake as far as
food contact is concerned. Therefore, for six contaminants where the level exceeds 215
ppb, it would be necessary to undertake migration testing to obtain approval from the
US FDA.
Compared with the unground flake, the levels of contaminants in the extruded pellets
are considerably reduced, with the average reduction around 71% (see Table 5.3). This
reduction in the level of contamination is attributed to the high temperature and vacuum
used in vacuum extrusion.
A final feature of Table 5.3 is that the relative standard deviation for the flake (23%) is
higher than that for the ground flake (7%) and whole pellets (7.3%). It is expected that
grinding the polymer would cause homogenisation due to the larger number of particles
allowing more reproducible determinations. Despite this better reproducibility, the
levels in the ground flake were less representative of the overall composition whilst
only representing the surface of the flake.
In contrast, melting the flake causes homogeneity within the polymer matrix and the
smaller variation in contamination from pellet-to-pellet allows more reproducible
determinations. This homogeneity within the polymer matrix is consistent with our
general findings of similar levels across particle size ranges after grinding the annealed
pellets and tends to validate our interpretation of the high levels of contaminants found
in finely ground flake being due to selective surface grinding where high levels are
expected.
207

Chapter 5
208
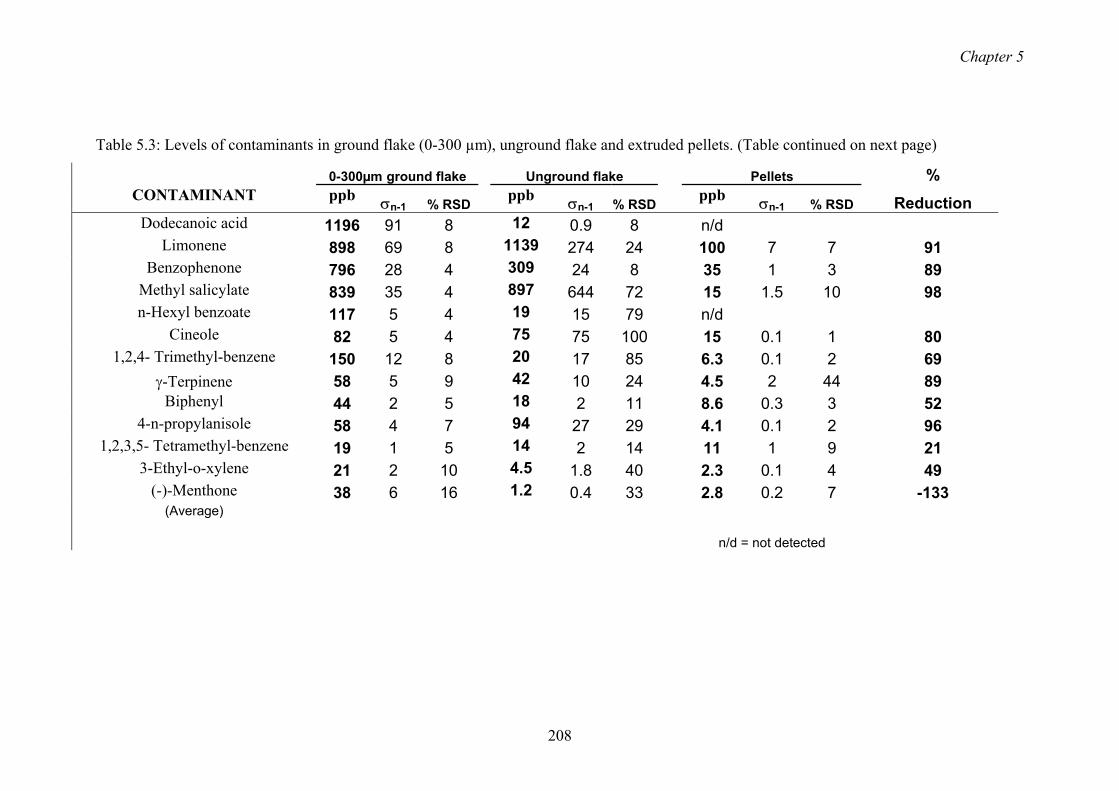
Chapter 5
Table 5.3: Levels of contaminants in ground flake (0-300 µm), unground flake and extruded pellets. (Table continued on next page)
0-300µm ground flake Unground flake Pellets % CONTAMINANT ppb σn-1 % RSD ppb σn-1 % RSD ppb σn-1 % RSD Reduction
Dodecanoic acid 1196 91 8 12 0.9 8 n/d Limonene 898 69 8 1139 274 24 100 7 7 91
Benzophenone 796 28 4 309 24 8 35 1 3 89 Methyl salicylate 839 35 4 897 644 72 15 1.5 10 98 n-Hexyl benzoate 117 5 4 19 15 79 n/d
Cineole 82 5 4 75 75 100 15 0.1 1 80 1,2,4- Trimethyl-benzene 150 12 8 20 17 85 6.3 0.1 2 69
γ-Terpinene 58 5 9 42 10 24 4.5 2 44 89 Biphenyl 44 2 5 18 2 11 8.6 0.3 3 52
4-n-propylanisole 58 4 7 94 27 29 4.1 0.1 2 96 1,2,3,5- Tetramethyl-benzene 19 1 5 14 2 14 11 1 9 21
3-Ethyl-o-xylene 21 2 10 4.5 1.8 40 2.3 0.1 4 49 (-)-Menthone 38 6 16 1.2 0.4 33 2.8 0.2 7 -133
(Average)
n/d = not detected
208

Chapter 5
Table 5.3 (continued): Levels of contaminants in ground flake (0-300 µm), unground flake and extruded pellets.
0-300µm ground flake Unground flake Pellets % CONTAMINANT ppb σn-1 % RSD ppb σn-1 % RSD ppb σn-1 % RSD Reduction
Naphthalene 61 6 10 33 2 6 21 2 10 36 2-Methylnaphthalene 245 9 4 97 5 5 14 1 7 86 1-Methylnaphthalene 109 4 4 47 5 11 7.6 1 7 84 1-Ethylnaphthalene 51 1 2 21 1.5 7 2.7 0.2 7 87
2,6-Dimethylnaphthalene 138 6 4 69 12 17 8.4 0.1 1 88 1,7- & 1,6- Dimethylnaphthalene 272 6 2 136 24 18 23 2 9 83
1,4- Dimethyl naphthalene 72 3 4 21 4 19 5.2 0.3 6 75 1,2- Dimethyl naphthalene 25 3 12 11 1 5 4.1 0.3 7 63
Trimethyl naphthalene isomer 1 23 1 4 6.2 0.8 13 1.7 0.1 6 73 Trimethyl naphthalene isomer 2 25 1 4 5.4 0.6 11 2.3 0.2 9 57 Trimethyl naphthalene isomer 3 33 1 3 7.9 1.4 18 2.1 0.2 10 73
Trimethyl naphthalene isomer 4 & 5 42 1 2 14 3 21 2.4 0.1 4 83 Trimethyl naphthalene isomer 6 28 1 4 8.9 1.5 17 2.7 0.0 0 70 Trimethyl naphthalene isomer 7 12 1 8 4.2 0.8 19 3.7 0.1 3 12
(Average) (5) (23) (7.3) (71)
209

Chapter 5
5.5 CONCLUSIONS
This study has shown that particle size reduction of annealed extruded pellets to less
than 700 µm reduces Soxhlet extraction times from 7.6 h (for unground pellets) to 3 h
(for ground pellets). Therefore, in the case of analysing crystalline (i.e., annealed)
extruded pellets, it is desirable to grind the pellets prior to extraction. However, since
the extraction kinetics (and contaminant levels) for amorphous pellets were not
significantly different from the ground (annealed) pellets, sampling of the whole
amorphous extruded pellet (without the need for annealing and grinding) is indicated
to be a sufficient method for determining contaminant levels in curbside-collected,
recycled PET.
The times taken for quantitative extraction of the contaminants from the amorphous
extruded pellets (3 h) and the annealed pellets (7.6 h) are consistent with the larger
values of the calculated diffusion coefficients of the contaminants (out of amorphous
pellets) and faster DCM uptake into the amorphous pellets than into the annealed (and
therefore crystallized) PET pellets.
In contrast to the results obtained for the flake, the levels of contaminants across the
particle size ranges after grinding the annealed pellets were similar, which tends to
suggest that the extruded pellet matrix is homogenous - in other words, there is a
uniform distribution of contaminants within the pellet and therefore selective grinding
of its surface (as in the case of the more contaminated flake’s surface) is irrelevant.
In terms of recycling PET for food-contact applications, this study has shown that
vacuum extrusion at elevated temperatures decontaminates PET sufficiently to permit
the curbside-collected polymer to be used for food-contact purposes, as the levels of
contaminants in amorphous PET pellets were below the FDA threshold of 215 ppb in
all cases.
As the levels of contaminants were within the obligatory limit, migration tests were
not officially required and therefore not carried out.
210

Chapter 5
Furthermore, previous challenge tests (Harding et al. unpublished) of the same
recycling process suggested that even when the concentration of surrogate
contaminants was at the ppm level, the amount migrating into 10% ethanol was below
10 ppb (Cross et al. unpublished).
210

Chapter 6
CHAPTER 6 VOLATILE CONTAMINANTS AND LEVELS OF OCCURRENCE IN EXTRUDED
PET FLAKE AND PELLETS FROM CURBSIDE COLLECTION
6.1 GENERAL INTRODUCTION
6.1.1 Purpose of the chapter
Chapters 4 and 5 dealt with the solvent extraction of semivolatile contaminants out of
recycled PET plastic intended for soft drink bottle manufacture. The aim of those chapters
was to verify that the levels of semivolatile contaminants in recycled PET were not in
breach of the 215 ppb threshold legislated by the US FDA.
For a more comprehensive investigation on the extent of contamination in post-consumer
PET, it is also important to account for the volatile contaminants present in recycled PET
since their smaller size makes them more inclined to migrate through the polymer matrix
into soft drink.
Hence the purpose of the current chapter is to determine the level of volatile contaminants
present in recycled PET flake and pellets using thermal extraction techniques, which for
reasons specified in Section 6.1.2, are more appropriate than solvent extraction for the
analysis of volatile compounds in polymers.
Due to post-consumer PET undergoing thermal and vacuum treatment during recycling, the
overall level of semivolatiles is expected to exceed the total concentration of volatile
compounds, which are more likely to volatilise out of PET during high temperature
conditions. This hypothesis, however, assumes that the initial concentrations of volatile
contaminants in the pre-recycled post-consumer PET do not significantly exceed the level
of semivolatile contaminants.
6.1.2 Background to thermal extraction
It is well established that some traditional solvent extraction techniques such as Soxhlet,
sonication and total dissolution/reprecipitation have major drawbacks, making heat-
extraction such as headspace analysis appear more attractive. Some disadvantages related
to non-automated solvent extraction are the use of large amounts of solvent, which raises
213

Chapter 6
cost, disposal and environmental concerns; long experimental times resulting from the slow
diffusion process and chemical handling steps; the loss of volatile components during
solvent concentration; and the presence of chromatogram-interfering species in the solvent
which makes identification and quantification less reliable. These issues could be
minimised or eliminated by means of solvent-less headspace techniques, which employ
heat to facilitate extraction.
To date there have been a variety of thermal methods that have been used to extract
components out of plastic. These comprise of thermal desorption (TD), static and dynamic
headspace (SHS and DHS) and solid phase microextraction (SPME).
TD involves heating the PET under a stream of inert gas, which transports the liberated
analytes directly onto a sorbent or GC column. The sorbent is then heated and the retained
volatiles are released and cryofocussed before GC entry. Komolprasert et al. (2001)
extracted irradiated and non-irradiated PET by TD in the quest to determine a difference in
the chemical composition between the treated and untreated plastic. Bayer (2002) used TD
alongside other extraction techniques to determine the composition of five different types
of post-consumer PET feedstreams. TD has also been used to analyse the extent of aroma
sorption by three polymer films (Hernandez-Munoz et al. 2001); the thermal stability of
UV treated films (Fortin and Lu 2001); and the volatiles given off during the extrusion
coating of low-density polyethylene (Villberg and Veijanen 2001).
Dynamic headspace (purge and trap) works in a similar way, however it always involves
trapping onto a sorbent and was originally designed to extract volatiles from aqueous
samples such as wastewater, blood and urine at ambient temperature. Its function is
relatively simple to explain: the sample is bubbled with an inert gas and the vapour is
passed through a sorbent column, where the volatile components are adsorbed. The sorbent
column is then heated and backflushed with the gas to desorb the components onto a gas
chromatographic column.
In order to extract contaminants from solids such as soil, food and plastic, the sample tube
is placed in an oven to facilitate extraction. Gramshaw et al. (1993) extracted potential
migrants from samples of dual-ovenable plastics, including PET, by means of DHS. A
DHS procedure was also employed to determine the levels of residual solvents in food
214

Chapter 6
packaging printed film (Kolb et al. 1981) and benzene residues in recycled PET
(Komolprasert et al. 1994).
A simpler, cheaper and more portable form of TD is SPME, which is not a dynamic system
but involves the introduction of a polymer-coated fused silica fibre into the headspace of a
heated solid sample and sorbing the liberated organic analytes onto a coating specific for
the compounds of interest. The analytes are then desorbed into the GC injection port and
analysed. The fibre could also be immersed directly into an aqueous sample (Shirey 2000,
Valor 2001, Barrionuevo and Lanças 2000, Batlle et al. 1999a,b). This technique has
already been used as a means to isolate degradation products in polymers (Hakkarainen et
al. 1997, Khabbaz et al. 1998) and in the determination of acetaldehyde (Huynh and Vu-
Duc 1998) and butylated hydroxytoluene (Tombesi and Hugo, 2002) in drinking water
stored in PET bottles. Apart from polymers, some of the other uses of SPME include the
analysis of organic compounds in indoor air (Jia et al. 2000) and plants (Bicchi et al. 2000);
volatile aroma compounds in pork (Elmore et al. 2000) and fruit (Augusto et al. 2000);
polychlorinated byphenyls in soils (Llompart et al. 1999); and for the characterisation of
cheeses (Pérès et al. 2001).
The three heat driven techniques described involve concentrating headspace analytes onto a
selective fibre prior to GC analysis. Conversely, SHS involves withdrawing an aliquot of
the headspace vapour with a syringe and injecting it into a GC. The most significant
limitation of the static headspace technique is lack of sensitivity. This is because once
equilibrium is reached no more analytes are released from the polymer matrix. SHS has
been used to determine the amount of flavour absorbed into plastic packaging (Tavss et al.
1988); residual acetaldehyde in PET (Dong et al. 1980) and PET-bottled mineral water
(Lorusso et al. 1985); residual solvents in food packaging films (Kolb et al. 1981);
degradation products in polymers (Hakkarainen et al. 1997); contaminants in post-
consumer PET flake (Franz and Welle 1999a); degradation compounds in irradiated PET
(Komolprasert et al. 2001) and the determination of migrants from food packaging
materials in aqueous food simulants and real food (Nerin et al. 2002).
6.1.3 Brief outline of chapter
215

Chapter 6
In the current study we used SPME and automated SHS to extract volatile compounds out
of recycled PET flake and pellets. The study was initiated by optimising SPME in terms of
fibre selection and extraction temperature for the chosen fibre. The fibres investigated
were polyacrylate (PA), polydimethylsiloxane (PDMS) and carboxen/polydimethyl
siloxane (CX/PDMS). The latter fibre, which is porous and extracts analytes by adsorption,
was selected for temperature optimisation because it was shown to extract volatile
compounds more efficiently than the absorbing fibres, PA and PDMS.
It is well established that an increase in temperature increases the diffusion rate of a
compound to the polymer surface. This is because thermal energy assists in the movement
of analytes through the polymer matrix and forms transient voids, created by the increased
motion of the polymer chains (Cotton et al. 1993).
The effect of increasing temperature on the extraction efficiency of polymers has already
been shown when optimising the parameters of accelerated solvent extraction (ASE),
supercritical fluid extraction (SFE) and microwave-assisted extraction (MAE). Lou et al.
(1996, 1997) discussed the temperature optimisation behind the ASE and SFE of monomers
and oligomers from polymeric samples. St Küppers (1992) and Cotton et al. (1993)
optimised extraction temperature whilst removing cyclic trimer from PET by SFE.
Camacho and Karlsson (2001) applied an optimised temperature to extract low molecular
weight contaminants from HDPE and PP by MAE.
Similar temperature optimisations have been performed in our study for the SHS and
SPME of contaminants out of recycled PET in a quest to achieve total extraction for
quantitation by external standardisation.
Due to CX/PDMS displaying competitive adsorption behaviour with increasing extraction
temperature as a result of the enhanced headspace concentrations, it was considered to be
an inappropriate fibre for quantitative analysis. Therefore, quantitative analysis was
achieved by means of SHS (instead of SPME) and selected ion-monitoring (SIM) GC/MS.
216

Chapter 6
6.2 QUALITATIVE SPME STUDY OF CONTAMINANTS IN PET EXTRUDED
PELLETS
6.2.1 Comparison of the compounds extracted by different fibres
The types of compounds extracted by the four different fibres were compared for washed
and dried flake ground to >425 µm-700 µm and are presented in Table 6.1. This Table
represents the qualitative analysis of flake samples analysed in triplicate by different fibres.
Retention times and the quality of library match for each peak are listed in this table. Up to
55 compounds are listed; hydrocarbons, organic acids, alcohols, ketones and aldehydes.
For some compounds the library matches were low, possibly due to incomplete library,
peak overlap and/or small peak size (below the universally accepted signal:noise ratio of 3)
preventing unequivocal identification based on library search. For example, the peak at
0.834 minutes (identified in Table 6.1 as “3-pentanol” with a library match quality of “35”)
has different mass spectra (and therefore library matches) at discrete points of the peak,
suggesting that this peak consists of co-eluting compounds with different mass spectra.
Further analysis using the “peak purity” option of the GC/MS software deduced that there
were six components making up this peak. Therefore, this peak could not be identified
with accuracy.
There were other examples where peak overlap affected the identification process (e.g. the
peaks at 1.004 and 1.010 minutes, which overlapped with each other and with other
compounds; the peak at 4.628 which overlapped with other compounds, as suggested by
different mass spectra at discrete points of the peak). Such overlapping peaks –
occasionally having low library match qualities (below a quality of 80) - were not excluded
from further analysis as “selected ion extraction” allowed the isolation of individual
chromatographic peaks for semi-quantitative purposes. Unfortunately, any qualitative
rationalization for the chemical behaviour of these compounds based on their molecular
structure could not be achieved, as the mass spectral library could not provide an
unequivocal structural identification due to the low match quality.
Paradoxically, it should also be kept in mind that a high library match quality for a
particular peak does not necessarily guarantee unequivocal identification either; thus one
should keep an open mind towards identification based on library match. Coincidence in
217

Chapter 6
retention time between the unknown peak and a standard is a confirmatory means of peak
identification. Similar compound identification using standards was carried out in Chapter
4 during the extraction of contaminants out of flake.
Out of the four fibres tested (see Table 6.1), the adsorptive CX/PDMS fibre was selected
for further analyses, as it was the only fibre that accounted for the large number of very
volatile compounds eluting early in the gas chromatogram (prior to 6.040 minutes). The
most inefficient fibre in terms of number of contaminants extracted was the non-polar
absorptive 7 µm PDMS fibre, possibly due to its thin film and limited capacity for
absorbing compounds. The 100 µm PDMS fibre was more effective in terms of the number
of compounds extracted; however this fibre is inappropriate for the analysis of the early-
GC eluting compounds, and for naphthalene and methylnaphthalene derivatives (which can
be seen from Table 6.1 not to be detected). The polar PA fibre was as efficient as the
CX/PDMS fibre for extracting semivolatiles, including the naphthalene compounds whose
polarisability (from the electron density inflicted by the π-bonds) presumably permits their
adsorption into the polar fibre. Again, there were no early eluting analytes with retention
times prior to 6.040 minutes that could be identified for the PA fibre; therefore, like the
PDMS fibres, it was not selected for further analysis.
GC/MS analysis of the PDMS and PA fibres included a 2-minute solvent delay to exclude a
large swamping dichloromethane peak, which was particularly absorbed by these fibres. It
was presumed that the presence of dichloromethane in the polymer could have resulted
from environmental contamination given that this solvent was extensively used during our
solvent extraction studies (Chapters 4 and 5). Hence it was excluded from further analysis.
Table 6.1: Compounds extracted by four different fibres from ground flake (x indicates
assignment and n/a = “not analysed” due to the inclusion of a solvent delay time).
RT M/Z Compound (library match quality in PDMS/CX PDMS 1 PDMS 2 PA
218

Chapter 6
(mins) parentheses) (100 µm) (7 µm) 0.834 55, 56 3-Pentenol (35)
1-Pentene, 3,4-dimethyl- (33) Cyclopropane, 1,1-dimethyl- (14)
x n/a n/a n/a
1.004 55 1-Butene, 3-methyl- (40) 1,5-Hexadiene, 3-methyl- (9)
x n/a n/a n/a
1.010 73 1,3-Dioxolane (70)
x n/a n/a n/a
1.279 78, 51 Benzene (90)
x n/a n/a n/a
2.051 91, 65 Toluene (72) Ethylene glycol (3)
x n/a n/a n/a
2.294 55 1-Octene (59) 2-Octene (50) Cyclopropane, 1-butyl-2-pentyl-, trans (50)
x
3.202 91, 106 Benzene, ethyl- (81) 3,5-Heptadiyn-2-one (38) 1-Cycloocten-5-yne (38)
x
3.350 91, 106 Benzene, 1,4-dimethyl- (83) Benzene, 1,3-dimethyl- (81) Benzene, 1,2-dimethyl- (81)
x
3.667 104, 78 Propanedinitrile, methylene-(86) 2-Butenedinitrile (72)
x
4.628 91, 120 Benzene, propyl- (52) Benzacetaldehyde (50)
x
4.743 105, 120 Benzene, 1-ethyl-2-methyl- (91) Benzene, 1,2,3-trimethyl- (87)
x
5.017 105, 120 Benzaldehyde (80)
x
5.29 81, 53 2-Ethylfuran (56) 1H-Pyrrole, 1-Methyl- (50)
x
5.470 57, 85, 71
Octane, 2,4,6-trimethyl- (64) Octane, 2,3-dimethyl- (47) Decane, 2,5,6-trimethyl- (42)
x
5.608 57, 55 1,3-Cyclopentanediol, cis- (38) 1,3-Cyclopentanediol, trans- (32) Octanal (32)
x
5.946 105, 120 Benzene, 1-ethyl-2-methyl- (49) Benzene, 1-ethyl-3-methyl- (43)
x
219

Chapter 6
Benzene, 1-methylethyl- (40)
6.040 119 m-Cymene (90)
x x x
6.125 67, 68, 93
Limonene (80)
x x x x
6.190 57, 83 1-Hexanol, 2-ethyl- (32) 1-Pentanol, 2-ethyl-4-methyl- (37) Ethanol-2-[(2-ethyl hexyl) oxy]- (37)
x x x
6.747 93 γ-Terpinene (58)
x x x
7.571 57, 71, 85
Undecane (91) Undecane, 3,6-dimethyl- (91) Dodecane, 3-methyl- (72) Nonane, 2-methyl- (72)
x x x x
7.687 57, 70
Hepten-1-ol (53) Nonanal (50) Cyclopentane, 1-methyl-2-propyl- (47) 9-Dodecenol (35)
x x x x
9.167 128 Naphthalene (89) Azulene (81)
x x
9.240 58, 71 2-Decanone (59) Undecanone (50) 2-Undecanone (45)
x x x
9.288 120,152 Salicylic acid, ME (72) Salicylic acid, AO (32)
9.325 57, 71, 85
Undecane (83) Tritetracontane (83) Nonane, 2-methyl- (64) Tridecane, 6-methyl- (59) Dodecane, 2,7,10-trimethyl- (59)
x x x x
9.478 121, 150 n-Propylanisole (64)
x x x
9.537 57, 71 Dodecane, 6-methyl- (83) Undecane, 3,6-dimethyl- (74) Decane, 2,6,8-trimethyl- (50) Octane, 2,5-dimethyl- (47)
x x x x
9.998 55, 83 Cyclohexane, 1,1’-(1,4-butanediyl)bis- (78) Cyclohexane, (1,3-dimethyl butyl)- (50) 1-Azabicyclo (3.1.0) hexane (47)
x x x
10.372 57, 71, Heptadecane, 2,6,10,15-tetramethyl- x x
220
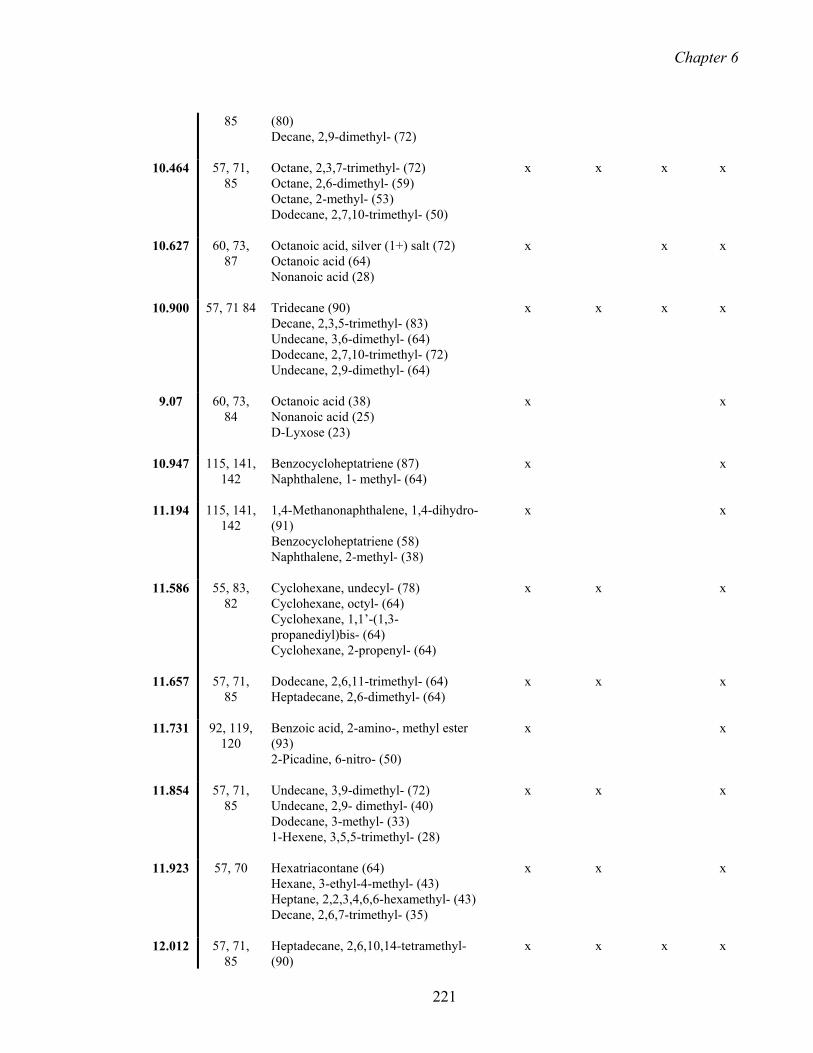
Chapter 6
85 (80) Decane, 2,9-dimethyl- (72)
10.464 57, 71, 85
Octane, 2,3,7-trimethyl- (72) Octane, 2,6-dimethyl- (59) Octane, 2-methyl- (53) Dodecane, 2,7,10-trimethyl- (50)
x x x x
10.627 60, 73, 87
Octanoic acid, silver (1+) salt (72) Octanoic acid (64) Nonanoic acid (28)
x x x
10.900 57, 71 84 Tridecane (90) Decane, 2,3,5-trimethyl- (83) Undecane, 3,6-dimethyl- (64) Dodecane, 2,7,10-trimethyl- (72) Undecane, 2,9-dimethyl- (64)
x x x x
9.07 60, 73, 84
Octanoic acid (38) Nonanoic acid (25) D-Lyxose (23)
x x
10.947 115, 141, 142
Benzocycloheptatriene (87) Naphthalene, 1- methyl- (64)
x x
11.194 115, 141, 142
1,4-Methanonaphthalene, 1,4-dihydro- (91) Benzocycloheptatriene (58) Naphthalene, 2-methyl- (38)
x x
11.586 55, 83, 82
Cyclohexane, undecyl- (78) Cyclohexane, octyl- (64) Cyclohexane, 1,1’-(1,3-propanediyl)bis- (64) Cyclohexane, 2-propenyl- (64)
x x x
11.657 57, 71, 85
Dodecane, 2,6,11-trimethyl- (64) Heptadecane, 2,6-dimethyl- (64)
x x x
11.731 92, 119, 120
Benzoic acid, 2-amino-, methyl ester (93) 2-Picadine, 6-nitro- (50)
x x
11.854 57, 71, 85
Undecane, 3,9-dimethyl- (72) Undecane, 2,9- dimethyl- (40) Dodecane, 3-methyl- (33) 1-Hexene, 3,5,5-trimethyl- (28)
x x x
11.923 57, 70 Hexatriacontane (64) Hexane, 3-ethyl-4-methyl- (43) Heptane, 2,2,3,4,6,6-hexamethyl- (43) Decane, 2,6,7-trimethyl- (35)
x x x
12.012 57, 71, 85
Heptadecane, 2,6,10,14-tetramethyl- (90)
x x x x
221

Chapter 6
Dodecane, 2,6,11-trimethyl- (53) 1-Octanol, 2-butyl- (47) Nonadecane (47)
12.199 154 Naphthalene, 2-ethenyl- (78) 1,1’-Biphenyl (46) 2-Quinolinecarbonitrile, 1-oxide (46)
x
12.363 57, 71, 84
Tetradecane (91) Heptadecane (83) Undecane, 5,6-dimethyl- (64) Octane, 2,4,6-trimethyl- (64) Undecane (64)
x x x
12.541 55, 57 Tetradecanal (64) Hexadecanol (58) Tridecanal (59)
x x x
12.603 141, 142 Naphthalene, 1,3-dimethyl- (70) Naphthalene, 1,6-dimethyl- (62) Naphthalene, 2,3-dimethyl- (62)
x x
12.762 141, 142 Naphthalene, 1,6-dimethyl- (93) Naphthalene, 2,6-dimethyl- (92) Naphthalene, 1,5-dimethyl- (83)
x x
12.825 141, 142 Naphthalene, 1,5-dimethyl- (87) Naphthalene, 2,6-dimethyl- (84) Naphthalene, 1,3-dimethyl- (64)
x x
13.089 83, 82 Octane, 2-cyclohexyl- (64) Cyclohexane, 1-propyl- (50) Cyclohexane, 1,1’-methylene bis- (50)
x x
13.428 55, 69, 83
Cyclotetradecane (78) Cyclododecane (78) 2-Dodecene (64)
x x x
13.726 57, 71, 85
Decane, 2,3,5-trimethyl- (90) Dodosane (83) Heptane, 2,6-dimethyl- (64) Octane, 2,7-dimethyl- (64) Nonadecane (64)
x x x x
14.900 71, 111, 173
Propanoic acid, 2-methyl-, 1-(1,1-dimethyl)- (64)
x x
15.001 57, 71, 85
Tetradecane (86) Docosane (78) Nonadecane (64) Docosane (59) Octane, 2,4,6- trimethyl- (59)
x x x x
15.548 57, 71, 85
Heptadecane, 2,6-dimethyl- (64) Tetratetracontane (22)
x x x
222
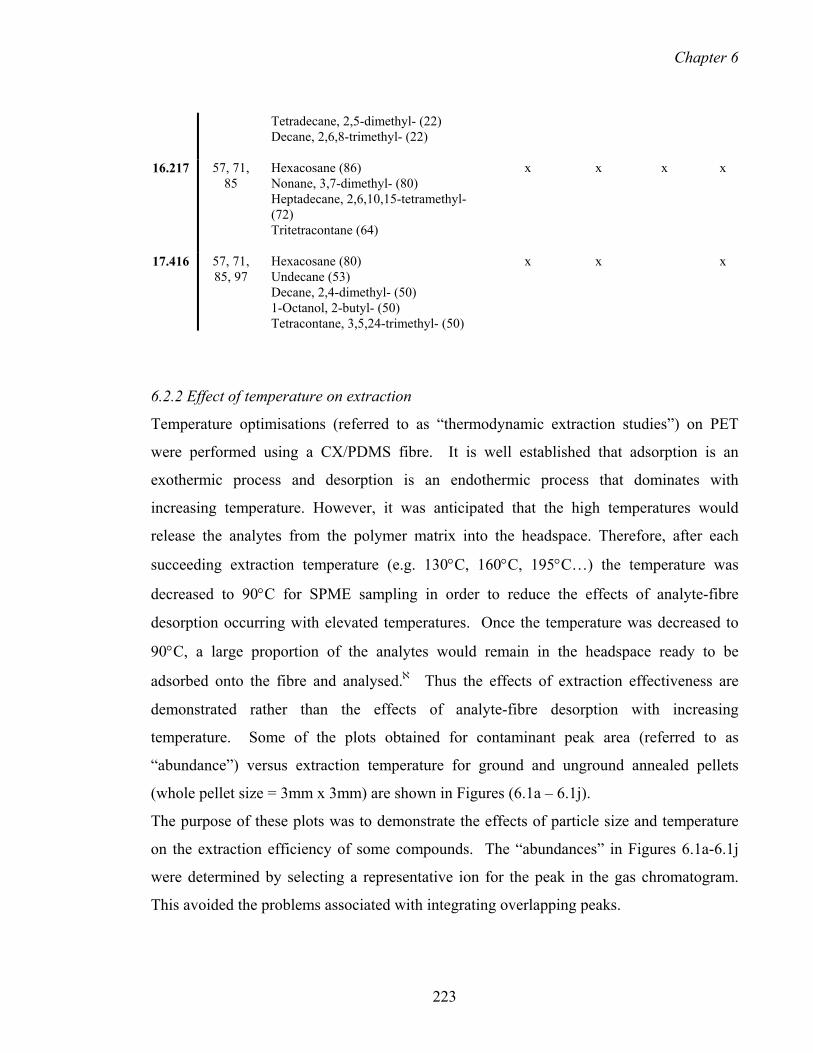
Chapter 6
Tetradecane, 2,5-dimethyl- (22) Decane, 2,6,8-trimethyl- (22)
16.217 57, 71, 85
Hexacosane (86) Nonane, 3,7-dimethyl- (80) Heptadecane, 2,6,10,15-tetramethyl- (72) Tritetracontane (64)
x x x x
17.416 57, 71, 85, 97
Hexacosane (80) Undecane (53) Decane, 2,4-dimethyl- (50) 1-Octanol, 2-butyl- (50) Tetracontane, 3,5,24-trimethyl- (50)
x x x
6.2.2 Effect of temperature on extraction
Temperature optimisations (referred to as “thermodynamic extraction studies”) on PET
were performed using a CX/PDMS fibre. It is well established that adsorption is an
exothermic process and desorption is an endothermic process that dominates with
increasing temperature. However, it was anticipated that the high temperatures would
release the analytes from the polymer matrix into the headspace. Therefore, after each
succeeding extraction temperature (e.g. 130°C, 160°C, 195°C…) the temperature was
decreased to 90°C for SPME sampling in order to reduce the effects of analyte-fibre
desorption occurring with elevated temperatures. Once the temperature was decreased to
90°C, a large proportion of the analytes would remain in the headspace ready to be
adsorbed onto the fibre and analysed.ℵ Thus the effects of extraction effectiveness are
demonstrated rather than the effects of analyte-fibre desorption with increasing
temperature. Some of the plots obtained for contaminant peak area (referred to as
“abundance”) versus extraction temperature for ground and unground annealed pellets
(whole pellet size = 3mm x 3mm) are shown in Figures (6.1a – 6.1j).
The purpose of these plots was to demonstrate the effects of particle size and temperature
on the extraction efficiency of some compounds. The “abundances” in Figures 6.1a-6.1j
were determined by selecting a representative ion for the peak in the gas chromatogram.
This avoided the problems associated with integrating overlapping peaks.
223

Chapter 6
Several of the compounds in these plots present an adsorption maximum followed by a
decrease of the absorbed quantity, with increasing temperature (e.g. benzene; 2,4,6-
trimethyloctane; limonene). Of all compounds in Figures (6.1a – 6.1j) the ones with a
lower library match quality than 80 were from Figures 6.1 (a), (e) and (f) (see Table 6.1 for
the library match qualities of the corresponding compounds). The lowest match quality
was observed for “3-pentanol” [represented by (a) in Figure 6.1], whose identity was
improbable, most likely due to peak overlap. The reason for the low match qualities for
compounds represented by (e) and (f) in Figure 6.1 could stem from the insignificant size
of the chromatographic peak as well as peak overlap.
Figures 6.1a-6.1j: Ground annealed pellets: contaminant area (abundance) versus extraction
temperature for three different particle sizes using the CX/PDMS fibre. Plots for selected
analytes are shown in Figure 1a - 1j. ∆ = Pellets, = >425-700µm, X = 0-300µm.
(a)
3-Pentanol
0
4000000
8000000
12000000
16000000
70 120 170 220
Extraction Temperature (Degrees)
Abundance
(b)
ℵ As the volatiles released at higher temperatures condense on the surface of PET at 90°C, this system is only valid when the amount of compounds released is very high so that the concentration in the vapour phase is enough to surpass the detection limit.
224

Chapter 6
Benzene
0
100000000
200000000
300000000
75 95 115 135 155 175 195 215 235 255 275
Extraction Temperature (Degrees)
Abu
ndan
ce
(c)
Benzene, ethyl-
0200000400000600000800000
100000012000001400000
75 95 115 135 155 175 195 215 235 255 275
Extraction Temperature (Degrees)
Abu
ndan
ce
(d)
p-Xylene
0
5000000
10000000
15000000
20000000
25000000
75 125 175 225 275
Extaction Temperature (Degrees)
Abu
ndan
ce
(e)
225

Chapter 6
Benzene, propyl-
0
300000
600000
900000
1200000
75 95 115 135 155 175 195 215 235
Extraction Temperature (Degrees)
Abu
ndan
ce
(f)
Octane, 2,4,6-trimethyl-
0500000
10000001500000200000025000003000000
75 95 115 135 155 175 195 215 235 255
Extraction Temperature (Degrees)
Abu
ndan
ce
(g)
Limonene
0
2000000
4000000
6000000
8000000
65 85 105 125 145 165 185 205 225 245 265
Extraction Temperature (Degrees)
Abu
ndan
ce
(h)
226

Chapter 6
Naphthalene
0
5000000
10000000
15000000
20000000
75 95 115 135 155 175 195 215 235 255
Extraction Temperature (Degrees)
Abu
ndan
ce
(i)
Toluene
0
5000000
10000000
15000000
75 125 175 225 275
Extraction Temperature (Degrees)
Abu
ndan
ce
(j)
227

Chapter 6
m-Cymene
0
500000
1000000
1500000
2000000
75 125 175 225
Extraction Temperature (Degrees)
Abun
danc
e
The effect of temperature on extraction efficiency was investigated in greater depth for
extruded pellets and the results, which often reach an adsorption maximum and then
decrease with temperature, are shown in Figures (6.2a – 6.2d). This behaviour, which is
mainly associated with “adsorptive” fibres, has already been observed in the past by other
researchers, who attributed the distinctive shapes of the thermodynamic plots to
displacement effects arising from competitive adsorption (Semenov et al. 2000; Tuduri et
al. 2001; Murray 2001).
It should be further mentioned that when heating polymers at high temperatures (over
130°C) the degradation of the polymer increases and more compounds may appear, as a
result of the breaking of chains and also from the degradation of some additives (Nerin et
al. 1998b; 1996). Therefore, in some cases the rise in compound levels with increasing
temperature could result from the degradation of thermally liable compounds in the
polymer or the polymer itself.
228

Chapter 6
Figure 6.2: Effect of incubation temperature on extraction of 6g of unground extruded
pellets using the CX/PDMS fibre. Curves for compounds are plotted in Figures 6.2a –
6.2d.
(a)
0
5000000
10000000
15000000
20000000
85 105 125 145 165 185 205 225 245 265
Temperature (degrees)
Abu
ndan
ce
3-Pentenol 1-Butene, 3-methyl-Benzene Toluenep-Xylene NaphthaleneEthylbenzene Limonene1-Methyl-2-propylcyclopentane
229

Chapter 6
6.2 (b)
0
200000
400000
600000
800000
1000000
1200000
1400000
1600000
80 100 120 140 160 180 200 220 240 260 280
Temperature (degrees)
Abu
ndan
ce
n-Propylanisole Biphenyl2-Dimethylnaphthalene 1-Methylnaphthalenem-Cymene gamma-Terpinene1,2,4-Trimethylbenzene Propylbenzene1-Ethyl-,2-methyl-,benzene Undecane
230

Chapter 6
6.2 (c)
0
500000
1000000
1500000
2000000
2500000
3000000
3500000
4000000
75 95 115 135 155 175 195 215 235 255 275
Temperature (Degrees)
Abu
ndan
ce2-Ethylfuran cis-1,3-Cyclopentanediol2,4,6-Trimethyloctane 1-OcteneTritetracontane TetradecaneTridecane Octanoic Acid2-Decanone
231

Chapter 6
6.2 (d)
0
20000000
40000000
60000000
80000000
100000000
120000000
80 100 120 140 160 180 200 220 240 260Temperature (degrees)
Abun
danc
eBenzaldehydePropanedinitrile, methylene-1,3-Dioxolane
232

Chapter 6
As temperature increases the total contaminant concentration in the headspace increases
and there is rising potential for reversible binding and displacement of low molecular
weight contaminants by high molecular weight contaminants (Jia et al. 2000, Semenov et
al. 2000; Tuduri et al. 2001). This is because larger molecules generally have a higher
affinity for the adsorptive fibre than smaller molecules. Therefore, when contaminant
concentrations are similar, the larger molecules have a longer range, which is
approximately linear but (steadily) increasing over a wide temperature range. Long “linear”
ranges were observed for n-propylanisole, biphenyl, 2-dimethylnaphthalene, 1-
methylnaphthalene, benzaldehyde (two consecutive “linear” sections), tridecane,
tetradecane. Comparatively smaller compounds that did not undergo the expected
competitive adsorption until 250°C were 3-pentenol∗; 1-butene, 3-methyl-∗; and p-xylene.
These contaminants could be present in comparatively large quantities, impeding their
displacement until the level of displacing compound increases significantly in the
headspace. This is because the competitive adsorption process follows an exchange
mechanism, which is concentration and affinity dependent. Equations 6.1- 6.4 describe the
displacement of analyte “X” by analyte “Y”, where K is the equilibrium constant that
describes the affinity one compound has to the surface relative to the competing compound.
Y + X:SURFACE ↔ X + Y:SURFACE (Equation 6.1)
K = [Y:SURFACE][X] / [Y][X:SURFACE] (Equation 6.2)
∴[Y:SURFACE] = K[Y][X:SURFACE]/ [X] (Equation 6.3)
and
[X:SURFACE] = [Y:SURFACE] [X]/ K[Y] (Equation 6.4)
∗ Due to the poor library matches obtained for “3-pentanol” and “1-butene, 3-methyl-”, the correct identity of these two earliest eluting compounds was uncertain. The compounds were assumed to be volatile relative to the other compounds because they eluted very early in the gas chromatogram. In gas chromatography retention time is a reflection of analyte boiling point and stationary phase-analyte interactions.
233

Chapter 6
It is implied by these equations that “X” type compounds with a lower affinity for the
surface and high headspace concentrations (high K values) will not be displaced by “Y”
type compounds with higher affinities until their headspace concentrations ([Y]) reach a
sufficiently high level.
In Figures (6.2a – 6.2d) for a few of the contaminants showing signs of early competitive
adsorption (e.g. benzene, limonene, m-cymene, undecane, propylbenzene and 1-ethyl-2-
methyl-benzene), the amount of contaminant adsorbing onto the fibre begins to increase
after the steep decrease, which signifies an exchange in displacement. It is presumed that
this change in trend results from high extraction temperatures releasing more volatile
contaminants from the internal body of the polymer into the headspace at a faster rate than
the displacing compounds, which are mainly semivolatiles. This increase in the headspace
concentration ratio between the analyte of low affinity and the analyte of high affinity
causes the replacement of some high affinity contaminants by some low affinity
contaminants. An alternative explanation was made by H.-J. Cho et al. (2003) who
suggested that capillary condensation at high concentrations could be responsible for the
observed increase in area.
The effect of decreasing particle size on amount extracted is difficult to summarise from
Figures (6.1a – 6.1j). General remarks are difficult to make because the particle size order
changes with increasing temperatures (curves cross over). One generalisation that could be
made at low temperatures is that the “∆” (representing the pellets) are always lowest-lying
before 160°C. This is consistent with the theory that least contaminant is liberated from the
internal body of the largest particle size to the headspace.
Variation in particle size order with increasing temperature could result from coalescence
between the compactly packed smaller particles taking place at higher temperatures,
reducing the amount of contaminant liberated. In addition, because each point represents
only one experimental value, it is possible that experimental error is another factor
contributing to the changes in particle size order. Another feasible explanation is that the
total level of analytes in the headspace is the largest for the smallest particle size (due to
larger surface are per unit mass of PET) therefore the number of available sites on the fibre
decreases rapidly and molecules start competing for them. The effect of increasing total
analyte concentration on adsorption has previously been demonstrated by H.-J. Cho et al.
234

Chapter 6
(2003). It is also possible that the compounds in the internal body of the largest particles
reach the surface and are released when temperature increases.
6.2.3 Effect of mass of sample on extraction
The amount of recycled PET pellets analysed by SPME was reduced from 6 g to 1 g in an
attempt to reduce analyte concentration in the headspace and therefore potential saturation
and competitive adsorption. Ezquerro et al. (2002) demonstrated that the size of the vial
could also effect the headspace concentration and therefore the amount of analyte adsorbed.
Figures 6.3a – 6.3c present the thermodynamic results obtained for 1 g of pellets. The
compounds presented in these graphs are those that demonstrated competitive adsorption in
Figures 6.2a – 6.2d. The extraction temperatures sampled were between 160°C and 218
°C. Limonene (Figure 6.3a) and benzene (Figure 6.3b) started to exhibit displacement
after 180°C. In Figures 6.2a-6.2d the same compounds started to undergo competitive
adsorption after 160°C and 168°C respectively. Therefore competitive adsorption was
postponed when using a smaller sample mass. Ethylbenzene, which displayed competitive
adsorption between 168°C and 250°C when 6 g of pellets were analysed (Figure 6.2a), did
not display signs of displacement when 1g was sampled (Figure 6.3c). A similar result was
observed for undecane, which did not show any displacement effects when 1g of PET was
analysed.
In Figure 6.2b, m-Cymene underwent competitive adsorption after 180°C whereas in
Figure 6.3a there was no decrease in adsorption prior to 210°C.
A change in adsorption was not observed until 210°C for 2,4,6-trimethyloctane (Figure
6.3a) and not at all for 1-ethyl-2-methyl-benzene (Figure 6.3a). Conversely, in Figures 6.2c
and 6.2b respectively, adsorption started to decline for these compounds after 168°C and
180°C. A similar delay in competitive adsorption was observed for 2-ethylfuran, which did
not demonstrate competitive adsorption prior to 200°C (Figure 6.3a).
In an attempt to prevent the displacement of limonene; m-cymene; benzene, 2,4,6-
trimethyloctane; 2-ethylfuran; and methylene propanedinitrile an even smaller mass of
pellets was analysed (0.3 g). Figures (6.4a – 6.4b) indicate that the decrease in mass caused
an increase in the “linear” range (range over which there is a steady increase in abundance
235
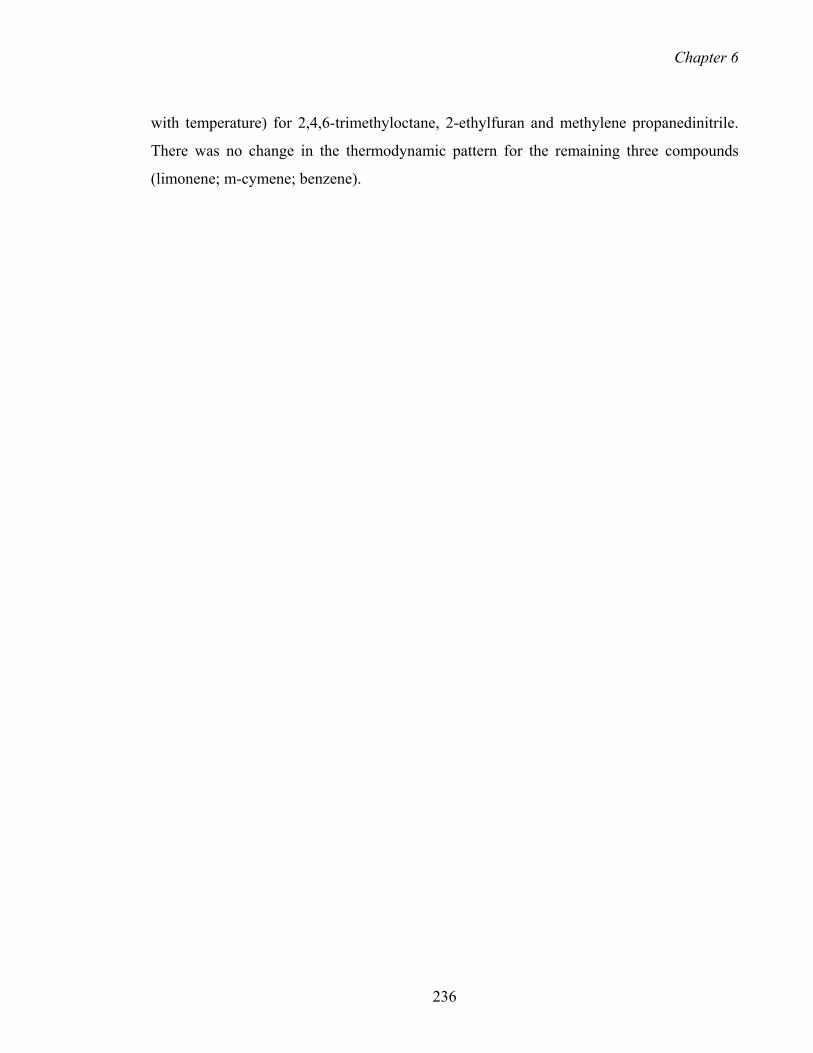
Chapter 6
with temperature) for 2,4,6-trimethyloctane, 2-ethylfuran and methylene propanedinitrile.
There was no change in the thermodynamic pattern for the remaining three compounds
(limonene; m-cymene; benzene).
236

Chapter 6
Figure 6.3a-c: Effect of incubation temperature on extraction of 1g of unground extruded
pellets using the CX/PDMS fibre.
(a)
0
500000
1000000
1500000
2000000
2500000
3000000
3500000
4000000
4500000
150 170 190 210 230
Temperature (Degrees)
Abu
ndan
ce
Limonene m-Cymene1-Ethyl-,2-methyl-,benzene 2-EthylfuranUndecane 2,4,6-TrimethyloctanePropanedinitrile, methylene-
237

Chapter 6
6.3 (b)
Benzene
0
50000000
100000000
150000000
200000000
250000000
300000000
350000000
400000000
450000000
150 170 190 210 230Temperature (Degrees)
Abu
ndan
ce
238
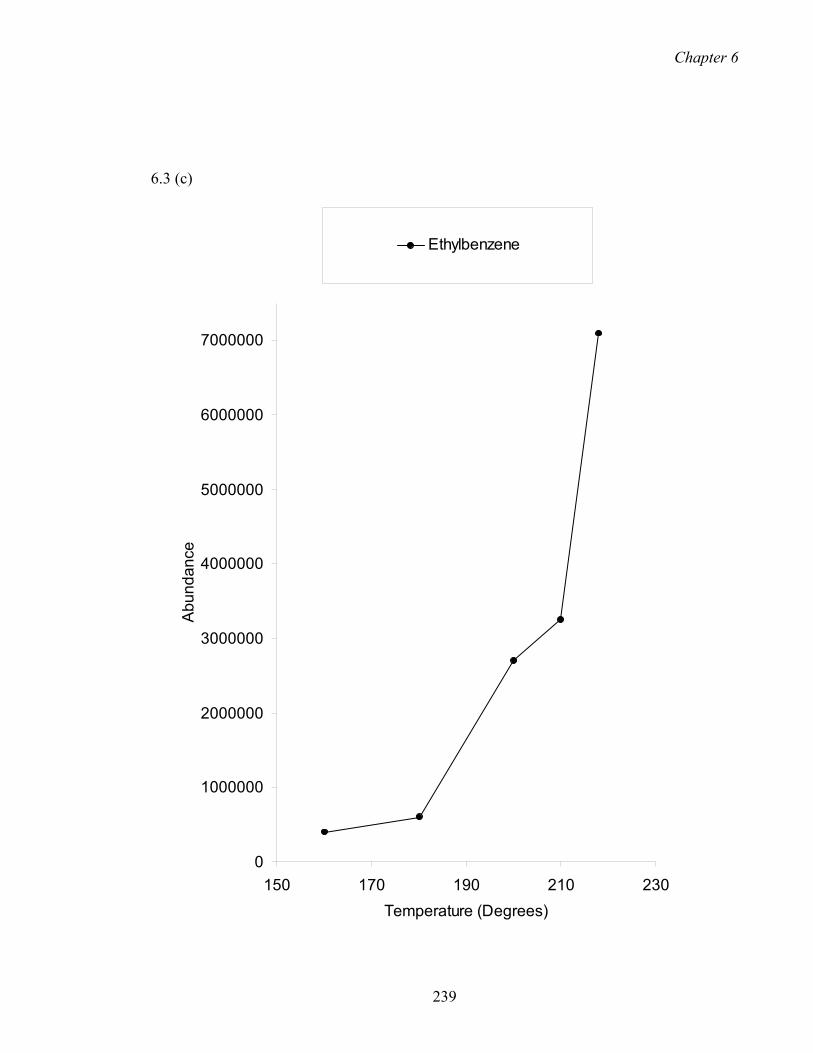
Chapter 6
6.3 (c)
0
1000000
2000000
3000000
4000000
5000000
6000000
7000000
150 170 190 210 230Temperature (Degrees)
Abu
ndan
ce
Ethylbenzene
239

Chapter 6
Figure 6.4: Effect of incubation temperature on extraction of 0.3g of unground extruded
pellets using the CX/PDMS fibre. Curves for compounds are plotted in Figures 6.6a –
6.6b.
(a)
0
200000
400000
600000
800000
1000000
1200000
1400000
150 170 190 210 230Temperature (Degrees)
Abu
ndan
ce
Propanedinitrile, methylene- m-CymeneLimonene 2,4,6-Trimethyloctane2-Ethylfuran
240

Chapter 6
6.4 (b)
Benzene
0
20000000
40000000
60000000
80000000
100000000
120000000
140000000
160000000
180000000
150 170 190 210 230Temperature (Degrees)
Abu
ndan
ce
241

Chapter 6
6.2.4 Effect of adsorption time
The fibre exposure time of 30 minutes was originally selected in order to achieve fibre-
headspace equilibrium, which is required to maintain consistency in results. When working
in the pre-equilibrium period, time control is critical because a small change in time results
in large change in analyte absorbed.
The adsorption time was reduced from 30 minutes to 5 minutes and extraction of pellets
was carried out at 160°C and 200°C. The contaminants analysed were limonene and
benzene because they underwent competitive adsorption before 200°C in Figures 6.3a and
6.3b and were thus considered the worst-case compounds in terms of competitive
adsorption. Table 6.2 indicates that there was a decrease in the amount absorbed for both
compounds with increasing temperature. This implied that competitive adsorption
nonetheless occurred at the reduced sorption time.
Table 6.2: Area of benzene and limonene after reducing the fibre exposure time from 30
minutes to 5 minutes.
Incubation Temperature
(°C)
Contaminant
Benzene (m/e 78) Limonene (m/e 68)
160
200
160873631
112310430
3093681
1403324
242
Chapter 6
6.2.5 Effect of extraction time on extraction
The extraction time is a critical parameter in the SPME sampling process - the longer the
extraction time, the larger the distribution of the analytes into the headspace.
Ground annealed pellets (>425-700µm) were extracted at 160°C for different times (0.5h –
7.2 h) in an attempt to determine the kinetics of extraction. In Figures 6.5a – 6.5e
consistent increase in abundance with time was observed for tetradecane; 1-ethyl, 2-
methyl-benzene; 2-decanone; cis-1,3-cyclopentanediol; and tritetracontane. The
abundances for the remaining analytes were shown to either increase abruptly after 5h (e.g.
ethylbenzene; 1-butene, 3-methyl), remained fairly constant throughout the study (e.g. p-
xylene; n-propylanisole) or showed signs of competitive adsorption (e.g. limonene;
tridecane). Due to the limitations associated with the use of the CX/PDMS fibre, the
effects of extraction time on extraction were not accurately demonstrated for all
compounds. A simple explanation for the different shapes cannot be made because
displacement on the CX/PDMS is not only dependent on the analyte size and vapour
pressure (H.-J. Cho et al., 2003) but also on its relative headspace concentration, which is
not known.
243

Chapter 6
Figure 6.5a-e: Effect of extraction time on abundance.
(a)
2500000
3500000
4500000
5500000
6500000
7500000
8500000
9500000
10500000
11500000
0 1 2 3 4 5 6 7 8
Time (h)
Abu
ndan
ce3-Pentenol 1-Butene, 3-methyl-p-Xylene Propanedinitrile, methylene-1,2,4-Trimethylbenzene 2,4,6-TrimethyloctaneLimonene Undecane
244

Chapter 6
6.5 (b)
550000
1050000
1550000
2050000
2550000
3050000
3550000
4050000
0 1 2 3 4 5 6 7
Time (h)
Abu
ndan
c
8
e
1,2,4-Trimethylbenzene 1-Ethyl-,2-methyl-,benzene2-Ethylfuran m-CymeneNaphthalene TetradecaneTridecane
245

Chapter 6
6.5 (c)
0
200000
400000
600000
800000
1000000
1200000
1400000
1600000
1800000
2000000
0 1 2 3 4 5 6 7 8Time (h)
Abu
ndan
ce
1-Octene EthylbenzenePropylbenzene Propylbenzenecis-1,3-Cyclopentanediol gamma-TerpineneBiphenyl n-Propylanisole2-Decanone Tritetracontane
246
Chapter 6
6.5 (d)
100000000
120000000
140000000
160000000
180000000
200000000
220000000
240000000
260000000
280000000
0 1 2 3 4 5 6 7 8Time (h)
Abu
ndan
ceBenzene
247

Chapter 6
6.5 (e)
8000000
9000000
10000000
11000000
12000000
13000000
14000000
15000000
16000000
17000000
0 1 2 3 4 5 6 7 8Time (h)
Abu
ndan
ceToluene
248

Chapter 6
6.3 QUANTITATIVE SPME AND STATIC HEADSPACE STUDY OF RECYCLED
PET
6.3.1 Quantitation using the CX/PDMS fibre
As Murray (2001) pointed out, the relative proportions of the analytes adsorbed onto the
fibre depend on their ratio in the headspace. Therefore during external quantitation, only a
standard containing all components at the same relative concentrations is appropriate.
Small errors in composition of standards and sample can result in large errors in
quantitation. Therefore, the identity and concentration of every component in the sample
that might displace low molecular weight compounds from the fibre must be known so that
an identical standard is prepared. Otherwise an absorptive fibre or static headspace must be
used for quantitation of multicomponent matrices. External calibration could really only be
used with the CX/PDMS fibre when the concentrations of the analytes are low and
interfering compounds are absent (H.-J. Cho et al. 2003).
Theoretically, the quantitative method of standard additions could be successful whilst
using the CX/PDMS fibre because it insures that the ratio of analytes in the headspace
remains constant for standards and samples. However the amount of each compound must
not exceed the linear range for accurate quantification. In a past study by Ezquerro et al.
(2003) the method of standard additions was not effective during the SPME extraction of
packaging materials using the CX/PDMS fibre, therefore this method was not investigated
here.
6.3.2 SPME using PDMS, an absorption fibre
Due to the effects of competitive adsorption observed with adsorption-type fibres,
thermodynamic studies were carried out using PDMS, the conventional absorption-type
fibre. The PDMS fibre was far less sensitive (estimated x 60) than the CX/PDMS fibre for
the analysis of extruded pellets, as indicated by the superimposed chromatograms (Figure
6.6). Only limonene and a few hydrocarbons were identified. As shown in Figure 6.7a-
6.7b, the contaminants analysed by PDMS present a weak relationship (R2) between
abundance and extraction temperature for most of the compounds, which do not always
have ascending trends, even at low temperatures and possibly due to the large degree of
249

Chapter 6
scatter. The large spread is thought to result from the irreproducibility associated with the
PDMS fibre for the analysis of contaminants present in trace quantities. Due to the
limitations surrounding SPME, a different thermal extraction method was sought which
accounted for the low boiling point compounds and was even simpler in terms of
equipment – static headspace analysis.
Figure 6.6: Superimposed chromatograms obtained from the analysis of pellets using the
PDMS (bold) and CX/PDMS (fine) fibres. c
Αbundan
250
Time (min)

Chapter 6
Figure 6.7 (a-b): Effect of incubation temperature on extraction of 6g of unground extruded
pellets using the 100 µm PDMS fibre.
(a)
y = 2800.7x + 80720R2 = 0.1744
y = -1066x + 388532R2 = 0.1988
0
100000
200000
300000
400000
500000
600000
700000
800000
900000
1000000
80 130 180 230Temperature (Degrees)
Abu
ndan
ce
Limonene Cyclopentene, 1-methyl-2-propyl-
251

Chapter 6
6.7 (b)
y = 1836.3x - 169456R2 = 0.5481
y = 1180.8x - 120351R2 = 0.5348
y = -146.55x + 78174R2 = 0.0294
y = 1303.1x - 122395R2 = 0.5034
0
50000
100000
150000
200000
250000
300000
80 130 180 230
Temperature (Degrees)
Abun
danc
eUndecane TritetracontaneDodecane, 6-methyl- TridecaneLinear (Tridecane) Linear (Undecane)Linear (Dodecane, 6-methyl-) Linear (Tritetracontane)
252
Chapter 6
6.3.3 Static headspace analysis (SHS)
Owing to the displacement behaviour of analytes on the CX/PDMS fibre, we were unable
to observe the optimum temperature required for the complete extraction of volatile
contaminants out of PET matrix. Therefore an analogous thermodynamic study was carried
out by SHS. Ground washed and dried flake was preliminarily screened by SHS to
determine what contaminants were present in the flake and their retention times. Since the
concentration of contaminants in recycled pellets was clearly a lot smaller, GC/MS analysis
incorporating selected ion monitoring (SIM) and retention time recognition was
subsequently used to analyse a selection of contaminants. The sensitivity of the static
headspace technique was shown to be significantly smaller than the SPME method using
the CX/PDMS fibre for the analysis of the recycled pellets (Figure 6.8a – 6.8b). Note that
the abundance scale in Figure 6.8b is ten times coarser than in Figure 6.8a. The drawback
of the static headspace method is that it only accounts for the highly volatile compounds in
trace analysis. Selected ion monitoring (SIM) GC/MS was therefore used to improve the
sensitivity of the less volatile analytes during quantitation. Note that the retention times for
the peaks obtained by both methods do not correspond as the chromatograms were obtained
on different columns. The retention times and library matches for the chromatographic
peaks obtained by the CX/PDMS fibre (Figure 10a) are listed in Table 6.1.
Figures 6.9a – 6.9c include the abundance-temperature plots for several volatile compounds
in PET pellets. These graphs denote a strong dependence upon the extraction temperature
and the amount extracted. All of the correlation coefficients (R2) for the second order
polynomials (Figure 6.9a and 6.9b) in these graphs were above 0.94, signifying strong
relationships between both variables. Second order polynomial curves were not fitted for
the analytes in Figure 6.9c, whose points form different trends.
253

Chapter 6
Figure 6.8: Chromatograms for extruded pellets obtained by (a) SHS and (b) SPME using
the CX/PDMS fibre (1=dichloromethane; 2=trichloromethane; 3=1,3-dioxane, 2-methyl-;
4=benzene; 5=limonene).
(a)
1
4
3
2 5
(b)
4
5
254
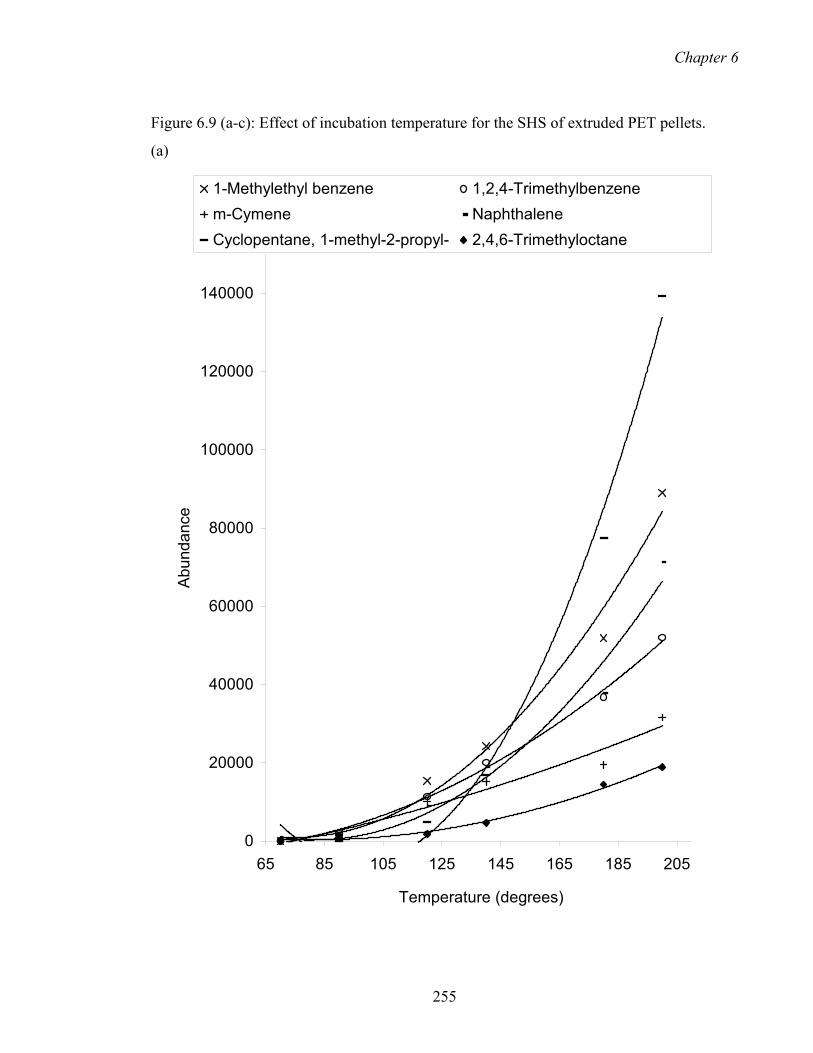
Chapter 6
Figure 6.9 (a-c): Effect of incubation temperature for the SHS of extruded PET pellets.
(a)
0
20000
40000
60000
80000
100000
120000
140000
65 85 105 125 145 165 185 205
Temperature (degrees)
Abu
ndan
ce1-Methylethyl benzene 1,2,4-Trimethylbenzenem-Cymene NaphthaleneCyclopentane, 1-methyl-2-propyl- 2,4,6-Trimethyloctane
255

Chapter 6
6.9 (b)
0
2000
4000
6000
8000
10000
12000
14000
16000
18000
20000
50 70 90 110 130 150 170 190 210
Temperature (Degrees)
Abu
ndan
ceBenzaldehyde 3-Ethyl-o-xylene Cineolen-Propylanisole Biphenyl Propylbenzene2-Ethylfuran
256
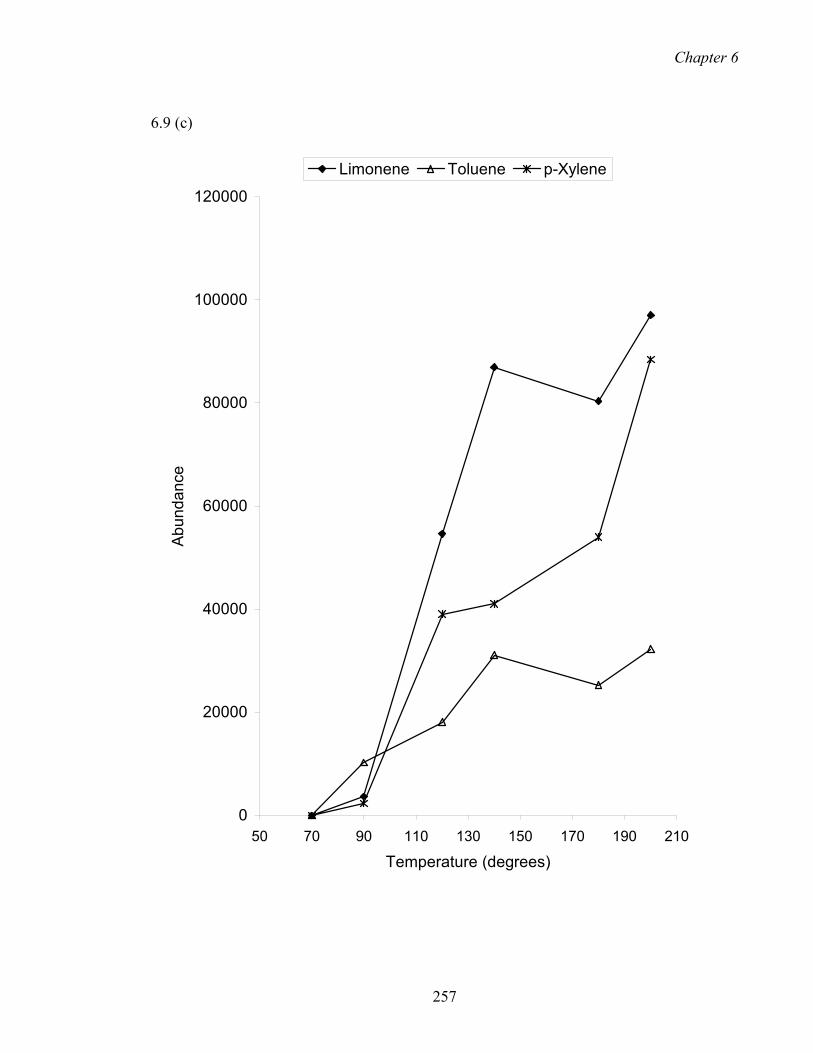
Chapter 6
6.9 (c)
0
20000
40000
60000
80000
100000
120000
50 70 90 110 130 150 170 190 210
Temperature (degrees)
Abu
ndan
ceLimonene Toluene p-Xylene
257

Chapter 6
6.3.4 Quantitative analysis of PET
As complete extraction was not achieved during attempted temperature optimisation,
quantitation by external standardisation (ES) was not primarily considered. Instead,
multiple headspace extraction (MHE) was employed. This method, which allows for
matrix effects, involves sampling repeatedly the same sample at equal time intervals to
obtain the decay of the concentration of analytes. MHE has already been used for the
analysis of residual solvents (Kolb et al., 1981; Penton 1999) and flavours (Tavss et al.,
1988) in food packaging materials and for the determination of benzene residues in
recycled PET (Komolprasert et al., 1994). Standard additions have been applied in the
analysis of volatile organic compounds in packaging (Ezquerro et al., 2003). In this study,
the method of standard additions was found to be an inappropriate hence it was not
investigated.
6.3.5 Multiple headspace extraction (MHE)
Figure 6.10 presents a non-exponential decrease in contaminant area with time for flake.
Therefore flake cannot be quantified by this method.
258

Chapter 6
Figure 6.10: Multiple headspace analysis of flake ground to 425–700 µm.
0
2000
4000
6000
8000
10000
20 70 120 170 220Time (mins)
Abu
ndan
ce
Toluene m-CymeneEthylbenzene n-Propylanisolep-Xylene gamma-Terpinene1,2,3-Trimethylbenzene Naphthalene
259

Chapter 6
6.3.6 External standardisation (ES)
External standardisation has been applied in the past to quantify degradation products in
PET sheets by static headspace and thermal desorption (Komolprasert et al., 2001). It has
also been used to analyse contaminants in PET flakes (Nerin et al. 2003a). Ezquerro et al.
(2003) used external standardisation amongst other quantitative methods to determine the
composition of volatile organic compounds in packaging materials by SPME.
In this study flake ground to >425-700 µm and recycled pellets were extracted by static
headspace and quantified by external standardisation. Table 6.3 compares the results
obtained for static headspace and Soxhlet extraction for a few contaminants. Soxhlet
extraction was carried out as described in Chapter 3 (Materials and Methods). For flake,
there is no significant difference between both methods in the concentrations of 1,2,4-
trimethylbenzene, m-cymene, limonene and cineole. However as the molecules increase in
size (e.g. naphthalene, n-propylanisole and biphenyl), there is a significant difference
between both methods with the amount extracted being higher for Soxhlet extraction. For
recycled pellets, the amount of contaminant extracted by static headspace was on average
10 times smaller than that obtained by Soxhlet extraction.
In order to approximate the level of some volatile compounds identified by SHS but not by
the Soxhlet extraction method in recycled pellets, concentrations determined by static
headspace could be multiplied by ten to obtain a theoretical Soxhlet extraction result. For
example, the experimental concentration for toluene (Table 6.4) in recycled pellets was
determined to be 3.7 ppb by static headspace; therefore the concentration expected by the
Soxhlet extraction method is estimated to be 37 ppb (3.7 ppb x 10).
To quantify the concentration of volatiles in flake we use the static headspace value as is,
without introducing a scaling factor (concentration of toluene in flake = 73.0 ppb). Other
volatiles that were quantified by SHS were p-xylene and undecane (Table 6.4). Benzene
and ethylbenzene could not be quantified due to their standard curves displaying a large
degree of scatter, possibly due to the low concentrations investigated. The quantified
compounds had correlation coefficients (R2) were between 0.847 (toluene) and 0.998
(naphthalene).
260

Chapter 6
Table 6.3: Comparison of concentrations determined in flake and pellets by Soxhlet and
static headspace analysis. Standard deviations are in parentheses. All values are in ppb.
Contaminant Flake (ppb) Pellets (ppb) Static
headspace Soxhlet
Static
Headspace Soxhlet
1,2,4-Trimethylbenzene
24 (3)
26 (7)
0.7 (0.2)
10 (1)
m-Cymene 60
(3)
67 (16)
0.7 (0.1)
11 (1)
Limonene 1290 (189)
1102 (169)
14 (14)
126 (16)
1,2,3,5-
Tetramethylbenzene 13 (1)
4.4 (0.8)
0.1 (0.0)
1.3 (0.1)
Cineole 78 (8)
104 (51)
0.0 (0.0)
10.7 (1.2)
Naphthalene 13 (1)
29 (3)
4.0 (0.8)
32.1 (3.0)
n-Propylanisole 11 (0)
31 (4)
0.4 (0.1)
1.4 (0.1)
Biphenyl 4.7 (1.3)
16 (4)
0.4 (0.1)
5.7 (0.1)
261

Chapter 6
Table 6.4: Concentrations (ppb) of three compounds determined by static headspace but not
Soxhlet. Standard deviations are in parentheses.
Contaminant Flake (ppb) Pellet (ppb)
Toluene
73 (28)
37 (23)
p-Xylene 6.1 (2.4)
3.7 (1.8)
Undecane 21
(11) 7.9
(0.2)
6.4 CONCLUSION
The 75-µm CX/PDMS fibre was qualitatively the most efficient for analysing volatiles in
PET. Incubation and time optimisation results suggested the competitive replacement of
smaller molecules by larger molecules with increasing analyte concentrations in the
headspace. Decreasing the sample mass and reducing the fibre exposure time was not
sufficient to totally eliminate competitive behaviour with increasing temperature. The use
of PDMS (100-µm), an absorptive-type fibre, meant the absence of competitive adsorption,
but many compounds could not be accounted for and that scatter in results was
unacceptably large with increasing temperature. Due to the limitations surrounding SPME,
quantification was sought using SHS. Incubation profiles by SHS suggested incubation for
1 h at 200°C was inadequate to completely extract compounds out of PET pellets.
However, as multiple headspace extraction did not prove to be satisfactory, external
standardisation, which does not account for matrix effects was used as the method of
quantification. Comparison with Soxhlet extraction results indicated that concentrations of
all analytes were underestimated by SHS of the pellets. The concentrations of volatile, or
262

Chapter 6
early eluting, compounds in the flake approximated those determined by Soxhlet (Table
6.3).
Subsequently, the levels of toluene, undecane and p-xylene were found to be well below
the 215 ppb FDA-set threshold for flake and pellets.
263

Appendices
APPENDIX 1
Mass = density x Volume = 1.48g/cm3 (2.54 cm3/in3) (20 x 0.001 in) = 0.4588 g ~ 460 mg
268

Appendices
APPENDIX 2
Y = fraction of amorphous material
100-Y = fraction of crystalline material
21.7 = average of % crystallinity for Batch 1 and Batch 2 for flake ground
to 0-300 µm (Table 4.14)
Y (19.61/100) + (100-Y)48.41/100 = 21.7
1/100 (19.61Y + 4841 - 48.41Y) = 21.7
19.61Y + 4841 -48.41Y = 2170
Y = 93%
269

Appendices
APPENDIX 3
Annealed pellets comprise of both crystalline and amorphous phases.
Xcryst = fraction of crystalline phase
Dcryst = diffusion coefficient in crystalline phase
Xamorphous = fraction of amorphous phase
Damorph.= diffusion coefficient in crystalline phase
D annealed = Xcryst Dcryst+ Xamorph. Damorph.
Since Dcryst in the crystalline phase = 0
D annealed = Xamorph. Damorph.
= (1- Xcryst) Damorph.
270
Bibliography
BIBLIOGRAPHY
Ackermann, P., Jägerstad, M., and Ohlsson, T., 1995, Foods and packaging
materials: chemical interactions, Royal Society of Chemistry, Cambridge,
England, pp12-22.
Arora, A.P., and Halek, J.W., 1994, Structure and cohesive energy density of
fats and their sorption by polymer films. Journal of Food Science, 29, 1325-
1327.
Ashby, R., 1988, Migration from polyethylene terephthalate under all
conditions of use. Food Additives and Contaminants, 5, Supplement no. 1,
485-492.
Ashraf-Khorassani, M., and Levy, J.M., 1990, Quantitative analysis of
polymer additives in low density polyethylene using supercritical fluid
extraction-supercritical fluid chromatography. Journal of High Resolution
Chromatography, 13, 742-747.
Ashraf-Khorassani, M., Boyer, D.S., and Levy, J.M., 1991, Optimisation of
experimental parameters for the determination of polymer additives using
online SFE-SFC. Journal of Chromatographic Science, 29, 517-521.
Atkinson, E.R., and Calouche, S.I., 1971, Analysis of polyethylene
terephthalate prepolymer by trimethylsilylation and gas chromatography.
Analytical Chemistry, 43 (3), March, 460-462.
Augusto, F., Valente, A.L.P., Tada, E., and Rivellino, S.R., 2000, Screening
of Brazilian fruit aromas using solid phase microextraction-gas
chromatography-mass spectrometry. Journal of Chromatography A, 873,
117-127.
269

Bibliography
Baner, A.L., Franz, R., and Piringer, O., 1994a, Alternative methods for the
determination and evaluation of migration potential from polymeric contact
materials. Deutsche Lebensmittel-Rundschau, 90 (5), 137-143.
Baner, A.L., Franz, R., and Piringer, O., 1994b, Alternative methods for the
determination and evaluation of migration potential from polymeric contact
materials. Deutsche Lebensmittel-Rundschau, 90 (6), 181-185.
Barnes, K.A., Damant, P.D., Startin, J.R., and Castle, C., 1995, Qualitative
liquid chromatographic-atmospheric-pressure chemical-ionisation mass
spectrometric analysis of polyethylene terephthalate oligomers. Journal of
chromatography A, 712, 191-199.
Barrionuevo, W.R., and Lanças, F.M., 2000, Solid phase microextraction of
pyrethroid pesticides from water at low and sub-ppt levels at different
temperatures. Journal of High Resolution Chromatography, 23, 485-488.
Bart, J.J.C., 2001, Direct solid sampling methods for gas chromatographic
analysis of polymer/additive formulations. Polymer Testing, 20, 729-740.
Bartle, K.D., Clifford, A.A., Hawthorne, S.B., Langenfeld, J.J., Miller, D.J.,
and Robinson, R., 1990, A model for dynamic extraction using a
supercritical fluid. The Journal of Supercritical Fluids, 3, 143-149.
Bartle, K.D., Clifford, A.A., Hawthorne, S.B., Langenfeld, J.J., Miller, D.J.,
and Robinson, R., 1990, A model for dynamic extraction using a
supercritical fluid. Journal of Supercritical Fluids, 3, 143-149.
Bartle, K.D., Boddington, T., Clifford, A.A., and Cotton, N.J., 1991,
Supercritical fluid extraction and chromatography for the determination of
oligomers in poly(ethylene terephthalate) films. Analytical Chemistry, 63,
2371-2377.
270

Bibliography
Batlle, R., Sánchez, C., and Nerin, C., 1999a, A systematic approach to
optimise solid phase microextraction. Determination of pesticides in
ethanol/water mixtures used as food simulants. Analytical Chemistry, 2417-
2422.
Batlle, R., Salafranca, J., and Nerin, C., 1999b, The use of solid phase
microextraction for the analysis of Bisphenol A and Bisphenol A Diglycidyl
Ether in food simulants. Journal of Chromatography A, 864, 137-144.
Bayer, F.L., 2002, Polyethylene terephthalate recycling for food contact
applications: testing, safety and technologies: a global perspective. Food
Additives and Contaminants, 19, Supplement, 111-134.
Begley, T.H., and Hollifield H.C., 1989, Liquid Chromatographic
determination of residual reactants and reaction by-products in polyethylene
terephthalate. Journal of the Association of Official Analytical Chemists, 72
(3), 468-470.
Begley T.H., and Hollifield H.C., 1990a, Evaluation of polyethylene
terephthalate cyclic trimer migration from microwave food packaging using
temperature-time profiles. Food Additives and Contaminants, 7 (3), 339-346.
Begley T.H., and Hollifield H.C., 1990b, High-performance liquid
chromatographic determination of migrating poly(ethylene terephthalate)
oligomers in corn oil. Journal of Agricultural Food Chemistry, 38, 145-148.
Begley T.H., Dennison, J.L., Hollifield, H.C., 1990, Migration into food of
polyethylene terephthalate (PET) cyclic oligomers from PET microwave and
susceptor packaging. Food Additives and Contaminants, 7 (6), 797-803.
Begley T.H., and Hollifield H.C., 1993, Recycled Polymers in food
packaging: migration considerations. Food technology, 47 (11), 109-112.
271

Bibliography
Begley T.H., and Hollifield H.C., 1995, Plastics, Rubber, and Paper: A
Pragmatic Approach, edited by C.P. Rader, S.D. Baldwin, D.D. Cornell,
G.D. Sadler and R.F. Stockel, ACS Symposium Series 609 (Washington,
DC: ACS), pp. 445-457.
Begley T.H., Gay, M.G., Hollifield, H.C., 1995, Determination of migrants
in and migration from nylon food packaging. Food additives and
contaminants, 12 (5), 671-676.
Begley, T.H., 1997, Methods and approaches used by FDA to evaluate the
safety of food packaging materials. Food Additives and Contaminants, 14
(6-7), 545-553.
Begley T.H., McNeal, T.P., Biles J.E., and Paquette, K.E., 2002, Evaluating
the potential for recycling all PET bottles into new food packaging. Food
Additives and Contaminants, 19, Supplement, 135-143.
Bicchi, C., Drigo, S., and Rubiolo, P., 2000, Influence of fibre coating in the
headspace solid phase microextraction-gas chromatographic analysis of
aromatic and medicinal plants. Journal of Chromatography, 892, 469-485.
Brandrup, J., and Immergut, E.H., 1989, Polymer Handbook 3rd Edition,
John Wiley and Sons, Canada, pp. 519-557.
Brody, A.L., 1989, Flavour interacts with packaging. Prepared Foods, Sept.,
158 (10), 128-131.
Buiarelli, F., Giampaolo, C., Coccioli, F., 1993, HPLC and GC-MS
detection of compounds released to mineral waters stored in plastic bottles of
PET and PVC. Annali di Chemica, 83, 93-104.
Camacho, W., and Karlsson, S., 2001, Quality determination of recycled
plastic packaging waste by identification of contaminants by GC/MS after
272

Bibliography
microwave assisted extraction. Polymer Degradation and Stability, 71, 123-
134.
Castle L., Mercer, A.J., and Gilbert, J., 1988, Gas chromatographic-mass
spectrometric determination of adipate-based polymeric plasticizers in foods.
Journal of the Association of Official Analytical Chemists, 71 (2), 394-396.
Castle, L., Mayo, A., Crews, C., and Gilbert, J., 1989, Migration of
poly(ethylene terephthalate) (PET) oligomers from PET plastics into foods
during microwave and conventional cooking and into bottled beverages.
Journal of Food Protection, 52 (5), 337-342.
Castle, L., Jickells, S.M., Gilbert, J., and Harrison, N., 1990, Migration
testing of plastics and microwave-active materials for high-temperature
food-use applications. Food Additives and Contaminants, 7 (6), 779-796.
Castle L., Price, D., and Dawkins, J.V., 1996, Oligomers in plastics
packaging. Part 1: Migration tests for vinyl chloride tetramer. Food
Additives and Contaminants, 13 (3), 307-314.
Charara, Z.N., Williams, J.W., Schmidt, R.H., and Marshall, M.R., 1992,
Orange flavour absorption into polymeric packaging materials. Journal of
food science, 57 (4), 963-966.
Chidambaram, D.,Venkatraj, R., and Manisankar, P., 2003, Solvent-induced
modifications in polyester yarns. II. Structural and thermal behaviour.
Journal of Applied Polymer Science, 89, 1555-1566.
Cho, H.-J., Baek, K., Lee, H.-H., Lee, S.-H., and Yang, J.-W., 2003,
Competitive extraction of multi-component contaminants in water by
Carboxen-polymethylsiloxane fibre during solid-phase microextraction.
Journal of Chromatography, 988, 177-184.
273

Bibliography
Cooper, D.R., and Semlyen, J.A., 1973, Equilibrium ring concentrations and
the statistical conformations of polymer chains: Part 11. Cyclics in
poly(ethylene terephthalate). Polymer, 14, May.
Costley, C.T., Dean, J.R., Newton, I., and Carroll, J., 1997, Extraction of
Oligomers from poly(ethylene terephthalate) by microwave-assisted
extraction. Analytical Communications, 34, 89-91.
Cotton N.J., Bartle, K.D., Clifford, A.A., Dowle, C.J., 1993, Rate and extent
of supercritical fluid extraction of additives from polypropylene: diffusion,
solubility, and matrix effects. Journal of Applied Polymer Science, 48, 1607-
1619.
Cross, R.F., Harding, I.H., Cass, P.J., Mudumba, R., and Kosior, E., 2001,
Evaluation of a new poly(ethylene terephthalate) recycling process for food
contact applications: Part B – migration studies, unpublished.
Daimon, H., and Hirata, Y., 1991, Directly coupled supercritical-fluid
extraction/capillary supercritical fluid chromatography of polymer additives.
Chromatographia, 32(11/12), 549-554.
Demertzis, P.G., Johansson, F., Lievens, C., and Franz, F., 1997, Studies on
the development of a quick inertness test procedure for multi-use PET
containers – Sorption behaviour of bottle wall strips. Packaging technology
and science, 10, 45-58.
Devlieghere F., De Meulenaer, B., Sekitoleko, P., Estrella Garcia, A.A., and
Huyghebaert, A., 1997, Evaluation, modelling and optimisation of the
cleaning process of contaminated plastic food refillables. Food Additives and
Contaminants, 14 (6-7), 671-683.
Devlieghere, F., De Meulenaer, B., Demyttenaere, J., and Huygherbaert, A.,
1998, Evaluation of recycled HDPE milk bottles for food applications. Food
Additives and Contaminants, 15 (3), 336-345.
274

Bibliography
Dong, M., DiEdwardo, A.H., and Zitomer, F., 1980, Determination of
residual acetaldehyde in polyethylene terephthalate bottles, preforms and
resins by automated headspace gas chromatography. Journal of
Chromatographic Science, 18, 242-246.
Dulio, V., Po, R., Borrelli, R., Guarini, A, Santini, C., 1995, Low-molecular-
weight oligomers in recycled PET. Die Angewandte Makromolekulare
Chemie, 225,109-122.
Eberhartinger, S., Steiner, I., Washuttl, J., and Kroyer, G., 1990,
Untersuchungen zur migration von acetaldehyd aus polyethylenterephthalat-
flaschen fur kohlensaurehaltige erfrischungsgetranke. Lebensmittel
Untersuchung Forschung, 191, 286-289.
Elmore, J.S., Mottram, D.S., and Hierro, E., 2000, Two-fibre solid phase
microextraction combined with gas chromatography-mass spectrometry for
the analysis of volatile aroma compounds in cooked pork. Journal of
Chromatography A, 905, 233-240.
Eskilsson, C.S., and Björklund, E., 2000, Analytical-scale microwave-
assisted extraction. Journal of Chromatography A, 902, 227-250.
Ezquerro, Ó., Pons, B., and Tena, M., T., 2002, Development of a headspace
solid-phase microextraction-gas chromatography-mass spectrometry method
for the identification of odour-causing volatile compounds in packaging
materials. Journal of Chromatography A, 963, 381-392.
Ezquerro, Ó., Pons, B., Tena, M., 2003, Direct quantitation of volatile
organic compounds in packaging materials by headspace solid-phase
microextraction-gas chromatography-mass spectrometry. Journal of
Chromatography A, 985, 247-257.
275

Bibliography
Fayoux, S.C., Seuvre, A.M., and Voilley, A.J., 1997, Aroma transfer in and
through plastic packaging: orange juice and d-limonene. A review. Part I:
Orange juice aroma sorption. Packaging Technology and Science, 10, 69-82.
FDA, 1992, Points to consider for the use of recycled plastics in food
packaging: Chemistry considerations, May 1992. US Food and Drug
Administration, Center for Food Safety and Applied Nutrition, (HFS-247),
Washington, DC.
FDA, 1995, Recommendations for chemistry data for indirect food additive
petitions. US Food and Drug Administration, Center for Food Safety and
Applied Nutrition, Washington, DC.
Feigenbaum, A.E., Ducruet, V.J., Depal, S., and Wolff, N., 1991, Food and
Packaging Interactions: Penetration of fatty food simulants into rigid
poly(vinyl chloride). Journal of Agricultural Food Chemistry, 39, 1927-
1932.
Feigenbaum, A., Riquet, A., and Ducruet, V., 1993, Safety and quality of
foodstuffs in contact with plastic materials. Journal of Chemical Education,
70 (11), 883-886.
Feigenbaum, A., Scholler, D., Bouquant, J., Brigot, G., Ferrier, D., Franz, R.,
Lillemark, L., Riquet, A.M., Petersen, J.H., Van Lierop, B., and Yagoubi,
N., 2002, Safety and quality if food contact materials. Part I: Evaluation of
analytical strategies to introduce migration testing into good manufacturing
practice. Food Additives and Contaminants, 19 (2), 184-201.
Feron, V.J., Jetton, J., De Kruijf, N., and Van Den Berg, F., 1994,
Polyethylene terephthalate bottles (PRBs): a health and safety assessment.
Food Additives and Contaminants, 11 (5), 571-594.
Fordham, P.J., Gramshaw, J.W., Crews, H.M., and Castle, L., 1995, Element
residues in food contact plastics and their migration into food simulants,
276

Bibliography
measured by inductively-coupled plasma-mass spectrometry. Food Additives
and Contaminants, 12 (5), 651-669.
Fortin, J.B., and Lu, T.M., 2001, Ultraviolet radiation induced degradation of
poly-para-xylene (parylene) thin films. Thin Solid Films, 397 (1-2), 223-228.
Franz, R., Demertzis, P. G., Johansson, F., Lievens, C., 1997, Studies on the
development of a quick inertness test procedure for multi-use PET
containers – sorption behaviour of bottle wall strips. Packaging Technology
and Science, 10, 45-58.
Franz, R., and Huber, M., 1997, Identification of migratable substances in
recycled high-density polyethylene collected from household waste. Journal
of High Resolution Chromatography, 20, 427-430.
Franz, R., Huber, M., and Welle, F., 1998, Recycling of post-consumer
poly(ethylene terephthalate) for direct food contact application – a feasibility
study using a simplified challenge test. Deutsche Lebensmittel-Rundschau,
94 (9), 303-308.
Franz, R., and Welle, F., 1999a, Post-consumer poly(ethylene terephthalate)
for direct food contact applications – final proof of food law compliance.
Deutsche Lebensmittel-Rundschau, 95 (10), 424-427.
Franz, R., and Welle, F., 1999b, Analytisches screening und bewertung von
marküblichen postconsumer-PET-recyclaten für die erneute anwendung in
lebensmittel/verpackungen. Deutsche Lebensmittel-Rundschau, 95 (3), 94-
100.
Franz, R., and Welle, F., 2002, Recycled poly(ethylene terephthalate) for
direct food contact applications: challenge test of an inline recycling process.
Food Additives and Contaminants, 19 (5), 502-511.
277

Bibliography
Freire, A., Castle, L., Reyes, F.G.R., and Damant, A.P., 1998, Thermal
stability of polyethylene terephthalate food contact materials: formulation of
volatiles from retail samples and implications for recycling. Food Additives
and Contaminants, 15 (4), 473-480.
Garde, J.A., Catalá, R., and Gavara, R., 1998, Analysis of antioxidants
extracted from polypropylene by supercritical fluid extraction. Food
Additives and Contaminants, 15 (6), 701-708.
Gavara, R., Catalá, R., and Hernández-Muñoz, P., 1997, Study of aroma
scalping through thermosealable polymers used in food packaging by inverse
chromatography. Food Additives and Contaminants, 14 (6-7), 609-616.
Goodman, I., and Nesbitt, B.F., 1960, The structures and reversible
polymerisation of cyclic oligomers from poly(ethylene terephthalate).
Journal of Polymer Science, XLVIII, 423-433.
Goydan, R., Schwope, A.D., Reid, R.C., Cramer, G., 1990, High-
temperature migration of antioxidants from polyolefins. Food Additives and
Contaminants, 7 (3), 323-337.
Gramshaw, J.W., Vandenburg, H.J., and Lakin, R.A, 1995, Identification of
potential migrants from sample of dual-ovenable plastics. Food Additives
and Contaminants, 12 (2), 211-222.
Hakkarainen, M., Albertsson, A., and Karlsson, S., 1997, Solid phase
microextraction (SPME) as an effective means to isolate degradation
products in polymers. Journal of Environmental Polymer Degradation, 5
(2), 67-73.
Hamdani, M., and Feigenbaum, A., 1996, Migration from plasticized
poly(vinyl chloride) into fatty media: importance of simulant selectivity for
the choice of volatile fatty simulants. Food Additives and Contaminants, 13
(6), 717-730.
278

Bibliography
Hamdani, M., Feigenbaum, A., and Vergnaud, J.M., 1997, Prediction of
worst-case migration from packaging to food using mathematical models.
Food Additives and Contaminants, 14 (5), 499-506.
Harding, I.H., Cross, R.F., Cass, P.J., Mudumba, R., and Kosior, E., 2001,
Evaluation of a new poly(ethylene terephthalate) recycling process for food
contact applications: Part A – decontamination efficiency, Submitted to
Food Additives and Contaminants, Unpublished.
Hernandez-Munoz, P., Catala, R., and Gavara, R., 2001, Food aroma
partition between packaging materials and fatty food simulants. Food
Additives and Contaminants, 18 (7), 673-682.
Huber, M., and Franz, R., 1997a, Identification of migratable substances in
recycled high density polyethylene collected from household waste. Journal
of High Resolution Chromatography, 20, 427-430.
Huber, M., and Franz, R., 1997b, Studies on contamination of post-consumer
plastics from controlled resources for recycling into food packaging
applications. Deutsche Lebensmittel-Rundschau, 93, 10, 328-331.
Hudgins, W.R., Theurer, K., and Mariani, T., 1978, Journal of Applied
Polymers Science: Applied Polymer Symposium, 34, 145-155.
Hunt, T.P., and Dowle, C.J., 1991, Analysis of poly(vinyl chloride) additives
by supercritical fluid extraction and supercritical fluid chromatography.
Analyst, 116, 1299-1304.
Huynh, C.K., and Vu-Duc, T., 1998, Un procédé automatique de
determination de l’acétaldéhyde dans l’eau minérale en bouteilles PET par
CPG et micro-extraction en phase solide dans l’espace de tête. Travoux de
Chimie alimentaire et d’hygiene, 89, 705-714.
279

Bibliography
Ikegami, T., Nagashima, K., Shimoda, M., Tanaka, Y., and Osajima, Y.,
1991, Sorption of volatile compounds in aqueous solution by ethylene-vinyl
alcohol copolymer films. Journal of Food Science, 56 (2), 500-503.
Imai, T., Harte, B.R., and Giaicin, J.R., 1990, Partition distribution of aroma
volatiles from orange juice into selected polymeric sealant films. Journal of
food science, 55 (1), 158-161.
Jameel, H., Waldman, J., and Rebenfield, L., 1981, The effects of orientation
and crystallinity on the solvent induced crystallisation of poly(ethylene
terephthalate). I. Sorption and diffusion-related phenomena. Journal of
Applied Polymer Science, 26, 1795-1811.
Jetten, J., de Kruijf, N., and Castle, C., 1999, Quality and safety aspects of
reusable plastic food packaging materials: A European study to underpin
future legislation. Food Additives and Contaminants, 16 (1), 25-36.
Jia, M.Y., Koziel, J., and Pawliszyn, J., 2000, Fast field sampling/sample
preparation and quantification of volatile organic compounds in indoor air
by solid-phase microextraction and portable gas chromatography. Field
Analytical Chemistry and Technology, 2-3, 73-84.
Kashtock, M., and Breder, C.V., 1980, Migration of ethylene glycol from
polyethylene terephthalate bottles into 3% acetic acid. Journal of the
association of official analytical chemists, 63 (2), 168-172.
Khabbaz, F., Albertsson, A.-C., and Karlsson, S., 1998, Trapping of volatile
low molecular weight photoproducts in inert and enhanced degradable
LDPE. Polymer Degradation and Stability, 61, 329-342.
Kim, H., Gilbert, S.G., And Johnson, J.B., 1990, Determination of potential
migrants from commercial amber polyethylene terephthalate bottle wall.
Pharmaceutical Research, 7 (2), 176-179.
280

Bibliography
Kolb, B., Pospisil, P., and Auer, M., 1981, Quantitative analysis of residual
solvents in food packaging printed films by capillary gas chromatography
with multiple headspace extraction. Journal of Chromatography. 204, 371-
376.
Komolprasert, V., Hargraves, W.A., and Armstrong, D.J., 1994,
Determination of benzene residues in recycled PETE by dynamic headspace-
gas chromatography. Food Additives and Contaminants, 11 (5), 605-614.
Komolprasert, V., and Lawson, A.R., 1995, Residual contaminants in recycled
poly(ethylene terephthalate)-Effects of washing and drying. Plastics,
Rubber, and Paper: A Pragmatic Approach, edited by C.P. Rader, S.D.
Baldwin, D.D. Cornell, G.D. Sadler and R.F. Stockel, ACS Symposium
Series 609 (Washington, DC: ACS), pp. 435-444.
Komolprasert, V., and Lawson, A.R., 1997, Considerations for reuse of PET
bottles in food packaging: migration study. Journal of Agricultural and
Food Chemistry, 45, 444-448.
Komolprasert, V., Lawson, A.R., and Begley, T.H., 1997, Migration of
residual contaminants from secondary recycled poly(ethylene terephthalate)
into food-simulating solvents, aqueous, ethanol, and heptane. Food
Additives and Contaminants, 14 (5), 491-498.
Komolprasert, V., McNeal, T.P., Agrawal, A., Adhikari, C., and Thayer,
D.W., 2001, Volatile and non-volatile compounds in irradiate semi-rigid
crystalline poly(ethylene terephthalate). Food Additives and Contaminants,
18 (1), 89-101.
Konczal, J.B., Harte, B.R., Hoojjat, P., and Giacin, J.R., 1992, Apple juice
flavour compound sorption by sealant films. Journal of Food Science, 57
(4), 967-966 and 972.
281

Bibliography
Kosmidis, V.A., Achilias, D.S., and Karayannidis, G.P., 2001, Poly(ethylene
terephthalate) recycling and recovery of pure terephthalic acid. Kinetics of a
phase transfer catalised alkaline hydrolysis. Macromolecular Material
Engineering, 286, 640-647.
Kuznesof, P.M., and Van Derveer, M.C., 1995, Recycled plastics for food-
contact applications. Plastics, Rubber, and Paper Recycling: a Pragmatic
Approach, edited by C.P. Rader, S.D. Baldwin, D.D. Cornell, G.D. Sadler
and R.E. Stockel. AcS Symposium Series No, 609 (Washington, DC:
American Chemical Society), pp. 389-403.
Kwapong, O.Y., and Hotchkiss, J.H., 1987, Comparative sorption of aroma
compounds by polyethylene and ionomer food-contact plastics. Journal of
food science, 52 (3), 761-763, 785.
Lau, O., and Wong, S., 1994, Naphthalene contamination of sterilised milk
drinks contained in low-density polyethylene bottles. Part 1. Analyst, 119,
1037-1042.
Lau, O., and Wong, S., 1995, Naphthalene contamination of sterilised milk
drinks contained in low-density polyethylene bottles. Part 2. Effect of
naphthalene vapour in air. Analyst, 120, 1125-1129.
Lau, O.-W., and Wong, S.-K., 2000, Contamination in food from packaging
material. Journal of Chromatography A, 882, 255-270.
Lickly, T.D., Bell, C.D., and Lehr, K.M., 1990, The migration of Irganox
1010 antioxidant from high-density polyethylene and polypropylene into a
series of potential fatty-food simulants. Food Additives and Contaminants, 7
(6), 805-814.
Limm, W., and Hollifield, H. C., 1996, Modelling of additive diffusion in
polyolefins. Food Additives and Contaminants, 13 (8), 949-967.
282

Bibliography
Liu, C.-P.A., and Neogi, P.,1992, Sorption of methylene chloride in
semicrystalline polyethylene terephthalate. Journal of Macromolecular
Science – Physics, B31 (3), 265-279.
Llompart, M., Li, K., and Fingas, M., 1999, Headspace solid-phase
microextraction for the determination of polychlorinated biphenyls in soils
and sediments. Journal of Microcolumn Separations, 11 (6), 397-402.
Lorusso, S., Gramiccioni, L., Di Marzio, S., Milana, M.R., Di Prospero, P.,
and Papetta, A., 1985, Acetaldehyde migration from poly(ethylene
terephthalate) (PET) containers. GC determination and toxicological
assessment. Annali di Chimica, 75, 403-414.
Lou, X., Janssen, H., and Cramers, C.A., 1996, Effects of modifier addition
and temperature variation in SFE of polymeric materials. Journal of
Chromatographic Science, 34, 282-290.
Lou, X., Janssen, H., and Cramers, C.A., 1997, Parameters affecting the
accelerated solvent extraction of polymeric samples. Analytical Chemistry,
69 (8), 1598-1603.
Mannheim, C.H., Miltz, J., and Letzter, A., 1987, Interaction between
polyethylene laminated cartons and aseptically packed citrus juices. Journal
of Food Science, 52 (3), 737-740.
McDowell, C.C., Freeman, B.D., McNeely, G.W., Haider, M.I., and Hill
A.J., 1998, Synthesis, physical characterization, and acetone sorption
kinetics in random copolymers of poly(ethylene terephthalate) and
poly(ethylene 2,6-naphthalate). Journal of Polymer Science, Polymer
Physics Ed., 36 (16), 2981-3000.
McEvoy, J.P., Armstrong, C.G., and Crawford, R.J., 1998, Simulation of the
stretch blow molding process of PET bottles. Advances in Polymer
Technology, 17 (4), 339-352.
283

Bibliography
Mc Neal, T.P, and Hollifield, T.C., 1993, Determination of volatile
chemicals released from microwave-heat-susceptor food packaging. Journal
of AOAC International, 76 (6), 1268-1275.
Miltz, J., Ram, A., and Nir, M.M., 1997, Prospects for application of post-
consumer used plastics in food packaging. Food Additives and
Contaminants, 14 (6-7), 649-659.
Miltz, J., 1998, Approaches to deal with the issue of plastic packages and the
environmental. Macromolecular Symposium, 135, 265-275.
Monarca, S., Fusco, R., Biscardi, D., Feo, V., Pasquini, R., Fatigoni, C.,
Moretti, M., and Zanardini, A., 1997, Studies of migration of potentially
genotoxic compounds into water stored in PET bottles. Food Chemistry and
Toxicology, 783-788.
Monteiro, M., Nerin, C., and Reyes, F.G.R., 1996, Determination of UV
stabilizers in PET bottles by high performance-size exclusion
chromatography. Food Additives and Contaminants, 13 (5), 575-586.
Monteiro, M., Nerin, C., Rubio, C., and Reyes, F.G.R., 1998, A GC/MS
method for determining UV stabilizers in polyethyleneterephthalate bottles.
Journal of High Resolution Chromatography, 21, May, 317-320.
Moore, W.R., and Sheldon, R.P., 1961, The crystallisation of polyethylene
terephthalate by organic liquids. Polymer, 2, 315-321.
Morelli-Cardoso, M.H.W., Tabak, D., Cardoso, J.N., Pereira, A.S., 1997,
Application of capillary gas chromatography to the determination of
ethylene glycol migration from PET bottles in Brazil. Journal of High
Resolution Chromatography, 20, March, 183-185.
284

Bibliography
Munteanu, D., Isfan, A., Isfan, C., Tincul, I., 1987, "High-performance
liquid chromatographic separation of polyolefin antioxidants and light-
stabilisers", Chromatographia, 23 (1), 7-14.
Murray, R. A., 2001, Limitations to the use of solid-phase microextraction
for quantitation of mixtures of volatile organic sulfur compounds. Analytical
Chemistry. 73 (7), 1646-1649.
Nerín, C., Salafranca, J., Rubio, C., and Cacho, J., 1994, Separation of
polymer and on-line determination of several antioxidants and UV-
stabilizers by coupling size-exclusion and normal-phase high-performance
liquid chromatography columns. Journal of Chromatography A, 690, 230-
236.
Nerín, C., Salafranca, J., Rubio, C., and Cacho, J., 1998a, Multicomponent
recycled plastics: considerations about their use in food contact applications.
Food Additives and Contaminants, 15 (7), 842-854.
Nerín, C., Tornes, A.R., Batlle, R., and Cacho, J., 1998b, Pesticides in
recycled plastics. A new environmental challenge. Quimica Analitica, 17
(4), 177-184.
Nerín, C., Asensio, E., Fernández, C., Batlle, R., 2000, Supercritical fluid
extraction of additives and degradation products from both virgin and
recycled PET. Química Analítica, 19, 205-212.
Nerín, C., Phio, M.R., Salafranca, J., and Castle, L., 2002, SPME-HPLC as a
tool for the determination of migrants from food packaging materials in
aqueous food simulants and real food. Journal of Chromatography A, 963
(1-2), 375-380.
Nerin, C., Albinana, J., Philo, M.R., Castle, L., Raffael, B., and Simoneau,
S., 2003a, Evaluation of some screening methods for the analysis of
285

Bibliography
contaminants in recycled polyethylene terephthalate flakes. Food Additives
and Contaminants, 20 (7), 668-677.
Nerin, C., Fernandez, C., Domeno, C., Salafranca, J., 2003b, Determination
of potential migrants in polycarbonate containers used for microwave ovens
by high-performance liquid chromatography with ultraviolet and
fluorescence detection. Journal of Agricultural and food chemistry, 51,
5647-5653.
Nicholson, J.W., 1991, The chemistry of Polymers, The Royal Society of
Chemistry, Cambridge, pp75-89.
Nielsen, T.J., 1991, Extraction and quantitation of polyolefin additives.
Journal of Liquid Chromatography, 14 (3), 503-519.
Nielsen, T.J., Margaretha Jägerstad, I., Öste, R.E., and Sivik, B.T.G., 1991,
Supercritical fluid extraction coupled with gas chromatography for the
analysis of aroma compounds absorbed by low-density polyethylene.
Journal of Agricultural Chemistry, 39, 1234-1237.
Nielsen, T.J., Margaretha Jägerstad, I., Öste, R.E., and Wesslen, B.O., 1992,
Comparative absorption of low molecular aroma compounds into commonly
used food packaging polymer films. Journal of Food Science, 57 (2), 490-
492.
Nielsen, T.J., 1994, Limonene and Myrcene sorption into refillable
polyethylene terephthalate bottles and washing effects on removal of sorbed
compounds. Journal of Food Science, 59 (1), 227-230.
Nielson, T.J., Damant, A.P., and Castle, L., 1997, Validation studies of a
quick test for predicting the sorption and washing properties of refillable
plastic bottles. Food Additives and Contaminants, 14 (6-7), 685-693.
286

Bibliography
Nir, M.M., Ram, A., and Miltz, J., 1996, Sorption and migration of organic
liquids in poly(ethylene terephthalate). Polymer engineering and science, 36
(6), 862-868.
Ouyang, H., Chen, C., Sanboh, L., and Yang, H., 1998, Acetone transport in
poly(ethylne terephthalate) and related phenomena. Journal of Polymer
Science: Part B: Polymer Physics, 36, 163-169.
Paik, J.S., 1992, Comparison of sorption in orange flavour components by
packaging films using the headspace technique. Journal of Agricultural
Food Chemistry, 40, 1822-1825.
Patton,C., J., Felder, R.M., and Koros, W.J., 1984, Sorption and transport of
benzene in poly(ethylene terephthalate). Journal of Applied Polymer
Science, 29, 1095-1110.
Peebles, L.H., Huffman, M.W., and Ablett, C.T., 1969, Isolation and
identification of the linear and cyclic oligomers of poly(ethylene
teephthalate) and the mechanism of cyclic oligomer formation. Journal of
Polymer Science, Part A-1, 7, 479-496.
Penton, Z., SPME Application Note Number 17, Varian, Walnut-Creek,
USA, 1999, Determination of residual solvents and monomers in polymers
with solid phase microextraction (SPME) and GC/MS.
Pérès, C., Viallon, c., and Berdagué, J.-L., 2001, Solid-phase
microextraction-mass spectrometry: A new approach to the rapid
characterisation of cheeses. Analytical Chemistry. 73, 1030-1036.
Perlstein, P., 1983, The determination of light stabilisers in plastics by high
performance liquid chromatography. Analytica Chimica Acta, 21-27.
287

Bibliography
Pochivalov, K.V., Pronin, A.M., Mizerovskii, L.N., and Kozlov, S.N., 2000,
Effect of ultrasound on the kinetics of extraction of the polymer component
from a porous composite material. Fibre Chemistry, 32 (4), 298-302.
Pó, R., Occhiello, E., Giannotta, G., Pelosini, L., and Abis, L., 1995, New
polymeric materials for containers manufacture based on PET/PEN
copolyesters and blends. Polymers for Advanced Technologies, 7, 365-373.
Reynier, A., Dole, P., and Feigenbaum, A., 2001, Additive diffusion
coefficients in polyolefins II. Effect of swelling and temperature on the
D=f(M) correlation. Journal of Applied polymer Science, 82, 2434-2443.
Riquet, A.M., Sandray, V., Akermann, O., and, Feigenbaum, A., 1991, ESR
study of the evolution of rigid PVC: Influence of heat and contact with fatty
or aqueous simulating liquids. Sciences Des Aliments, 11, 341-359.
Riquet, A.M., and Feigenbaum, A., 1997, Food and packaging interactions:
tailoring fatty food simulants. Food Additives and Contaminants, 14 (1), 53-
63.
Sadler, G., and Braddock, R.J., 1991, Absorption of citrus flavour volatiles
by low-density polyethylene. Journal of Food Science, 56 (1), 35-37.
Sadler, G., Pierce, D., Lawson, A., Suvannunt, D., and Senthil, V., 1996,
Evaluating organic compound migration in poly(ethylene terephthalate): a
simple test with implications for polymer recycling. Food Additives and
Contaminants, 13 (8), 979-989.
Salafranca , J., Cacho, J., and Nerin C., 1999, Considerations about the
supercritical fluid extraction (SFE) feasibility on the determination of
antioxidants and UV-stabilizers in virgin and recycled polyolefins. Journal
of High Resolution Chromatography, 22 (10), 553-558.
288

Bibliography
Sauvant, M.P., Pepin, D., and Bohatier, J., 1995, Chemical and in vitro
toxicological evaluations of water packaged in polyvinyl chloride and
polyethylene terephthalate bottles. Food Additives and Contaminants, 12 (4),
567-584.
Scheirs, J., 1998, Polymer Recycling, John Wiley and Sons Ltd., West
Sussex, England, pp. 121-182.
Schumann, H.-D., and Thiele, U.K., 1996, Polyester producing plants:
Principals and technology. Verlag moderne industrie, 5-61.
Semenov, S. N., Koziel, J.A., and Pawliszyn, J., 2000, Kinetics of solid-
phase extraction and solid-phase microextraction in thin adsorption layer
with saturation sorption isotherm. Journal of Chromatography A. 873, 39-
51.
Shimoda, M., Ikegami, T., and Yutaka, O., 1988, Sorption of flavour
compounds in aqueous solution into polyethylene film. Journal of Food and
Agriculture, 42, 157-163.
Shiono, S., 1979, Determination of poly(ethylene terephthalate) oligomers in
refrigeration oils by absorption column chromatography-gel permeation
chromatography. Analytical Chemistry, 51 (14), December 1979.
Shirey, R.E., 2000, Optimisation of extraction conditions for low-molecular-
weight analytes using solid phase microextraction. Journal of
Chromatographic Science. 38, 109-116.
Snyder, R., C., and Breder, C., V., 1985, New FDA migration cell used to
study migration of styrene from polystyrene into various solvents. Journal of
the Association of Official Analytical Chemistry, 68 (4), 1985.
289

Bibliography
Spell, H.L., and Eddy, R.D., 1960, Determination of additives in
polyethylene by absorption spectroscopy. Analytical Chemistry, 32 (13),
1811-1814.
Startin, J.R., Parker, I., Sharman, M., and Gilbert, J., 1987, Analysis of di-(2-
ethylhexyl)adipate plasticiser in foods by stable isotope dilution gas
chromatography-mass spectrometry. Journal of Chromatography, 387, 509-
514.
St. Küppers, 1992, The use of temperature variation in supercritical fluid
extraction of polymers for the selective extraction of low molecular weight
components from poly(ethylene terephthalate). Chromatographia, 33
(9/10), 434-440.
Tavss E.A., Santalucia, J., Robinson, R.S., and Carroll, D.L., 1988, Analysis
of flavour absorption into plastic packaging materials using multiple
headspace extraction gas chromatography. Journal of Chromatography, 438,
281-289.
Tawfik M.S., Devlieghere, F., and Huyghebaert, A., 1998, Influence of D-
limonene absorption on the physical properties of refillable PET. Food
Chemistry, 61 (12), 157-162.
Tawfik, M.S., and Huyghebaert, A., 1988, Polystyrene cups and containers:
styrene migration. Food Additives and Contaminants, 15 (5), 592-599.
Tice, P.A., and McGuinness, J.D., 1987, Migration from food contact
plastics. Part I. Establishment and aims of the PIRA project. Food Additives
and Contaminants, 4 (3), 267-276.
Tombesi, N.B., and Hugo, F., 2002, Application of solid-phase
microextraction combined with gas chromatography-mass spectroscopy to
the determination of butylated hydroxytoluene in bottled drinking water.
Journal of Chromatography. 963, 179-183.
290

Bibliography
Tuduri, L., Desauziers, V., and Franlo, J. L., 2001, Potential of solid-phase
microextraction fibres for the analysis of volatile organic compounds in air.
Journal of Chromatographic Science. 39, 521-529.
Triantafyllou, V.I., Karamani, A.G., Akrida-Demertzi, K., and Demertzis,
P.G., 2002, Studies on the usability of recycled PET for food packaging
applications. European Food Research Technology, 215, 243-248.
Ulrich, K.T.,1993, Introduction to industrial polymers, 2nd ed., Munich ;
New York: Hanser Publishers.
US EPA METHOD 8000B, 1996, revision 2. Determinative Chromatographic
Separations, section 7.5.2, Washington, DC, p.21.
Valor, I., Pérez, M., Cortada, C., Apraiz, D., Moltó, J.C., and Font, G., 2001,
SPME of 52 pesticides and polychlorinated biphenyls: Extraction
efficiencies of the SPME coatings poly(dimethylsiloxane), polyacrylate,
poly(dimethylsiloxane)-divinylbenzene, carboxen-poly(dimethylsiloxane),
and carbowax-divinylbenzene. Journal of Separation Science. 24, 39-48.
Vandenburg, H.J., Clifford, A.A., Bartle, K.D., Carroll, J., Newton, I.,
Garden, L.M., Dean, J.R., and Costley, C.T., 1997, Analytical extraction of
additives from polymers. Analyst, 122 (101R-115R).
Vandenburg, H.J., Clifford, A.A., Bartle, K.D., Carlson, R.E., Carroll, J., and
Newton, I.D., 1999, A simple solvent selection method for accelerated
solvent extraction of additives from polymers. Analyst, 124, 1707-1710.
Van Lierop, J.B.H., 1997, Enforcement of food packaging legislation. Food
Additives and Contaminants, 14 (6-7), 555-560.
Van Willige, R.W.G., Lissen, J.P.H., Meinders, M.B.J., Van Der Stege, H.J.,
and Voragenn, A.G.J., 2002, Influence of flavour absorption on oxygen
291

Bibliography
permeation through LDPE, PP, PC and PET plastics food packaging. Food
Additives and Contaminants,19 (3), 303-313.
Vijayalakshmi, N.S, Baldev, R., Ravi, P., and Mahadeviah, M.,1999, Effect
of time and temperature on the overall migration of additives from plastics
into food simulants. Deutsche Lebensmittel-Rundschau, 1, 22-25.
Villberg, K., and Veijanen, A., 2001, Analysis of a GC/MS thermal
desorption system with simultaneous sniffing for determination of off-odour
compounds and VOCs in fumes formed during extrusion coating of low-
density polyethylene. Analytical Chemistry. 73 (5), 971-977.
Weast, R.C., and Melvin, J.A., 1979, CRC Handbook of Chemistry and
Physics, The Chemical Rubber Company, C732-735.
Wim, A.M., and Swarin, S.J., 1975, Determination of antioxidants in
polypropylene by liquid chromatography. Journal of Applied Polymer
Science, 19, 1243-1256.
Wyatt, D.M., 1983, Semi-automation of headspace GC as Applied to
determination of acetaldehyde in polyethylene terephthalate beverage
bottles. Journal of Chromatographic Science, 21, November.
292


