arXiv:1510.07448v1 [astro-ph.SR] 26 Oct 2015 MNRAS 000, 000–000 (0000) Preprint 19 August 2018 Compiled using MNRAS L A T E X style file v3.0 Continuous ‘stunted’ outbursts detected from the Cataclysmic Variable KIC 9202990 using Kepler data Gavin Ramsay 1 , Pasi Hakala 2 , Matt A. Wood 3 , Steve B. Howell 4 Alan Smale 5 , Martin Still 4,6 , Thomas Barclay 4,6 1 Armagh Observatory, College Hill, Armagh, BT61 9DG, UK 2 Finnish Centre for Astronomy with ESO (FINCA), University of Turku, V¨ais¨ al¨antie 20, FI-21500 PIIKKI ¨ O, Finland 3 Department of Physics and Astronomy, Texas A&M University-Commerce, Commerce, TX 75429-3011, USA 4 NASA Ames Research Center, Moffett Field, CA 94095, USA 5 NASA/Goddard Space Flight Center, Greenbelt, MD 20771, USA 6 Bay Area Environmental Research Institute, Inc., 560 Third St. West, Sonoma, CA 95476, USA Accepted 2015 October 26. Received 2015 October 24; in original form 2015 August 1 ABSTRACT Based on early Kepler data, Østensen et al. (2010) found that KIC 9202990 showed a 4 hr and a two-week photometric period. They suggested the 4 hr period was a signature of an orbital period; the longer period was possibly due to precession of an accretion disk and KIC 9202990 was a cataclysmic variable with an accretion disk which is always in a bright state (a nova-like system). Using the full Kepler dataset on KIC 9202990 which covers 1421 d (Quarter 2–17), and includes 1 min cadence data from the whole of Quarters 5 and 16, we find that the 4 hr period is stable and therefore a signature of the binary orbital period. In contrast, the 10–12 d period is not stable and shows an amplitude between 20–50 percent. This longer period modulation is similar to those nova-like systems which show ‘stunted’ outbursts. We discuss the problems that a precessing disk model has in explaining the observed characteristics and indicate why we favour a stunted outburst model. Although such stunted events are considered to be related to the standard disk instability mechanism, their origin is not well understood. KIC 9202990 shows the lowest amplitude and shortest period of continuous stunted outburst systems, making it an ideal target to better understand stunted outbursts and accretion instabilities in general. Key words: Stars: individual: KIC 9202990: Stars: binaries – Physical data and processes: accretion and accretion discs – instabilites 1 INTRODUCTION The Kepler satellite observed the same 115 square degree field of view, just north of the Galactic plane in Cygnus and Lyra, between April 2009 and May 2013. It allowed virtually uninterrupted photometry of more than 150,000 stars with 30 min cadence and 512 stars with 1 min cadence at any one time. Although the prime goal of the Kepler mission was to discover Earth-sized planets orbiting the host stars habitable zone (e.g. Borucki, et al. 2013), it has led to a revolution in the field of asterseismology across the HR diagram (e.g. Chaplin et al. 2014). Kepler has also provided a unique opportunity to study accreting sources such as cataclysmic variables (CVs) which show flux variations over timescales ranging from seconds to years or even decades. Early observations such as those of V344 Lyr (Still et al. 2010) showed the potential of Kepler to address key questions regarding the nature of the outbursts seen in CVs. CVs contain a white dwarf which is accreting material through Roche Lobe overflow from a late-type star. The observed characteristics of the system is largely set by the binary orbital period and the strength of the magnetic field of the white dwarf. Kepler has observed dozens of CVs, some of which were known prior to its launch (see Howell, et al. 2013), while others were discovered purely by chance (e.g. Barclay et al. 2012, Brown et al. 2015). Very early in the mission, Østensen et al. (2010) pre- sented initial results of Kepler observations of a sample of known or suspected compact pulsators. One of these sources, KIC 9202990, showed a strong modulation on a timescale of two weeks together with a second much shorter period (∼4 hrs) superimposed. They presented an optical spectrum which showed Balmer lines in absorption but filled in with emission and appeared to be disc-dominated and similar to c 0000 The Authors
Transcript
arX
iv:1
510.
0744
8v1
[as
tro-
ph.S
R]
26
Oct
201
5
MNRAS 000, 000–000 (0000) Preprint 19 August 2018 Compiled using MNRAS LATEX style file v3.0
Continuous ‘stunted’ outbursts detected from the
Cataclysmic Variable KIC 9202990 using Kepler data
Gavin Ramsay1, Pasi Hakala2, Matt A. Wood3, Steve B. Howell4 Alan Smale5,
Martin Still4,6, Thomas Barclay4,61Armagh Observatory, College Hill, Armagh, BT61 9DG, UK2Finnish Centre for Astronomy with ESO (FINCA), University of Turku, Vaisalantie 20, FI-21500 PIIKKIO, Finland3Department of Physics and Astronomy, Texas A&M University-Commerce, Commerce, TX 75429-3011, USA4NASA Ames Research Center, Moffett Field, CA 94095, USA5NASA/Goddard Space Flight Center, Greenbelt, MD 20771, USA6Bay Area Environmental Research Institute, Inc., 560 Third St. West, Sonoma, CA 95476, USA
Accepted 2015 October 26. Received 2015 October 24; in original form 2015 August 1
ABSTRACT
Based on early Kepler data, Østensen et al. (2010) found that KIC 9202990 showeda 4 hr and a two-week photometric period. They suggested the 4 hr period was asignature of an orbital period; the longer period was possibly due to precession of anaccretion disk and KIC 9202990 was a cataclysmic variable with an accretion diskwhich is always in a bright state (a nova-like system). Using the full Kepler dataseton KIC 9202990 which covers 1421 d (Quarter 2–17), and includes 1 min cadencedata from the whole of Quarters 5 and 16, we find that the 4 hr period is stable andtherefore a signature of the binary orbital period. In contrast, the 10–12 d period is notstable and shows an amplitude between 20–50 percent. This longer period modulationis similar to those nova-like systems which show ‘stunted’ outbursts. We discuss theproblems that a precessing disk model has in explaining the observed characteristicsand indicate why we favour a stunted outburst model. Although such stunted eventsare considered to be related to the standard disk instability mechanism, their origin isnot well understood. KIC 9202990 shows the lowest amplitude and shortest period ofcontinuous stunted outburst systems, making it an ideal target to better understandstunted outbursts and accretion instabilities in general.
Key words: Stars: individual: KIC 9202990: Stars: binaries – Physical data andprocesses: accretion and accretion discs – instabilites
1 INTRODUCTION
The Kepler satellite observed the same 115 square degreefield of view, just north of the Galactic plane in Cygnus andLyra, between April 2009 and May 2013. It allowed virtuallyuninterrupted photometry of more than 150,000 stars with30 min cadence and 512 stars with 1 min cadence at any onetime. Although the prime goal of the Kepler mission was todiscover Earth-sized planets orbiting the host stars habitablezone (e.g. Borucki, et al. 2013), it has led to a revolutionin the field of asterseismology across the HR diagram (e.g.Chaplin et al. 2014).
Kepler has also provided a unique opportunity to studyaccreting sources such as cataclysmic variables (CVs) whichshow flux variations over timescales ranging from seconds toyears or even decades. Early observations such as those ofV344 Lyr (Still et al. 2010) showed the potential of Kepler to
address key questions regarding the nature of the outburstsseen in CVs. CVs contain a white dwarf which is accretingmaterial through Roche Lobe overflow from a late-type star.The observed characteristics of the system is largely set bythe binary orbital period and the strength of the magneticfield of the white dwarf. Kepler has observed dozens of CVs,some of which were known prior to its launch (see Howell,et al. 2013), while others were discovered purely by chance(e.g. Barclay et al. 2012, Brown et al. 2015).
Very early in the mission, Østensen et al. (2010) pre-sented initial results of Kepler observations of a sample ofknown or suspected compact pulsators. One of these sources,KIC 9202990, showed a strong modulation on a timescaleof two weeks together with a second much shorter period(∼4 hrs) superimposed. They presented an optical spectrumwhich showed Balmer lines in absorption but filled in withemission and appeared to be disc-dominated and similar to
Figure 1. As an example of the flux variations of KIC 9202990on a timescale of tens of days, we show a light curve covering200 d (MJD 55872–56072, 2011 Nov 07 – 2012 May 25). Note theprescence of two prominent dips at 45 d and 168 d from the start.
nova-like CVs. Østensen et al. (2010) suggested the 4 hr pe-riod represented the binary orbital period which would betypical of nova-like CVs which lie predominately above the2–3 h period gap (see Gansicke et al 2009 for an overviewof the orbital period distribution of CVs) and has a highmass transfer rate and an accretion disc in a bright, steadystate (see Dhillon 1996 for a review of nova-like CVs andalso Aungwerojwit et al. 2005). They suggested that the 4hr period was the orbital period and the longer period wasdue to a precessing disc. McNamara, Jackiewicz & McK-eever (2012) noted it was a possible pulsating B star basedon an analysis of the light curve.
With the Kepler mission now having ended as it wasfirst envisaged, we have taken all the Kepler data on KIC9202990 and set out to determine if the nova-like CV desig-nation can be supported by the much more extensive datasetthan was available to Østensen et al. (2010).
2 KIC 9202990
KIC 9202990 has a position α = 18h56m08.1s δ =+45◦37
′
40.1′′
J2000.0 (taken from the Kepler Input Cat-alog). It was not detected in the ROSAT All-Sky Survey,but does not appear to have been in the field of any pointedXMM-Newton or Chandra observations. It was observed inthe Kepler INT Survey (KIS, Greiss et al. 2012a,b) whichobtained UgriHα photometry of the majority of sourcesin the Kepler field. The mean photometry and colours ofKIC 9202990 are g=15.39±0.04, U − g=–0.62, g − r=0.12,r − i=0.15 and r−Hα=0.23. The latter colour index is con-sistent with Hα in absorption. The UBV Survey of the Ke-
pler field (Everett, Howell & Kinemuchi 2012) also indicatea very blue source: B − V=0.09, U − B = −0.70. Thesecolours are consistent with other CVs. KIC 9202990 hasalso been detected using the Catalina Real-time TransientSurvey (Drake et al. 2009). There are 69 photometric datapoints spread over 8 years showing a mean of V ∼ 15.0±0.2and a range of V ∼14.6–15.5.
0 5 10 15 20 25Period (Days)
0
200
400
600
800
1000
1200
1400
LS P
ower
3.8 4.0 4.2Period (Hours)
0
10
20
30
40
50
Figure 2. The Lomb Scargle power spectrum derived using thefull LC light curve of KIC 9202990. The many peaks are indicativeof the complex nature of the long period (the window functiondoes not show significant side-lobes). In the smaller panel we showthe power spectrum centered near the period of the orbital period(3.98 hrs).
3 KEPLER PHOTOMETRIC OBSERVATIONS
The vast majority of targets in the Kepler field were ob-served in long cadence (LC) mode, where the effective expo-sure is 27.1 min. A very small number of targets (the targetscould be changed every month) were observed in short ca-
dence (SC) mode, where the effective exposure is 54.2 s. Asthe satellite was rotated every 3 months to ensure the so-lar array was effectively pointed to the Sun, there are shortdata gaps when data was downloaded from the satellite. KIC9202990 was observed for 16 ‘Quarters’ (Q2–17), giving al-most 4 years of near continuous data between June 2009and May 2013, and it was observed for 7 months using SCmode (Q2/3, Q5/1–3 and Q16/1–3). After the raw data arecorrected for bias, shutterless readout smear, and sky back-ground (see Jenkins et al. 2010), time series are extractedusing simple aperture photometry (SAP).
The SAP data were extracted from the data files down-loaded from the MAST archive1 and filtered to remove datafrom time intervals when the data may have been com-promised, for instance by enhanced Solar activity, (we fil-tered data points so that ‘SAP QUALITY=0’). We thennormalised each quarter of data so that the mean countrate was unity. To remove systematic trends in the data weused the task kepcotrend which is part of the PyKE software(Still & Barclay 2012)2. We then applied a small offset sothat there are no discrete jumps in flux between the differ-ent quarters of data. The same steps were applied to the SCdata.
3.1 Long Cadence Data
To highlight the photometric variability of KIC 9202990 ona timescale of tens of days, we show 200 d of LC data ofKIC 9202990 in Figure 1. As first reported by Østensen etal. (2010) there is a prominent modulation on a timescale
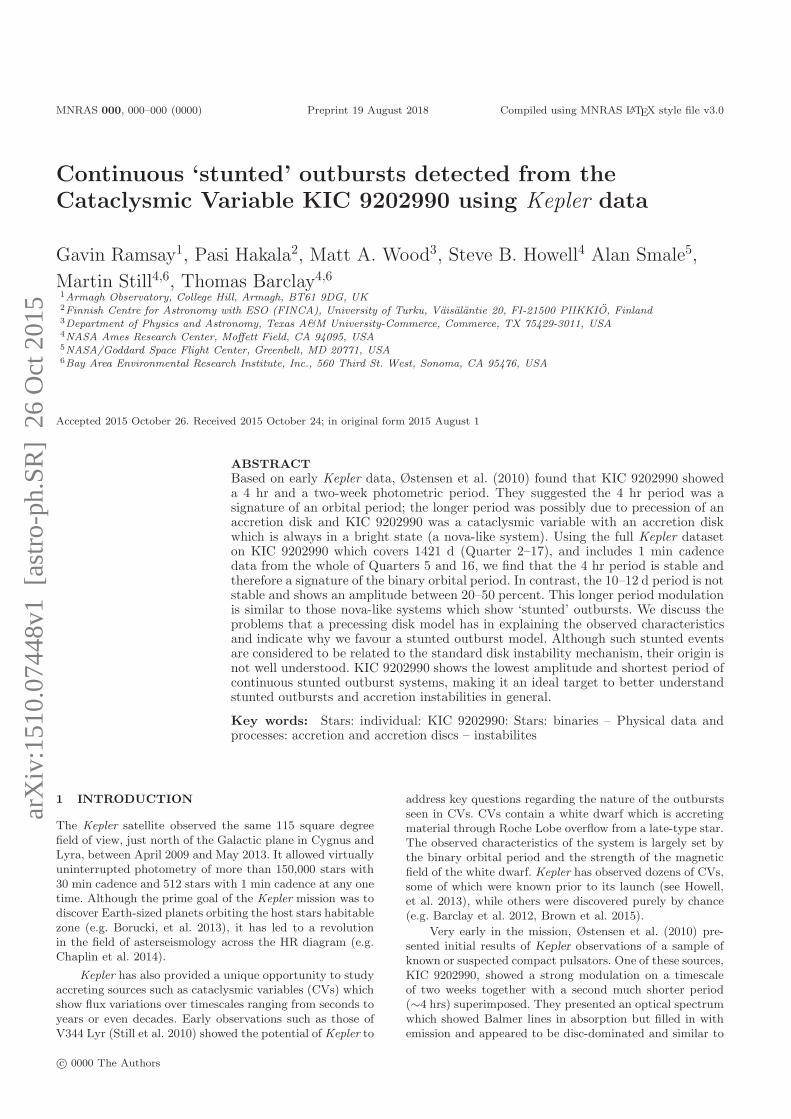
between 10 and 12 d and a full-amplitude which varies be-tween 20 and 50 percent. We also note the presence of twoclear ‘dips’ in the light curve. We show the Lomb Scarglepower spectrum of the full LC light curve in Figure 2, whichcovers 1421 d, but has short gaps every 3 months. The powerspectrum is complex but shows four prominent peaks cor-responding to periods between 13–14 days. This implies thelarge modulation seen in Figure 1 is not strictly periodic butquasi-periodic (we call this the ‘long’ period).
We also determined the length of each cycle by simplydetermining the time of maximum flux of each long periodcycle. The distribution of the duration of each cycle can beapproximated with a Gaussian function with a mean dura-tion of 12.5 d with a FWHM of ∼4 d.
We also searched for periodic behaviour on timescalesgreater than the long period. Since long term trends mayberemoved when we normalise the light curve on a quarterbasis, we used the light curve which was de-trended but notnormalised. There is clear peak in the power spectrum at∼185 d which is due to a modulation with a full-amplitude of∼10 percent in the light curve. (This period is not seen in thepower spectrum of the normalised light curve). However, wenote that this period is half the orbital period of the Kepler
satellite. Banyai et al. (2013) and Hartig et al. (2014) presentstudies of Kepler observations of long period variables andfind some evidence that year long periods maybe artifacts inthe SAP derived light curve. We therefore add some cautionregarding whether the 185 d modulation is intrinsic to KIC9202990.
3.2 Short Cadence Data
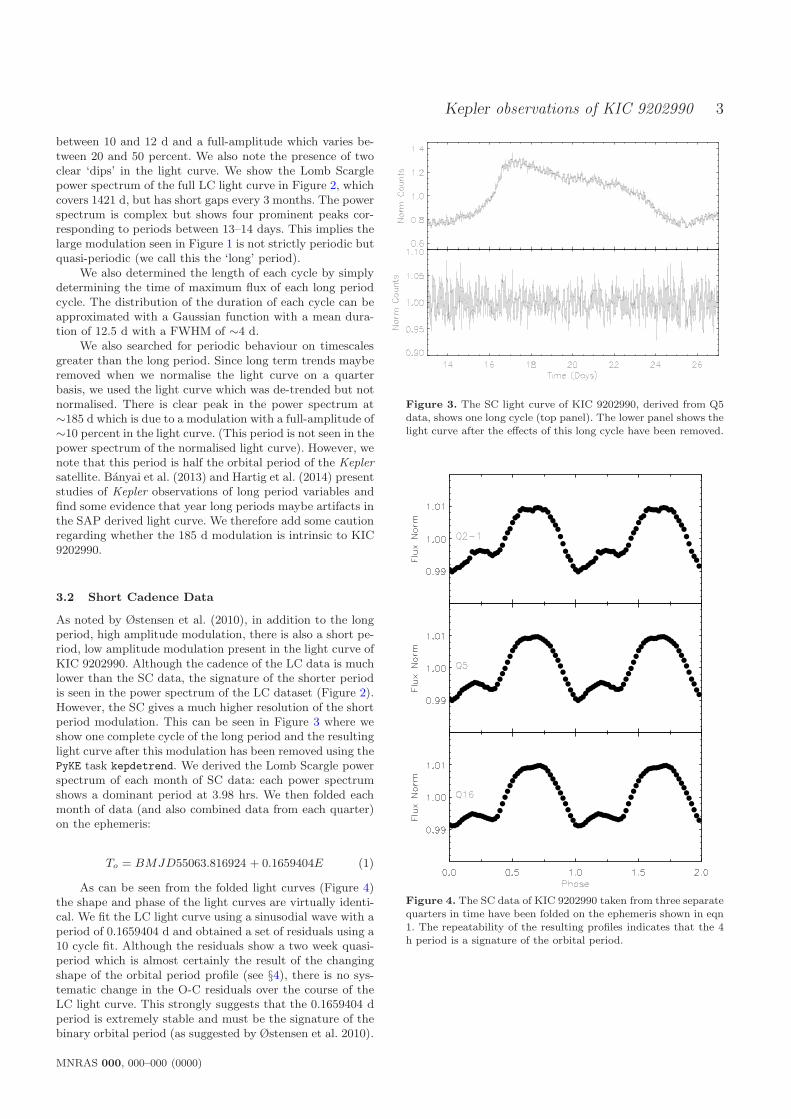
As noted by Østensen et al. (2010), in addition to the longperiod, high amplitude modulation, there is also a short pe-riod, low amplitude modulation present in the light curve ofKIC 9202990. Although the cadence of the LC data is muchlower than the SC data, the signature of the shorter periodis seen in the power spectrum of the LC dataset (Figure 2).However, the SC gives a much higher resolution of the shortperiod modulation. This can be seen in Figure 3 where weshow one complete cycle of the long period and the resultinglight curve after this modulation has been removed using thePyKE task kepdetrend. We derived the Lomb Scargle powerspectrum of each month of SC data: each power spectrumshows a dominant period at 3.98 hrs. We then folded eachmonth of data (and also combined data from each quarter)on the ephemeris:
To = BMJD55063.816924 + 0.1659404E (1)
As can be seen from the folded light curves (Figure 4)the shape and phase of the light curves are virtually identi-cal. We fit the LC light curve using a sinusodial wave with aperiod of 0.1659404 d and obtained a set of residuals using a10 cycle fit. Although the residuals show a two week quasi-period which is almost certainly the result of the changingshape of the orbital period profile (see §4), there is no sys-tematic change in the O-C residuals over the course of theLC light curve. This strongly suggests that the 0.1659404 dperiod is extremely stable and must be the signature of thebinary orbital period (as suggested by Østensen et al. 2010).
Figure 3. The SC light curve of KIC 9202990, derived from Q5data, shows one long cycle (top panel). The lower panel shows thelight curve after the effects of this long cycle have been removed.
Figure 4. The SC data of KIC 9202990 taken from three separatequarters in time have been folded on the ephemeris shown in eqn1. The repeatability of the resulting profiles indicates that the 4h period is a signature of the orbital period.
MNRAS 000, 000–000 (0000)
4
4 ORBITAL AND LONG PERIOD
VARIATIONS
The forest of peaks in the periodogram of KIC 9202990 (Fig-ure 2) suggests that the long period is not stable. In orderto investigate this further, we have performed more detailedinvestigations. The simplest test is to obtain a Lomb Scargleperiodogram of relatively short sections of data in a slidingmanner. We show the resulting ’spectrogram’ in Figure 5: itconfirms that the long period is not stable and shows otherperiods that appear to be transient in nature.
We then carried out a more sophisticated analysis usingboth the Q5 and Q16 SC datasets which are both approxi-mately 90 d in length. We perform the same analysis on eachlight curve separately, which aims to measure the similarityof the orbital light curve shape as a function of their sepa-ration in time. Our analysis proceeds as follows: i) Pick twonon-overlapping pieces of light curves, each 2 d (giving 12orbital cycles) long, separated by a random amount of time(from 2 d up to the length of the dataset); ii) Fold these twosubsections of light curves over the 4 h orbital period andbin each of these into 50 orbital phase bins; iii) Compute thesum of squared differences of the binned light curves and iv)repeat this 100,000 times. As a result, we have a measure ofthe difference between orbital light curve shapes as a func-tion of their separation in time. Finally, we have binned theresults in 0.1 d time bins: in both datasets we see a mini-mum near 10–12 d separation and its multiples (Figure 6).This strongly suggests that the orbital light curve shape isindeed modulated on a 10–12 d period, which correspondsto the 20–50% modulation seen in the light curves (Fig 1).
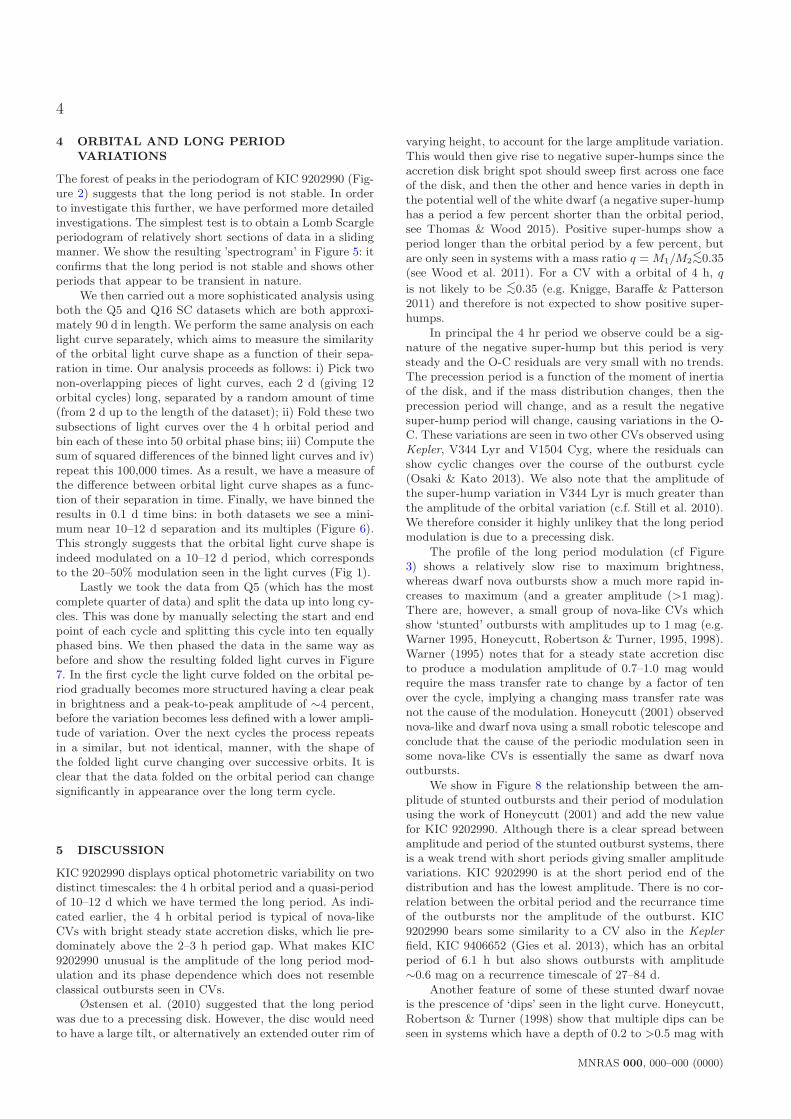
Lastly we took the data from Q5 (which has the mostcomplete quarter of data) and split the data up into long cy-cles. This was done by manually selecting the start and endpoint of each cycle and splitting this cycle into ten equallyphased bins. We then phased the data in the same way asbefore and show the resulting folded light curves in Figure7. In the first cycle the light curve folded on the orbital pe-riod gradually becomes more structured having a clear peakin brightness and a peak-to-peak amplitude of ∼4 percent,before the variation becomes less defined with a lower ampli-tude of variation. Over the next cycles the process repeatsin a similar, but not identical, manner, with the shape ofthe folded light curve changing over successive orbits. It isclear that the data folded on the orbital period can changesignificantly in appearance over the long term cycle.
5 DISCUSSION
KIC 9202990 displays optical photometric variability on twodistinct timescales: the 4 h orbital period and a quasi-periodof 10–12 d which we have termed the long period. As indi-cated earlier, the 4 h orbital period is typical of nova-likeCVs with bright steady state accretion disks, which lie pre-dominately above the 2–3 h period gap. What makes KIC9202990 unusual is the amplitude of the long period mod-ulation and its phase dependence which does not resembleclassical outbursts seen in CVs.
Østensen et al. (2010) suggested that the long periodwas due to a precessing disk. However, the disc would needto have a large tilt, or alternatively an extended outer rim of
varying height, to account for the large amplitude variation.This would then give rise to negative super-humps since theaccretion disk bright spot should sweep first across one faceof the disk, and then the other and hence varies in depth inthe potential well of the white dwarf (a negative super-humphas a period a few percent shorter than the orbital period,see Thomas & Wood 2015). Positive super-humps show aperiod longer than the orbital period by a few percent, butare only seen in systems with a mass ratio q = M1/M2
<∼0.35
(see Wood et al. 2011). For a CV with a orbital of 4 h, q
is not likely to be <∼0.35 (e.g. Knigge, Baraffe & Patterson
2011) and therefore is not expected to show positive super-humps.
In principal the 4 hr period we observe could be a sig-nature of the negative super-hump but this period is verysteady and the O-C residuals are very small with no trends.The precession period is a function of the moment of inertiaof the disk, and if the mass distribution changes, then theprecession period will change, and as a result the negativesuper-hump period will change, causing variations in the O-C. These variations are seen in two other CVs observed usingKepler, V344 Lyr and V1504 Cyg, where the residuals canshow cyclic changes over the course of the outburst cycle(Osaki & Kato 2013). We also note that the amplitude ofthe super-hump variation in V344 Lyr is much greater thanthe amplitude of the orbital variation (c.f. Still et al. 2010).We therefore consider it highly unlikey that the long periodmodulation is due to a precessing disk.
The profile of the long period modulation (cf Figure3) shows a relatively slow rise to maximum brightness,whereas dwarf nova outbursts show a much more rapid in-creases to maximum (and a greater amplitude (>1 mag).There are, however, a small group of nova-like CVs whichshow ‘stunted’ outbursts with amplitudes up to 1 mag (e.g.Warner 1995, Honeycutt, Robertson & Turner, 1995, 1998).Warner (1995) notes that for a steady state accretion discto produce a modulation amplitude of 0.7–1.0 mag wouldrequire the mass transfer rate to change by a factor of tenover the cycle, implying a changing mass transfer rate wasnot the cause of the modulation. Honeycutt (2001) observednova-like and dwarf nova using a small robotic telescope andconclude that the cause of the periodic modulation seen insome nova-like CVs is essentially the same as dwarf novaoutbursts.
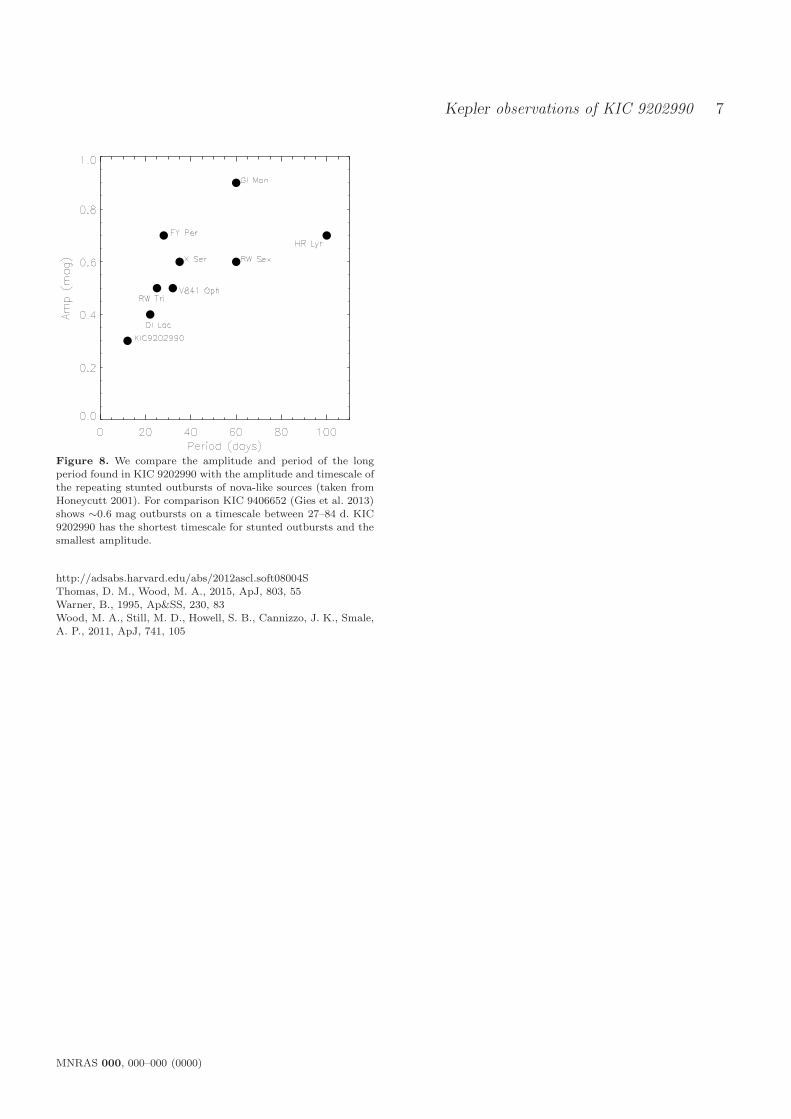
We show in Figure 8 the relationship between the am-plitude of stunted outbursts and their period of modulationusing the work of Honeycutt (2001) and add the new valuefor KIC 9202990. Although there is a clear spread betweenamplitude and period of the stunted outburst systems, thereis a weak trend with short periods giving smaller amplitudevariations. KIC 9202990 is at the short period end of thedistribution and has the lowest amplitude. There is no cor-relation between the orbital period and the recurrance timeof the outbursts nor the amplitude of the outburst. KIC9202990 bears some similarity to a CV also in the Kepler
field, KIC 9406652 (Gies et al. 2013), which has an orbitalperiod of 6.1 h but also shows outbursts with amplitude∼0.6 mag on a recurrence timescale of 27–84 d.
Another feature of some of these stunted dwarf novaeis the prescence of ‘dips’ seen in the light curve. Honeycutt,Robertson & Turner (1998) show that multiple dips can beseen in systems which have a depth of 0.2 to >0.5 mag with
MNRAS 000, 000–000 (0000)
Kepler observations of KIC 9202990 5
Figure 5. Using a sliding Lomb Scargle Periodogram we show how the long period varies over the course of the observations. The toppanel shows the Kepler light curve of KIC 9202990 and the right hand panel shows the power of the periodogram. The frequency of thedominant peak in the periodogram clearly changes over time.
Figure 6. We show the results of measuring the difference in theorbital light curves as a function of time for Q5 SC data (top)and Q16 SC data (bottom). This indicates the longer period ismodulated on a quasi-period of 10–14 d (see text for details).
a FWHM ranging from 2 to 50 days. Our LC observationsof KIC 9202990 indicate two obvious dips (see Figure 2) ofdepths 0.4 and 0.6 mag with FWHM of 2–3 days. Thesedips share some resemblance to the dips seen in the nova-like sub-class of CVs the VY Scl stars, although the durationof these dips are typically tens of days and are deeper thanseen in KIC 9202990. They are thought to be due to tem-porary reduction in mass transfer rate which maybe relatedto activity on the secondary star (see for instance Howell etal. 2000 and Kafka & Honeycutt 2005).
6 CONCLUSIONS
We have explored the photometric properties of KIC9202990 which was identified as a nova-like CV exhibitinga clear modulation on a 4 h and a 10–12 d quasi-period us-ing Kepler data by Østensen et al. (2010). We find that the4 h period is stable and must be the orbital period. Thelonger period is not stable and given the absence of neg-ative super-humps in the light curve, we consider it highlyunlikely it is due to the precession of an accretion disk. How-ever, we find that the characteristics of this long period isvery similar to the ‘stunted’ outbursts seen in a small num-ber of nova-like systems. KIC 9202990 would be placed onthe short period and low amplitude end of the distribution inthese sources. Medium resolution optical spectroscopy whichcould adequately resolve the orbital period over the courseof the long period would allow doppler tomograms to bemade as a function of the long period which would indicatehow the brightness of the disc changes. Another avenue toexplore will be to model the brightness changes over thelong term using smoothed particle hydrodynamical simula-tion codes such as described for instance in Larwood et al.(1996), Simpson (1995), Thomas & Wood (2015).
7 ACKNOWLEDGMENTS
The data presented in this paper were obtained from theMikulski Archive for Space Telescopes (MAST). STScI is op-erated by the Association of Universities for Research in As-tronomy, Inc., under NASA contract NAS5-26555. Supportfor MAST for non-HST data is provided by the NASA Of-fice of Space Science via grant NNX09AF08G and by other
MNRAS 000, 000–000 (0000)
6
Figure 7. We have taken the SC data from Q5, removed the trend caused by the long period variation, but split up the data so thateach sub-section contains one long period cycle (arranged from left to right). We have then further split these sub-sections into ten bins(and arranged from top to bottom) and folded these data on the orbital period. (One panel has only two points). It is clear that theprofile of the folded orbital light curve changes significantly over the long cycle.
grants and contracts. This paper includes data collected bythe Kepler mission and is (in part) supported by the Na-tional Science Foundation under Grant No. AST-1305799to Texas A&M University-Commerce and by NASA undergrant 11-KEPLER11-0038. Funding for the Kepler missionis provided by the NASA Science Mission directorate. Thiswork made use of PyKE (Still & Barclay 2012), a softwarepackage for the reduction and analysis of Kepler data. Thisopen source software project is developed and distributedby the NASA Kepler Guest Observer Office. Armagh Ob-servatory is supported by the Northern Ireland Governmentthrough the Dept of Culture, Arts and Leisure. We thankthe anonymous referee for a helpful report.
REFERENCES
Aungwerojwit, A., et al., 2005, A&A, 443, 995Banyai, E., et al., 2013, MNRAS, 436, 1576Barclay, T., Still, M., Jenkins, J. M., Howell, S. B., Roetten-bacher, R. M., 2012, MNRAS, 422, 1219Borucki, W. J., et al., 2013, Sci, 340, 587
Brown, A., et al., AJ, 149, 67Chaplin, W. J., 2014, ApJS, 210, 1Dhillon, V., 1996, In CVs and Related Objects, Proc IAU Coll158, ed Evans, A., Wood, J. H., p.3Drake, A.J. et al., 2009, ApJ, 696, 870
Everett, M. E., Howell, S. B., Kinemuchi, K., 2012, PASP, 124,316
Gansicke, B. T., et al., 2009, MNRAS, 397, 2170
Gies, D. R., et al., 2013, ApJ, 775, 64
Greiss S., et al., 2012a, AJ, 144, 24
Greiss S., et al., 2012b, arXiv:1212.3613
Hartig, E., Cash, J., Hinkle, K. H., Lebzelter, T., Mighell, K. J.,Walter, D. K., 2014, AJ, 148, 123
Honeycutt, R. K., Robertson, J. W., Turner, G. W., 1995, ApJ,446, 838
Honeycutt, R. K., Robertson, J. W., Turner, G. W., 1998, AJ,115, 2527
Honeycutt, R. K., 2001, PASP, 113, 473
Howell, S. B., Ciardi, D. R., Dhillon, V. S., Skidmore, W., 2000,ApJ, 530, 904
Howell, S. B., et al., 2013, AJ, 145, 109
Larwood, J. D., Nelson, R. P., Papaloizou, J. C. B., Terquem, S.,1996, MNRAS, 282, 597
Jenkins, J. M., et al., 2010, ApJ, 713, L87
Kafka, S., Honeycutt, R. K., 2005, AJ, 130, 742
Knigge, C., Baraffe, I., Patterson, J., 2011, ApJS, 194, 28
Still, M., Howell, S. B., Wood, M. A., Cannizzo, J. K., Smale, A.P., 2010, ApJ, 717, L113
Still, M., Barclay, T., 2012, AstrophysicsSource Code Library, record ascl:1208.004,
MNRAS 000, 000–000 (0000)
Kepler observations of KIC 9202990 7
Figure 8. We compare the amplitude and period of the longperiod found in KIC 9202990 with the amplitude and timescale ofthe repeating stunted outbursts of nova-like sources (taken fromHoneycutt 2001). For comparison KIC 9406652 (Gies et al. 2013)shows ∼0.6 mag outbursts on a timescale between 27–84 d. KIC9202990 has the shortest timescale for stunted outbursts and thesmallest amplitude.
http://adsabs.harvard.edu/abs/2012ascl.soft08004SThomas, D. M., Wood, M. A., 2015, ApJ, 803, 55Warner, B., 1995, Ap&SS, 230, 83Wood, M. A., Still, M. D., Howell, S. B., Cannizzo, J. K., Smale,A. P., 2011, ApJ, 741, 105