11.1! Long Cadence................................................................................................................45!
11.2! Short Cadence ...............................................................................................................51!
KSCI-19043-001: Kepler Data Release 3 Notes 1/20/2010
7 of 58
1. Introduction
These notes have been prepared to give Kepler users of the Multimission Archive at STScI (MAST) a summary of how the data were collected and prepared, and how well the data processing pipeline is functioning on flight data. They will be updated for each release of data to the public archive and placed on MAST along with other Kepler documentation, at http://archive.stsci.edu/kepler/documents.html . They are not meant to supplant the following documents:
1. Kepler Instrument Handbook (KIH, KSCI-19033) provides information about the design, performance, and operational constraints of the Kepler hardware, and an overview of the pixel data sets available. It was released on July 15, 2009, and is publicly available on MAST. The user should refer to the KIH for a glossary and acronym list.
2. Kepler Data Analysis Handbook (KDAH) describes how these pixel data sets are transformed into photometric time series by the Kepler Science Pipeline, the theoretical basis of the algorithms used to reduce data, and a description of residual instrument artifacts after Pipeline processing. The initial release of the KDAH, focused on the needs of MAST users and Guest Observers (GOs), is expected on 2/15/10. A significantly expanded version will be released in the fall of 2010, which will include topics which are specific to planetary transit detection and validation, or of general interest but still under development (such as Differential Image Analysis, or DIA).
3. SOC Tools User’s Guide describes the data and model retrieval tools written by the SOC, which offer unambiguous access to current calibration data and models, and to science data at various stages of processing which are not available through MAST. This User’s Guide will only be available to and useful for Science Team members who visit the SO at the invitation of the Science PI as the tools only exist in the SO/SOC.
4. Kepler Archive Manual (KDMC-10008) describes file formats and the availability of data through MAST. The Archive Manual is available on MAST
Much of the content from Release 2 Notes (KSCI-19042) is reproduced here for the user’s convenience. A sentence at the start of a Section will indicate if it is “recycled.” Users unfamiliar with the data processing pipeline should read Section 4 first. A list of acronyms and abbreviations is in Section 9.
From time to time it may be necessary to revise the Notes pertaining to a given data release, in which case the Notes will be reapproved for release and given a document number KSCI-190XX-00n. n starts at 1 for the original version of the notes for a given data release. Reference to Release Notes will refer to the most recent version (highest n) unless otherwise stated.
Data which would be unwieldy to print in this document format are included in a zip file, the Data Release Notes #3 Supplement, which will be released with this document. Supplement files are called out in the text, and a README file in the zip file also gives a brief description of the files contained. Supplement files are either ASCII or FITS format.
Note on dates and cadence numbers in these Notes: figures, tables, and supplement files will use MJD as the preferred time base. Cadences are absolutely enumerated with cadence interval numbers (CIN), which increment even when no cadences are being collected, such as during downlinks and safe modes. Cadence interval numbers are used in SOC intermediate data products and appear as the keywords LC_INTER and SC_INTER in the headers of FITS cadence files (not available through MAST). Users may also find useful the relative cadence index (RCI), which is the cadence number counted from the beginning of a quarter. For example, the first LC of Q1 would have an RCI = 1 and CIN = LC_INTER = 1105 while the last LC of Q1 has RCI = 1639 and CIN = LC_INTER = 2743. Unless otherwise specified, the MJD of a cadence refers to the time at the midpoint of the cadence.
KSCI-19043-001: Kepler Data Release 3 Notes 1/20/2010
8 of 58
2. Release Description
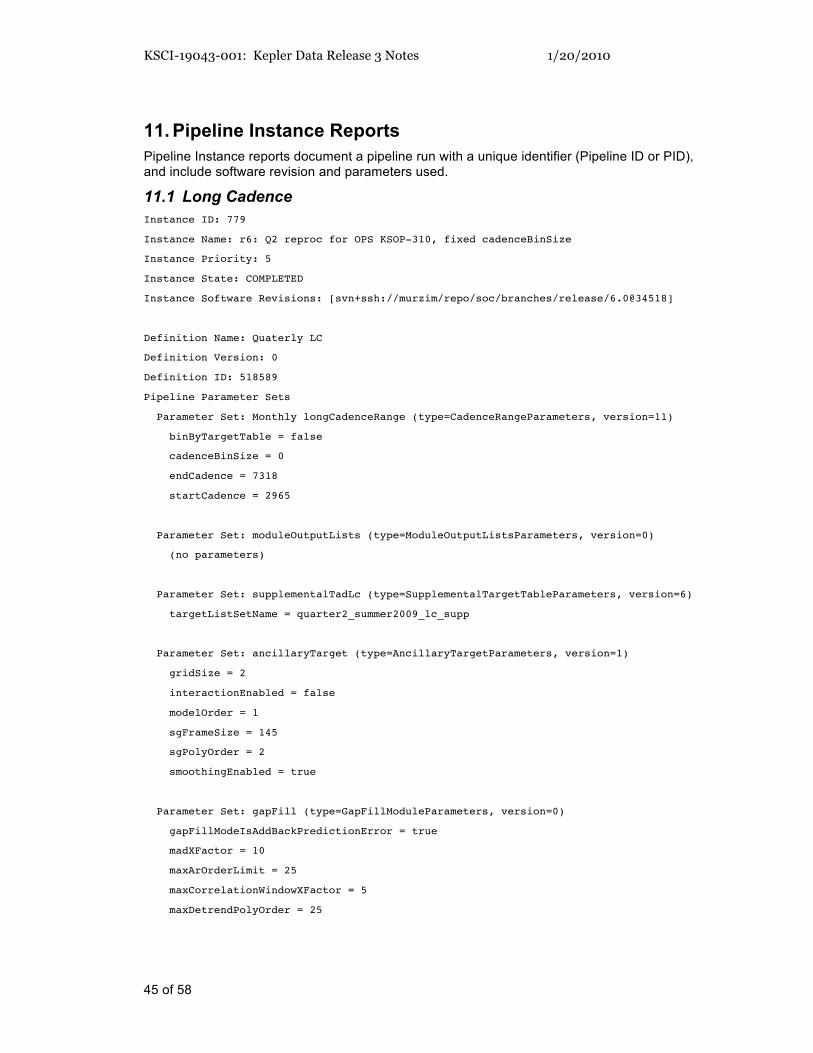
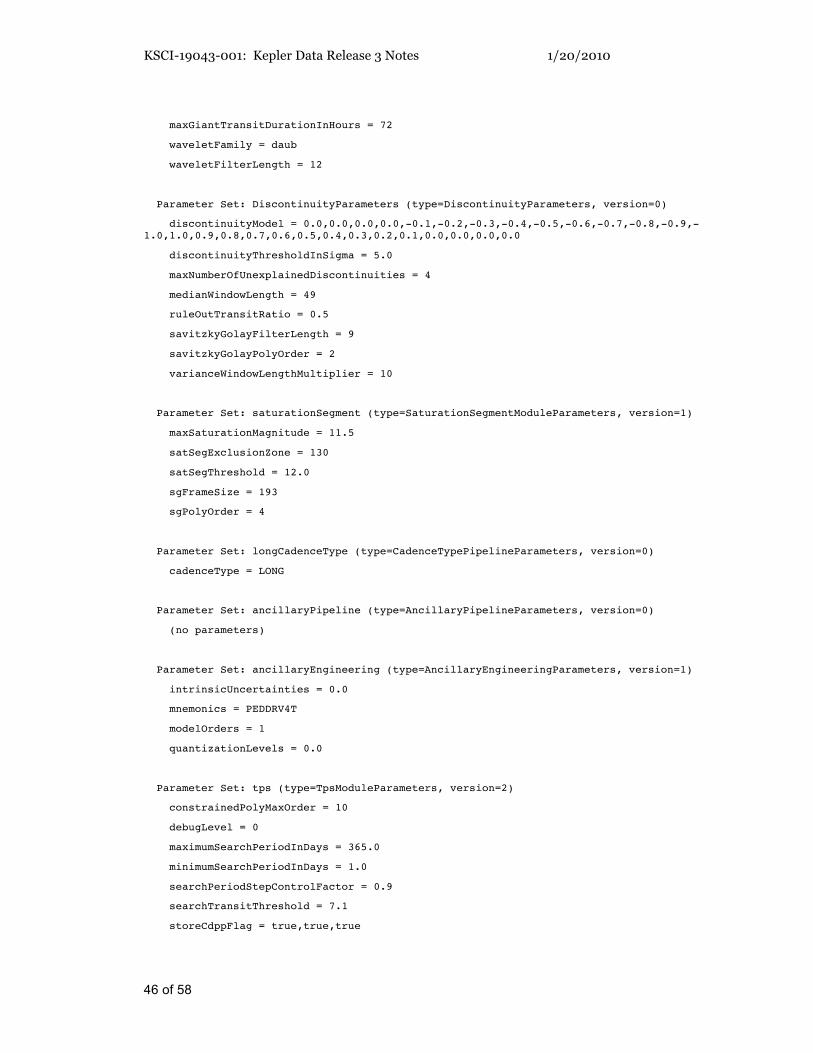
A data description refers to the data type and observation interval during which the data was collected. The observation interval is usually quarters, indicated by Q[n], though Q0 and Q1 are 10 days and one month, respectively, instead of 3 months as will be the case for the rest of the mission. The data processing descriptor is the internal Kepler Science OPerations (KSOP) ticket used to request the data processing. The KSOP ticket contains a “Pipeline Instance Report,” which precisely describes the sub-version of the software used to process the data, and a list of parameter values used. The Instance Reports are included in Section 11.
The same data will, in general, be reprocessed as the software improves, and will hence be the subject of multiple releases. The combination of data and data processing descriptions defines a data product, and a set of data products simultaneously delivered to MAST for either public or proprietary (Science Team or GO) access is called a data release. The first release of data products for a given set of data is referred to as “new,” while subsequent releases are referred to as “reprocessed.”
The keywords DATA_REL = 3 has been added to the FITS headers so users can unambiguously
associate Release 3 FITS files with these Notes. In addition, the keyword QUARTER has been
added; in the case of Release 3, all light curve files have QUARTER = 2, though multiple quarters may be included in future releases.
The Kepler Science Office considers Data Release 3 to provide "browse quality" data. The Kepler data analysis pipeline continues to undergo rapid evolution to adapt to the performance of the spacecraft and our understanding of the data. Data Release 3 was produced with unreleased code, which means that there was no formal verification or validation of the pipeline or the resulting data products. However, the Science Office believes the resulting data product is a substantial improvement over that available using the officially released pipeline code that was developed before launch. Data release 3 is meant to give users the opportunity to examine the data for possibly interesting science and to involve the users in improving the pipeline for future data releases. To perform the latter service, users are encouraged to notice and document artifacts, either in the raw or processed data, and report them to the Science Office.
Before users publish results based on Data Release 3, they must understand the data analysis performed and ascertain its impact on their results. The best resource to aid in this assessment is these Data Release Notes. The Science Office advises against publication of these Release 3 light curves without such careful consideration by the end user and dialog with the Science Office and Guest Observer Office, where deemed appropriate.
KSCI-19043-001: Kepler Data Release 3 Notes 1/20/2010
9 of 58
2.1 Summary of Contents
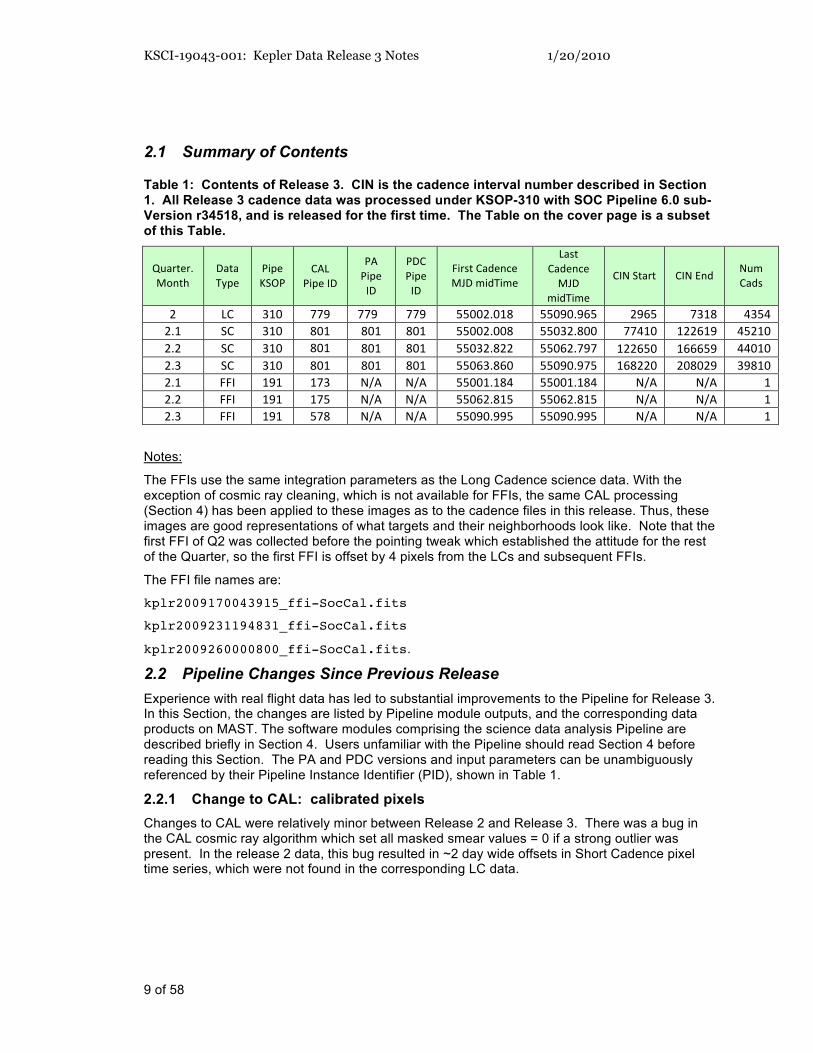
Table 1: Contents of Release 3. CIN is the cadence interval number described in Section 1. All Release 3 cadence data was processed under KSOP-310 with SOC Pipeline 6.0 sub-Version r34518, and is released for the first time. The Table on the cover page is a subset of this Table.
The FFIs use the same integration parameters as the Long Cadence science data. With the exception of cosmic ray cleaning, which is not available for FFIs, the same CAL processing (Section 4) has been applied to these images as to the cadence files in this release. Thus, these images are good representations of what targets and their neighborhoods look like. Note that the first FFI of Q2 was collected before the pointing tweak which established the attitude for the rest of the Quarter, so the first FFI is offset by 4 pixels from the LCs and subsequent FFIs.
The FFI file names are:
kplr2009170043915_ffi-SocCal.fits
kplr2009231194831_ffi-SocCal.fits
kplr2009260000800_ffi-SocCal.fits.
2.2 Pipeline Changes Since Previous Release
Experience with real flight data has led to substantial improvements to the Pipeline for Release 3. In this Section, the changes are listed by Pipeline module outputs, and the corresponding data products on MAST. The software modules comprising the science data analysis Pipeline are described briefly in Section 4. Users unfamiliar with the Pipeline should read Section 4 before reading this Section. The PA and PDC versions and input parameters can be unambiguously referenced by their Pipeline Instance Identifier (PID), shown in Table 1.
2.2.1 Change to CAL: calibrated pixels
Changes to CAL were relatively minor between Release 2 and Release 3. There was a bug in the CAL cosmic ray algorithm which set all masked smear values = 0 if a strong outlier was present. In the release 2 data, this bug resulted in ~2 day wide offsets in Short Cadence pixel time series, which were not found in the corresponding LC data.
KSCI-19043-001: Kepler Data Release 3 Notes 1/20/2010
10 of 58
2.2.2 Change to PA: raw light curves and centroids
The only significant change in PA since Release 2 is that the Pipeline now calculate barycentric time corrections. The Data Release 2 Notes (KSCI-19042) provided the equation and an ephemeris, but did not perform this correction. See Section 7.4 for a discussion of time and time stamps.
2.2.3 Changes to PDC: corrected light curves
1. Track data lost or degraded data (Section 5). Data can be lost or degraded by spacecraft operation anomalies such as attitude tweaks, loss of Fine Point (LOFP), and safe modes – none of which occurred during the Q0 and Q1 data described in Release 2 Notes (KSCI-19042).
2. Identify pixel time series discontinuities (Section 6.3) and step sizes for all targets, for data not already flagged as lost or degraded.
3. Perform single harmonic fit for each variable target across all valid cadences, remove the fit from the data, save the fit parameters, and pass the harmonic-removed data to step 4. The fit is performed on good segments of data between spacecraft anomalies and pixel discontinuities.
4. Detrend flux time series using the LDE board temperature PEDDRV4T. Previously, only motion polynomials derived from star positions were used.
5. Identify those variable targets for which cotrending has produced bad results, and substitute results obtained by coarse systematic error correction.
6. Restore harmonic content, thus preserving signals of astrophysical interest in the archived light curves.
While PDC temporarily removes the harmonic stellar variability to do a more effective job of detrending the flux time series against ancillary data, the output of PDC preserves astrophysical signals on time scales shorter than about 15 days. It has always been the case, and will be in the future, that astrophysical signals on time scales longer than 15 days are mostly removed by PDC’s low-order detrending (See Section 4.4), and users interested in these trends will need to adopt custom methods of data analysis or conduct an independent evaluation of the methods used in PDC.
KSCI-19043-001: Kepler Data Release 3 Notes 1/20/2010
11 of 58
3. Current Evaluation of Performance
3.1 Overall
The Combined Differential Photometric Precision (CDPP) of a photometric time series is the effective white noise standard deviation over a time interval equal to that of the duration of the transit that is searched for in the time series. CDPP gives the S/N of a transit of this duration and a given depth. For example, a 6.5 hr CDPP of 20 ppm for a star with a planet exhibiting 84 ppm
transits lasting 6.5 hours leads to a single transit S/N of 4.1 !.
The CDPP performance has been discussed by Borucki et al. [1]. In a nutshell, they conclude that the joint performance of the instrument and the data analysis Pipeline gives noise on 0.5 hr timescales between one and two times the expected value for stars which are intrinsically quiet. Nonetheless, the following cautions apply for interpreting data at this point in our knowledge of the Instrument’s performance:
1. Many stars remain unclassified until Kepler and other data can be used to ascertain whether they are giants or otherwise peculiar. Since giant stars are intrinsically variable at the level of Kepler’s precision, they must be excluded from calculations of CDPP performance.
2. Given the instrument artifacts discussed in detail in the KIH, it is not generally possible to extrapolate noise as 1/sqrt(time) from the 0.5 hr results for those channels afflicted by artifacts which are presently not corrected or flagged by the Pipeline.
3. Stellar variability and other instrumental effects may not be white noise processes.
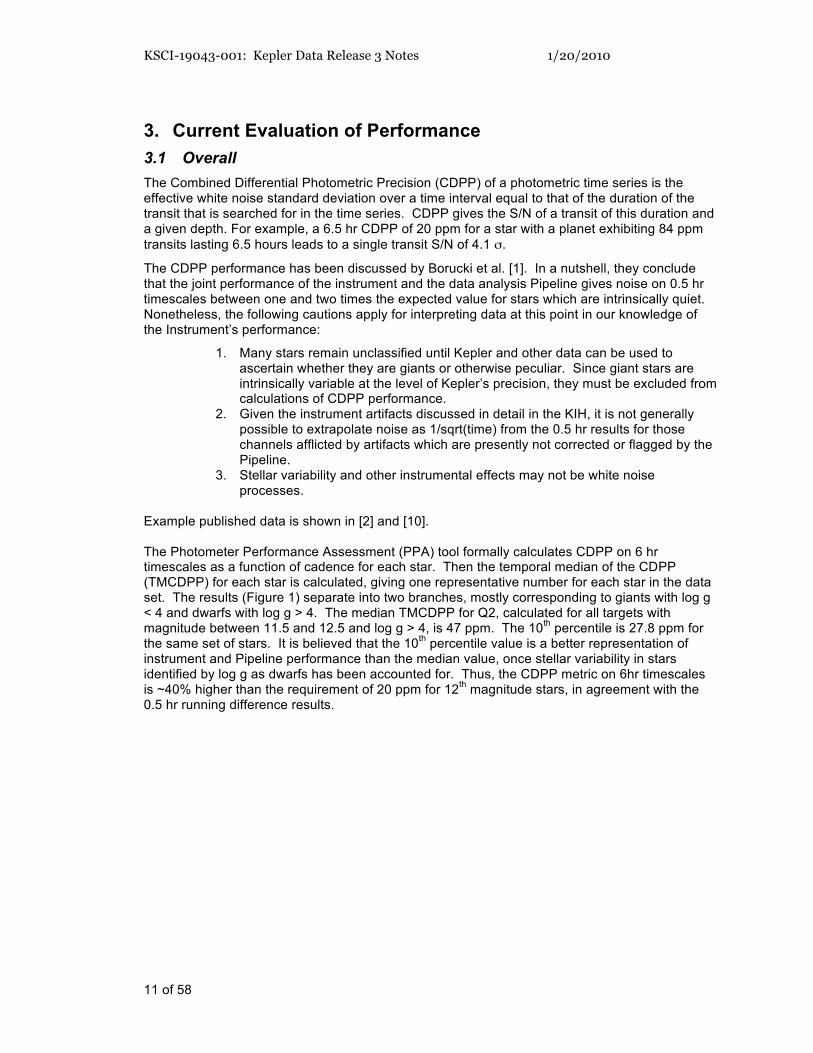
Example published data is shown in [2] and [10]. The Photometer Performance Assessment (PPA) tool formally calculates CDPP on 6 hr timescales as a function of cadence for each star. Then the temporal median of the CDPP (TMCDPP) for each star is calculated, giving one representative number for each star in the data set. The results (Figure 1) separate into two branches, mostly corresponding to giants with log g < 4 and dwarfs with log g > 4. The median TMCDPP for Q2, calculated for all targets with magnitude between 11.5 and 12.5 and log g > 4, is 47 ppm. The 10
th percentile is 27.8 ppm for
the same set of stars. It is believed that the 10th percentile value is a better representation of
instrument and Pipeline performance than the median value, once stellar variability in stars identified by log g as dwarfs has been accounted for. Thus, the CDPP metric on 6hr timescales is ~40% higher than the requirement of 20 ppm for 12
th magnitude stars, in agreement with the
0.5 hr running difference results.
KSCI-19043-001: Kepler Data Release 3 Notes 1/20/2010
12 of 58
Figure 1: 6 hr CDPP calculated for Q2 by PPA for stars between 11th and 13th magnitude. Stars on the planetary target list with log g > 4, which are almost certainly dwarf stars, are shown as green +'s. Blue +'s indicate log g < 4 (giants), log g unknown, or that the target is not on the planetary target list for Q2.
3.2 Changes in Performance Since Previous Release
While the gross CDPP has not improved since the previous release, the ability of the Pipeline to cope with stellar variability and data discontinuities has been significantly improved, as discussed in Section 4. These improvements have greatly diminished the number of false transit detections in subsequent Pipeline modules, which would otherwise be too numerous to follow up.
We expect considerable improvement in performance in the Q3 data for Data Release 4, since no pointing tweaks (Section 5.3.3) were required in Q3 and the focus jitter correlated with the reaction wheel heater (Section 6.4) should be substantially diminished by operational changes.
3.3 Ongoing Calibration Issues
Topics under consideration by the DAWG which may change future calibration parameters or methods include:
1. Identify additional flight system state variables, which can be used to detrend the data in PDC. Currently, only motion polynomials and the board temperature PEDDRV4T are used. Other example variables could include the reaction wheel housing temperatures associated with plate scale variations (Section 6.4). The same algorithm would be used, but with an expanded set of basis functions.
2. Identify residual instrumental effects in fluxes and centroids in both science and Fine Guidance Sensor data (Sections 6.2 and 6.3), which are not yet correlated with ancillary data.
3. Improve the characterization of stellar variability, so detrending can be more effective when the stellar variability is temporarily removed from the light curve.
4. Characterize the in-orbit change of focus (Section 6.4) and consider refocusing the telescope.
KSCI-19043-001: Kepler Data Release 3 Notes 1/20/2010
13 of 58
5. Identify particular light curves that are poorly corrected, and understand why generally effective remedies do not work in these cases. Feedback from users is essential for the SO and SOC to identify all such “hard cases.”
Calibration and data analysis issues related to the focal plane and its electronics are discussed in the “Artifacts” section of the Instrument Handbook.
KSCI-19043-001: Kepler Data Release 3 Notes 1/20/2010
14 of 58
4. Data Delivered – Processing History
4.1 Overview
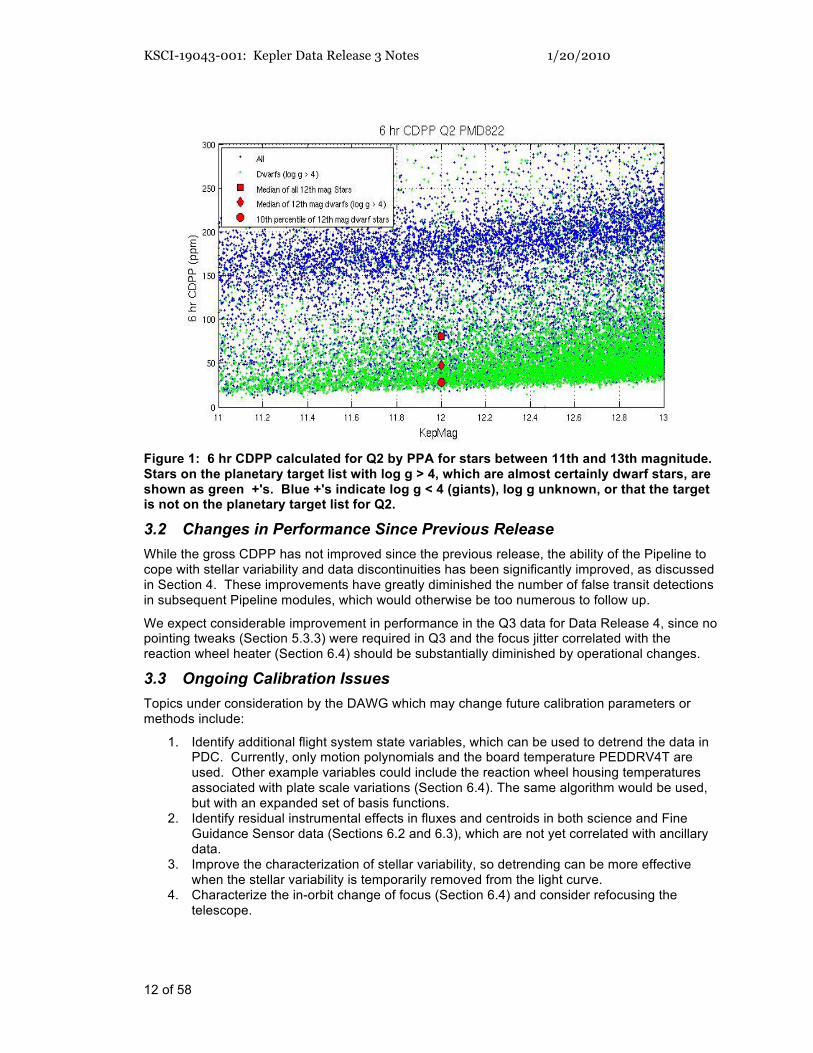
The delivered FITS files were processed as shown in simplified form in Figure 2. What is referred to as “raw” flux time series is the result of calibrating pixels, estimating and removing sky background, and extracting a time series from a photometric aperture. The “corrected” flux time series has been decorrelated against known system state variables, such as pointing.
Figure 2: Processing of Data from Raw Pixels To Flux Time Series archived at MAST.
4.2 Pixel-Level Calibration (CAL)
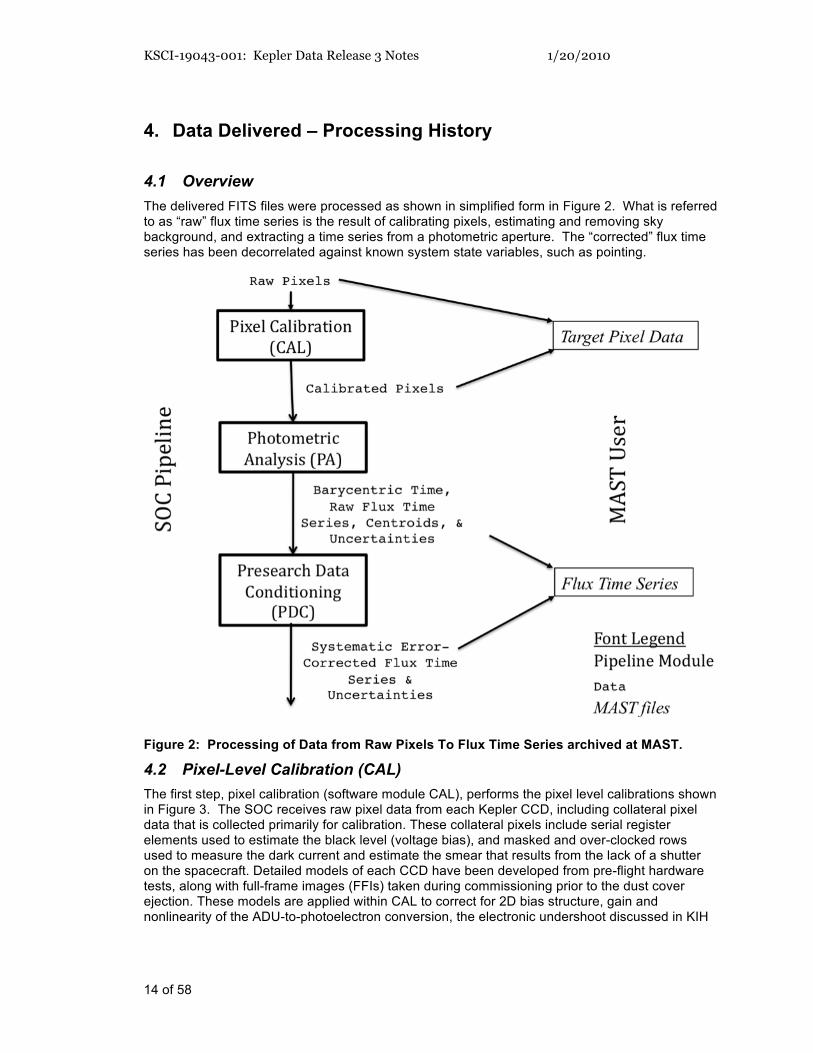
The first step, pixel calibration (software module CAL), performs the pixel level calibrations shown in Figure 3. The SOC receives raw pixel data from each Kepler CCD, including collateral pixel data that is collected primarily for calibration. These collateral pixels include serial register elements used to estimate the black level (voltage bias), and masked and over-clocked rows used to measure the dark current and estimate the smear that results from the lack of a shutter on the spacecraft. Detailed models of each CCD have been developed from pre-flight hardware tests, along with full-frame images (FFIs) taken during commissioning prior to the dust cover ejection. These models are applied within CAL to correct for 2D bias structure, gain and nonlinearity of the ADU-to-photoelectron conversion, the electronic undershoot discussed in KIH
KSCI-19043-001: Kepler Data Release 3 Notes 1/20/2010
15 of 58
Section 6.6, and flat field. CAL operates on long (30 min) and short (1 min) cadence data, as well as FFIs [3, 9].
Figure 3: Pixel Level Calibrations Performed in CAL. See the Instrument Handbook for a discussion of signal features and image contents processed in CAL.
4.3 Photometric Analysis (PA)
The primary tasks of this module are to compute the photometric flux and photocenters (centroids) for up to 170,000 long cadence (thirty minute) and 512 short cadence (one minute) targets across the focal plane array from the calibrated pixels in their respective apertures, and to compute barycentric corrected timestamps per target and cadence [4].
The tasks performed by Photometric Analysis (PA) are
1. Calculation of barycentric time correction, obviating the need for manual correction discussed in the Release 2 Notes (KSCI-19042).
2. Detection of Argabrightening events (Section 6). Argabrightening detection and cadence gapping takes place first; otherwise, many of the Argabrightening events would be cleaned as cosmic rays in the respective pixels, and not effectively detected and mitigated.
3. Cosmic ray (CR) cleaning of background and target pixels, logging of detected CRs, and calculation of CR metrics such as hit rate and mean energy. CRs are identified as data
KSCI-19043-001: Kepler Data Release 3 Notes 1/20/2010
16 of 58
which are greater than 12 median absolute deviations (MAD), after the removal of a trend formed by a robust quadratic fit followed by a 5 cadence wide median filter. The MAD is calculated over a sliding window 145 cadences wide, so that the MAD threshold is insensitive to possible planetary transit events in LC data but otherwise tracks changing fluctuations in the data. When fluctuations within the sliding window are larger, the CR threshold is higher. Otherwise, large random fluctuations will trigger the CR detector in periods when the flux is particularly noisy. As a result, the CR cleaning process is more sensitive when the flux is particularly quiet. CR-hit pixels are replaced by the trend value for that sample. The same method and parameters are used for LC and SC.
4. 2-D polynomial fitting to calibrated background pixels 5. Background removal from calibrated target pixels 6. Aperture photometry. In release 3, the flux is the sum of pixels in the optimal aperture
after background removal (Simple Aperture Photometry, SAP). 7. Computation of both flux-weighted and PRF centroids. The PRF fitting may not converge
for targets which are faint, or located in complex fields. See Note below regarding which of these centroids is provided in the MAST light curves.
8. Fitting of 2-D motion polynomials to target row and column centroids, which smoothly maps (RA,DEC) to (row, column) for a given output channel. Motion polynomials are a means of estimating local image motion, and do not assume rigid body motion of the entire focal plane.
9. Setting gap indicators for cadences with either a momentum dump (Section 5.1) or an Argabrightening (Section 6). The gapped cadences have all –Inf values in the FITS light curve files, except for the first two columns: time and cadence number.
Notes
The Pipeline attempts to calculate centroids using Pixel Response Function (PRF) fitting for each cadence of Photometer Performance Assessment (PPA) stellar targets (labeled PPA_STELLAR). If the PRF-based centroiding fails for a given PPA _STELLAR target and cadence, then the flux-weighted centroid is put in the MAST light curve files. Unfortunately, there is no information in the light curve FITS files available from MAST which identifies which centroids are PRF and which are flux-weighted, even though different cadences of the same PPA_STELLAR target may have centroids derived by the two different methods. Roughly 17,000 targets, or 10% of the total, are classified as PPA_STELLAR. The PPA_STELLAR targets are listed in the Supplement. For all other targets, only first-moment (also known as flux-weighted) centroids are used. The first-moment centroids are suitable for precision astrometry [6] in uncrowded apertures. Users wishing to do precise centroiding for non-PPA_STELLAR targets in crowded apertures need to consider the distribution of flux from non-target sources in the optimal aperture pixels or use the PRFs provided in the KIH Supplement to do their own fit.
There is no identification of bad pixels in PA in Release 3, nor is there any exclusion, gapping or other treatment of known bad pixels. Bad pixels may be identified in future releases. The treatment of bad pixels is TBD, and may depend on how the pixel is bad (high read noise, unstable photoresponse, low photoresponse, etc.) and its location in the target aperture.
The output of PA is called ‘raw’ in the light curve FITS file, even though it is the sum of ‘calibrated’ pixels, because systematic errors have not been removed.
4.4 Pre-Search Data Conditioning (PDC)
The primary tasks of this component are to correct systematic errors and condition the raw flux light curves produced by PA.
The tasks performed by PDC [5] are:
KSCI-19043-001: Kepler Data Release 3 Notes 1/20/2010
17 of 58
1. Tracking of cadences that are known to be lost or degraded (Section 5). These cadences and their corresponding data anomalies are shown in Section 5.3.6
2. Resampling of ancillary data to match the sampling rate of LC and SC data. 3. Identification and correction of unexplained discontinuities (i.e. unrelated to known
anomalies) 4. Identification of stars which are variable above a threshold. 5. For variable stars only, coarse systematic error correction with the following steps:
a. Correct discontinuities due to attitude tweak. b. Phase-shifting harmonic fitting for each variable target using all the good
cadences of coarsely detrended data in a Quarter. c. Remove harmonic fit from time series. d. Correct thermal recovery transients with a polynomial fit. e. Remove a low-order polynomial trend. f. Repeat the harmonic fit, and save this improved harmonic fit for later restoration.
(See Figure 4 for an example). g. Remove the improved fit and pass the harmonic-removed light curve to step 6.
6. Co-trending target flux time series against ancillary data and motion polynomials derived by PA to remove common linear and nonlinear deterministic trends. Singular Value Decomposition (SVD) is used to orthogonalize the set of basis vectors and numerically stabilize the model fit. The only ancillary data used for Release 3 was the board temperature PEDDRV4T; even though the reaction wheel housing temperature may be correlated with flux time series (Section 6.4), it was not used for co-trending in Release 3. See Figure 5 for an example.
7. Identification of variable targets for which cotrending has produced bad results, and substitute results obtained by coarse systematic error correction. This has generally been observed for variable targets which have low-frequency noise but no identifiable harmonic content.
8. Correction for the excess flux in the optimal aperture for each target due to crowding. 9. Identification and removal of impulsive outliers after masking off astrophysical events
such as giant transits, flares, and microlensing. A median filter is applied to the time series after the removal of obvious astrophysics, and the residual is determined by subtracting the median series from the target flux series. A robust running mean and
standard deviation of the residual is calculated and points more than 12 ! from the mean
are excluded. Not all astrophysical events are successfully masked, and hence may be falsely identified as outliers or may unnecessarily increase the noise threshold for outliers.
10. Restoration of harmonics to time series.
Notes
The crowding metric is the fraction of starlight in an aperture which comes from the target star. For example, a crowding metric of 1 means that all the light in an aperture comes from the target, so the light curve needs no correction. A crowding metric of 0.5 means that half the light is from the target and half from other sources, so the flux must be decreased by half before the correct relative transit depth is obtained. Note that the ‘raw’ flux time series are not corrected for crowding.
Gaps are not filled in the MAST files, and are represented as NaNs. Intermediate data products generated by PDC and internal to the SOC do have gaps filled, before being passed to planetary search parts of the Pipeline. This gap-filling will be described in the Data Analysis Handbook.
KSCI-19043-001: Kepler Data Release 3 Notes 1/20/2010
18 of 58
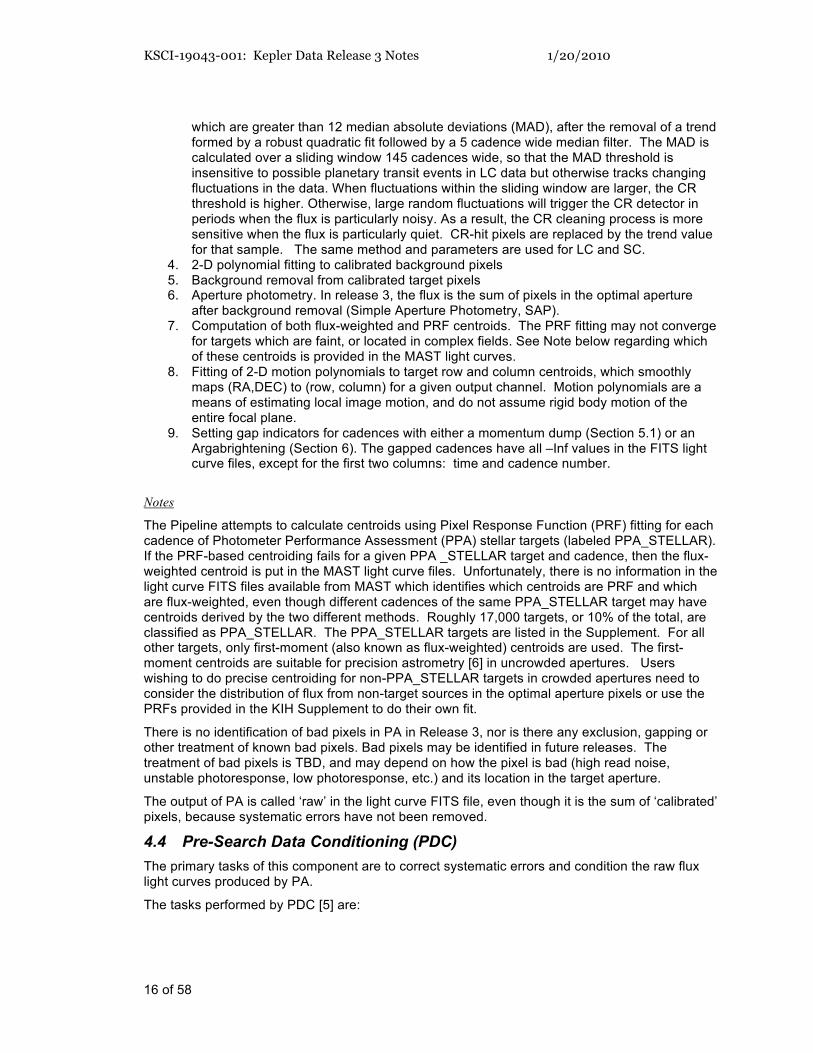
Figure 4: PDC example showing harmonic decomposition and fill. The light curve produced by PA is shown at the bottom in blue. The harmonic time series model (red) based on good data segments bridges the data gap during the Safe Mode, which occurred around MJD 55015. The principal periods are 2.81 d and 0.40 d, and their overtones. The filled light curve produced by PDC is next (black). While fill values during the Safe Mode and other data gaps are shown in this Figure, they are not included in the MAST files. The difference between the filled PDC output (black) and the harmonic time series model (red) is shown at the top of the plot in green, illustrating the order of magnitude reduction in effective stellar noise after harmonic removal. A few impulsive outliers remain.
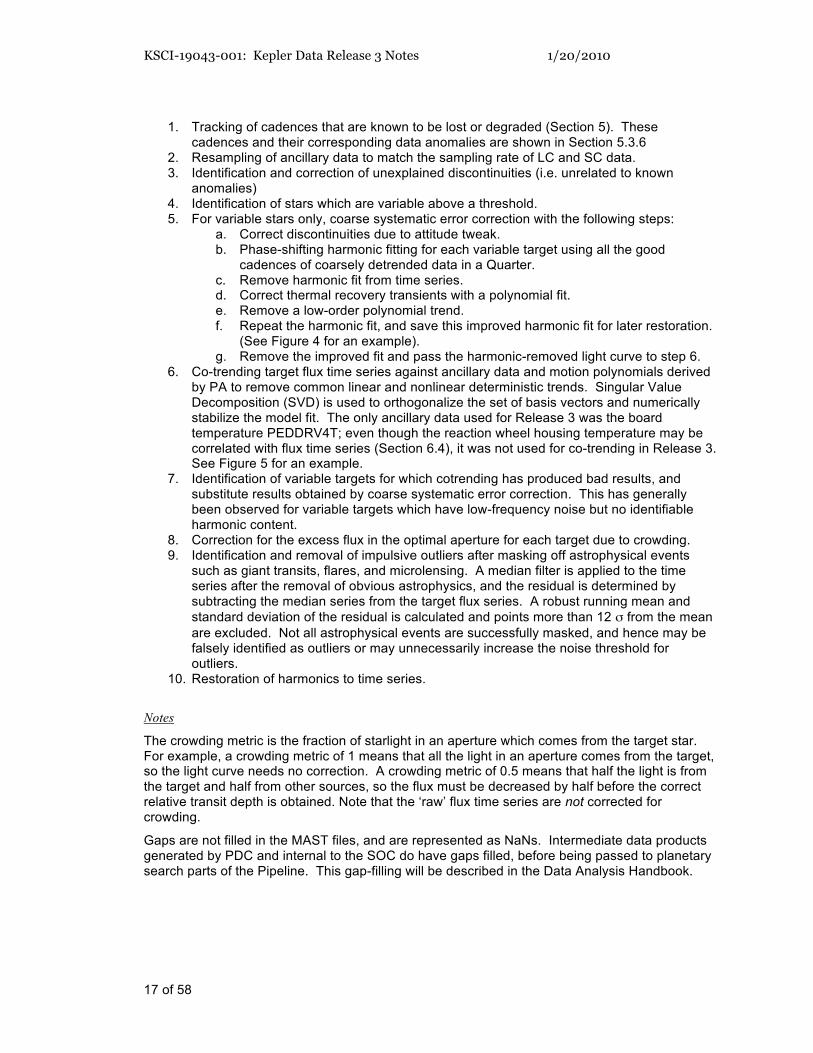
Figure 5: PDC example showing detrending and discontinuity splicing. The detrending was performed against the LDE board temperature and the motion polynomials for this target’s output channel. The detrending includes the long term trend, thermal transients, attitude tweak discontinuities and other short time scale systematics captured by the motion polynomials. The safe mode and attitude tweak discontinuities are "spliced" as
KSCI-19043-001: Kepler Data Release 3 Notes 1/20/2010
19 of 58
part of the cotrending process. They are not spliced separately for each target, as are the unexplained discontinuities such as sensitivity drops (Section 6.3). Data during the Safe Mode has been filled for this Figure, but is assigned NaN in the MAST archive.
The output of PDC is referred to as ‘corrected’ data in the delivered files. Users are cautioned that systematic errors remain, and their removal is the subject of ongoing effort as described in Section 3.3.
KSCI-19043-001: Kepler Data Release 3 Notes 1/20/2010
20 of 58
5. Lost or Degraded Data
In this Section, we discuss cadences which are essentially lost to high-precision photometry due to planned or unplanned spacecraft events. Particularly annoying and unexpected phenomena are written up as Kepler Anomaly Reports (KARs) or SOC change requests (KSOCs). While KARs and KSOCs are not available to users, the KAR number is listed at the end of each Section for Science Office internal reference.
5.1 Momentum Desaturation
Solar radiation torque causes angular momentum to build up in the reaction wheels, which then must be desaturated by thruster firings when the wheels spin up to their maximum operating RPM. Desats occur every 3.0 days. The spacecraft (S/C) is not designed to maintain Fine Point control during these events, and enters Coarse Point mode. The subsequent image motion is sufficient to spoil the photometric precision of data collected during desats, and a few minutes after desats during which the S/C restores Fine Point control. One LC and several SCs are affected for each desaturation.
The momentum dump cadences have NaNs in the delivered light curve files, while the dump cadences have finite values in the uncalibrated and calibrated pixels. The dump cadences are listed in Table 2 so that users of time series will know which NaNs are due to desats, and users of pixel data will know which cadences to exclude from their own analyses. Tables of the more numerous SCs afflicted by desats is included in the Supplement, though they duplicate some of the information in the SC data anomaly tables (Section 5.3.6).
Table 2: Momentum dumps in Q2 and the corresponding Long Cadences. CIN = Cadence Interval Number, RCI = Relative Cadence Index
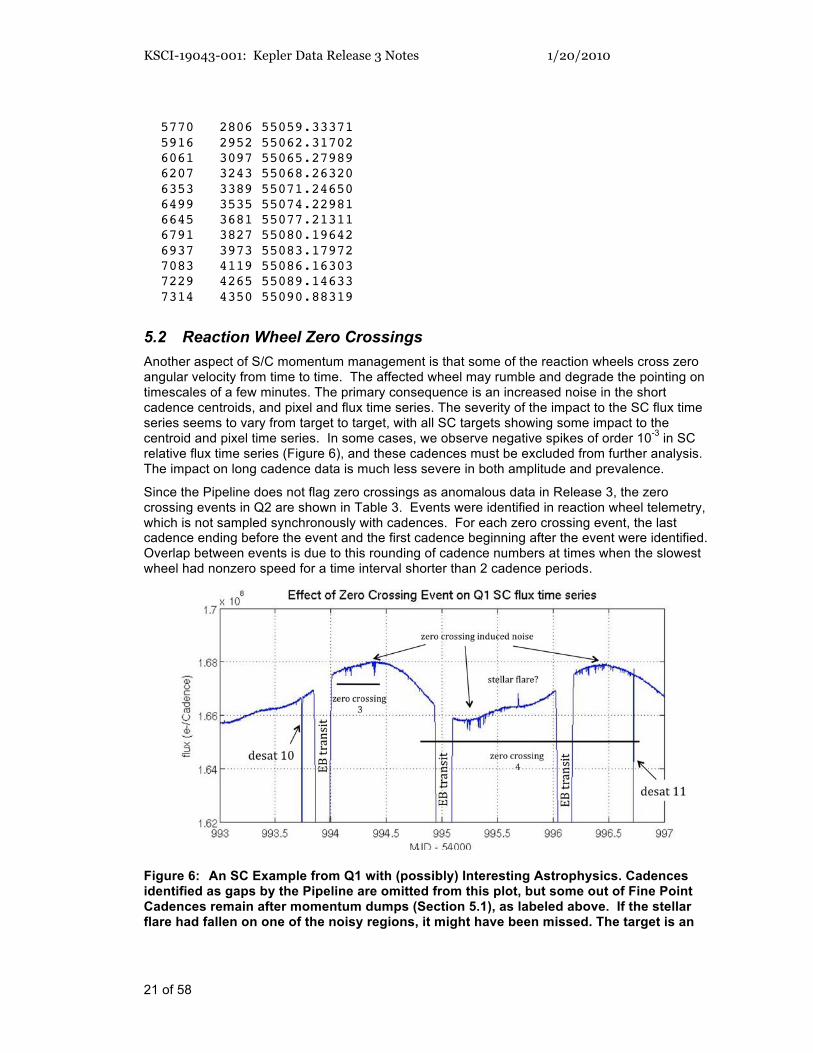
Another aspect of S/C momentum management is that some of the reaction wheels cross zero angular velocity from time to time. The affected wheel may rumble and degrade the pointing on timescales of a few minutes. The primary consequence is an increased noise in the short cadence centroids, and pixel and flux time series. The severity of the impact to the SC flux time series seems to vary from target to target, with all SC targets showing some impact to the centroid and pixel time series. In some cases, we observe negative spikes of order 10
-3 in SC
relative flux time series (Figure 6), and these cadences must be excluded from further analysis. The impact on long cadence data is much less severe in both amplitude and prevalence.
Since the Pipeline does not flag zero crossings as anomalous data in Release 3, the zero crossing events in Q2 are shown in Table 3. Events were identified in reaction wheel telemetry, which is not sampled synchronously with cadences. For each zero crossing event, the last cadence ending before the event and the first cadence beginning after the event were identified. Overlap between events is due to this rounding of cadence numbers at times when the slowest wheel had nonzero speed for a time interval shorter than 2 cadence periods.
Figure 6: An SC Example from Q1 with (possibly) Interesting Astrophysics. Cadences identified as gaps by the Pipeline are omitted from this plot, but some out of Fine Point Cadences remain after momentum dumps (Section 5.1), as labeled above. If the stellar flare had fallen on one of the noisy regions, it might have been missed. The target is an
KSCI-19043-001: Kepler Data Release 3 Notes 1/20/2010
22 of 58
eclipsing binary, with the transits indicated by ‘EB transit’). Zero-crossings are not flagged as bad data or corrected in the MAST data.
Table 3: Zero crossing events in Q2, defined as the time from first to last zero in the event, rounded to the nearest cadence. This Table is included in the Supplement as file Q2_ZeroCrossing_Table.txt.
Kepler Data Release Notes 3 Supplement
Zero Crossing Listing
Prepared by the DAWG
This file created: 18-Dec-2009 11:00:55
This file created: MJD 55183.45897
Cadence Numbers
LC midTime MJD Long Cadence Short Cadence
Event# Start End Start End Start End
1 55012.745 55012.786 3490 3492 93200 93230
2 55012.766 55013.133 3491 3509 93231 93727
3 55018.078 55018.262 3751 3760 101023 101268
4 55023.575 55023.698 4020 4026 109078 109240
5 55032.464 55032.545 4455 4459 122148 122239
6 55035.447 55035.508 4601 4604 126528 126593
7 55035.508 55035.590 4604 4608 126604 126705
8 55038.430 55038.553 4747 4753 130908 131046
9 55041.536 55041.638 4899 4904 135472 135579
10 55041.638 55041.720 4904 4908 135613 135701
11 55047.400 55047.462 5186 5189 144059 144129
12 55083.282 55083.302 6942 6943 196740 196755
13 55083.282 55083.793 6942 6967 196758 197466
14 55086.919 55087.328 7120 7140 202077 202667
Reference: KAR-529
5.3 Data Anomalies
5.3.1 Safe Mode
From time to time, the Kepler Spacecraft will go into Safe Mode, because of an unanticipated sensitivity to cosmic radiation, or unanticipated responses to command sequences. While each individual event is unexpected, it is not unusual for newly-commissioned spacecraft to experience them, until the in-orbit idiosyncrasies of the flight system are understood. In Quarter 2, there was a Safe Mode event between MJD 55014.03 and 55016.19, as shown in Table 4, Figure 4, and Figure 5. The LDE was turned off, but data previously collected remained in the Solid State Recorder (SSR) for retrieval after Safe Mode recovery. Data collected after resumption of science data collection shows a trend strongly correlated with the warmup of the LDE boards, which is for the most part mitigated by PDC (Section 4.4). For Q3 and subsequent Quarters,
KSCI-19043-001: Kepler Data Release 3 Notes 1/20/2010
23 of 58
Kepler’s Flight Software has been modified to leave the LDE on during Safe Mode events, so that data degradation due to thermal transients after an LDE power cycle is minimized.
5.3.2 Loss of Fine Point
From time to time, the Kepler spacecraft will lose fine pointing control, rendering the cadences collected useless for photometry of better than 1% precision. The cause of these Loss of Fine Point (LOFP) events is presently under investigation. While the LOFPs are treated as lost data by the Pipeline, users with sources for which ~1% photometry is scientifically interesting may wish to look at the pixel data corresponding to those cadences, shown in Table 4.
5.3.3 Pointing Drift and Attitude Tweaks
Daily reference pixels are used by the SOC/SO to measure S/C attitude. The SOC PDQ software uses centroids of 3-4 stars per module/output to determine the measured boresight attitude compared with the pointing model (which accounts for differential velocity aberration). The maximum attitude residual (MAR) is a measure of how far the worst stars have drifted from the pixel location for which their target aperture was designed. Since continued attitude drift would invalidate target aperture definitions and lead to large photometric errors, small attitude adjustments (“tweaks”) were performed when MAR exceeded 30 mpix and had a drift rate in excess of 1.0 mpix/day, in order to ensure that MAR was always < 100 mpix. While the tweaks corrected the pointing, they introduced discontinuities into the data which were not anticipated by the Pipeline. There were no tweaks in Q0 and Q1 because of their short durations, and none in Q3 since the drift was an order of magnitude less than in Q2.
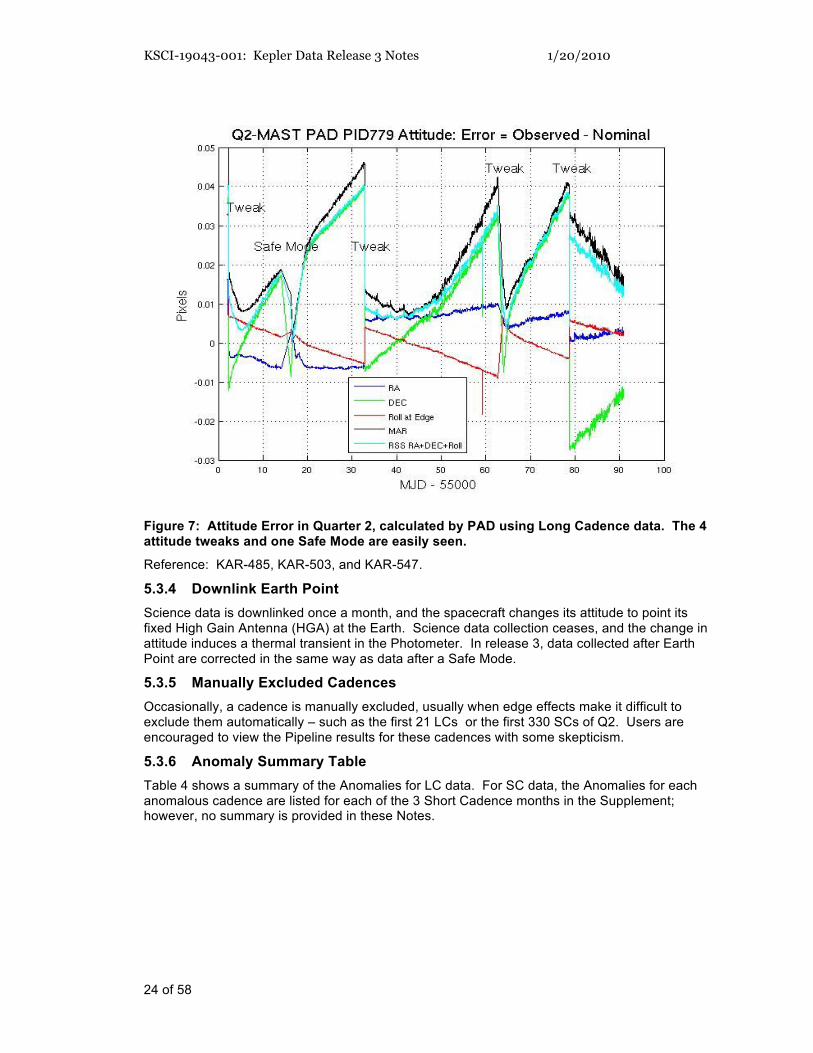
At the end of each month’s data collection, the Photometer Attitude Determination (PAD) software reconstructs the attitude using the Long Cadence science data. The PAD attitude residuals (RA, Dec, roll) for Q2 are shown in Figure 7. While the maximum attitude residual (MAR) remains less than 100 mpix as required, discontinuities due to tweaks and the Safe Mode event are easily seen.
KSCI-19043-001: Kepler Data Release 3 Notes 1/20/2010
24 of 58
Figure 7: Attitude Error in Quarter 2, calculated by PAD using Long Cadence data. The 4 attitude tweaks and one Safe Mode are easily seen.
Reference: KAR-485, KAR-503, and KAR-547.
5.3.4 Downlink Earth Point
Science data is downlinked once a month, and the spacecraft changes its attitude to point its fixed High Gain Antenna (HGA) at the Earth. Science data collection ceases, and the change in attitude induces a thermal transient in the Photometer. In release 3, data collected after Earth Point are corrected in the same way as data after a Safe Mode.
5.3.5 Manually Excluded Cadences
Occasionally, a cadence is manually excluded, usually when edge effects make it difficult to exclude them automatically – such as the first 21 LCs or the first 330 SCs of Q2. Users are encouraged to view the Pipeline results for these cadences with some skepticism.
5.3.6 Anomaly Summary Table
Table 4 shows a summary of the Anomalies for LC data. For SC data, the Anomalies for each anomalous cadence are listed for each of the 3 Short Cadence months in the Supplement; however, no summary is provided in these Notes.
KSCI-19043-001: Kepler Data Release 3 Notes 1/20/2010
25 of 58
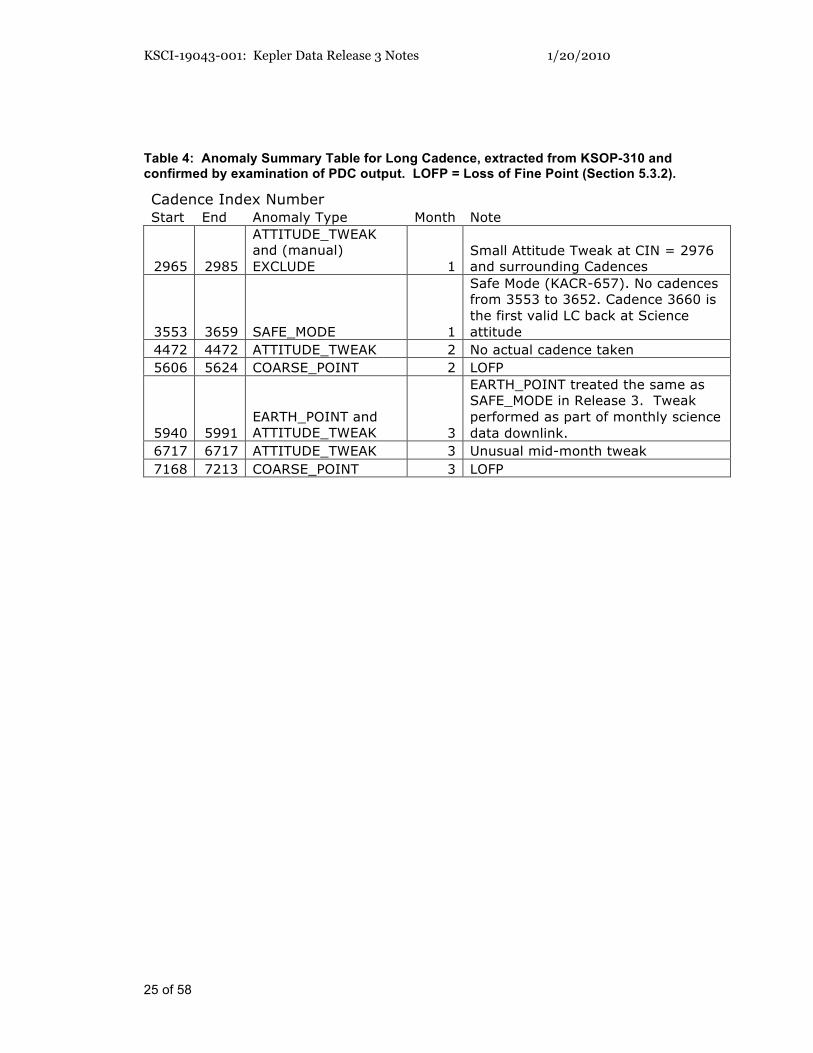
Table 4: Anomaly Summary Table for Long Cadence, extracted from KSOP-310 and confirmed by examination of PDC output. LOFP = Loss of Fine Point (Section 5.3.2).
Cadence Index Number
Start End Anomaly Type Month Note
2965 2985
ATTITUDE_TWEAK
and (manual)
EXCLUDE 1
Small Attitude Tweak at CIN = 2976
and surrounding Cadences
3553 3659 SAFE_MODE 1
Safe Mode (KACR-657). No cadences
from 3553 to 3652. Cadence 3660 is
the first valid LC back at Science
attitude
4472 4472 ATTITUDE_TWEAK 2 No actual cadence taken
KSCI-19043-001: Kepler Data Release 3 Notes 1/20/2010
26 of 58
6. Systematic Errors
This Section discusses systematic errors arising in on-orbit operations, most of which will be removed from flux time series by PDC (Section 4). However, since the Release 3 data is detrended only against centroid motion and the board temperature PEDDRV4T, other telemetry items which may be used for detrending the data in future releases are included so that users can at least qualitatively assess whether features in the time series look suspiciously like features in the telemetry items. In addition, PDC corrects systematic effects only in the flux time series, and this Section may be useful for users interested in centroids or pixel data.
While most of the events described in this Section are either reported by the spacecraft or detected in the Pipeline and either corrected or gap-filled, this Section reports events at lower thresholds than the Pipeline which may be of interest to some users.
6.1 Argabrightening
Argabrightening, named after its discoverer V. Argabright of BATC, is a presently unexplained diffuse illumination of the focal plane, lasting on the order of a few minutes. It is known to be light rather than an electronic offset since it appears in calibrated pixel data from which the electronic black level has been removed using the collateral data. It is not a result of gain change, or of targets moving in their apertures, since the phenomenon appears with the same amplitude in background pixels (in LC) or pixels outside the optimal aperture (in SC) as well as stellar target pixels. Many channels are affected simultaneously, and the amplitude of the event on each channel is many standard deviations above the trend. The method of detection is to fit a trend line to calibrated background (LC) or out-of-optimal-aperture (SC) pixels, fit a parabola, smooth the residual, and look for outliers in the difference between the residual and the smoothed residual. The Pipeline identifies Argabrightenings with this method, and subsequently treats those cadences as gaps. The Pipeline does not identify multichannel events, but instead processes each channel in isolation.
The Pipeline uses a rather high threshold of 100x the median absolute deviation (MAD) for LC and 60x for SC. While it appears that background subtraction has mostly removed this phenomenon from the delivered Long Cadence data, the residual effect has not been proven to be negligible in all cases, especially in Short Cadence data. There may also be significant Argabrightening events in both LC and SC which do not exceed the default thresholds.
This Section gives a summary of events which exceed a 10x MAD threshold on at least 11 channels (Table 5 and Table 6), so that the user may consider whether some cadences of interest might be afflicted by Argabrightening, but not identified as such by the Pipeline and gapped (i.e., NaN in the light curve file). The Supplement contains channel-by-channel results.
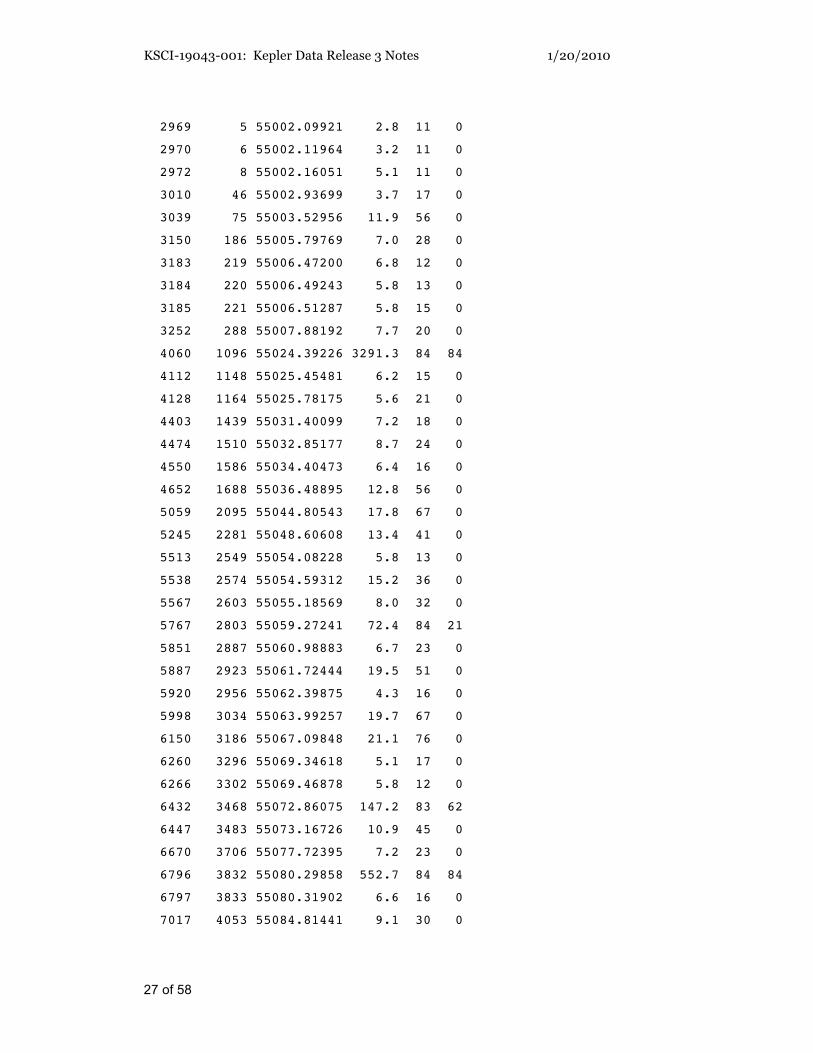
Table 5: Q2 LC Argabrightening Events with amplitude greater than 10x the median absolute deviation (MAD), which occurred simultaneously on at least 11 of the 84 channels. The columns are 1) CIN = Cadence Interval Number for Argabrightening Cadences, 2) RCI = Relative Cadence Index for Argabrightening Cadences, 3) Date = Arg Cadence mid-Times, MJD, 4) Mean SNR over Channels of Arg Event, 5) N_chan = Channels exceeding threshold in Arg Cadence, 6) N_pipe = Channels exceeding default (Pipeline) threshold in ArgCadence. MAD is calculated on a channel-by-channel basis. Number of Arg Events Detected: 40. Events Per Month: 13.5. Note that largest event so far observed is for CIN = 4060.
CIN RCI Date (MJD) MeanSNR N_chan N_pipe
2967 3 55002.05834 2.5 14 0
2968 4 55002.07878 2.9 17 0
KSCI-19043-001: Kepler Data Release 3 Notes 1/20/2010
27 of 58
2969 5 55002.09921 2.8 11 0
2970 6 55002.11964 3.2 11 0
2972 8 55002.16051 5.1 11 0
3010 46 55002.93699 3.7 17 0
3039 75 55003.52956 11.9 56 0
3150 186 55005.79769 7.0 28 0
3183 219 55006.47200 6.8 12 0
3184 220 55006.49243 5.8 13 0
3185 221 55006.51287 5.8 15 0
3252 288 55007.88192 7.7 20 0
4060 1096 55024.39226 3291.3 84 84
4112 1148 55025.45481 6.2 15 0
4128 1164 55025.78175 5.6 21 0
4403 1439 55031.40099 7.2 18 0
4474 1510 55032.85177 8.7 24 0
4550 1586 55034.40473 6.4 16 0
4652 1688 55036.48895 12.8 56 0
5059 2095 55044.80543 17.8 67 0
5245 2281 55048.60608 13.4 41 0
5513 2549 55054.08228 5.8 13 0
5538 2574 55054.59312 15.2 36 0
5567 2603 55055.18569 8.0 32 0
5767 2803 55059.27241 72.4 84 21
5851 2887 55060.98883 6.7 23 0
5887 2923 55061.72444 19.5 51 0
5920 2956 55062.39875 4.3 16 0
5998 3034 55063.99257 19.7 67 0
6150 3186 55067.09848 21.1 76 0
6260 3296 55069.34618 5.1 17 0
6266 3302 55069.46878 5.8 12 0
6432 3468 55072.86075 147.2 83 62
6447 3483 55073.16726 10.9 45 0
6670 3706 55077.72395 7.2 23 0
6796 3832 55080.29858 552.7 84 84
6797 3833 55080.31902 6.6 16 0
7017 4053 55084.81441 9.1 30 0
KSCI-19043-001: Kepler Data Release 3 Notes 1/20/2010
28 of 58
7045 4081 55085.38655 25.9 73 0
7216 4252 55088.88069 10.0 43 0
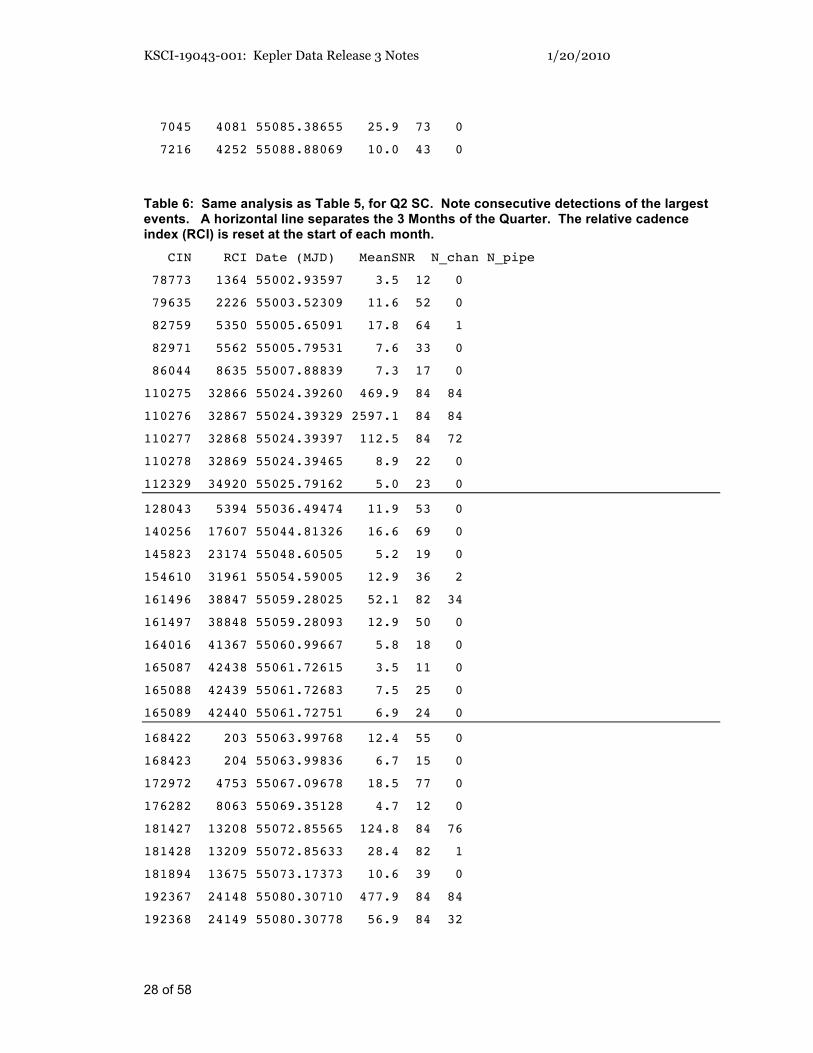
Table 6: Same analysis as Table 5, for Q2 SC. Note consecutive detections of the largest events. A horizontal line separates the 3 Months of the Quarter. The relative cadence index (RCI) is reset at the start of each month.
CIN RCI Date (MJD) MeanSNR N_chan N_pipe
78773 1364 55002.93597 3.5 12 0
79635 2226 55003.52309 11.6 52 0
82759 5350 55005.65091 17.8 64 1
82971 5562 55005.79531 7.6 33 0
86044 8635 55007.88839 7.3 17 0
110275 32866 55024.39260 469.9 84 84
110276 32867 55024.39329 2597.1 84 84
110277 32868 55024.39397 112.5 84 72
110278 32869 55024.39465 8.9 22 0
112329 34920 55025.79162 5.0 23 0
128043 5394 55036.49474 11.9 53 0
140256 17607 55044.81326 16.6 69 0
145823 23174 55048.60505 5.2 19 0
154610 31961 55054.59005 12.9 36 2
161496 38847 55059.28025 52.1 82 34
161497 38848 55059.28093 12.9 50 0
164016 41367 55060.99667 5.8 18 0
165087 42438 55061.72615 3.5 11 0
165088 42439 55061.72683 7.5 25 0
165089 42440 55061.72751 6.9 24 0
168422 203 55063.99768 12.4 55 0
168423 204 55063.99836 6.7 15 0
172972 4753 55067.09678 18.5 77 0
176282 8063 55069.35128 4.7 12 0
181427 13208 55072.85565 124.8 84 76
181428 13209 55072.85633 28.4 82 1
181894 13675 55073.17373 10.6 39 0
192367 24148 55080.30710 477.9 84 84
192368 24149 55080.30778 56.9 84 32
KSCI-19043-001: Kepler Data Release 3 Notes 1/20/2010
29 of 58
192369 24150 55080.30846 7.2 21 0
198972 30753 55084.80589 7.3 25 0
199833 31614 55085.39234 11.4 41 0
199834 31615 55085.39302 14.9 64 0
204959 36740 55088.88376 9.2 34 0
Reference: KAR-479
6.2 Variable FGS Guide Stars
The first-moment centroiding algorithm used by the FGS did not originally subtract all of the instrumental bias from the FGS pixels. Thus, the calculated centroid of an FGS star depended on the FGS star’s flux when the star was not located at the center of the centroiding aperture. Variable stars then induced a variation in the attitude solution calculated from the centroids of 40 guide stars, 10 in each FGS module. The Attitude Determination and Control System (ADCS), which attempts to keep the calculated attitude of the S/C constant, then moved the S/C to respond to this varying input, with the result that the boresight of the telescope moved while the ADCS reported a constant attitude. Science target star centroids and pixel time series, and to a lesser extent aperture flux, then showed systematic errors proportional to the FGS star flux variation. While the detrending against motion polynomials described in Section 4.4 should have removed these errors, users wishing to work with uncorrected light curves (the output of PA, Section 4.3) or with the calibrated pixels need to be aware of possible FGS variability-induced signatures and not mistake them for features of their target light curves.
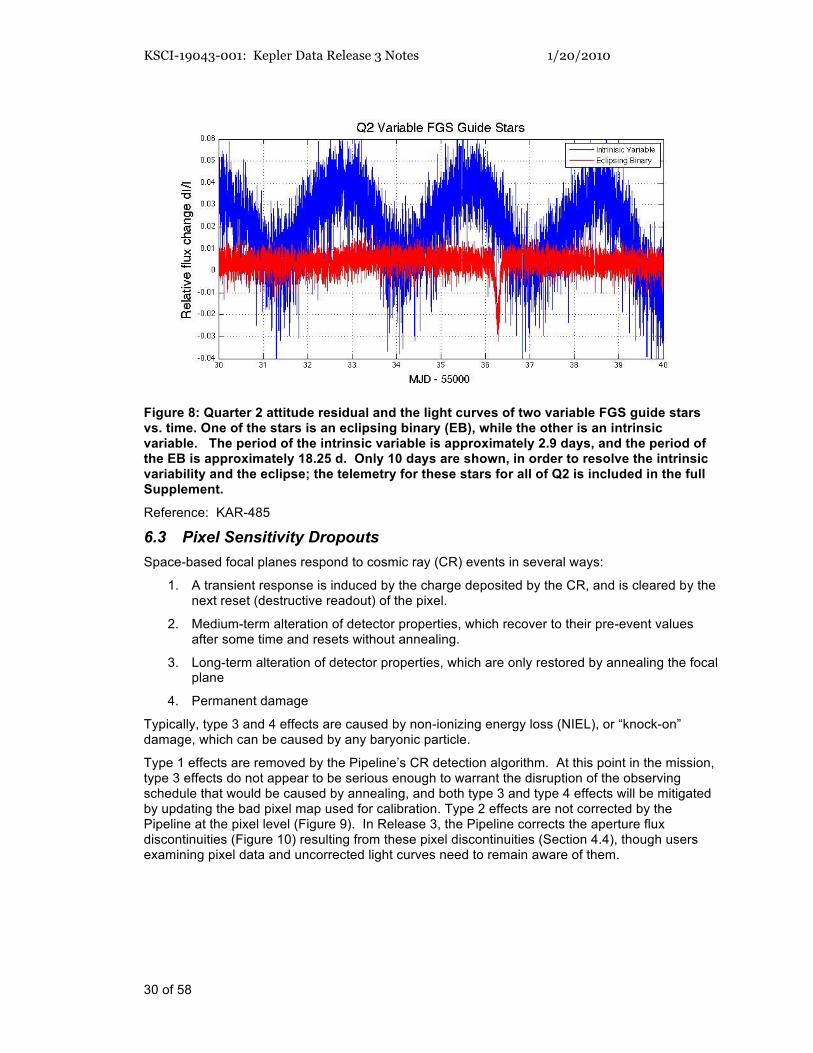
The most egregious variable stars were replaced with quieter stars at the start of Quarter 2 (6/20/2009). One intrinsic variable star and one eclipsing binary (EB) remain in the FGS, as shown in Figure 8, and their light curves for Q2 are included in the Supplement. The effect of the intrinsic variable star can be seen as oscillations in the PAD attitude solution with the same period (2.9 d, see for example RA between MJD 55033 and 55055 in Figure 7).
The centroiding algorithm was updated to remove all of the instrumental background after the start of Quarter 3 (9/19/2009), greatly diminishing the effect of stellar variability on calculated centroids. The sky background is not removed, but is expected to be negligible. FGS guide star variability is not a factor in Q3.
KSCI-19043-001: Kepler Data Release 3 Notes 1/20/2010
30 of 58
Figure 8: Quarter 2 attitude residual and the light curves of two variable FGS guide stars vs. time. One of the stars is an eclipsing binary (EB), while the other is an intrinsic variable. The period of the intrinsic variable is approximately 2.9 days, and the period of the EB is approximately 18.25 d. Only 10 days are shown, in order to resolve the intrinsic variability and the eclipse; the telemetry for these stars for all of Q2 is included in the full Supplement.
Reference: KAR-485
6.3 Pixel Sensitivity Dropouts
Space-based focal planes respond to cosmic ray (CR) events in several ways:
1. A transient response is induced by the charge deposited by the CR, and is cleared by the next reset (destructive readout) of the pixel.
2. Medium-term alteration of detector properties, which recover to their pre-event values after some time and resets without annealing.
3. Long-term alteration of detector properties, which are only restored by annealing the focal plane
4. Permanent damage
Typically, type 3 and 4 effects are caused by non-ionizing energy loss (NIEL), or “knock-on” damage, which can be caused by any baryonic particle.
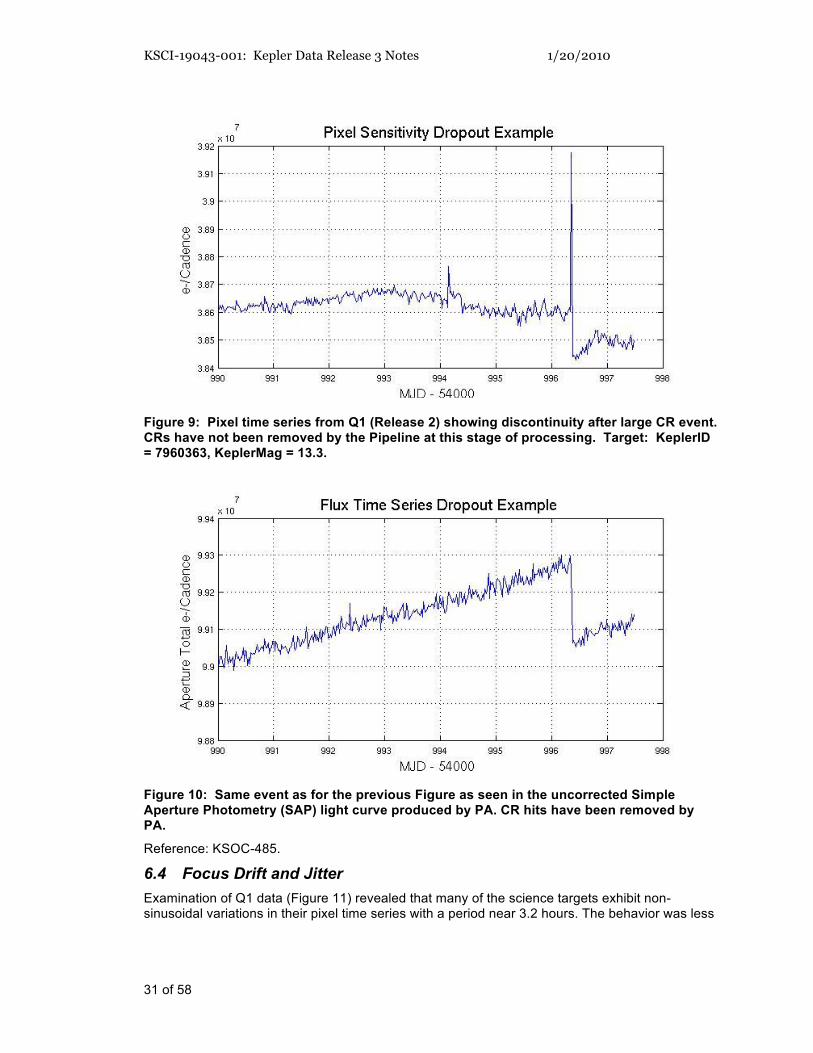
Type 1 effects are removed by the Pipeline’s CR detection algorithm. At this point in the mission, type 3 effects do not appear to be serious enough to warrant the disruption of the observing schedule that would be caused by annealing, and both type 3 and type 4 effects will be mitigated by updating the bad pixel map used for calibration. Type 2 effects are not corrected by the Pipeline at the pixel level (Figure 9). In Release 3, the Pipeline corrects the aperture flux discontinuities (Figure 10) resulting from these pixel discontinuities (Section 4.4), though users examining pixel data and uncorrected light curves need to remain aware of them.
KSCI-19043-001: Kepler Data Release 3 Notes 1/20/2010
31 of 58
Figure 9: Pixel time series from Q1 (Release 2) showing discontinuity after large CR event. CRs have not been removed by the Pipeline at this stage of processing. Target: KeplerID = 7960363, KeplerMag = 13.3.
Figure 10: Same event as for the previous Figure as seen in the uncorrected Simple Aperture Photometry (SAP) light curve produced by PA. CR hits have been removed by PA.
Reference: KSOC-485.
6.4 Focus Drift and Jitter
Examination of Q1 data (Figure 11) revealed that many of the science targets exhibit non-sinusoidal variations in their pixel time series with a period near 3.2 hours. The behavior was less
KSCI-19043-001: Kepler Data Release 3 Notes 1/20/2010
32 of 58
frequent at the beginning of Q1 and becomes progressively worse with time. Initially, this phenomenon was associated with desaturation activities, but became nearly continuous about 15 days into the observations.
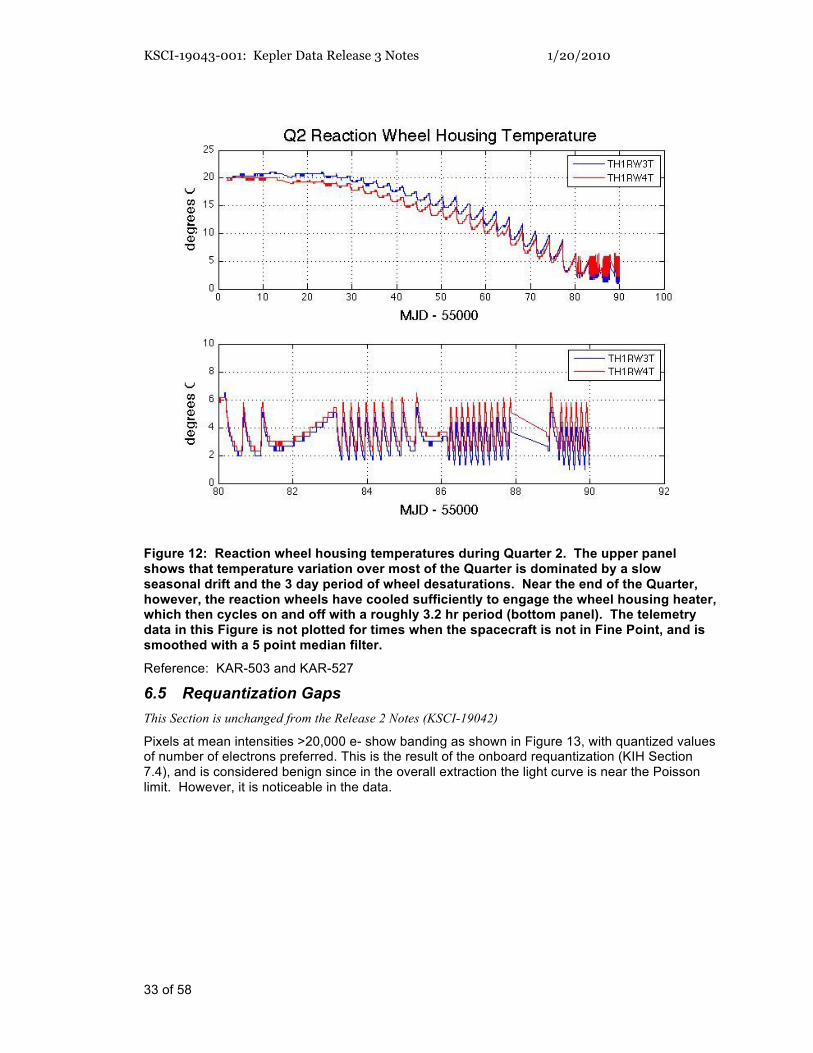
This jitter is observed in platescale metrics local to each mod/out defined by the motion of target star centroids relative to one another over time. This indicates that we are seeing a change in focus at timescales of 3.2 hours and that the behavior appears to be initiated by the desat activities. Reaction wheel temperature sensors with the mnemonics TH1RW3Tand TH1RW4T have the same time signature, but the physical mechanism by which it is coupled to plate scale is still under discussion. At the beginning of a Quarter, the reaction wheel heaters do not cycle on and off, and the temperature changes have the same 3 day interval as the planned desaturations (Figure 12). Later in the Quarter, the heaters cycle with a roughly 3.2 hr period. This temperature sensor telemetry for Q2 is provided in the Supplement.
Figure 11: A good example of the 3.2 hr Focus Oscillation in a single raw pixel time series from Quarter 1. Similar signatures are seen in flux and plate scale. The large negative-going spikes are caused by desaturations (Section 5.1), which have not been removed from this time series in this plot. The abscissa is the Q1 relative cadence index, and the ordinate is Data Numbers (DN) per Long Cadence (LC).
KSCI-19043-001: Kepler Data Release 3 Notes 1/20/2010
33 of 58
Figure 12: Reaction wheel housing temperatures during Quarter 2. The upper panel shows that temperature variation over most of the Quarter is dominated by a slow seasonal drift and the 3 day period of wheel desaturations. Near the end of the Quarter, however, the reaction wheels have cooled sufficiently to engage the wheel housing heater, which then cycles on and off with a roughly 3.2 hr period (bottom panel). The telemetry data in this Figure is not plotted for times when the spacecraft is not in Fine Point, and is smoothed with a 5 point median filter.
Reference: KAR-503 and KAR-527
6.5 Requantization Gaps
This Section is unchanged from the Release 2 Notes (KSCI-19042)
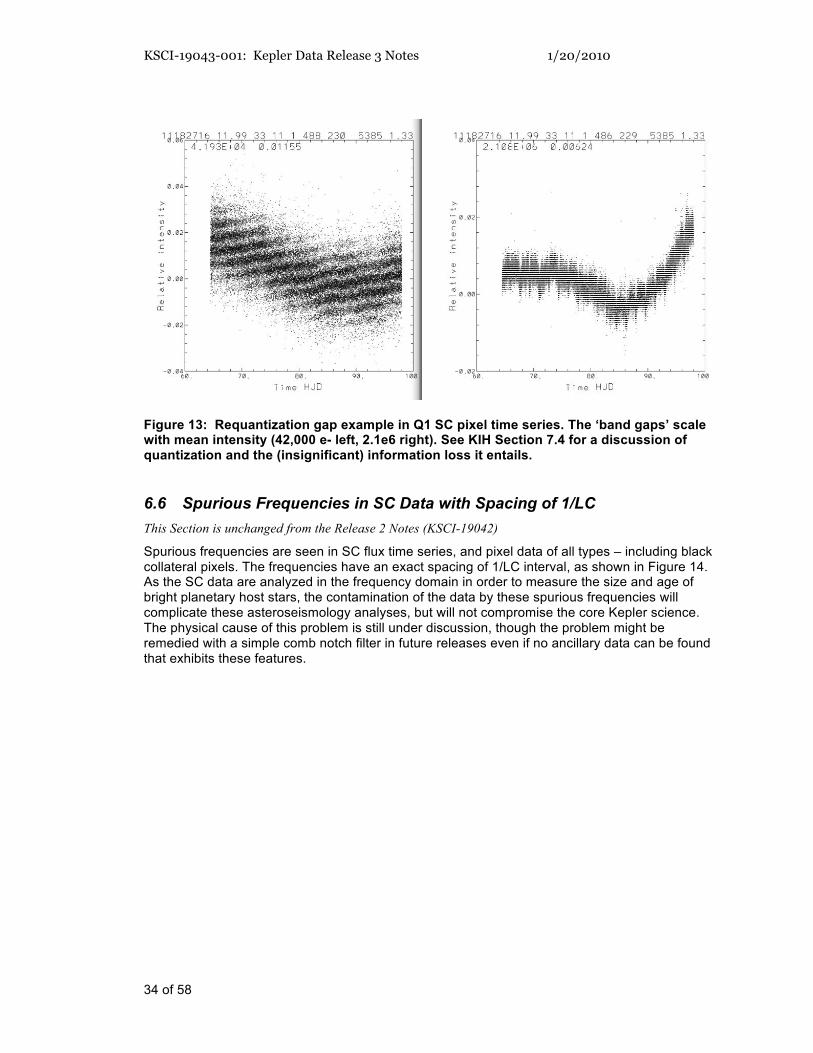
Pixels at mean intensities >20,000 e- show banding as shown in Figure 13, with quantized values of number of electrons preferred. This is the result of the onboard requantization (KIH Section 7.4), and is considered benign since in the overall extraction the light curve is near the Poisson limit. However, it is noticeable in the data.
KSCI-19043-001: Kepler Data Release 3 Notes 1/20/2010
34 of 58
Figure 13: Requantization gap example in Q1 SC pixel time series. The ‘band gaps’ scale with mean intensity (42,000 e- left, 2.1e6 right). See KIH Section 7.4 for a discussion of quantization and the (insignificant) information loss it entails.
6.6 Spurious Frequencies in SC Data with Spacing of 1/LC
This Section is unchanged from the Release 2 Notes (KSCI-19042)
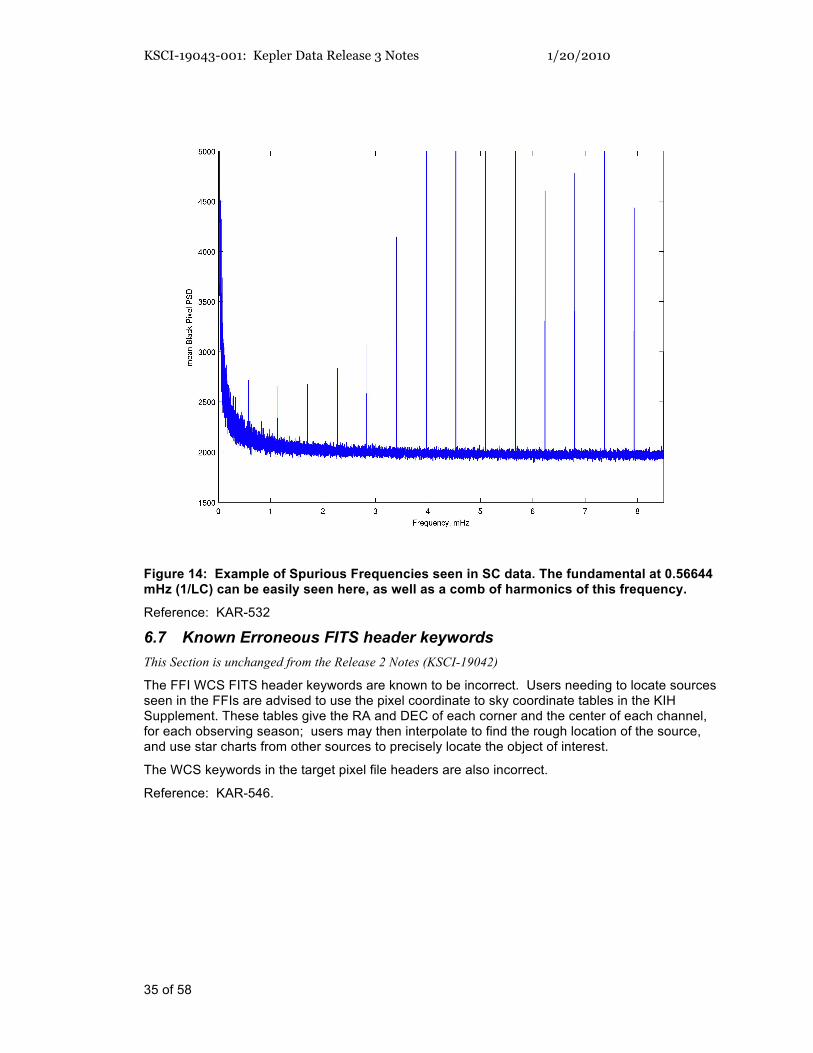
Spurious frequencies are seen in SC flux time series, and pixel data of all types – including black collateral pixels. The frequencies have an exact spacing of 1/LC interval, as shown in Figure 14. As the SC data are analyzed in the frequency domain in order to measure the size and age of bright planetary host stars, the contamination of the data by these spurious frequencies will complicate these asteroseismology analyses, but will not compromise the core Kepler science. The physical cause of this problem is still under discussion, though the problem might be remedied with a simple comb notch filter in future releases even if no ancillary data can be found that exhibits these features.
KSCI-19043-001: Kepler Data Release 3 Notes 1/20/2010
35 of 58
Figure 14: Example of Spurious Frequencies seen in SC data. The fundamental at 0.56644 mHz (1/LC) can be easily seen here, as well as a comb of harmonics of this frequency.
Reference: KAR-532
6.7 Known Erroneous FITS header keywords
This Section is unchanged from the Release 2 Notes (KSCI-19042)
The FFI WCS FITS header keywords are known to be incorrect. Users needing to locate sources seen in the FFIs are advised to use the pixel coordinate to sky coordinate tables in the KIH Supplement. These tables give the RA and DEC of each corner and the center of each channel, for each observing season; users may then interpolate to find the rough location of the source, and use star charts from other sources to precisely locate the object of interest.
The WCS keywords in the target pixel file headers are also incorrect.
Reference: KAR-546.
KSCI-19043-001: Kepler Data Release 3 Notes 1/20/2010
36 of 58
7. Data Delivered – Format
7.1 FFI
The FFIs are one FITS file per image, with 84 extensions, one for each module/output. See the KIH to map the extension table number = channel number onto module and output.
7.2 Light Curves
Users are strongly encouraged to read this section. While the text is similar to that of Release 2,
significant changes to the time units and table format have been made.
Light curves have file names like kplr<kepler_id>-<stop_time>, with a suffix of either llc (long cadence) or slc (short cadence), and a file name extension of fits.
A light curve is time series data, that is, a series of data points in time. Each data point corresponds to a measurement from a cadence. For each data point, the flux value from simple aperture photometry (SAP) is given, along with the associated uncertainty. Only SAP light curves are available at this time. The centroid position for the target and time of the data point is also included.
The light curves are packaged as FITS binary table files. The fields of the binary table, all of which are scalar, are briefly described below and are listed in Table 7. There are 19 fields comprising 88 bytes per cadence; however, fields 12-19 are not populated at this time. The FITS table header listed in the Appendix of the MAST manual is superseded by Table 7. The new
keywords DATA_REL and QUARTER are in the binary table header. Users wishing to identify the module and output on which a target is located must download the pixel data files or use MAST (use the table shown at http://archive.stsci.edu/kepler/kepler_fov/help/search_help.html to select the season number).
The following data values are given for each data point in a light curve:
• barycentric time and time correction for the midpoint of the cadence • for the simple aperture photometry (pixel sum) of optimal aperture pixels
- first-moment centroid position of the target and uncertainty - raw flux value and uncertainty. Gap Cadences are set to NaN - corrected un-filled flux value and uncertainty. Gap Cadences are set to NaN
Table 7: Available light curve data table fields, modified after the MAST manual: SAP replaces OAP, and data in columns 11-18 is not available and are filled with NaN. Note the significant redefinition of time units compared to Release 2.
Column Data
Number Field Name Type Bytes Description Units
1 barytime 1D 8
barycentric time BJD –
2400000* days
2 timcorr 1E 4 barycentric time correction* seconds
3 cadence_number 1J 4 cadence number (CIN) N/A
4 ap_cent_row 1D 8 row pixel location pixels
5 ap_cent_r_err 1E 4 error in row pixel location pixels
6 ap_cent_col 1D 8 column pixel location Pixels
7 ap_cent_c_err 1E 4 error in column pixel location pixels
8 ap_raw_flux 1E 4 SAP raw flux e- / cadence
9 ap_raw_err 1E 4 SAP raw flux error e- / cadence
10 ap_corr_flux 1E 4 SAP corrected un-filled flux e- / cadence
KSCI-19043-001: Kepler Data Release 3 Notes 1/20/2010
37 of 58
11 ap_corr_err 1E 4
SAP corrected un-filled flux
error e- / cadence
Data Types:
1D – double precision floating point.
1E – single precision floating point. Note that, although all SOC calculations and internal data representation is double-precision, the SAP fluxes and errors are reported as single-precision floats, which will give roundoff errors of approximately 0.11 ppm (Numerical Recipes Chapter 20 & confirmed by numerical experiments on MAST and internal SOC data).
1J – 32 bit integer
*See Section 7.4 for a discussion of time and time stamps.
In future Releases, the instrument magnitude flux value will provide an “Instrument magnitude flux time series” that is scaled to astronomically meaningful values as best they can be reconstructed.
Instrument Magnitude flux time series are not available at this time.
If you are an IDL user, the tbget program in the astrolib library extracts the data. If you are
an IRAF user, tprint can be used to dump an ascii table of selected row and column values.
7.3 Pixels
This Section is unchanged from the Release 2 Notes (KSCI-19042)
Target pixel data files are produced for each target from the calibrated data returned from the SOC. These are not cadence data, which contain all targets. Up to 5 different files are produced for each target. These consist of the long and short cadence pixel data for the target, the collateral pixels for the long and short cadences, and the background pixels
Both original pixel values and calibrated flux values are in the pixel data files. The original pixel value is the integer value as recorded on the spacecraft. The calibrated pixel value is that provided by the SOC. Oddly enough, the sum of calibrated pixel values is called the ‘raw’ light curve value.
The original and flux calibrated values are listed for each pixel.
The target pixel data files are archived as a dataset. A request for the data will return all extensions that were archived with the dataset.
Pixel data table fields are described in the Kepler Archive Manual (KDMC-10008).
7.4 Time and Time Stamps
Users are urged to read this Section as considerable changes have been made to the time stamps since
Release 2.
7.4.1 Overview
The precision and accuracy of the time assigned to a cadence are limited by the intrinsic precision and accuracy of the hardware and the promptness and reproducibility of the flight software time-stamping process. The Flight System requirement, including both hardware and software contributions, is that the absolute time of the start and end of each cadence is known to ±50 ms. This requirement was developed so that knowledge of astrophysical event times would be limited by the characteristics of the event, rather than the characteristics of the flight system, even for high SNR events.
Several factors must be accounted for before approaching the 50 ms limit:
KSCI-19043-001: Kepler Data Release 3 Notes 1/20/2010
38 of 58
1. Relate readout time of a pixel to Vehicle Time Code (VTC) recorded for that pixel and cadence in the SSR. The VTC stamp of a cadence is created within 4 ms after the last pixel of the last frame of the last time slice of that cadence is read out from the LDE.
2. VTC to UTC of end of Cadence, using Time Correlation Coefficients. Done by DMC, with precision and accuracy to be documented.
3. Convert UTC to Barycentric JD. This is done in PA (Section 4.3). The amplitude of the
barycentric correction is approximately (aK/c)cos" , where aK ~ 1.02 AU is the semi-major
axis of Kepler’s approximately circular (eK < 0.04) orbit around the Sun, c the speed of
light, and " is the ecliptic latitude of the target. In the case of the center of the Kepler
FOV, with " = 65 degrees, the amplitude of the UTC to barycentric correction is
approximately +/- 211 s. BJD is later than UTC when Kepler is on the half of its orbit closest to Cygnus (roughly May 1 – Nov 1) and earlier than UTC on the other half of the orbit. Because of the large Kepler FOV, the barycentric correction must be performed on a channel-by-channel basis, and on a target-by-target basis if accuracy within 10 s is required.
4. Add time slice offsets (See KIH Section 5.1). Not done in Release 3. The amplitude of the time slice offset can be up to 3 s. Users wishing to perform their own time slice corrections should see Section 7.4.4.
7.4.2 Comparison of Release 2 and 3 time stamps
Fortunately, errors in items 1 and 2 in the previous Section are negligible, and the various times used in Releases 2, 3, and 4 are related in the following manner, where table fields are shown in
courier and FITS header keywords as COURIER, for 1-based cadence index i:
Cadence files (not visible to user, ingested by SOC):
JD = Julian Date
MJD = Modified Julian Date
MJD = JD - 2400000.5
1. STARTIME(i) = MJD of start of ith cadence
2. END_TIME = MJD of end of ith cadence
3. MID_TIME(i) = MJD of middle of cadence =(STARTIME(i) + END_TIME(i))/2
4. JD(i) = MID_TIME(i) + 2400000.5
Release 2 light curves (no time corrections):
1. LC_START = MID_TIME(1). Units: MJD days
2. LC_END = MID_TIME of last cadence. Units: MJD days
4. LC_START = MJD of beginning of first cadence (uncorrected). Units: days
5. LC_END = MJD of end of last cadence (uncorrected). Units: days
Or, as is summarized in the FITS table header:
COMMENT barytime(i)- timcorr(i)/86400 - 0.5 = utc mjd(i) for cadence_number(i)
Where utc mjd(i) for cadence_number(i) is the same as MID_TIME(i)
7.4.3 Example for Release 3
In cadence files:
STARTIME = 55002.0175
END_TIME = 55090.9649
For a particular target:
barytime(1) = 55002.5188
timcorr(1) = 116.29
barytime(end) = 55091.4670
timcorr(end) = 178.75
7.4.4 Do your own Time Slice Correction
Users wishing to do their own time slice correction should look up the module and output of their target in MAST, identify the time slice from the Detector Properties Table (Table 13) of the
Instrument Handbook, and subtract 0.25 + 0.62(5 – nslice) s from barytime, where nslice is the time slice index (1-5). Note that this correction is NOT the same from Quarter to Quarter, so it is necessary to apply the time slice correction when considering intervals between which span Quarter boundaries.
7.4.5 Caveats and Uncertainties
Factors which users should consider before basing scientific conclusions on time stamps and do-it-yourself time slice corrections are:
1. The precise phasing of an individual pixel with respect to the cadence time stamp (not understood to better than +/- 0.5 s)
2. General and special relativistic effects in the calculation of the barycentric correction. For example, time dilation at Kepler with respect to a clock at rest with respect to the solar system barycenter, but outside the Sun’s gravity well, is 7.5 x 10
-9 = 0.23 s/yr – so these
effects cannot be dismissed out of hand at this level, and must be shown to be negligible at the level of Kepler’s time accuracy requirement of 50 ms or corrected for.
3. The existing corrections have yet to be verified with flight data.
4. Light travel time and relativistic corrections to the user’s target, if the target is a component of a binary system.
The advice of the DAWG is not to consider as scientifically significant relative timing variations less than the read time (0.5 s) or absolute timing accuracy better than one frame time (6.5 s) until such time as the stability and accuracy of time stamps can be documented to near the theoretical limit. The DAWG expects this documentation to be available for Release 4.
KSCI-19043-001: Kepler Data Release 3 Notes 1/20/2010
40 of 58
8. References
Users are encouraged to read papers 7-10 for background, though they are not cited in the text.
1. “Initial Assessment Of The Kepler Photometeric Precision,” W.J. Borucki, NASA Ames Research Center, J. Jenkins, SETI Institute, and the Kepler Science Team (May 30, 2009)
2. “Kepler’s Optical Phase Curve of the Exoplanet HAT-P-7,” W. J. Borucki, Science Vol 325 7 August 2009 p. 709
3. “Pixel Level Calibration in the Kepler Science Operations Center Pipeline,” E. V. Quintana et al., abstract for SPIE Astronomical Instrumentation conference, June 2010.
4. “Photometric Analysis in the Kepler Science Operations Center Pipeline,” J. D. Twicken et al., abstract for SPIE Astronomical Instrumentation conference, June 2010.
5. “Presearch Data Conditioning in the Kepler Science Operations Center Pipeline,” J. D. Twicken et al., abstract for SPIE Astronomical Instrumentation conference, June 2010.
6. Dave Monet, private communication.
7. “Initial Characteristics of Kepler Long Cadence Data for Detecting Transiting Planets,” J. M. Jenkins et al., submitted to ApJ Letters http://arxiv.org/abs/1001.0256
8. “Initial Characteristics of Kepler Short Cadence Data,” R. L. Gilliland et al., submitted to ApJ Letters http://arxiv.org/abs/1001.0142
9. “Overview of the Kepler Science Processing Pipeline,” Jon M. Jenkins et al., submitted to ApJ Letters http://arxiv.org/abs/1001.0258
10. “Discovery and Rossiter-McLaughlin Effect of Exoplanet Kepler-8b,” J. M. Jenkins et al., submitted to ApJ http://arxiv.org/abs/1001.0416
KSCI-19043-001: Kepler Data Release 3 Notes 1/20/2010
41 of 58
9. List of Acronyms and Abbreviations
ACS Advanced Camera for Surveys
ADC Analog to Digital Converter
ADCS Attitude Determination and Control Subsystem
ARP Artifact Removal Pixel
BATC Ball Aerospace & Technologies Corp.
BG BackGround pixel of interest
BOL Beginning Of Life
BPF Band Pass Filter
CAL Pixel Calibration module
CCD Charge Coupled Device
CDPP Combined Differential Photometric Precision
CDS Correlated Double Sampling
CR Cosmic Ray
CSCI Computer Software Configuration Item
CTE Charge Transfer Efficiency
CTI Charge Transfer Inefficiency
DAA Detector Array Assembly
DAP Data Analysis Program
DCA Detector Chip Assembly
DCE Dust Cover Ejection
DIA Differential Image Analysis
DMC Data Management Center
DNL Differential Non-Linearity of A/D converter
DSN Deep Space Network
DV Data Validation module
DVA Differential Velocity Aberration
ECA Electronic Component Assembly
EE Encircled Energy
EOL End of Life
ETEM End-To-End Model of Kepler
FFI Full Field Image
FFL Field Flattener Lens
FGS Fine guidance sensor
FOP Follow-up Observation Program
FOV Field of View
FPA Focal Plane Assembly
FPAA Focal Plane Array Assembly
FSW Flight Software
KSCI-19043-001: Kepler Data Release 3 Notes 1/20/2010
42 of 58
GCR Galactic Cosmic Ray
GO Guest Observer
GUI Graphical User Interface
HGA high-gain antenna
HST Hubble Space Telescope
HZ Habitable Zone
I&T Integration and Test
INL Integral Non-Linearity of A/D converter
IRNU Intra-pixel Response Nonuniformity
KACR Kepler Activity Change Request (for additional data
during Commissioning)
KAR Kepler Anomaly Report
KCB Kepler Control Box
KDAH Kepler Data Analysis Handbook
KIC Kepler Input Catalog
KSOP Kepler Science OPerations
KTD Kepler Tech Demo (simulated star field light source)
LC Long Cadence
LCC Long Cadence Collateral
LDE Local Detector Electronics
LGA low-gain antenna
LOS Line of Sight
LPS LDE Power Supply
LUT look-up table
LV Launch Vehicle
MAD Median Absolute Deviation
MAST Multi-mission Archive at STSci
MJD Modified Julian Date = JD - 2400000.5
MOC Mission Operation Center
MORC Module, Output, Row, Column
NVM Non-Volatile Memory
OFAD Optical Field Angle Distortion
PA Photometric Analysis module
PDC Pre-Search Data Conditioning module
PID Pipeline instance Identifier (unique number assigned to
each run of the Pipeline)
PM Primary Mirror
PMA Primary Mirror Assembly
POI Pixels of Interest
ppm parts per million
KSCI-19043-001: Kepler Data Release 3 Notes 1/20/2010
43 of 58
PRF Pixel Response Function
PRNU Pixel Response Non-Uniformity
PSD power spectral density
PSF Point Spread Function
PSP Participating Scientist Program
PWA Printed Wiring Assembly
QE Quantum Efficiency
RC Reverse Clock
S/C Spacecraft
S/W Software
SAO Smithsonian Astrophysical Observatory
SC Short Cadence
SCo Schmidt Corrector
SDA Science Data Accumulator
SNR Signal-to-Noise Ratio
SO Science Office
SOC Science Operations Center
SOL Start-of-Line
SSR Solid State Recorder
SSTVT Single-String Transit Verification Test
STScI Space Telescope Science Institute
SVD Singular Value Decomposition
TAD Target and Aperture Definition module
TDT Target Definition Table
TPS Terrestrial Planet Search module
TVAC Thermal Vacuum testing
KSCI-19043-001: Kepler Data Release 3 Notes 1/20/2010
44 of 58
10. Contents of Supplement
The Supplement is available as a full package (DataReleaseNotes_03_SupplementFull.tar) and a short package (7 MB) suitable for emailing (DataReleaseNotes_03_SupplementSmall.tar). The README file describes each file. Here are the files in the short package: