Printed on recycled paper CONTRACT REPORT CR-05-007-ENV COST AND PERFORMANCE REPORT NANOSCALE ZERO-VALENT IRON TECHNOLOGIES FOR SOURCE REMEDIATION by Arun Gavaskar Lauren Tatar Wendy Condit September 2005 Approved for public release; distribution is unlimited. ENGINEERING SERVICE CENTER Port Hueneme, California 93043-4370
Transcript
Printed on recycled paper
CONTRACT REPORT
CR-05-007-ENV COST AND PERFORMANCE REPORT NANOSCALE ZERO-VALENT IRON TECHNOLOGIES FOR SOURCE REMEDIATION by Arun Gavaskar Lauren Tatar Wendy Condit September 2005
Approved for public release; distribution is unlimited.
ENGINEERING SERVICE CENTERPort Hueneme, California 93043-4370
REPORT DOCUMENTATION PAGE Form Approved
OMB No. 0704-0811 The public reporting burden for this collection of information is estimated to average 1 hour per response, including the time for reviewing instructions, searching existing data sources, gathering and maintaining the data needed, and completing and reviewing the collection of information. Send comments regarding this burden estimate or any other aspect of this collection of information, including suggestions for reducing the burden to Department of Defense, Washington Headquarters Services, Directorate for Information Operations and Reports (0704-0188), 1215 Jefferson Davis Highway, Suite 1204, Arlington, VA 22202-4302. Respondents should be aware that notwithstanding any other provision of law, no person shall be subject to any penalty for failing to comply with a collection of information, it if does not display a currently valid OMB control number.
PLEASE DO NOT RETURN YOUR FORM TO THE ABOVE ADDRESS. 1. REPORT DATE (DD-MM-YYYY) 2. REPORT TYPE 3. DATES COVERED (From – To)
September 2005 Final 4. TITLE AND SUBTITLE 5a. CONTRACT NUMBER
5b. GRANT NUMBER
5c. PROGRAM ELEMENT NUMBER
COST AND PERFORMANCE REPORT FOR NANOSCALE ZER0-VALENT IRON TECHNOLOGIES FOR COURCE REMEDIATION
6. AUTHOR(S) 5d. PROJECT NUMBER
5e. TASK NUMBER
5f. WORK UNIT NUMBER
Arun Gavaskar, Lauren Tatar, and Wendy Condit
7. PERFORMING ORGANIZATION NAME(S) AND ADDRESSES 8. PERFORMING ORGANIZATION REPORT NUMBER
Commanding Officer Naval Facilities Engineering Service Center 1100 23rd Ave Port Hueneme, CA 93043-
CR-05-007-ENV
9. SPONSORING/MONITORING AGENCY NAME(S) AND ADDRESS(ES) 10. SPONSOR/MONITORS ACRONYM(S)
11. SPONSOR/MONITOR’S REPORT NUMBER(S)
12. DISTRIBUTION/AVAILABILITY STATEMENT
Approved for public release; distribution is unlimited.
13. SUPPLEMENTARY NOTES
14. ABSTRACT
This cost and performance report is a compilation of technical and performance data from three recent Navy demonstration projects involving the use of microscale or nanoscale zero-valent iron (NZVI) for treatment of dense, nonaqueous-phase liquid (DNAPL) source zones.
15. SUBJECT TERMS
Nano-scale zero-valent (NZVI), iron, groundwater, remediation 16. SECURITY CLASSIFICATION OF: 19a. NAME OF RESPONSIBLE PERSON a. REPORT b. ABSTRACT c. THIS PAGE
17. LIMITATION OF ABSTRACT
18. NUMBER OF PAGES
19b. TELEPHONE NUMBER (include area code) U U U U 54
Standard Form 298 (Rev. 8/98) Prescribed by ANSI Std. Z39.18
FINAL
COST AND PERFORMANCE REPORT
NANOSCALE ZERO-VALENT IRON TECHNOLOGIES FOR SOURCE REMEDIATION
Naval Facilities Engineering Service Center 1100 23rd Avenue
Port Hueneme, California 93043-4301
Prepared by:
Arun Gavaskar, Lauren Tatar, and Wendy Condit
BATTELLE 505 King Avenue
Columbus, Ohio 43201
August 29, 2005
EXECUTIVE SUMMARY Zero-valent iron (ZVI) has been used in permeable reactive barriers for groundwater treat-ment for over ten years now. ZVI or elemental iron (Fe0) is a strong reducing agent that is capable of abiotically dehalogenating several common chlorinated solvents (e.g., trichloroethene [TCE]), which are common pollutants at military and industrial sites. The granular ZVI used in permeable barrier applica-tions typically consists of iron particles in the size range of −8+50 mesh, which makes the ZVI barrier more permeable than the surrounding aquifer. An emerging technology based on ZVI is the use of nano-scale zero-valent iron (NZVI) for source zone, rather than plume, treatment. In source areas, solvent may be present as dense nonaqueous-phase liquid (DNAPL) or free-phase solvent and dissolved-phase concen-trations in the region tend to be much higher than in the downgradient plume. The finer NZVI particles are much more reactive than granular ZVI and have the potential to quickly treat the higher concentra-tions of chlorinated volatile organic compounds (CVOC) present in source zones. Also, finer particles are easier to inject in the soil pores than coarse particles, so the smaller particle size of NZVI helps its delivery. The Navy has recently conducted NZVI field demonstrations at three sites: Hunters Point Shipyard (Hunters Point), Naval Air Station (NAS) Jacksonville, and Naval Air Engineering Station (NAES) Lakehurst. This cost and performance (C&P) report is the result of a comparative evaluation of the performance of NZVI injection at these three sites. At Hunters Point the iron injected was not true NZVI, but micron-sized ZVI powder called Ferox™. This powder, provided by ARS Technologies, Inc., is expected to be less reactive compared to NZVI, but is lower in price as well, probably because of its coarser particle size and differences in manufacture. At the Jacksonville and Lakehurst sites, a variety of NZVI called bimetallic nanoscale particles (BNP) provided by PARS Environmental Inc. was used. Addition of trace quantities of a second metal, such as palladium, improves the reactivity of the iron still further, as the second metal catalyzes the dehalogenation reactions. The Navy conducted considerable performance monitoring at the three sites and the key results are summarized in this report. In general, the following are the key observations made in this comparative study:
• At Hunters Point, two ZVI injection studies were conducted, one in the source area and the other in the plume. In the first study, 16,000 lb of micron-sized ZVI powder was made into a 265 g/L iron slurry in tap water and was injected into the DNAPL source zone by pneumatic fracturing, using nitrogen as the carrier gas. The iron-to-soil ratio achieved in the target treatment zone was 0.004. After injection, ORP of the groundwater dropped to below −500 mV and pH rose above 8, indicating that strongly reducing conditions suitable for abiotic dehalogenation of TCE were generated. There was no significant formation of cis-1,2-DCE immediately after injection, thus indicating that microbially driven anaerobic reduction was not the primary mechanism for TCE mass removal. Longer-term monitoring over one year after injection showed some signs of a rebound (increase) in ORP and DCE in some wells, thus indicating that the ZVI was losing some reactivity. However, TCE levels continued to remain low and the DCE rebound subsided eventually, thus indicating that ORP remained reducing enough to promote biodegradation and hydrogenolysis of residuals.
In the second injection study at Hunters Point, 72,650 lb of microscale ZVI was made into a 300-g/L slurry in tap water and was similarly injected by pneumatic fracturing into a region of more dilute contamination next to the DNAPL source. The iron-to-soil ratio achieved was 0.001. After ZVI injection, ORP dropped to
ii
below −400 mV in one well, but was between −200 mV and −400 mV in other wells. Compared to the first study, ORP started rebounding more quickly after the second injection. Persistence of DCE and VC in the treatment zone after the second injection study is another indicator that insufficient iron may have been injected to generate the strongly reducing conditions necessary to stimulate the more efficient abiotic (beta-elimination) reactions that were created in the first study. However, the mildly reducing conditions generated were sufficient to promote hydrogenolysis and anaerobic biodegradation of TCE.
• At NAS Jacksonville, 300 lb of BNP from PARS Environmental Inc. was made into a 4.5- to 10-g/L iron slurry with water from an extraction well and injected into the subsurface by a combination of direct push and closed-loop recirculation wells. After injection, groundwater ORP dropped to below −200 mV, but pH remained relatively constant. The levels of cis-DCE rose significantly, indicating that anaerobic biodegradation and hydrogenolysis were significantly stimulated, but aquifer conditions may not have been reducing enough to stimulate abiotic reduction (beta-elimination) of TCE and other CVOCs. Either the iron was partially passivated before injection when mixing with relatively high volume of oxygenated water to form the injection slurry or the iron-to-soil ratio was not high enough to generate the strongly reducing conditions necessary for abiotic reduction (beta-elimination).
• At NAES Lakehurst, 300 lb of BNP from PARS Environmental Inc. was made into a relatively dilute 2-g/L slurry with water from an extraction well (Northern Plume) and from a fire hydrant (Southern Plume) and injected into the subsurface by direct push. After injection, there was no change in ORP and pH. In fact, ORP increased in some wells. Either the iron was passivated before injection when mixing with a relatively high volume of oxygenated water to form the injection slurry or the iron-to-soil ratio was not high enough to generate the reducing conditions necessary to stimulate either anaerobic microbial degradation or abiotic reduction. TCE, cis-DCE, and VC levels gradually decreased in the monitoring wells over several weeks of monitoring. The increase in ORP and the decrease in CVOC concentrations may be indicative of dilution of contamination due to the injection of 18,000 gallons of oxygenated water into the treatment zone.
The primary lessons learned from the NZVI application at these three Navy sites are as follows:
• Creating a reducing environment (ORP < −400 mV) strong enough to generate faster abiotic reactions should be the main objective of NZVI treatment.
• Abiotic (beta-elimination) reactions result in faster dehalogenation of CVOCs and minimal production of partially dechlorinated byproducts, such as cis-1,2-DCE.
• When insufficient ZVI mass is injected, mildly reducing conditions (ORP < −200 mV) are generated, and this may stimulate slower hydrogenolysis and anaerobic biodegradation of CVOCs and formation of cis-1,2-DCE and VC. Although biodegradation is a desirable long-term side effect of ZVI injection,
iii
stimulating biodegradation alone may not be enough to justify the use of a relatively higher-priced reagent, such as NZVI.
• Enough ZVI mass should be injected to lower the ORP below −400 mV. From these demonstrations, an iron-to-soil ratio of 0.004 appears to be essential to generate the required ORP. Injected ZVI mass should not be based on stoichoi-metric relationships with the contaminant mass. Contaminant mass estimates, especially in DNAPL source zones, tend to be notoriously inaccurate and, in any case, do not appear to directly drive iron requirements. Excess iron may have to be injected to achieve an iron-to-soil ratio of 0.004 in the target zone after accounting for some migration of iron outside the target region.
• In general, NZVI delivery mechanisms that minimize the volume of water injected along with the iron are preferable to methods that depend on larger volumes of water. Water from most sources contains oxygen and other oxidized species that may passivate the iron during injection. If larger volumes of water have to be used, the water should be de-oxygenated first. However, other oxidized species, such as nitrates and sulfates, may still persist and react with the iron.
• Larger ZVI particles are likely to be less reactive compared with true NZVI particles. However, micron-sized or granular ZVI particles also may be less prone to passivation during handling, compared with true NZVI particles. The reactivity, stability, and cost of different-sized ZVI particles are all factors in the selection of a suitable treatment strategy.
• Short-term monitoring of the treatment zone should demonstrate a congruence in trends among parent compounds (e.g., TCE), byproducts (e.g., cis-1,2-DCE), and other indicator parameters (e.g., ORP, pH, etc.). All these parameters should preferably indicate strongly reducing conditions and abiotic (beta-elimination) reactions.
• Long-term monitoring of the treatment zone is essential until it is demonstrated that the decline in parent compounds (e.g., TCE) and byproducts (e.g., cis-1,2-DCE) persists after ORP has rebounded to pre-treatment levels (that is, after the ZVI is depleted). Only then can it be determined how much, if any, DNAPL mass truly remains in the treatment zone.
The results of this review indicate that NZVI injection is a promising option for treatment of source zones. Some additional long-term monitoring at all three sites may be worthwhile to evaluate the reasons for the differences in performance and to verify how much residual DNAPL there may be left at these sites. Also of interest would be to see whether the downgradient plume has been weakened enough by the source removal action for natural attenuation to be a viable long-term option or whether additional NZVI injection is required.
1.2.1 FEROXSM .................................................................................................................... 3 1.2.2 Bimetallic Nanoscale Particles.................................................................................... 3 1.2.3 PARS Nanoscale Zero-Valent Iron (NZVI)................................................................ 3 1.2.4 Price of NZVI and its Variations................................................................................. 4
Figure 1-1. Abiotic Reduction of TCE by ZVI......................................................................................... 2 Figure 2-1. Demonstration Site RU-C4, Hunters Point ............................................................................ 5 Figure 2-2. Pre-Injection Baseline TCE Contaminant Plume................................................................... 6 Figure 2-3. Pneumatic Fracturing System ................................................................................................ 8 Figure 2-4. ORP Observed in Monitoring Wells IR28MW362F, IR28MW211F, and
IR28MW939F ........................................................................................................................ 9 Figure 2-5. pH Observed in Monitoring Wells IR28MW362F, IR28MW211F, and IR28MW939F....... 9 Figure 2-6. TCE, cis-1,2-DCE, and Vinyl Chloride Concentrations in Source Area
Monitoring Well IR28MW362F .......................................................................................... 11 Figure 2-7. TCE, cis-1,2-DCE, and Vinyl Chloride Concentrations in Source Area
Monitoring Well IR28MW939F .......................................................................................... 11 Figure 2-8. TCE, cis-1,2-DCE, and Vinyl Chloride Concentrations in Source Area
Monitoring Well IR28MW211F .......................................................................................... 12 Figure 2-9. TCE Concentrations in Source Area Monitoring Well IR28MW211F
from Long-Term Monitoring ............................................................................................... 12 Figure 2-10. Pre-Injection Baseline TCE Contaminant Plume................................................................. 15 Figure 2-11. ORP Observed in Monitoring Wells IR28MW310F, IR28MW409, and
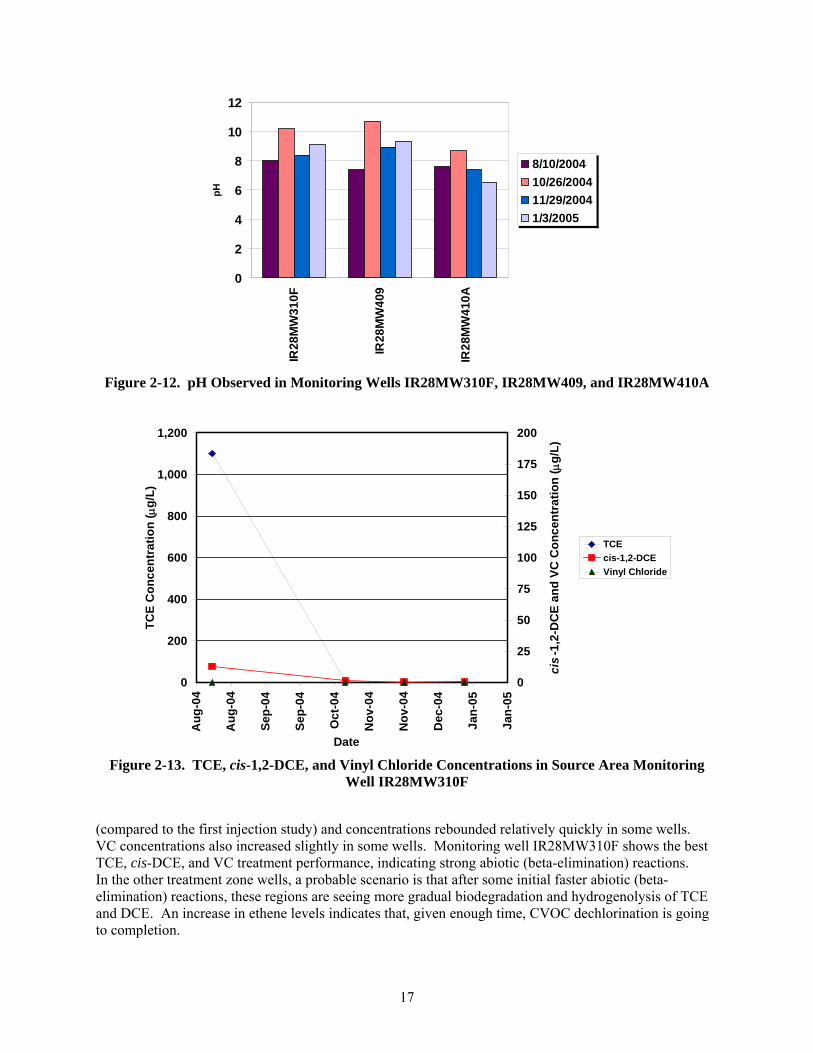
IR28MW410A ..................................................................................................................... 16 Figure 2-12. pH Observed in Monitoring Wells IR28MW310F, IR28MW409, and IR28MW410A ...... 17 Figure 2-13. TCE, cis-1,2-DCE, and Vinyl Chloride Concentrations in Source Area Monitoring
Well IR28MW310F ............................................................................................................. 17 Figure 2-14. TCE, cis-1,2-DCE, and Vinyl Chloride Concentrations in Source Area Monitoring
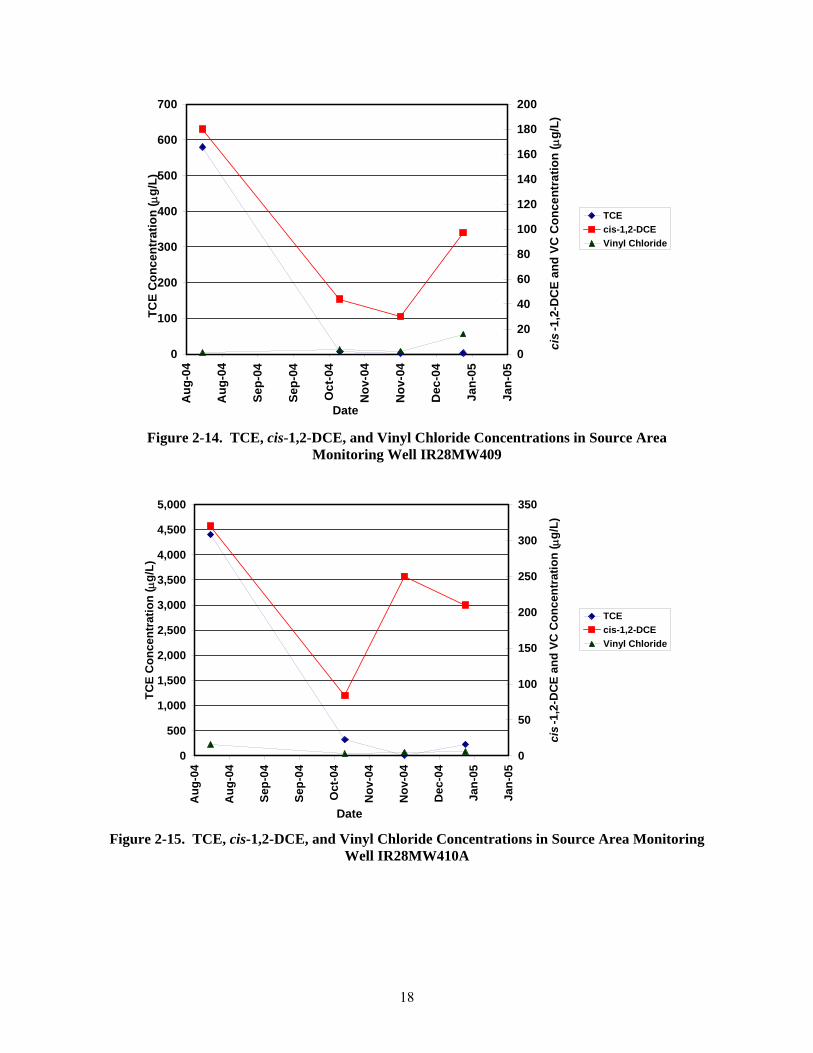
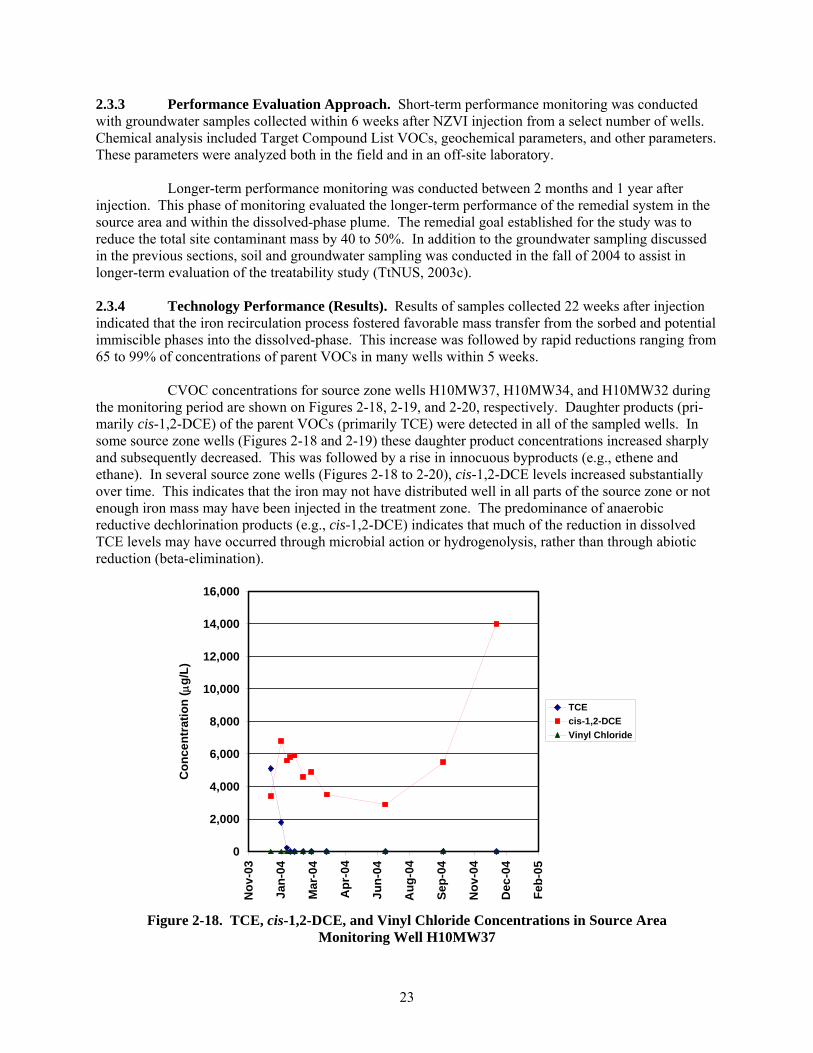
Well IR28MW409................................................................................................................ 18 Figure 2-15. TCE, cis-1,2-DCE, and Vinyl Chloride Concentrations in Source Area Monitoring
Well IR28MW410A............................................................................................................. 18 Figure 2-16. Site H1K, NAS Jacksonville ................................................................................................ 20 Figure 2-17. Baseline Contaminant Levels and TCE Contours................................................................ 22 Figure 2-18. TCE, cis-1,2-DCE, and Vinyl Chloride Concentrations in Source Area
Monitoring Well H10MW37................................................................................................ 23 Figure 2-19. TCE, cis-1,2-DCE, and Vinyl Chloride Concentrations in Source Area
Monitoring Well H10MW34................................................................................................ 24 Figure 2-20. TCE, cis-1,2-DCE, and Vinyl Chloride Concentrations in Source Area
Monitoring Well H10MW32................................................................................................ 24 Figure 2-21. ORP Observed in Monitoring Wells H10MW32, H10MW34, and H10MW37.................. 25 Figure 2-22. pH Observed in Monitoring Wells H10MW32, H10MW34, and H10MW37..................... 26 Figure 2-23. NAES Lakehurst Site Location Map.................................................................................... 29 Figure 2-24. Total VOC Concentrations in Monitoring Wells Baseline (Northern Plume) ..................... 30 Figure 2-25. Total VOC Concentrations in Monitoring Wells Baseline (Southern Plume) ..................... 31 Figure 2-26. TCE, PCE, DCE, and VC Concentrations in Source Area Monitoring Well MW-1 ........... 33 Figure 2-27. TCE, PCE, DCE, and VC Concentrations in Source Area Monitoring Well MW-2 ........... 33 Figure 2-28. ORP Levels at NAES Lakehurst .......................................................................................... 35 Figure 2-29. pH Levels at NAES Lakehurst ............................................................................................. 36
vi
TABLES
Table 2-1. Cost Summary for Hunters Point ZVI Demonstration ............................................................. 13 Table 2-2. Key Groundwater Parameters in Treatment Zone Wells.......................................................... 26 Table 2-3. Key Groundwater Parameters in Extraction Wells................................................................... 27 Table 2-4. Costs for NZVI Demonstration at NAS Jacksonville ............................................................... 27 Table 2-5. Costs for NZVI Demonstration at NAES Lakehurst ................................................................ 37 Table 3-1. Key Results of the NZVI Demonstrations................................................................................ 38 Table 3-2. Cost Breakdown for the Hunters Point, NAS Jacksonville, and NAES Lakehurst Sites ......... 41
vii
ACRONYMS AND ABBREVIATIONS
bgs below ground surface BNP bimetallic nanoscale particles CERCLA Comprehensive Environmental Response, Compensation, and Liability Act CVOC chlorinated volatile organic compound DCA dichloroethane DCE dichloroethene DNAPL dense, nonaqueous-phase liquid DO dissolved oxygen DPT direct-push technology FDEP Florida Department of Environmental Protection HPS Hunters Point Shipyard MW monitoring well NA not available NAES Naval Air Engineering Station NAS Naval Air Station ND not detected NZVI nanoscale zero-valent iron ORP oxidation-reduction potential PCE tetrachloroethene PRB permeable reactive barrier psi(g) pounds per square inch (gage) RCRA Resource Conservation and Recovery Act TCA trichloroethane TCE trichloroethene TOC total organic carbon U.S. EPA (United States) Environmental Protection Agency UST underground storage tank VC vinyl chloride VOC volatile organic compound ZVI zero-valent iron
viii
Section 1.0: INTRODUCTION This cost and performance report is a compilation of technical and performance data from three recent Navy demonstration projects involving the use of microscale or nanoscale zero-valent iron (NZVI) for treatment of dense, nonaqueous-phase liquid (DNAPL) source zones. Zero-valent iron (ZVI) or elemental iron (Feº) is a strong reducing agent. In the past 10 years, granular (coarse sand-sized) ZVI has been successfully used in permeable reactive barrier (PRB) applications to treat chlorinated volatile organic compounds (CVOC) in groundwater. Injecting fluidized NZVI particles into a contaminated source zone is an extension of this concept. Nanoscale iron particles (typically between 50 to 300 nanometers in diameter) have surface areas that are up to several times greater than larger-sized powders or granular iron. This characteristic makes NZVI particles much more reactive in a reduction-oxidation (redox) process. Microscale iron is a variant that consists of micron-scale particles that are coarser than NZVI particles but finer than granular iron. Concomitantly, the reactivity of microscale iron particles is expected to be less than that of NZVI, but greater than that of granular iron. The Navy has conducted three field demonstration projects using various NZVI technologies to determine their effectiveness in treating source zones contaminated primarily with CVOCs. The demonstration projects were conducted at three different Navy sites using various NZVI or microscale iron technologies:
• FEROXSM at the former Hunters Point Shipyard (Hunters Point), San Francisco, California.
• PARS Environmental Inc.’s NZVI Bimetallic Nanoscale Particle (BNP) at Naval Air Station (NAS) Jacksonville, Florida.
• PARS Environmental Inc.’s BNP at Naval Air Engineering Station (NAES) Lakehurst, New Jersey.
Each of these three projects is described in a separate application report. The current docu-ment is intended to be a comparative summary of the three projects and the demonstrated technologies. 1.1 Report Organization This report is organized into the following sections: Section 1.0: Introduction. This section provides the report framework, an introduction to the NZVI technology, and the variations on this technology currently being demonstrated. Section 2.0: Technology Implementation. This section provides details of the three projects in details including technology performance and cost data. Regulatory issues and lessons learned also will be discussed briefly. Section 3.0: Summary of Conclusions. This section compares and contrasts the three projects based on three categories: Technical Performance, Cost and Regulatory Issues, and Lessons Learned. Section 4.0: References. This section lists the references used to prepare this report.
1
1.2 ZVI and NZVI Technologies Descriptions ZVI is currently used primarily in PRBs for in situ remediation of chlorinated solvent plumes (ITRC, 2005; Gavaskar et al., 2002). Certain metals, such as chromium, in groundwater also have been treated with ZVI in PRBs. These passive treatment walls for dissolved-phase contaminants are normally located in a plume to intercept groundwater flow prior to its migration off-site or towards potential receptors. As the dissolved-phase contamination flows through the PRB, CVOCs are destroyed primarily by abiotic reduction. Roberts et al. (1996) have proposed that a CVOC, such as trichloroethene (TCE), is dechlorinated by the two reactions shown in Figure 1-1. Most of the TCE is converted to ethene and chloride by beta-elimination reaction, which proceeds with the formation of short-lived intermediates, such as acetylene. A small portion of TCE decomposes by hydrogenolysis, a sequential reduction path-way that results in the formation of longer-lived intermediates, such as cis-1,2-dichloroethene (cis-1,2-DCE) and vinyl chloride (VC).
Hydrogenolysis
Beta-Elimination Figure 1-1. Abiotic Reduction of TCE by ZVI
(Permission has been received from the author to use the information from Roberts et al. 1996 Reductive Elimination of Chlorinated Ethylene by Zero-Valent Metals to create this figure.)
When enough ZVI is present, hydroxyl radicals are produced as water decomposes and this tends to increase pH. Native groundwater species, such as nitrate and sulfate, also are reduced. Calcium and magnesium tend to precipitate out as carbonates. Metals, such as chromium, are reduced to a lower oxidation state, at which they are less soluble and can be removed by precipitation. The granular (coarse) nature of the ZVI particles used in PRBs ensures that adequate hydraulic flow capture is achieved and further downgradient migration of contamination emanating from the source is arrested. These passive treatment systems are simple and cost-effective to implement at relatively shallow depths and for relatively low concentrations of CVOCs. However, challenges with implementation and cost increase in deeper aquifers and at higher CVOC concentrations. Because of its extremely small size and high surface area, NZVI is thought to be a more effective technology for remediation of source zones. An enlarged surface area allows the NZVI particles to react at a much higher rate with CVOCs. This potentially improves remediation performance in high-concentration portions of the plume and in the source zone. Small particle size also allows much more mobility into the soil pores and NZVI can more easily be injected into shallow and deep aquifers than
2
granular iron. Ability to inject iron can be advantageous when contamination underlies a building. In addition, strongly negative redox conditions within the zone of treatment create conditions favorable for anaerobic microbial growth and enhance bioremediation of CVOCs (ITRC, 2005; Gu et al., 2002). 1.2.1 FEROXSM. The FEROXSM technology, patented by ARS Technologies Inc., involves injection of fluidized ZVI powder into the target zone of the subsurface. This method has the potential to provide in situ treatment to both groundwater and soils contaminated with CVOCs and/or leachable heavy metals. The ZVI powder can be injected into the subsurface as a slurry or as a dry material. Nitrogen gas or compressed air is used as a carrier fluid. Pneumatic fracturing, a technique that injects gas into the subsurface at low pressure and high volume to develop a network of fractures in the treatment zone, can be used to promote movement of the ZVI slurry into the entire treatment zone. The iron powder used in this technology is not strictly NZVI, as the particles are in the micron-size range. According to ARS, the atomized multi-phase injection approach provides several key benefits over conventional injection techniques including:
1. Aggressive mixing / recirculation maintains the iron powder in uniform suspension and allows for the reaction of the iron powder with water to be accelerated
2. Injection of NZVI slurry provides added moisture necessary for the reaction when applying in an unsaturated zone.
3. The injection approach allows the iron powder to be injected into the formation to significant radial distances using relatively low pressures (<150 psi).
According to ARS, the reaction mechanism begins with corrosion of the zero-valent iron powder as it comes into contact with a water molecule. The products of corrosion are ferrous iron (Fe+2), hydrogen gas (H2), and a hydroxyl ion (OH−). The hydrogen gas then combines with the halogenated organic compound (e.g., TCE) on the surface of a catalyst (iron powder, naturally occurring electron mediator, or unidentified constituent in the soil organic matter) whereby the contaminant is dehalo-genated. In addition to the dehalogenated compound, a proton (H+) and chloride ion (Cl−) also are produced. The proton then combines with the hydroxyl ion to reform a water molecule. Accordingly, the end products of this reaction are ferrous iron, chloride ions, and the dehalogenated compound. 1.2.2 Bimetallic Nanoscale Particles. BNP are nanoscale particles of ZVI that contain a trace coating of catalyst, usually palladium (Pd), silver (Ag) or platinum (Pt). BNP causes rapid destruction of a wide range of recalcitrant contaminants because of two factors: (1) the extremely small particle size (10-100 nanometers), which have a size that allows the particle to effectively move into and remain in the target treatment zone; and (2) the surface coating catalyst, which facilitates a more rapid destruction based on a surface-catalyzed redox process, where the contaminant serves as an electron acceptor and BNP as the electron donor (Wang and Zhang, 1997). A bench-scale treatability test for the NAES Lakehurst site, detailed in Section 2.4, shows that NZVI with catalyst coatings performs better than NZVI without the coating (ARS Environmental and Zhang, 2001). BNP with a Pd coating was the most efficient at treatment, followed by BNP with Ag coating. 1.2.3 PARS Nanoscale Zero-Valent Iron. PARS Environmental Inc.’s BNP product is a propri-etary formulation of NZVI particles, which are mixed with proprietary polymers developed by Penn State University and a Pd catalyst deposited on the iron surface. The NZVI particles consist of 99.9% iron by weight and 0.1% palladium and polymer support by weight. The polymers and catalyst are chemically bonded to the iron particles, such that the injected formulation will travel with groundwater as an elemental iron suspension. According to PARS Environmental Inc., the polymer support consists of an
3
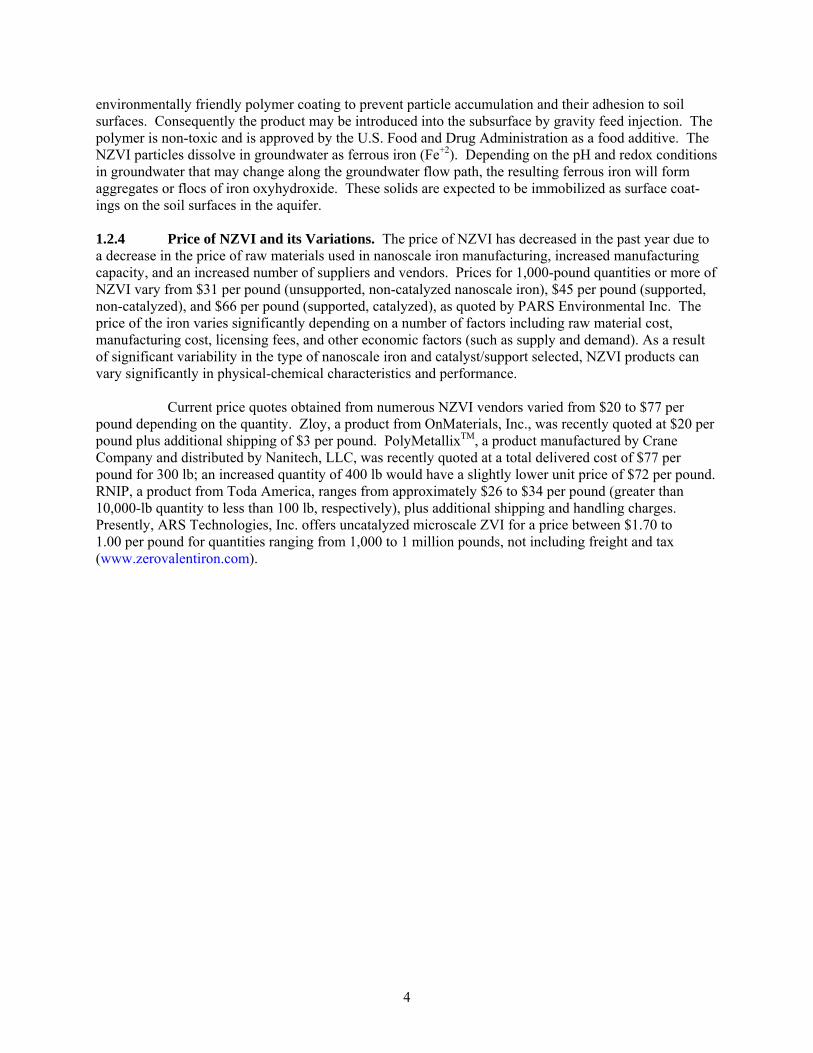
environmentally friendly polymer coating to prevent particle accumulation and their adhesion to soil surfaces. Consequently the product may be introduced into the subsurface by gravity feed injection. The polymer is non-toxic and is approved by the U.S. Food and Drug Administration as a food additive. The NZVI particles dissolve in groundwater as ferrous iron (Fe+2). Depending on the pH and redox conditions in groundwater that may change along the groundwater flow path, the resulting ferrous iron will form aggregates or flocs of iron oxyhydroxide. These solids are expected to be immobilized as surface coat-ings on the soil surfaces in the aquifer. 1.2.4 Price of NZVI and its Variations. The price of NZVI has decreased in the past year due to a decrease in the price of raw materials used in nanoscale iron manufacturing, increased manufacturing capacity, and an increased number of suppliers and vendors. Prices for 1,000-pound quantities or more of NZVI vary from $31 per pound (unsupported, non-catalyzed nanoscale iron), $45 per pound (supported, non-catalyzed), and $66 per pound (supported, catalyzed), as quoted by PARS Environmental Inc. The price of the iron varies significantly depending on a number of factors including raw material cost, manufacturing cost, licensing fees, and other economic factors (such as supply and demand). As a result of significant variability in the type of nanoscale iron and catalyst/support selected, NZVI products can vary significantly in physical-chemical characteristics and performance. Current price quotes obtained from numerous NZVI vendors varied from $20 to $77 per pound depending on the quantity. Zloy, a product from OnMaterials, Inc., was recently quoted at $20 per pound plus additional shipping of $3 per pound. PolyMetallixTM, a product manufactured by Crane Company and distributed by Nanitech, LLC, was recently quoted at a total delivered cost of $77 per pound for 300 lb; an increased quantity of 400 lb would have a slightly lower unit price of $72 per pound. RNIP, a product from Toda America, ranges from approximately $26 to $34 per pound (greater than 10,000-lb quantity to less than 100 lb, respectively), plus additional shipping and handling charges. Presently, ARS Technologies, Inc. offers uncatalyzed microscale ZVI for a price between $1.70 to 1.00 per pound for quantities ranging from 1,000 to 1 million pounds, not including freight and tax (www.zerovalentiron.com).
Section 2.0: TECHNOLOGY IMPLEMENTATION This section describes the NZVI treatment conducted in CVOC source zones at three Navy sites. The different site conditions and application challenges illustrate the types of considerations driving the use of this technology. 2.1 Hunters Point 2.1.1 Site Description. Hunters Point is situated on a long promontory, located in the southeastern portion of San Francisco County and extends eastward into San Francisco Bay as shown in Figure 2-1. From 1869 through 1986, Hunters Point operated as a ship repair, maintenance, and commercial facility. In 1991, the Navy designated Hunters Point for closure under the federal Base Closure and Realignment Act. Hunters Point was divided into six separate geographic parcels (Parcels A through F) to facilitate the closure process. This ZVI demonstration was performed at Site RU-C4 in Parcel C, which is located in the eastern portion of Hunters Point.
Figure 2-1. Demonstration Site RU-C4, Hunters Point
Two aquifers and one water-bearing zone have been identified at Hunters Point: the A-aquifer, the B-aquifer, and the bedrock water-bearing zone. Groundwater flow patterns are complex due to heterogeneous hydraulic properties of the fill materials and weathered bedrock, tidal influences, effects of storm drains and sanitary sewers, and variations in topography and drainage. RU-C4 hydro-geology is characterized by shallow bedrock with a rolling and uneven surface overlain predominantly by artificial fill material of variable hydraulic conductivity. The A-aquifer is unconfined and directly over-lies the bedrock water-bearing zone. In the western portion of Parcel C where bedrock is present at shallow depths, B-aquifer zones are isolated and mostly absent. During this demonstration, groundwater
5
levels were consistent with previous measurements at this site and ranged from an average of 6.8 ft below ground surface (bgs) prior to injection to an average of 6.2 ft bgs post-injection. At RU-C4, based on slug tests, hydraulic conductivity in the A-aquifer ranged from 26.6 to 43 ft per day, and hydraulic conductiv-ity in the bedrock water-bearing zone ranged from 5.2 × 10⁻² to 40 ft per day. Groundwater gradients are generally flat, with a historically measured gradient of about 0.0025 to the south-southwest (Tetra Tech Inc., 2003). The contaminant plume at RU-C4 consists of chlorinated solvents, primarily TCE, in shallow groundwater beneath the northern portion of Building 272. Possible sources of chlorinated solvents at RU-C4 include (1) a former underground storage tank (UST) used for waste oil storage, immediately north of Building 272, and the associated floor drain and underground piping inside of Building 272; (2) a grease trap, immediately north of Building 272 (east of the former UST), and the associated cleanout and underground piping inside Building 272; and (3) five steel dip tanks at a former paint shop in the southwestern portion of Building 281. Groundwater contaminant characterization conducted before this demonstration indicated that TCE was present at high concentrations in shallow groundwater in an isolated area beneath the north-eastern portion of Building 272 (PRC et al., 1997; Tetra Tech Inc., 2003). These concentrations sug-gested the likely presence of DNAPL in a small portion of the TCE plume. However, DNAPL was not observed during the baseline sampling or in subsequent groundwater monitoring events. Results from baseline sampling were generally consistent with previously reported concentrations and further refined the spatial extent of the plume, as shown on Figure 2-2, which presents horizontal baseline TCE isoconcentration contours.
2.1.2 Technology Implementation. Feroxsm microscale ZVI was used for the demonstration at Hunters Point. Feroxsm injections were conducted in four open boreholes. Figure 2-2 shows the locations of the four injection boreholes and surrounding monitoring wells. The four injection boreholes were each drilled to a depth of 32 ft bgs. Temporary 4-inch-diameter steel casings with disposable tips were then pushed to depth using a direct-push rig to prevent caving prior to injection. Injection boreholes were drilled to a depth below where DNAPL would potentially be observed, and injections were performed from the bottom up to minimize the potential risk of displacing DNAPL horizontally or downward into the bedrock water-bearing zone. The design dosage of ZVI powder was 16,000 lb. This dosage was based on (1) the estimated mass of TCE, which makes up most of the total CVOCs; (2) the estimated mass of soil within the treat-ment zone; and (3) the mass ratios of iron-to-TCE and iron-to-soil. The design dosage was calculated using these two mass ratios, as well as safety factors, to account for fluctuations in historic TCE concen-trations, unknown sources, and less than ideal distribution of the ZVI powder. The mass of TCE within the treatment zone was estimated to be about 14 lb. Successful injection and placement of 16,000 lb of ZVI would achieve an iron-to-TCE mass ratio of about 1,100. In general, an iron-to-soil mass ratio of 0.004 is necessary to achieve a sufficient reductive environment for the abiotic degradation of TCE. Based on an estimated dimension for the treatment zone of about 900 ft2 by 22 ft in thickness, the mass of soil within the treatment zone was estimated to be about 1,980,000 lb. As a result, successful emplace-ment of 16,000 lb of ZVI was designed to achieve an iron-to-soil mass ratio of about 0.008. After the ZVI injection were completed, the vendor estimated that a radius of influence of 15 ft was achieved and based on this distribution the ZVI-affected region was estimated to encompass 4,544,100 lb of soil, which is approximately twice the designed treatment mass of soil. Therefore, the actual iron-to-soil ratio probably was closer to 0.004 than to 0.008. The injection process integrated pneumatic fracturing and Feroxsm delivery into one process. Nitrogen gas was used as both a fracturing and injection fluid. Injections were conducted sequentially in each of the four boreholes at 3-ft intervals, starting at a depth of 30 ft bgs and proceeding upward to at least 10 ft bgs. This series of injections was expected to vertically cover the zone from 32 ft bgs to about 7 ft bgs (the approximate water table), or the zone where significant concentrations of CVOCs had been measured. Figure 2-3 is a schematic diagram of the pneumatic fracturing and Feroxsm injection process. The pneumatic fracturing system included a specialized injection module that reduced and regulated the flow of compressed nitrogen to pressures used for both fracturing and injection. Fracturing pressures ranged from 55 to 230 pounds per square inch gauge (psig) (ARS Technologies Inc., 2003). ZVI powder and potable water were combined at a ratio of 1 kilogram of ZVI powder to 1 gallon of water, to create the ZVI slurry. Subsurface pressures during the injection process ranged from 40 and 180 psig (ARS Technologies Inc., 2003). Initial responses to injections indicated that gas dissipated slowly through the formation. Most injections were conducted using pulses of nitrogen, instead of steady flows, to minimize the amount of nitrogen introduced to the injection and to prevent excessive buildup of pressure and surface heave. The quantity of ZVI injected within each interval varied based on the duration and number of injections in each borehole. 2.1.3 Performance Evaluation Approach. The Navy conducted four rounds of groundwater sampling to evaluate the effectiveness of the ZVI injections. A baseline round was conducted prior to the injections, and three post-injection demonstration rounds were conducted at 2, 6, and 12 weeks after the injections. Eighteen monitoring locations were selected for sampling to represent the areas within, upgradient, cross-gradient, and downgradient of the expected treatment zone. These wells are screened in the zone of vertical coverage of the ZVI injections (7 to 32 ft bgs). One well located within the horizontal extent of the treatment zone, but below the vertical coverage of the ZVI injections, also was selected for
7
Figure 2-3. Pneumatic Fracturing System sampling to represent the area below the treatment zone. Tetra Tech Inc. measured groundwater samples for time-sensitive parameters in the field. Additional samples were sent to a laboratory and analyzed for volatile organic compounds (VOCs), dissolved hydrogen gases, dissolved arsenic, dissolved iron, total iron, dissolved manganese, chloride, alkalinity, and nitrate. The performance evaluation was based on the percent reduction in contaminant level from the baseline assessment to post-injection. Percent reductions were calculated based on mean concentration observed over the three post-injection sampling rounds. Additional long-term monitoring was conducted in select wells in the treatment area approximately one year after the ZVI injections. 2.1.4 Technology Performance (Results). Measurement of various groundwater parameters that indicate the presence of iron or the occurrence of dechlorination reactions were measured near injection points. Oxidation-reduction potential (ORP) results less than −200 mV were observed at distances of 15 ft or less from each injection borehole. In many wells, ORP declined to below −400 mV, which is indicative of an environment strongly reducing enough for abiotic reactions to occur. Because aquifer parameters such as ORP could change over time, temporal post-injection averages may not be a suitable way of representing the effects of the ZVI, as has been done in the imple-mentation report. For example, when the ORP observed during each individual post-injection monitoring event in monitoring wells IR28MW362F, IR28MW211F, and IR28MW939F is plotted in Figure 2-4, at least two wells in the treatment zone shows signs of a gradual rebound, indicating that the iron in the vicinity of this well is dissipating or is being passivated. Temporal means tend to suppress these gradual changes in the redox environment of the aquifer.
8
-600
-500
-400
-300
-200
-100
0
100
200
300
Sep-
02
Dec
-02
Mar
-03
Jun-
03
Oct
-03
Jan-
04
Apr
-04
Aug
-04
Nov
-04
Feb-
05
Date
OR
P (m
V)
IR28MW362FIR28MW211FIR28MW939F
Figure 2-4. ORP Observed in Monitoring Wells IR28MW362F, IR28MW211F, and IR28MW939F
An increase in pH would also be indicative of treatment occurring. The pH increased after injection at all but two locations: monitoring well IR28MW934F5, located 13.1 ft from the nearest injection point and IR28MW351F, located 4.8 ft from the nearest injection borehole. However, IR28MW934F5 was screened below the targeted treatment zone at 51 to 59 ft bgs. All other wells inside the treatment zone within 15 ft of an injection point showed a pH increase of about 1 to 2 pH units. The pH values observed in monitoring wells IR28MW362F, IR28MW211F, and IR28MW939F are shown on Figure 2-5. The ORP and pH measurements in these wells indicate that strongly reducing conditions necessary for abiotic reduction of TCE were achieved in most locations.
0
2
4
6
8
10
12
IR28
MW
362F
IR28
MW
211F
IR28
MW
939F
pH
Dec-02Jan-03Mar-03Mar-03Aug-04Oct-04Nov-04Jan-05
Figure 2-5. pH Observed in Monitoring Wells IR28MW362F, IR28MW211F, and IR28MW939F
9
Changes in concentrations of dissolved gases (ethane, ethene, and hydrogen) provided a similar indication of the extent of the treatment zone. Increases in ethane and ethene concentrations were observed at most locations 15 ft or less from the nearest injection borehole. Dissolved hydrogen results did not indicate the extent of the treatment zone because it was not detected during the baseline sampling round and was detected at only three locations after the injection process was completed. However, hydrogen is quickly consumed by microbes and even sporadic detections of hydrogen indicate that reducing conditions have been generated. Although increases in chloride concentrations could be expected to result from the ZVI injection, chloride concentrations actually decreased at all but four locations varying in distance from injection. Because background chloride concentrations in groundwater are relatively high, it is likely that the variations in background concentrations outweighed any chloride production that resulted from treat-ment. Alkalinity levels decreased at all locations within the treatment zone and did not change signifi-cantly outside the treatment zone. The data discussed above support the conclusion that the treatment zone extended to distances of at least 15 ft from the point of injection, covering an area of about 1,818 ft2. Groundwater samples were collected for analysis of CVOCs before and after the injection process. Results of these samples were used to estimate percent reduction of the following CVOCs of concern: four chlorinated ethenes (tetrachloroethene [PCE], TCE, 1,2-DCE, and VC), total chlorinated ethenes, and two additional CVOCs (chloroform and carbon tetrachloride). Percent reduction was calcu-lated for these compounds by comparing concentrations within the treatment zone before and after ZVI injection. Post-injection concentrations were represented by the average concentration measured during the three post-injection sampling rounds. The percent reduction calculated based on the arithmetic mean of concentrations within the treatment zone is considered more meaningful because the calculated values account for both decreases and increases in concentrations at individual monitoring locations. However, care has to be taken to average concentrations measured over multiple monitoring events, as this tends to suppress temporal trends that may be important for evaluating remediation effectiveness. Analytical results for the 10 monitoring wells located within 15 ft of injection points were used to estimate percent reduction of CVOCs within the treatment zone. The highest pre-injection concentration (88,000 µg/L) of TCE was observed at injection borehole F2, which was later converted to monitoring well IR28MW362F. Post-injection results at this borehole averaged at a concentration of 31 µg/L, reflecting a percent reduction for this individual location of 99.96%, as shown on Figure 2-6. In the treatment zone, the overall mean pre-injection concentration of TCE was 27,000 µg/L and the overall mean post-injection concentration was 220 µg/L. These concentrations represent an overall percent reduction of TCE within the treatment zone of 99.2%. Reduction of TCE to ethene and chloride was con-siderable and no significant formation of intermediate degradation products (cis-1,2-DCE, trans-1,2-DCE, 1,1-DCE, and VC) was observed. The overall reduction in dissolved concentrations as measured in the monitoring wells in the treatment zone for the CVOCs of concern were as follows: TCE (99.2%), PCE (99.4%), cis-1,2-DCE (94.2%), VC (99.3%), total chlorinated ethenes (99.1%), chloroform (92.6%), and carbon tetrachloride (96.4%). CVOC concentrations in the weeks following injection for monitoring wells IR28MW939F and IR28MW211F are shown in Figures 2-7 and 2-8, respectively. When the CVOC concentrations measured during each post-injection monitoring event are plotted (Figures 2-6 to 2-8), some interesting temporal trends are observed that are not evident in the post-injection mean concentrations. Anaerobic biostimulation is a desirable side effect of ZVI injection, but the persistence of cis-1,2-DCE in some wells indicates that some TCE DNAPL may still be present in the treatment zone. In fact, in well IR28MW939F (Figure 2-7), there were signs that both cis-1,2-DCE and TCE levels are increasing gradually. It is interesting to note in Figure 2-4 that ORP levels in this well are showing signs of a gradual rebound (increase) over time, as the iron loses some of its reactivity. Additional monitoring events are needed to evaluate the sustainability of these trends.
10
0
12,500
25,000
37,500
50,000
62,500
75,000
87,500
100,000
Nov
-02
Dec
-02
Dec
-02
Jan-
03
Feb-
03
Feb-
03
Mar
-03
Apr
-03
Date
TCE
Con
cent
ratio
n ( µ
g/L)
0
25
50
75
100
125
150
175
200
cis
-1,2
-DC
E an
d VC
Con
cent
ratio
n ( µ
g/L)
TCEcis-1,2-DCEVinyl Chloride
Figure 2-6. TCE, cis-1,2-DCE, and Vinyl Chloride Concentrations in Source Area
Monitoring Well IR28MW362F
0
2,000
4,000
6,000
8,000
10,000
12,000
14,000
16,000
18,000
20,000
Nov
-02
Dec
-02
Dec
-02
Jan-
03
Feb-
03
Feb-
03
Mar
-03
Apr
-03
Date
TCE
Con
cent
ratio
n ( µ
g/L)
0
50
100
150
200
250
300
350
400
450
500
cis
-1,2
-DC
E an
d VC
Con
cent
ratio
ns ( µ
g/L)
TCEcis-1,2-DCEVinyl Choride
Figure 2-7. TCE, cis-1,2-DCE, and Vinyl Chloride Concentrations in Source Area
Monitoring Well IR28MW939F In monitoring well IR28MW211F (Figure 2-8), cis-1,2-DCE levels, after an initial sharp decline two weeks after injection, show signs of increasing in subsequent weeks. This indicates that as the direct influence (abiotic reduction) of the ZVI wanes, anaerobic microbial stimulation kicks in and continues to biodegrade any residual TCE. Subsequent longer-term monitoring in well IR28MW211F
11
0
10,000
20,000
30,000
40,000
50,000
60,000
70,000
80,000
Nov
-02
Dec
-02
Dec
-02
Jan-
03
Feb-
03
Feb-
03
Mar
-03
Apr
-03
Date
TCE
Con
cent
ratio
n ( µ
g/L)
0
25
50
75
100
125
150
175
200
cis
-1,2
-DC
E an
d VC
Con
cent
ratio
n ( µ
g/L)
TCEcis-1,2-DCEVinyl Chloride
Figure 2-8. TCE, cis-1,2-DCE, and Vinyl Chloride Concentrations in Source Area
Monitoring Well IR28MW211F
0
200
400
600
800
1,000
1,200
1,400
1,600
1,800
Feb-
03
Jun-
03
Sep-
03
Dec
-03
Apr
-04
Jul-0
4
Oct
-04
Jan-
05
May
-05
Date
Con
cent
ratio
n ( µ
g/L)
TCEcis-1,2-DCEVinyl Chloride
Figure 2-9. TCE Concentrations in Source Area Monitoring Well IR28MW211F
from Long-Term Monitoring shows a continued decrease in TCE concentrations (Figure 2-9). In the longer term, cis-1,2-DCE levels continued to increase until a second ZVI injection was conducted in a neighboring area; beyond this time, cis-1,2-DCE levels declined, whereas VC levels increased slightly. This indicates that hydrogenolysis and biodegradation of CVOCs is continuing, and the byproducts of TCE degradation themselves are degrading. It would be interesting to continue monitoring the treatment zone wells until ORP returns to pre-treatment levels. Once ORP returns to pre-treatment levels, and if TCE does not rebound signifi-cantly, that would be a strong indicator that DNAPL destruction is mostly complete.
12
Because a reduction in VOC concentrations also could be interpreted as the result of plume displacement rather than treatment, sampling locations outside the treatment zone were monitored for potential increases in contaminant concentrations. At locations outside of the treatment zone, TCE in groundwater generally remained the same, either slightly increasing or decreasing. Monitoring well IR28MW360F was an exception, having TCE concentrations decrease from a baseline of 7,400 µg/L to a post-injection average of 640 µg/L. Increases in ethane and ethene concentrations also were observed at well IR28MW360F; however, the overall increase in ORP and the distance of this well from the nearest injection borehole suggest that this location was outside the treatment zone. Excluding IR28MW360F, the mean concentration of TCE in groundwater at locations outside the treatment zone increased slightly after injection, by 15 µg/L. Because the increase was minor in comparison with the decrease of the mean concentration of TCE within the treatment zone, it can be concluded that the plume was not being signifi-cantly displaced. 2.1.5 Cost Summary. Table 2-1 summarizes costs of the field-scale technology demonstration. The table does not include costs for the demonstration plans including work plans, health and safety plan, and demonstration-derived waste plan, project management, and contractor and health and safety oversight.
Table 2-1. Cost Summary for Hunters Point ZVI Demonstration
Category/Item Cost % of Total Cost Mobilization $31,200 10.8 Equipment and Supplies (ZVI Cost = $32,500)
$99,900 34.5
Labor $38,900 13.5 Drilling Services $22,800 7.9 Sampling and Analysis including Derived Waste Analysis and Disposal
$92,600 32
Other Miscellaneous costs $3,900 1.3 Total Cost of Demonstration $289,300 100
2.1.6 Regulatory Issues. No significant permitting or regulatory issues were identified as a concern during the demonstration. Long-term groundwater monitoring plans were not included in the scope of this project. 2.1.7 Discussion. Some of the conclusions and lessons drawn from the demonstration included:
• Dissolved TCE levels declined sharply in all monitoring wells in the treatment zone, without any significant formation of cis-1,2-DCE and VC. This indicates that the ZVI injection successfully created the conditions necessary for abiotic reduction of CVOCs by beta-elimination reactions.
• Sharp declines in ORP and noticeable increases in pH support the contention that the strongly reducing conditions suitable for abiotic reduction of CVOCs were created. Native chloride levels are relatively high at this site and chloride formation was not a good indicator of dechlorination of CVOCs.
• Injecting a ZVI mass in excess of contaminant stoichiometry was necessary to bring about significant abiotic reduction of CVOCs. ZVI mass should be suffi-cient to generate the sharply reducing conditions necessary to induce abiotic
13
degradation reactions (primarily beta-elimination) that do not result in generation of partially dechlorinated byproducts.
• Long-term performance measures need to be included in the monitoring plan. Even with excess iron, the DNAPL source could be temporarily suppressed, but rebound of dissolved CVOCs could eventually occur. ORP levels should continue to be monitored. If CVOC levels remain low after ORP rebound to pre-treatment levels has occurred, then source treatment can be said to be complete.
• Pneumatic fracturing combined with liquid atomization injection of the ZVI slurry was successful in distributing ZVI through most of the target treatment zone. Slow nitrogen distribution through the formation at Hunters Point led the vendor to use pulses of nitrogen rather than a steady flow to distribute the ZVI. Pulsing helped to prevent excessive pressure buildup and surface heave.
• Injecting at shallow depths may lead to nitrogen and slurry seeping up to the ground surface. Switching to direct hydraulic pumping may reduce the potential for seeping to the ground surface and the risk of contaminant vapors escaping from the subsurface. Some minor heaving of the concrete floor was observed during the demonstration, which generally occurred during shallow injections. However, residual heave up to 1 inch was observed after the injections. Extra precautions may be required if this technology is applied under buildings.
2.2 Second Study at Hunters Point Shipyard A second field treatability study was performed at the RU-C4 site using the same technology to determine its effectiveness at treating a larger plume that contained lower contaminant concentrations (ITSI, 2005). Prior to implementing the treatability study, additional delineation of the groundwater contaminant plume was necessary. Once the treatment zone was defined, injection well and monitoring well locations were determined. A baseline groundwater sampling event was conducted. The contami-nant plume which reflects the results from baseline sampling is shown in Figure 2-10. 2.2.1 Technology Implementation. Feroxsm injections were conducted in 13 open boreholes as shown on Figure 2-10. Each injection point contained between 4 and 12 intervals. 600 to 1,200 lb of ZVI were injected into each depth interval. The design dosage of ZVI powder was 60,000 lb based on the same assumptions used in the previous study at Hunters Point. As opposed to the first field study, in which an iron-to-soil ratio of 0.008 was targeted and a ratio of 0.004 achieved (due to a higher-than-expected radius of distribution of the ZVI), in the second study, an iron-to-soil ratio of 0.004 was targeted and a 0.001 ratio was achieved. Some daylighting of ZVI to the ground surface was observed and some wells outside the target treatment region showed signs of ZVI influence, indicating some migration of ZVI outside the target zone. The actual amount of ZVI injected into the subsurface was 72,650 lb. The injection process used was the same Feroxsm delivery methodology that was implemented in the first study. Injections were conducted sequentially in each of the 13 boreholes at 3- to 4-ft intervals, starting at the deepest interval and proceeding upward. The total cost for the treatability study implementation was $1,390,000. The total cost included $770,000 for materials, equipment, field labor for the ZVI injection, and waste characterization and disposal; $452,000 for baseline and post-injection groundwater sampling and laboratory analysis; and $168,000 for project management, data management, and reporting. The total treatment volume for the treatability study was estimated to be 27,778 yd3. Therefore, the cost to treat one cubic yard of soil was $50.
2.2.2 Performance Evaluation Approach. Four rounds of groundwater sampling were conducted to evaluate the effectiveness of the ZVI injections. A baseline round was conducted prior to the injec-tions, followed by three post-injection demonstration rounds. Nineteen monitoring locations were selected for sampling to represent the areas within, near the perimeter, and outside of the expected treat-ment zone. These wells are screened in the zone of vertical coverage of the ZVI injections (up to 60 ft bgs). Samples were sent to an off-site laboratory and analyzed for VOCs, dissolved hydrocarbon gases, total and dissolved iron, and alkalinity. The performance evaluation was based on the percent reduction in contaminant level from the baseline assessment to post-injection monitoring. Percent reductions were calculated by site representatives based on mean concentrations observed over the three post-injection sampling rounds. As mentioned in Section 2.1.4, temporal means may tend to suppress important time trends in the monitored parameters and individual data points also need to be examined. 2.2.3 Technology Performance (Results). ORP declined sharply in several treatment zone wells, thus indicating relatively good ZVI distribution (Figure 2-11), and the pH of the groundwater in the treatment zone increased significantly (to levels of 10 or above in some wells) (Figure 2-12). The decline in ORP in the second study was not as sharp as the decline in the first study (see Figures 2-11 and 2-4). In the first study, ORP declined to below −500 mV in most wells, whereas in the second study, ORP declined to below −400 mV in only one well and below −300 mV in another well. In most other treatment zone wells, ORP declined to approximately −200 mV. The rebound in ORP also appears to have happened sooner in the second study, as seen in Figure 2-11. In fact, the ORP in monitoring well IR28MW410A is gradually approaching pre-treatment levels. Interestingly, ORP levels in several wells outside the treatment zone declined sharply, thus indi-cating that the ZVI had migrated to regions outside the target zone. This is borne out by a concomitant increase in total iron levels in surrounding wells. As seen in Figures 2-13 to 2-15, the decline in ORP was sufficient to cause sharp reductions in TCE levels in several treatment zone wells. However, the decline in cis-1,2-DCE was not as sharp
-500
-400
-300
-200
-100
0
100
200
Aug
-04
Aug
-04
Sep-
04
Sep-
04
Oct
-04
Nov
-04
Nov
-04
Dec
-04
Jan-
05
Jan-
05
Date
OR
P (m
V)
IR28MW310FIR28MW409IR28MW410A
Figure 2-11. ORP Observed in Monitoring Wells IR28MW310F, IR28MW409, and IR28MW410A
16
0
2
4
6
8
10
12
IR28
MW
310F
IR28
MW
409
IR28
MW
410A
pH
8/10/200410/26/200411/29/20041/3/2005
Figure 2-12. pH Observed in Monitoring Wells IR28MW310F, IR28MW409, and IR28MW410A
0
200
400
600
800
1,000
1,200
Aug
-04
Aug
-04
Sep-
04
Sep-
04
Oct
-04
Nov
-04
Nov
-04
Dec
-04
Jan-
05
Jan-
05
Date
TCE
Con
cent
ratio
n ( µ
g/L)
0
25
50
75
100
125
150
175
200
cis
-1,2
-DC
E an
d VC
Con
cent
ratio
n ( µ
g/L)TCEcis-1,2-DCEVinyl Chloride
Figure 2-13. TCE, cis-1,2-DCE, and Vinyl Chloride Concentrations in Source Area Monitoring
Well IR28MW310F (compared to the first injection study) and concentrations rebounded relatively quickly in some wells. VC concentrations also increased slightly in some wells. Monitoring well IR28MW310F shows the best TCE, cis-DCE, and VC treatment performance, indicating strong abiotic (beta-elimination) reactions. In the other treatment zone wells, a probable scenario is that after some initial faster abiotic (beta-elimination) reactions, these regions are seeing more gradual biodegradation and hydrogenolysis of TCE and DCE. An increase in ethene levels indicates that, given enough time, CVOC dechlorination is going to completion.
17
0
100
200
300
400
500
600
700
Aug
-04
Aug
-04
Sep-
04
Sep-
04
Oct
-04
Nov
-04
Nov
-04
Dec
-04
Jan-
05
Jan-
05
Date
TCE
Con
cent
ratio
n ( µ
g/L)
0
20
40
60
80
100
120
140
160
180
200
cis
-1,2
-DC
E an
d VC
Con
cent
ratio
n ( µ
g/L)
TCEcis-1,2-DCEVinyl Chloride
Figure 2-14. TCE, cis-1,2-DCE, and Vinyl Chloride Concentrations in Source Area
Monitoring Well IR28MW409
0
500
1,000
1,500
2,000
2,500
3,000
3,500
4,000
4,500
5,000
Aug
-04
Aug
-04
Sep-
04
Sep-
04
Oct
-04
Nov
-04
Nov
-04
Dec
-04
Jan-
05
Jan-
05
Date
TCE
Con
cent
ratio
n ( µ
g/L)
0
50
100
150
200
250
300
350
cis
-1,2
-DC
E an
d VC
Con
cent
ratio
n ( µ
g/L)
TCEcis-1,2-DCEVinyl Chloride
Figure 2-15. TCE, cis-1,2-DCE, and Vinyl Chloride Concentrations in Source Area Monitoring
Well IR28MW410A
18
2.2.4 Discussion. Some of the conclusions and lessons drawn from the demonstration included:
• The second ZVI injection study was targeted towards a larger region of the aqui-fer that contained lower levels of CVOC contamination compared to the first one.
• An iron-to-soil ratio of 0.004 was targeted in the treatment zone, but was not achieved and may be attributed to the migration of substantial ZVI mass outside the target treatment zone. The resulting decline in ORP was not as sharp as that experienced in the first study (where an iron-to-soil ratio of 0.008 was targeted and 0.004 was achieved). An iron-to-soil ratio of 0.001 appears to have been achieved in the target zone in the second study.
• TCE was reduced rapidly in the treatment zone wells, as was DCE. However, DCE is already showing signs of rebound in several wells and TCE itself appeared to be rebounding in one well, MW410A (the well in which ORP is also showing a rebound to pre-treatment levels). This indicates that dissolved-phase TCE was treated in the short-term, but sorbed TCE may gradually show up as dissolved-phase in the monitoring wells.
• These results indicated that TCE and DCE initially were reduced by strong abiotic reactions in some portions of the target treatment zone. However, in some portions of the treatment zone, TCE and DCE are degrading mostly by slower biodegradation or hydrogenolysis reactions.
2.3 Naval Air Station Jacksonville 2.3.1 Site Description. NAS Jacksonville is located in Duval County, Florida and has been used for Navy operations since 1940. The demonstration site, H1K (Tetra Tech, Inc., 2005), was located in the interior portion of the NAS Jacksonville and contained two USTs, Tank A and Tank B. The USTs previously received waste solvents and other substances from a wash rack, manhole, and other operations. The tanks and associated pipelines were removed and capped in 1994 and are suspected to be the source of contamination. Cleanup of H1K is managed under the Comprehensive Environmental Response, Compensation, and Liability Act (CERCLA) program, and the groundwater monitoring program is managed under the Resource Conservation and Recovery Act (RCRA) program. Based on confirmation soil samples collected in 1995, the tank and pipeline removal achieved clean closure for unsaturated soils. Elevated concentrations of TCE and 1,1,1-trichloroethane (TCA) in groundwater are centered in the Tank A area. The site location is shown in Figure 2-16. Geologic borings indicate that the unsaturated zone at the site appears to be fairly uniform fine to medium grained sand and sandy fill. A thin layer of clayey sand and/or silty sand is located at and just below the water table between 6 and 12 ft bgs underlain by a fine to medium silty sand encountered from 10 to 17 ft bgs. At most locations within H1K, a larger amount of silt and clay was encountered between 20 and 24 ft bgs. Below 24 ft bgs, stiff, dense, very low permeability clay was encountered to a depth of 54 ft bgs. The surficial aquifer at the site is located approximately 7 to 24 ft bgs, and tends to flow to the southeast. In 2000 and 2001, an Interim Remedial Action using chemical oxidation was conducted in the source area (CH2MHill and J.A. Jones, 2002). Groundwater sampling indicated that dissolved-phase concentrations rebounded following each treatment. In March 2002, a site characterization sampling effort was performed (CH2MHill and J.A. Jones, 2002) to redefine the magnitude of contamination. The maximum saturated soil concentrations detected were 1,1,1-TCA at 25,300 µg/kg; PCE at 4,360 µg/kg;
19
Figure 2-16. Site H1K, NAS Jacksonville
20
and TCE at 60,100 µg/kg. The maximum groundwater concentrations from a monitoring well were detected in MW-8 [PCE at 173 µg/L, TCE at 5,520 µg/L, and cis-1,2-DCE at 1,350 µg/L). The highest and second highest total VOC concentrations were detected in injection wells IW-1D (82,340 µg/L) and IW-6D (45,782 µg/L), respectively. These contaminant concentrations indicate the potential presence of DNAPL. The baseline TCE contamination plume is shown on Figure 2-17. The horizontal extent of contamination is approximately 1,450 ft2 with a thickness of 18 ft (saturated zone), resulting in a total volume of 967 yd3 of soil. The estimated mass ranges between 42 and 125 lb with the statistical average mass centered at 61 lb. 2.3.2 Technology Implementation. Bench-scale treatability testing indicated that the application of NZVI could degrade chlorinated organics present at the H1K site with a removal efficiency between 96 and 98% with an applied iron concentration of 1.25 to 13.75 g/L. Test results indicated that generation of undesirable daughter products (i.e., DCE and VC) from the reduction process was insignificant (TtNUS, 2003a). NZVI particles used for this demonstration were manufactured by PARS Environmental Inc. and were 50 to 300 nanometers (10−9 meter) in diameter. The particles are BNP and consisted of 99.9% iron and 0.1% palladium and polymer by weight. NZVI was emplaced using two mechanisms: (1) strategic direct-injection into known “hot spots” using direct-push technology (DPT), and (2) a “closed-loop” recirculation process (Tetra Tech, Inc., 2005). Direct injection of the nanoscale iron using DPT was employed first at 10 “hot spot” locations. A recirculation system was used to distribute the NZVI in the rest of the suspected source zone. The design of the recirculation system consisted of four injection and three extraction wells, including two existing injection wells for the initial NZVI injection (IW-1 and IW-6). Because the viscosity of the NZVI suspension is similar to groundwater (due to the low iron concentration) the water was introduced into the aquifer via gravity flow only. Injection pipes had drilled slots to allow discharge of the iron into targeted depth intervals that were characterized to have elevated contaminant concentrations. For injection via DPT, the iron suspension was diluted to 10 g/L and injected directly into the DPT boreholes using pumps from 7.5 to 23.0 ft bgs, equating to approximately 4.2 lb of iron injected in each borehole. During the first recirculation event, water was recirculated into the four injection wells (H10MW-28, -29, -30, and -31) and the two existing chemical oxidation injection wells (IW-1S and IW-6D) via gravity. The recirculation system was operated continuously for approximately 23 hours using these wells. Based on bench-scale treatability study results (TtNUS, 2003b), the applied iron concentra-tion was initiated at 2 g/L and later increased to 4.5 g/L based upon field observations indicating the iron was being accepted by the aquifer without clogging or backing up in the wells. The chemical oxidation injection wells (IW-1S and IW-6D) were used for injection for a total of 17 hours until they no longer accepted material. During the second recirculation event, water was only recirculated into the four new injection wells (H10MW-28, -29, -30, and -31) for approximately 21.5 hours. The applied iron concentration remained at 4.5 g/L. The chemical oxidation injection wells (IW-1S and IW-6D) were not used for injection due to sediment buildup encountered during the first recirculation event.
21
Figure 2-17. Baseline Contaminant Levels and TCE Contours
22
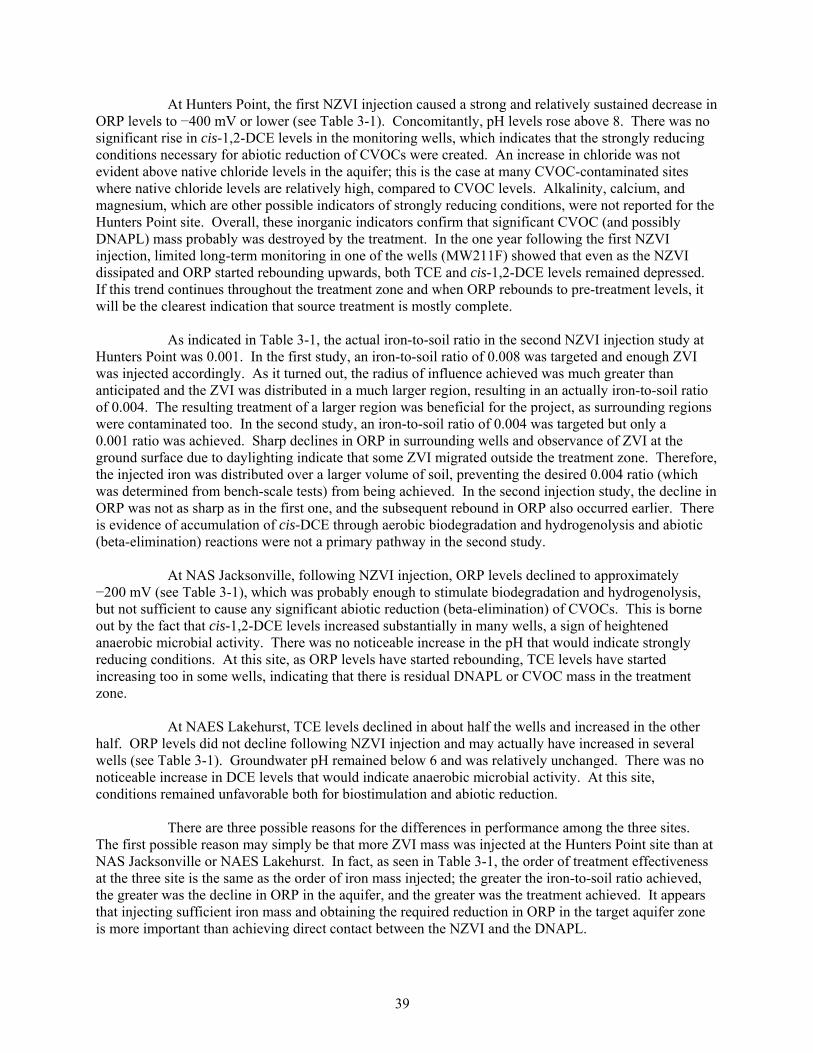
2.3.3 Performance Evaluation Approach. Short-term performance monitoring was conducted with groundwater samples collected within 6 weeks after NZVI injection from a select number of wells. Chemical analysis included Target Compound List VOCs, geochemical parameters, and other parameters. These parameters were analyzed both in the field and in an off-site laboratory. Longer-term performance monitoring was conducted between 2 months and 1 year after injection. This phase of monitoring evaluated the longer-term performance of the remedial system in the source area and within the dissolved-phase plume. The remedial goal established for the study was to reduce the total site contaminant mass by 40 to 50%. In addition to the groundwater sampling discussed in the previous sections, soil and groundwater sampling was conducted in the fall of 2004 to assist in longer-term evaluation of the treatability study (TtNUS, 2003c). 2.3.4 Technology Performance (Results). Results of samples collected 22 weeks after injection indicated that the iron recirculation process fostered favorable mass transfer from the sorbed and potential immiscible phases into the dissolved-phase. This increase was followed by rapid reductions ranging from 65 to 99% of concentrations of parent VOCs in many wells within 5 weeks. CVOC concentrations for source zone wells H10MW37, H10MW34, and H10MW32 during the monitoring period are shown on Figures 2-18, 2-19, and 2-20, respectively. Daughter products (pri-marily cis-1,2-DCE) of the parent VOCs (primarily TCE) were detected in all of the sampled wells. In some source zone wells (Figures 2-18 and 2-19) these daughter product concentrations increased sharply and subsequently decreased. This was followed by a rise in innocuous byproducts (e.g., ethene and ethane). In several source zone wells (Figures 2-18 to 2-20), cis-1,2-DCE levels increased substantially over time. This indicates that the iron may not have distributed well in all parts of the source zone or not enough iron mass may have been injected in the treatment zone. The predominance of anaerobic reductive dechlorination products (e.g., cis-1,2-DCE) indicates that much of the reduction in dissolved TCE levels may have occurred through microbial action or hydrogenolysis, rather than through abiotic reduction (beta-elimination).
0
2,000
4,000
6,000
8,000
10,000
12,000
14,000
16,000
Nov
-03
Jan-
04
Mar
-04
Apr
-04
Jun-
04
Aug
-04
Sep-
04
Nov
-04
Dec
-04
Feb-
05
Con
cent
ratio
n ( µ
g/L)
TCEcis-1,2-DCEVinyl Chloride
Figure 2-18. TCE, cis-1,2-DCE, and Vinyl Chloride Concentrations in Source Area
Monitoring Well H10MW37
23
0
2,000
4,000
6,000
8,000
10,000
12,000
Nov
-03
Jan-
04
Mar
-04
Apr
-04
Jun-
04
Aug
-04
Sep-
04
Nov
-04
Dec
-04
Feb-
05
Con
cent
ratio
n ( µ
g/L)
TCEcis-1,2-DCEVinyl Chloride
Figure 2-19. TCE, cis-1,2-DCE, and Vinyl Chloride Concentrations in Source Area
Monitoring Well H10MW34
0
10,000
20,000
30,000
40,000
50,000
60,000
Nov
-03
Jan-
04
Mar
-04
Apr
-04
Jun-
04
Aug
-04
Sep-
04
Nov
-04
Dec
-04
Feb-
05
Con
cent
ratio
n ( µ
g/L)
TCEcis-1,2-DCEVinyl Chloride
Figure 2-20. TCE, cis-1,2-DCE, and Vinyl Chloride Concentrations in Source Area
Monitoring Well H10MW32
24
Detections of compounds such as ethane/ethane and acetylene/C4-hydrocarbons provide some indication that some abiotic degradation via beta-elimination was a secondary treatment pathway. TCE concentrations in a well (H10MW39) located approximately 20 ft downgradient of the target treatment zone (source zone) were reduced up to 99%. This indicates that some of the injected NZVI could have migrated outside the treatment zone through preferential pathways. Figure 2-21 shows that ORP declined to approximately −200 mV immediately after NZVI injection. The resulting reducing conditions may have been strong enough to stimulated anaerobic biodegradation and hydrogenolysis, but may not have been strong enough to cause substantial abiotic reduction (beta-elimination). Within about 12 weeks, ORP levels rebounded considerably, indicating that the NZVI was dissipating. However, the groundwater remained anaerobic for over a year following the iron injection, indicating that conditions suitable for biodegradation continued for a substantially long time. Groundwater pH levels remained relatively unchanged throughout the demonstration (Figure 2-22), indicating that the NZVI may not have induced strongly reducing conditions suitable for abiotic reduc-tion. Although microbial activity can result in generation of CO2 and a concomitant suppression of pH, there are not enough oxidized species (DO, nitrate, etc.) in the native groundwater for this effect to be significant (see Table 2-2). Therefore, some increase in pH would be expected following iron injection.
-350
-280
-210
-140
-70
0
70
140
Nov
-03
Jan-
04
Mar
-04
Apr
-04
Jun-
04
Aug
-04
Sep-
04
Nov
-04
Dec
-04
Feb-
05
OR
P, m
V
H10MW32H10MW34H10MW37
Figure 2-21. ORP Observed in Monitoring Wells H10MW32, H10MW34, and H10MW37
Tables 2-2 and 2-3 show the trends in several key groundwater parameters measured before (baseline) and after (performance sampling) NZVI injection, as well as approximately one year afterwards (long-term). The “performance sampling” values in these tables are the extreme values of these param-eters that illustrate the maximum treatment achieved in the aquifer. The wells are grouped into treatment zone wells (Table 2-2) and extraction wells (Table 2-3); the objective is to see how well the NZVI was distributed to wells other than the extraction wells, towards which the NZVI was drawn by a forced gradient. Interestingly, although dissolved iron (NZVI) levels clearly were higher in the extraction wells
than in other treatment zone wells, enough iron reached the other treatment zone wells to reduce ORP and change other parameters to a comparable range. Substantial hydrogenolysis and biodegradation of the parent compounds TCE and TCA to cis-1,2-DCE and 1,1-DCA, respectively, are evident in these tables. Sulfate reducing conditions and ethene generation are obvious signs of microbial activity. An increase in chloride is evident despite relatively high native levels and indicates that dechlorination is proceeding to completion, despite signs of temporary accumulation of cis-1,2-DCE and 1,1-DCA. 2.3.5 Cost Summary. The total costs for the field nanoscale iron demonstration was reported to be approximately $259,000, with an additional $153,000 for administrative tasks such as project manage-ment, work plan development, and bench-scale study (Table 2-4).
Table 2-4. Costs for NZVI Demonstration at NAS Jacksonville
Category/Item Cost % of Total Cost Mobilization $28,000 10.8 Monitoring Well Installation $52,000 20.0 Injection/Circulation Events (NZVI Cost = $37,000)
$67,000 25.9
Sampling and Analysis including Derived Waste Analysis and Disposal
$110,000 42.5
Other Miscellaneous costs $2,000 0.8 Total Cost of Demonstration $259,000 100 Additional Project Management $153,000 NA
NA = not applicable.
27
2.3.6 Regulatory Issues. This demonstration project was conducted under the oversight of regula-tory personnel from the Florida Department of Environmental Protection (FDEP) and the United States Environmental Protection Agency (U.S. EPA) but with minimal regulatory permit requirements and constraints. 2.3.7 Discussion. The demonstration showed that NZVI injection is a promising technology for source zone treatment. The following conclusions and lessons learned can be obtained:
• NZVI injection caused a substantial reduction in TCE levels in several source zone wells.
• ORP reduction was experienced in most monitoring wells in the source zone, indicating that the direct-push and recirculation methods of injection worked relatively well. Some migration of NZVI outside the treatment zone may have occurred through preferential pathways.
• Performance data indicate that abiotic reduction of CVOCs (via beta-elimination) was a minor factor in the decline of contaminant concentrations.
• The substantial increases in cis-1,2-DCE and 1,1-DCA indicate that microbially-driven anaerobic reductive dechlorination and hydrogenolysis may have played a primary role in the CVOC treatment.
• The NZVI injected did not create the strongly reducing conditions (ORP of −400 mV or lower) necessary to generate substantial abiotic degradation of TCE.
• One possibility is that the NZVI was passivated before injection when it was mixed with oxygenated water (groundwater extracted from one of the wells was used to prepare the iron slurry). NZVI has a very small particle size, is highly reactive, and can react rapidly with oxygenated species (e.g., DO, nitrate, etc.) in most water supplies.
• Another possibility is that insufficient iron may have been injected. Iron mass needs to be determined based on iron-to-groundwater (or iron-to-soil) ratio, rather than iron-to-contaminant ratio (an ORP of < −400 mV must be achieved in the target treatment volume). To some extent, NZVI migration outside the treat-ment zone also reduced the mass of iron in the targeted zone.
2.4 Naval Air Engineering Station Lakehurst 2.4.1 Site Description. NAES Lakehurst is located in Jackson and Manchester Townships, Ocean County, New Jersey, 14 miles inland from the Atlantic Ocean. NAES Lakehurst covers 7,382 acres and is within the Pinelands National Reserve, the most extensive undeveloped land tract of the Middle Atlantic Seaboard. The site location is shown on Figure 2-23 (Environmental Chemical Corp., 2004). This project involves two areas with the highest groundwater contaminant concentrations within the northern plume (Figure 2-24) and the southern plume (Figure 2-25) in NAES Lakehurst, Areas I and J. The principal contaminants found in the groundwater at Areas I and J include PCE, TCE, 1,1,1-TCA, and degradation products such as cis-DCE and VC. The contamination extends vertically 70 ft below the groundwater table. The largest amount of contamination is located in the zone from 45 to 60 ft below the groundwater table.
28
Figure 2-23. NAES Lakehurst Site Location Map
29
Figure 2-24. Total VOC Concentrations in Monitoring Wells Baseline (Northern Plume)
30
Figure 2-25. Total VOC Concentrations in Monitoring Wells Baseline (Southern Plume)
31
Both areas are underlain by approximately 75 ft of unconsolidated sediments characterized as a fairly uniform, brown-yellow, fine to coarse sand. Grain-size analyses characterized the sediments as 0.5 to 5.9% gravel, 86 to 94% sand, and 5 to 9% clay. Total organic carbon (TOC) levels ranged from 40 to 800 mg/kg. A bench-scale treatability study in 2001 and a pilot test study in 2003 were performed at NAES to evaluate the feasibility of using BNP as an in situ remediation technology to reduce or eliminate the contaminants of concern at Areas I and J at NAES Lakehurst. This preliminary testing showed that BNP had the potential to perform better than NZVI without any catalyst coating. 2.4.2 Technology Implementation. BNP iron was injected using direct-push technology (i.e., Geoprobe) at 10 locations (NP-6 through NP-15) within the northern plume and five locations (NP-1 through NP-5) within the southern plume (Environmental Chemical Corp., 2004). A total of 20 lb of BNP were mixed with 1,200 gallons of water at each injection point. A total of 300 lb of BNP were mixed with 18,000 gallons of water. Groundwater used to create the BNP solution for injection into the northern plume was obtained from an inactive recovery well (RWI-1). Potable water, obtained from an NAES Lakehurst fire hydrant, was used to prepare the BNP solution for the southern plume injections. The BNP solution was injected into subsurface groundwater using a Geoprobe submersible pump. For each 4-ft injection interval, 4 lb of BNP was added to approximately 240 gallons of water, yielding a BNP concentration of approximately 2 g/L. For each injection point, the steel injection rods were advanced to the deepest treatment interval where the 240 gallons of solution was injected. The rods were then retracted 4 ft, where another 240 gallons of BNP solution was injected. This process continued until BNP had been injected into the entire 20-ft treatment zone. The injection intervals for each point included 66 to 70, 62 to 66, 58 to 62, 54 to 58, and 50 to 54 ft bgs. 2.4.3 Performance Evaluation Approach. One monitoring well (MW-NN) for monitoring the local effectiveness of the BNP treatment was installed directly downgradient of the injection locations in the southern plume. Monitoring well MW-NN was screened from 50 to 70 ft below grade, which matches the target treatment zone depth where BNP injections occurred. Groundwater samples were collected from each of 13 monitoring wells for analysis of CVOCs, chloride, iron, and dissolved iron. Seven sampling events, including one baseline pre-injection event and six post-injection events, were conducted to assess the effectiveness of the BNP treatment. The six post-injection sampling events were conducted 1 week, 2 weeks, 4 weeks, 8 weeks, 12 weeks, and 6 months after BNP injection. The performance evaluation was based on the percent reduction in con-taminant level from the baseline assessment to post-injection. Field monitoring data included depth to water, turbidity, ORP, DO, and pH. 2.4.4 Technology Performance. Performance was evaluated by identifying apparent trends in the groundwater sampling results. Concentrations for total CVOCs and the individual CVOCs of interest (TCE, PCE, DCE, and VC) showed a decreasing trend in most wells during the monitoring period. An apparent increase in VOC concentrations was observed in approximately 50% of the monitoring wells in the sampling round performed one week after the BNP injections; however, in subsequent sampling rounds, a decrease was observed for virtually all CVOCs (and total CVOCs), in all of the monitoring wells. The initial increase was likely caused by desorption of CVOCs from the soil particles to the aqueous phase as a result of the BNP treatment. The percentage decrease from the baseline measurements to measurements collected during the post-injection monitoring period was calculated for both the field parameters and laboratory analytical results. The two primary contaminants of concern, TCE and DCE, showed an average decrease of 79%
32
and 83%, respectively. The average decrease in total VOCs concentrations was 74%. Although the over-all average reduction provides a good summary which can be useful in evaluating the effectiveness of the BNP treatment, evaluation of trend on a per well basis may also provide useful information. Contaminant concentrations before and after injection in source area wells MW-1 and MW-2 are shown on Fig-ures 2-26 and 2-27, respectively. As illustrated in Figure 2-27, CVOC levels actually increased in MW-2
0
2
4
6
8
10
12
14
16
18
0 50 100 150 200Days (after baseline sampling)
Con
cent
ratio
n (µ
g/L)
TCE (ug/L)PCE (ug/L)DCE (ug/L)VC (ug/L)
Figure 2-26. TCE, PCE, DCE, and VC Concentrations in Source Area Monitoring Well MW-1
0
20
40
60
80
100
120
140
160
0 50 100 150 200Days (after baseline sampling)
Con
cent
ratio
n (µ
g/L)
TCE (ug/L)PCE (ug/L)DCE (ug/L)VC (ug/L)
Figure 2-27. TCE, PCE, DCE, and VC Concentrations in Source Area Monitoring Well MW-2
33
34
during the first round of monitoring, one month after BNP injection. This could be due to displacement of dissolved-phase CVOCs by 18,000 gallons of injected water. Although expected to decline as a result of the BNP injections, the ORP levels decreased slightly in 3 of the 13 wells six months after the injection. ORP levels increased in the majority of the wells or remained relatively the same after injection, as shown in Figure 2-28. This may indicate that not enough NZVI was injected to create the strongly reducing conditions necessary for abiotic reduction of CVOCs. It is possible that the hydrant water and/or the recovery well water that was used to make the NZVI injection slurry was aerated. The oxygen in the water could have passivated the iron and also increased the ORP of the aquifer, upon injection. A total of 18,000 gallons of water was injected into the treatment zone along with the NZVI. Injection of this large a volume of oxygenated water could have diluted the groundwater and increased its ORP in some regions. NZVI reacts with CVOCs and water, and typically should cause pH to rise significantly. A slight increase in pH was observed in the monitoring wells when measured during the first and fourth post-injection sampling events. However, average pH after injection was actually lower than during the baseline sampling event in the other sampling rounds. The average pH measurements at the baseline sampling event were about 5.0 standard units. The average pH readings approximately 6 months after injection were about 4.0 standard units. The pH values for monitoring wells are presented in Figure 2-29. In general, pH values remained below 6 throughout the monitoring period. The highest concentration of chloride detected was 31.5 mg/L in well RWI-1 during the last sampling event. The average concentration detected in the other wells throughout the monitoring period was approximately 7 mg/L. Analytical results indicated a slight increase in chloride in six monitoring wells and relatively stable concentrations in the other seven monitoring wells. There was initial increase in the concentrations of both total iron and dissolved iron following the injection of BNP in 4 of the 13 monitoring wells, which may indicate that the BNP material had reached those wells. Analytical results from two of the monitoring wells in the southern plume showed relatively low levels of iron during the baseline sampling event. Results from subsequent sampling events indicate very little increase throughout the remaining monitoring period. The iron data do not show a strong correlation between total or dissolved iron concentrations and reduction in VOC concentrations. 2.4.5 Cost Summary. The total costs for the field nanoscale iron demonstration was reported to be approximately $255,500, which included monitoring well installation, baseline sampling, nanoscale iron injection, six-month post-injection sampling, and reporting results (Table 2-5). 2.4.6 Regulatory Issues. No significant regulatory issues were reported for this demonstration. 2.4.7 Discussion. The following conclusions and lessons learned can be obtained from this field demonstration:
• A substantial reduction in the dissolved-phase concentration of the target CVOCs (PCE, TCE, DCE, and VC) was observed following NZVI injection.
• However, from the monitoring data, it is unclear what caused this reduction in CVOC concentrations. Indicators of strongly reducing conditions (ORP of −400 mV or lower) suitable for abiotic reduction (beta-elimination) or even mildly reducing conditions anaerobic enough to favor biodegradation or
Baseline (Pre Injection) - Oct 29 and 31, 2003 Post Injection 1 - December 1 and 2, 2003 Post Injection 2 - December 9 and 10, 2003Post Injection 3 - December 22 and 23, 2003 Post Injection 4 - January 20 and 21, 2004 Post Injection 5 - February 17 and 18, 2004Post Injection 6 - May 11 and 12, 2004
Baseline (Pre Injection) - Oct 29 and 31, 2003 Post Injection 1 - Decem ber 1 and 2, 2003 Pos t Injection 2 - Decem ber 9 and 10, 2003
Pos t Injection 3 - Decem ber 22 and 23, 2003 Post Injection 4 - January 20 and 21, 2004 Pos t Injection 5 - February 17 and 18, 2004
Pos t Injection 6 - May 11 and 12, 2004
Upgradient Well
Figure 2-29. pH Levels at NAES Lakehurst
Table 2-5. Costs for NZVI Demonstration at NAES Lakehurst
Category/Item Cost % of Total Cost Nanoscale Treatment (Field Effort) $154,600 60.5 Monitoring Well Installation $24,400 9.5 Sampling and Analysis $58,400 22.9 Reporting $18,100 7.1 Total Cost of Demonstration $255,500 100
hydrogenolysis were absent in the monitoring data. There was no substantial pH increase observed in the monitoring wells. In fact, in many cases, ORP increased and pH decreased after NZVI injection.
• One possible explanation is that the NZVI was passivated before injection, when it was slurried with a large volume of highly aerated hydrant water or water pumped out of a recovery well. The decline in CVOC levels observed in the monitoring wells could be a result of dilution due to the injection of 18,000 gal-lons of water (iron slurry) into the treatment zone. The observed increase in CVOC levels in 50% of the monitoring wells may indicate that injected water displaced native water containing dissolved CVOCs in the source zone.
37
Section 3.0: DISCUSSION 3.1 Technical Performance The three field demonstrations at Hunters Point, NAS Jacksonville, and NAES Lakehurst represent a valuable repertoire of application information on an emerging source zone treatment technology involving the injection of NZVI. Table 3-1 summarizes the key results of the NZVI demonstrations.
Table 3-1. Key Results of the NZVI Demonstrations
Parameter Hunters
Point Study #1
Hunters Point
Study #2 NAS Jacksonville NAES Lakehurst
Fe0 Mass Injected (lb) 16,000 72,650 300 300 Mass of Soil Treated (lb) 4,544,100 75,000,000 2,610,900 25,650,000 Fe0/soil ratio 0.0035 0.001 0.00011 0.000012
Source of water injected Potable Water
Potable Water
Deionized water and Groundwater
Northern Plume - Groundwater Southern Plume - Fire Hydrant
Fe0/(injection water) ratio (g/L) 265 300 4.5 to 10 2 Baseline DO of groundwater (mg/L) NA 0.0 to 6.1 0.15 to 2.74 0.00 to 5.85
Baseline ORP of groundwater (mV)
(−87.6) to 166 (−51) to 136 (−221.5) to 159 26 to 271
Baseline nitrate (mg/L) 1.2 to 4.4 NA ND to 5.4 NA Baseline ferrous iron (µg/L) ND to 1,400 ND to 6,300 0.21 to 3,500 0 to 7,340 Baseline sulfate (mg/L) NA NA 6.5 to 18 NA Baseline alkalinity (mg/L) 110 to 190 92 to 510 40 to 85 NA
NA = not available. ND = not detected.
In a typical ZVI application, whether it is for plume control (permeable reactive barriers) or for source treatment (DNAPL), the native inorganic chemistry indicators (ORP, pH, chloride, alkalinity, etc.) must be in congruence with the reduction in CVOC levels. This congruence of organic and inorganic indicators is especially necessary when the contaminant source is being characterized purely by measuring dissolved CVOC concentrations in monitoring wells and not CVOC/DNAPL mass in soil or mass flux in the downgradient aquifer. Note, for example, that a 76% decrease in dissolved CVOC concentrations (observed at the NAES Lakehurst site) is not equivalent to a 76% decrease in the total CVOC or DNAPL mass present in the target region. If only the dissolved-phase CVOCs have been treated (or displaced), any untreated DNAPL or adsorbed-phase contamination could eventually cause a rebound in dissolved CVOC levels. Although long-term monitoring will eventually reveal whether or not significant DNAPL or CVOC mass has been removed by the treatment, in the short-term, inorganic chemistry indicators provide important clues on how effective the treatment has really been (and that CVOCs have been destroyed, not just displaced or diluted). The performance data at these three sites were evaluated accordingly.
38
At Hunters Point, the first NZVI injection caused a strong and relatively sustained decrease in ORP levels to −400 mV or lower (see Table 3-1). Concomitantly, pH levels rose above 8. There was no significant rise in cis-1,2-DCE levels in the monitoring wells, which indicates that the strongly reducing conditions necessary for abiotic reduction of CVOCs were created. An increase in chloride was not evident above native chloride levels in the aquifer; this is the case at many CVOC-contaminated sites where native chloride levels are relatively high, compared to CVOC levels. Alkalinity, calcium, and magnesium, which are other possible indicators of strongly reducing conditions, were not reported for the Hunters Point site. Overall, these inorganic indicators confirm that significant CVOC (and possibly DNAPL) mass probably was destroyed by the treatment. In the one year following the first NZVI injection, limited long-term monitoring in one of the wells (MW211F) showed that even as the NZVI dissipated and ORP started rebounding upwards, both TCE and cis-1,2-DCE levels remained depressed. If this trend continues throughout the treatment zone and when ORP rebounds to pre-treatment levels, it will be the clearest indication that source treatment is mostly complete. As indicated in Table 3-1, the actual iron-to-soil ratio in the second NZVI injection study at Hunters Point was 0.001. In the first study, an iron-to-soil ratio of 0.008 was targeted and enough ZVI was injected accordingly. As it turned out, the radius of influence achieved was much greater than anticipated and the ZVI was distributed in a much larger region, resulting in an actually iron-to-soil ratio of 0.004. The resulting treatment of a larger region was beneficial for the project, as surrounding regions were contaminated too. In the second study, an iron-to-soil ratio of 0.004 was targeted but only a 0.001 ratio was achieved. Sharp declines in ORP in surrounding wells and observance of ZVI at the ground surface due to daylighting indicate that some ZVI migrated outside the treatment zone. Therefore, the injected iron was distributed over a larger volume of soil, preventing the desired 0.004 ratio (which was determined from bench-scale tests) from being achieved. In the second injection study, the decline in ORP was not as sharp as in the first one, and the subsequent rebound in ORP also occurred earlier. There is evidence of accumulation of cis-DCE through aerobic biodegradation and hydrogenolysis and abiotic (beta-elimination) reactions were not a primary pathway in the second study. At NAS Jacksonville, following NZVI injection, ORP levels declined to approximately −200 mV (see Table 3-1), which was probably enough to stimulate biodegradation and hydrogenolysis, but not sufficient to cause any significant abiotic reduction (beta-elimination) of CVOCs. This is borne out by the fact that cis-1,2-DCE levels increased substantially in many wells, a sign of heightened anaerobic microbial activity. There was no noticeable increase in the pH that would indicate strongly reducing conditions. At this site, as ORP levels have started rebounding, TCE levels have started increasing too in some wells, indicating that there is residual DNAPL or CVOC mass in the treatment zone. At NAES Lakehurst, TCE levels declined in about half the wells and increased in the other half. ORP levels did not decline following NZVI injection and may actually have increased in several wells (see Table 3-1). Groundwater pH remained below 6 and was relatively unchanged. There was no noticeable increase in DCE levels that would indicate anaerobic microbial activity. At this site, conditions remained unfavorable both for biostimulation and abiotic reduction. There are three possible reasons for the differences in performance among the three sites. The first possible reason may simply be that more ZVI mass was injected at the Hunters Point site than at NAS Jacksonville or NAES Lakehurst. In fact, as seen in Table 3-1, the order of treatment effectiveness at the three site is the same as the order of iron mass injected; the greater the iron-to-soil ratio achieved, the greater was the decline in ORP in the aquifer, and the greater was the treatment achieved. It appears that injecting sufficient iron mass and obtaining the required reduction in ORP in the target aquifer zone is more important than achieving direct contact between the NZVI and the DNAPL.
39
A second possible reason is that at NAS Jacksonville and NAES Lakehurst, the NZVI some-how became passivated before it was injected. In the case of NAS Jacksonville, the passivation could have been partial. In the case of NAES Lakehurst, passivation could have been more substantial. At NAES Lakehurst, water from a hydrant and water from a pumping well were used to make up a slurry of NZVI for injection. Oxygen in the water from such highly aerated sources could passivate the NZVI quickly. The presence of high levels of dissolved solids in the water also could cause passivation of the NZVI. However, similarly oxygenated water was used to make up the slurry for injection at both NAS Jacksonville and Hunters Point. One difference was that much more water was used to make up the slurry at NAES Lakehurst than at NAS Jacksonville. At NAES Lakehurst an iron-to-water suspension of 2 g/L was injected, whereas at NAS Jacksonville, the iron-to-water suspension contained 4.5 to 10 g/L or iron. The least amount of water was used at Hunters Point (265 to 300 g/L of iron). The method of injection could have affected the choice of how much water to add to the iron to make the injection slurry. At NAES Lakehurst and NAS Jacksonville, the slurry was injected into the existing formation by direct push, using relatively lower injection pressures. This slurry had to have a low solids content to facilitate entry into the soil pores. At Hunters Point, nitrogen was used as a carrier gas to pneumatically inject ZVI into the formation. Fracturing of the formation facilitated the entry of higher solids-content slurry into the formation. Despite this fracturing, the injection was relatively well controlled and migration of the iron beyond the target treatment zone appears to have been relatively limited. Even at the lower injection pressures used in the recirculation delivery system at NAS Jacksonville, there was evidence of limited migration of the NZVI outside the target treatment zone, probably through a preferential pathway or heterogeneity. Possibly, the heterogeneous nature of the formation may have more of a bearing on the degree of control over the injection than the injection pressures used. The third possible reason for the differences in performance at the three sites could be the nature of the NZVI particles used. At NAS Jacksonville and NAES Lakehurst, true NZVI was used. The nanoscale particle size of this NZVI caused it to be much more reactive than the microscale particles used at Hunters Point. In addition, the nanoscale particles at NAS Jacksonville and NAES Lakehurst had been catalyzed by the addition of a second metal (BNP). This highly reactive NZVI may have dissipated or become passivated much more rapidly when mixed with water than the microscale ZVI, thus leading to reduced effectiveness of the injected NZVI. The microscale ZVI probably was less reactive and therefore less susceptible to passivation in water containing native oxygen and other oxidized species. 3.2 Cost Comparison Table 3-2 summarizes the costs for the three sites. At all three source treatment sites, the total NZVI injection implementation costs were in the same range ($250,000 to 300,000). The total costs of the four projects at the three sites cannot really be compared on an equivalent basis because the levels of performance (treatment) achieved in the four projects differed considerably. However, the cost table does illustrate the range of costs incurred when different types of ZVI and different injection techniques are used to treat certain sizes of sites. The cost of the ZVI material itself also was similar for the first study at Hunters Point ($32,500) and the demonstration at NAS Jacksonville ($37,500); however, the price (unit cost) of the micron-sized iron used at Hunters Point is much lower than the price of the NZVI used at NAS Jacksonville (see Section 1.2.4). Therefore, for approximately the same cost ($30,000-$40,000), 16,000 lb of ZVI was injected at Hunters Point (Study #1), versus 300 lb at NAS Jacksonville. As mentioned in Section 3.1 above, if the primary objective of the treatment is to deliver sufficient iron mass into the aquifer, then the microscale iron appears to be more cost-effective than NZVI. The microscale iron also appears to sustain reductive conditions longer, enabling continued treatment of residuals.
40
Table 3-2. Cost Breakdown for the Hunters Point, NAS Jacksonville, and NAES Lakehurst Sites
Hunters Point Study #1
Hunters Point Study #2 NAS Jacksonville NAES Lakehurst
Although biostimulation is a desirable outcome of ZVI treatment and may help to degrade residual CVOCs long after the NZVI has dissipated, biostimulation alone may not be a sufficient goal for NZVI treatment from a cost standpoint. There are other, much cheaper, reducing agents (or electron donors) that can stimulate biodegradation. Creating conditions favorable for abiotic reduction (primarily beta-elimination) is a necessary goal for a relatively expensive reagent, such as NZVI, because abiotic reduction is much faster. Abiotic reduction proceeds primarily though the beta-elimination pathway and formation of partially-dechlorinated and more recalcitrant products, such as DCE and VC, is largely avoided. This reduces remediation and monitoring time and cost for the site. Of the three demonstra-tions, the first study at Hunters Point appears to have achieved the significant abiotic reduction necessary to make the use of NZVI cost-effective. Given the relatively high cost of the reagent (NZVI), it may be cost-effective to invest a little more in source delineation than with other technologies. Reducing the source footprint through better source characterization may help focus the treatment to portions of the aquifer where it is really required (that is, zones where DNAPL and/or the highest CVOC concentrations are located). If the primary objective, as it appears from the three field demonstrations, is to get sufficient iron into the aquifer, it may be cost-effective to use the cheapest particle size that can be injected. Larger particle sizes also are likely to be more persistent in the aquifer, as evidenced by the fact that the micro-scale iron lasted longer in the aquifer than NZVI (the ORP of the treated aquifer remained lower longer at Hunters Point than NAS Jacksonville). It may be interesting to note that as long as there are no limita-tions on injectability of higher particle sizes, granular ZVI (−8 to +50 mesh), of the type used in permeable reactive barriers, could be very cost-effective for source zone application, as it is much lower
41
in price than either NZVI or microscale iron. If pneumatic fracturing is the method of injection, as it was at Hunters Point, it may be possible to inject granular ZVI into the fractures by this method. However, granular ZVI may not be injectable by simple direct push or recirculation as was done at NAS Jacksonville. 3.3 Regulatory Issues No significant regulatory issues were identified at any of the three sites. ZVI technology for permeable reactive barriers is familiar to regulators for over a decade now and injection of NZVI is seen as an extension of the same type of treatment. 3.4 Summary The results indicate that NZVI injection is a promising option for treatment of source zones. Some additional monitoring at all three sites may be worthwhile to verify the reasons for the differences in performance and to verify how much residual DNAPL is left at these sites, once the post-treatment ORP has rebounded to pre-treatment levels. Also of interest would be to see whether the downgradient plume has been weakened enough by the source removal action for natural attenuation to be a viable long-term option or whether additional NZVI injection is required.
In summary, the lessons learned from these three sites (and four NZVI applications) are as follows:
• Creating a strongly reducing environment (ORP below −400 mV) is essential for promoting and fostering abiotic reactions and minimizing the generation of partially dechlorinated byproducts that tend to persist longer in the aquifer. Designing the ZVI mass injected to achieve an ORP below −400 mV is more important than trying to match the ZVI mass stoichiometrically to the estimated mass of contaminants in the target aquifer region.
• To create a strong enough reducing environment, it appears that the treatment should be designed to achieve an iron-to-soil ratio of 0.004 in the target portion of the aquifer. To achieve this design ratio, excess ZVI may have to be injected to account for possible heterogeneous distribution of ZVI in the treatment zone, possible migration of ZVI to the surrounding aquifer, and possible consump-tions/passivation of iron by native oxidized species in the groundwater.
• Injection techniques that minimize the volume of water used to prepare the iron slurry are likely to better preserve the reactivity of the iron than delivery techniques that depend on injection of iron with large volumes of water. If large volumes of water have to be used, an effort should be made to de-oxygenate it, for example, by sparging nitrogen. However, other oxidized species (e.g., nitrates and sulfates) may persist and contribute to passivation of the iron.
• Larger ZVI particle sizes may be less prone to the type of quick passivation that the true nano-scale particles appear to be susceptible to. There is a tradeoff between the lower reactivity and injection challenges associated with larger particles and the higher reactivity and long-term instability of smaller ZVI particles in the presence of native oxidized species in the groundwater.
42
• Short-term monitoring of ZVI injection performance should demonstrate a congruence of trends in the measurements of parent compounds (e.g., TCE), byproducts (e.g., cis-1,2-DCE, VC, ethene, chloride, etc.), and other indicator parameters (e.g., ORP, pH, etc.). All these parameters should preferably indicate strongly reducing conditions and abiotic (beta-elimination) reactions.
• Long-term monitoring of the treatment zone is essential until ORP levels have rebounded to pre-treatment levels. The decline in dissolved CVOC concentra-tions experienced immediately after ZVI injections would have to be sustained in the weeks and months following ORP rebound (and ZVI depletion) for DNAPL source treatment to be considered complete (or substantial).
• The anaerobic biodegradation of CVOCs stimulated in the mildly reducing conditions created by a low iron-to-soil ratio is desirable, but by itself may not be sufficient to justify the relatively high cost of the NZVI reagent injected (there are other lower-cost biostimulants available). Inadequate ZVI mass leads to hydrogenolysis and biodegradation of parent compounds to partially dechlorinated byproducts that may persist longer in the aquifer. Sufficient iron mass has to be injected in the aquifer, whether it is for source treatment or plume control, to generate the strongly reducing conditions necessary for abiotic (beta-elimination) reduction reactions to occur.
43
Section 4.0: REFERENCES ARS Technologies Inc. and W.-X. Zhang. 2001. Treatability Study of the Use of Bimetallic Nanoscale
Particles for the Treatment of Contaminated Groundwater, NAES Lakehurst. June.
ARS Technologies Inc. 2003. Field Summary, FeroxSM Technology Demonstration, Parcel C, Remedial Unit 4, Hunters Point Shipyard (HPS), San Francisco, California. May 23.
CH2M Hill Constructors Inc. and J.A. Jones. 2002. Hangar 1000, NAS Jacksonville, Florida.
Environmental Chemical Corporation. 2004. Draft Final Report for Nanoscale Particle Treatment of Groundwater at Areas I and J, Naval Air Engineering Station, Lakehurst, NJ. August.
Gavaskar, A., B. Sass, N. Gupta, E. Drescher, W. Yoon, J. Sminchak, J. Hicks, and W. Condit. 2002. Evaluating the Longevity and Hydraulic Performance of Permeable Reactive Barriers at Department of Defense Sites. Final Report Prepared for Naval Facilities Engineering Service Center, Port Hueneme, California. April 24.
Gu, B., D.B. Watson, L. Wu, D.H. Phillips, D.C. White, and J. Zhou. 2002. “Microbiological Character-istics in a Zero-Valent Iron Reactive Barrier.” Environ Mon. Assess., 77(3): 293-309.
Innovative Technical Solutions, Inc. (ITSI). 2005. Final Zero-Valent Iron Injection Treatability Study Report, Building 272, Parcel C, Hunters Point Naval Shipyard, San Francisco, California. Prepared for Base Realignment and Closure (BRAC) Program Management Office (PMO) West under Contract No. N68711-02-D-8213, Delivery Order No. CT012.
ITRC. 2005. Permeable Reactive Barriers: Lessons Learned/New Directions. Prepared by the Interstate Technology and Regulatory Council, Permeable Reactive Barriers Team. February.
PRC Environmental Management, Levin-Fricke-Recon Inc., and Uribe and Associates. 1997. Parcel C Remedial Investigation, Draft Final Report, HPS, San Francisco, California. March 13.
Roberts, A.L., L.A. Totten, W.A. Arnold, D.R. Burris, and T.J. Campbell. 1996. “Reductive Elimination of Chlorinated Ethylenes by Zero Valent Metals.” ES&T, 30: 2654-2659.
Tetra Tech, Inc. 2003. Cost and Performance Report, FEROX Injection Technology Demonstration, Parcel C, Remedial Unit C4, Hunters Point Shipyard, San Francisco, California. Prepared for Naval Facilities Engineering Command-Southwest Division. July.
Tetra Tech, Inc. 2005. Draft Final Nanoscale Iron Injection Cost and Performance Report, Naval Air Station, Jacksonville, Florida. Prepared for Naval Facilities Engineering Command-Southern Division. July.
TtNUS. 2003a. Bench Scale Treatability Study Work Plan, Hanger 1000, NAS Jacksonville, Jacksonville, Florida.
TtNUS. 2003c. Full Scale Treatability Study Work Plan, Hanger 1000, NAS Jacksonville, Jacksonville, Florida.
Wang, C.-B., and W.-X. Zhang. 1997. “Synthesizing Nanoscale Iron Particles for Rapid and Complete Dechlorination of TCE and PCBs.” Environmental Science and Technology, 31(7): 2154-2156.