Contribution of Buffer Zone Programs to Reduce Human-Wildlife Impacts: the Case of the Chitwan National Park, Nepal Babu Ram Lamichhane 1,2,3 & Gerard A. Persoon 1 & Herwig Leirs 2 & Shashank Poudel 3 & Naresh Subedi 3 & Chiranjibi Prasad Pokheral 3 & Santosh Bhattarai 3 & Pabitra Gotame 3 & Rama Mishra 4 & Hans H. de Iongh 1,5 # The Author(s) 2019 Abstract Buffer zones around parks/reserves are designed to maintain ecological integrity and to ensure community participation in biodiversity conservation. We studied the fund utilization pattern of buffer zone programs, mitigation measures practiced, and attitudes of residents in buffer zone programs of Chitwan National Park, Nepal. The buffer zone committees spent only a small portion (13.7%) of their budget in direct interventions to reduce wildlife impacts. Human-wildlife conflicts were inversely related to investment in direct interventions for conflict prevention and mitigation. Peoples’ attitudes towards wildlife conservation were largely positive. Most of the people were aware of buffer zone programs but were not satisfied with current practices. We recommend that buffer zone funds be concentrated into direct interventions (prevention and mitigation) to reduce wildlife conflicts. Our findings will be helpful in prioritizing distribution of funds in buffer zones of parks and reserves. Keywords Buffer zone . Human-wildlife conflict . Compensation . Fences . Chitwan National Park, Nepal Introduction Throughout the world, the expansion of human land use at the expense of natural ecosystems has caused wildlife habitats to become increasingly insular, fragmented, and degraded (Lambin and Meyfroidt 2011). Some remaining habitats are set aside for protection as parks/reserves where many wildlife populations are recovering (Bruner et al. 2001; IUCN 2008; Naughton-treves et al. 2005). Often in close proximity to these areas, communities farm crops or raise livestock, presenting an attractive food source for wild animals, which consequent- ly frequently raid crops, kill livestock or attack humans. In retaliation they may be killed. Such reciprocal impacts by humans and wildlife are among the major threats to wildlife conservation (Dickman 2010; Madden 2004). Management of such impacts is even more challenging where endangered wildlife causes serious damage to human lives or livelihoods (Woodroffe et al. 2005). Historically, communities managed wildlife impacts local- ly by clearing habitat or removing wild animals perceived as threats (Treves et al. 2009). Such responses are illegal or so- cially unacceptable where they do not comply with national and international regulations for biodiversity conservation (Madden 2004). Wildlife managers strive to increase or main- tain wildlife populations through protection and habitat man- agement, while local communities are interested in access to the natural resources as well as their own safety and property (Andrade and Rhodes 2012). While human-wildlife impacts are the result of simple competition over shared resources, they may also reflect political conflict between local residents and institutions having contrasting viewpoints about wildlife (Treves et al. 2006). If such conflicts are not managed, affect- ed communities can become antagonistic towards wildlife and Electronic supplementary material The online version of this article (https://doi.org/10.1007/s10745-019-0054-y) contains supplementary material, which is available to authorized users. * Babu Ram Lamichhane [email protected]1 Institute of Cultural Anthropology and Development Sociology, Faculty of Social and Behavioural Sciences, Leiden University, 2333 Leiden, AK, Netherlands 2 Evolutionary Ecology Group, Faculty of Sciences, University of Antwerp, Campus Drie Eiken, 2333 Antwerp, AK, Belgium 3 National Trust for Nature Conservation (NTNC), Khumaltar, POB 3712, Lalitpur, Nepal 4 Wildlife Conservation Association Nepal (WildCAN), Kathmandu, Nepal 5 Institute of Environmental Sciences (CML), Faculty of Sciences, Leiden University, 2300 Leiden, RA, Netherlands Human Ecology https://doi.org/10.1007/s10745-019-0054-y
Transcript
Contribution of Buffer Zone Programs to Reduce Human-WildlifeImpacts: the Case of the Chitwan National Park, Nepal
Chiranjibi Prasad Pokheral3 & Santosh Bhattarai3 & Pabitra Gotame3& Rama Mishra4 & Hans H. de Iongh1,5
# The Author(s) 2019
AbstractBuffer zones around parks/reserves are designed to maintain ecological integrity and to ensure community participation inbiodiversity conservation. We studied the fund utilization pattern of buffer zone programs, mitigation measures practiced, andattitudes of residents in buffer zone programs of Chitwan National Park, Nepal. The buffer zone committees spent only a smallportion (13.7%) of their budget in direct interventions to reduce wildlife impacts. Human-wildlife conflicts were inversely relatedto investment in direct interventions for conflict prevention and mitigation. Peoples’ attitudes towards wildlife conservation werelargely positive. Most of the people were aware of buffer zone programs but were not satisfied with current practices. Werecommend that buffer zone funds be concentrated into direct interventions (prevention and mitigation) to reduce wildlifeconflicts. Our findings will be helpful in prioritizing distribution of funds in buffer zones of parks and reserves.
Keywords Buffer zone . Human-wildlife conflict . Compensation . Fences . ChitwanNational Park, Nepal
Introduction
Throughout the world, the expansion of human land use at theexpense of natural ecosystems has caused wildlife habitats tobecome increasingly insular, fragmented, and degraded(Lambin and Meyfroidt 2011). Some remaining habitats areset aside for protection as parks/reserves where many wildlife
populations are recovering (Bruner et al. 2001; IUCN 2008;Naughton-treves et al. 2005). Often in close proximity to theseareas, communities farm crops or raise livestock, presentingan attractive food source for wild animals, which consequent-ly frequently raid crops, kill livestock or attack humans. Inretaliation they may be killed. Such reciprocal impacts byhumans and wildlife are among the major threats to wildlifeconservation (Dickman 2010; Madden 2004).Management ofsuch impacts is even more challenging where endangeredwildlife causes serious damage to human lives or livelihoods(Woodroffe et al. 2005).
Historically, communities managed wildlife impacts local-ly by clearing habitat or removing wild animals perceived asthreats (Treves et al. 2009). Such responses are illegal or so-cially unacceptable where they do not comply with nationaland international regulations for biodiversity conservation(Madden 2004). Wildlife managers strive to increase or main-tain wildlife populations through protection and habitat man-agement, while local communities are interested in access tothe natural resources as well as their own safety and property(Andrade and Rhodes 2012). While human-wildlife impactsare the result of simple competition over shared resources,they may also reflect political conflict between local residentsand institutions having contrasting viewpoints about wildlife(Treves et al. 2006). If such conflicts are not managed, affect-ed communities can become antagonistic towards wildlife and
Electronic supplementary material The online version of this article(https://doi.org/10.1007/s10745-019-0054-y) contains supplementarymaterial, which is available to authorized users.
1 Institute of Cultural Anthropology and Development Sociology,Faculty of Social and Behavioural Sciences, Leiden University,2333 Leiden, AK, Netherlands
2 Evolutionary Ecology Group, Faculty of Sciences, University ofAntwerp, Campus Drie Eiken, 2333 Antwerp, AK, Belgium
3 National Trust for Nature Conservation (NTNC), Khumaltar, POB3712, Lalitpur, Nepal
4 Wildlife Conservation Association Nepal (WildCAN),Kathmandu, Nepal
5 Institute of Environmental Sciences (CML), Faculty of Sciences,Leiden University, 2300 Leiden, RA, Netherlands
Human Ecologyhttps://doi.org/10.1007/s10745-019-0054-y
conservation authorities, adversely affecting overall conserva-tion goals (Madden 2004; Woodroffe et al. 2005). Managingconflict thus needs both a biophysical and a sociopoliticalapproach (Treves et al. 2006) to promote non-lethal manage-ment and strategies to increase community tolerance for wild-life (Treves et al. 2009).
When wildlife and humans are sharing the same landscapein close proximity, it is almost impossible to entirely avoidwildlife damage. However, community tolerance of actualand perceived threats can be built through co-managementof conflict (Treves et al. 2006), including timely compensa-tion for losses, participation in planning and execution of con-servation programs, as well as equitable sharing of conserva-tion benefits (Nyhus et al. 2005; Wegge et al. 2018). Bufferzones are often created surrounding core protected areas tofacilitate such processes with dual purpose of maintainingecological integrity and ensuring participatory conservationor co-management (Budhathoki 2004; Heinen and Mehta2000; Persoon and Van Est 2003; Sayer 1991; Spiteri andNepal 2008). Often in the buffer zone areas, communitiesare subsidized as compensation for wildlife impacts, whilewildlife is protected with refuge habitats and migration corri-dors (Kolipaka 2018; Sayer 1991; Wegge et al. 2018).Reducing negative impacts of wildlife on communities andprotecting wildlife and their habitat should be priority actionsin the buffer zones (Budhathoki 2004; Heinen and Mehta2000; Silwal et al. 2013).
Reducing human-wildlife impacts requires combination ofstrategies based on the location and species involved that canbe broadly categorized into 1) preventive measures (or directinterventions), 2) mitigation measures, and 3) indirect inter-ventions (Goodrich 2010; Treves et al. 2009). Direct interven-tions aim to reduce the severity of the impacts by lowering thefrequency and extent of damage from wildlife, whereas miti-gation measures and indirect interventions aim to raise resi-dents’ tolerance to impacts (Treves et al. 2009). Spatial sepa-ration of human and wildlife through physical barriers(fences), guards, and repellents are common preventive mea-sures (Goodrich 2010; Karanth and Madhusudan 2002;Treves et al. 2009). In addition, altering human behaviorthrough awareness about wildlife, establishing early warningsystems, predator proof corrals, changing to crops less palat-able to wildlife, improving livestock oversight, and manipu-lating problem wildlife (both lethally and non-lethally) alsomitigate human-wildlife impacts.
We selected Chitwan National Park (CNP) in Nepal for thisstudy because it typifies a national park in the tropics wherewildlife density inside the park is increasing and communitiesaround the park are experiencing frequent economic loss andsafety threats from wildlife (Lamichhane et al. 2018).Participatory conservation and habitat restoration in the pe-riphery of the park were initiated in the 1990s and a bufferzone was legally declared in 1998 (Budhathoki 2004). Despite
their existence of over 20 years, there are only a few studiesfocusing on buffer zone programs in Nepal, and whether theyhave helped reduce human-wildlife conflict is not well under-stood. In this study we examined whether buffer zone inter-ventions are adequate in reducing the negative impacts ofwildlife by analyzing buffer zone fund utilization over a de-cade around CNP.We assessed the fences and mitigation mea-sures practiced by the communities, and examined attitudes oflocal communities towards wildlife conservation and the man-agement of conflicts to gain more insight in the complex pro-cesses of human-wildlife interactions. Our research questionsare 1) Are buffer zone funds adequate to reduce the damagecaused by wildlife to human life and livelihood? 2) Whatpreventive and mitigation measures are practiced and pro-posed? and, 3) What are people’s attitudes towards wildlifeconservation, conflict prevention and mitigation?
Methodology
Study Area
The studywas conducted in the buffer zone of ChitwanNationalPark, Nepal. CNP (953 km2) is situated in South Central, Nepalbetween 27°16.56′ - 27°42.14’N latitudes and 83°50.23′ -84°46.25′E Longitudes (Fig. 1). CNP is the first national parkin Nepal, established in 1973 and a UNESCO world heritagesite. It is well known for high biodiversity, with nearly 70 spe-cies of mammals, >600 birds, 54 herpetofauna, and 126 fishspecies (CNP 2013). CNP is one of the 42 tiger source sitesglobally and holds the second largest population of the greaterone horned rhinoceros (Rninoceros unicornis) (Subedi et al.2017; Walston et al. 2010). A variety of ungulates includingfour deer (sambar Rusa unicolor, chital Axis axis, hog deerA. Procinus, and muntjac Muntiacus vaginalis), gaur (Bosgaurus), wild boar (Sus scrofa), nilgai (Boselaphustragocamelus) are the major herbivores of the park. In additionto tigers and leopards, there is a range of carnivores such as slothbear (Melursus ursinus), wild dog (Cuon alpinus), stripped hy-ena (Hyaena hyaena), clouded leopard (Neofelis nebulosa),jackal (Canis aurenus), fishing cat (Prionailurus viverrinus),and leopard cat (Prionailurus bengalensis).
Contiguous habitat exists toward the south-west (ValmikiTiger Reserve, India) and the east (Parsa National Park). Thepark is bordered by the Narayani River in the west, the RaptiRiver in the north, and the Reu River and the internationalborder with India in the south. On the other side of these riversthere are highly populated human settlements and agriculturalareas. A corridor forest, Barandabhar, connects the park withthe northern hill forest (Fig. 1). The park is dominated byforest (>80%), including a majority of Sal (Shorea robusta)forest followed by riverine forest, and mixed hardwood forest.Highly productive alluvial floodplain grasslands close to the
Hum Ecol
bordering rivers cover 9.6% of the park, 5% exposed surface,and 3% water bodies (Thapa 2011; CNP 2015).
An additional 750 km2 of the buffer zone surrounding CNPwas created in 1996 (21 km2 of the buffer zone was laterincluded in the park in 2016). More than half (55%) of thebuffer zone is effective wildlife habitat including forests,grasslands, and water bodies; the rest is used for agriculturalland and settlements (Karki et al. 2015). There are more than70 buffer zone community forests covering approximately11,000 ha (CNP 2017). Buffer zone regulations and guidelinesprovide the legal framework of buffer zone programs inNepal. Accordingly, the buffer zones are managed in threetiers: 1) user groups are formed at the hamlet level, 2) usercommittees are formed from the representatives of the usergroups, and 3) chairpersons of the user committees form abuffer zone management committee for each protected area.In Chitwan there are 1770 User Groups and 22 Buffer ZoneUser Committees (BZUC). BZUCs are responsible for design-ing and implementing buffer zone programs. They also dealwith the wildlife victims for the recommendation of compen-sation payments to the national park, and liaison between thecommunity and the park authority. The park management andbuffer zone are divided into four administrative sectors:Eastern (Sauraha), Northern (Kasara), Southern (Madi), andWestern (Amaltari) (Fig. 1).
Historically, only a few settlements of the indigenous Tharu,Bote, and Darai communities (of Tibeto-Burmese origin)surrounded the present-day park. However, many people fromthe hilly area migrated into the Chitwan after the 1950s (Mishra
1982) and there is now a mix of indigenous people and immi-grants from the hills including high caste Hindus (Brahmin,Chhetries), Tibeto-Burmese hill ethnic groups (Tamang,Gurung, Magar) and underprivileged lower caste Hindus(Kami, Damai, Sarki etc.). Human density is relatively high(261.5 persons per km2 in 2011) and increasing rapidly by2.1% annually (Central Bureau of Statistics 2012). The bufferzone includes more than 45,000 households in 12municipalitiesin five districts (Chitwan, Makawanpur, Nawalpur, Parasi, andParsa). A majority of people rely on subsistence agriculture butdependence on agriculture is decreasing as the younger genera-tion prefers off-farm activities like tourism (nature-guides andwork in hotels), service and foreign employment (Lamichhaneet al. 2018). Livestock keeping is an integral part of subsistenceagriculture, and grazingwas common in the buffer zone until thelast decade. In recent years there has been a gradual shift to-wards stall feeding combined with restricted grazing, and adop-tion of improved livestock (Gurung et al. 2009). The demandand preference of youth for off-farm labor has greatly increasedduring the last decade, resulting in a shortage of labor for farm-ing (Lamichhane et al. 2018).
Data Collection
Fund Utilization Records
Our study focused on direct financial investments madethrough the BZUCs in the buffer zone of CNP. We focusedon direct investment because it is often difficult to measure the
Fig. 1 Chitwan National Park and buffer zone area
Hum Ecol
impacts of indirect interventions such as awareness raising,alternative livelihoods, and community development to re-duce conflict (Treves et al. 2009). BZUCs are part of the legalbodies for buffer zone management and are mandated to op-erate their own accounts (Budhathoki 2004). We collected theincome and expenditure records of the BZUCs from theiraudit reports from 2005/06 to 2014/15 (10 years). As per thebuffer zone regulations, it is mandatory for each BZUC toconduct an annual financial audit. The reports are managedaccording to the Nepalese fiscal year, which runs from mid-July to mid-July based on the Nepalese Calendar (BikramSambat) (Lamichhane et al. 2018). For consistency of datafor time series analysis, we used these fiscal years. The auditreports include the sources and amount of the income receivedby each BZUC in each fiscal year. The indirect benefits in thecommunities such as income generation in the buffer zonearea from tourism do not fall within the scope of our research.Our study does not include the income and expenditure of themore than 70 community forest user groups in the buffer zonethat also spend a large amount of their budget on preventionand mitigation of human-wildlife impacts.
Assessment of Fences and Conflict Mitigation Measures
We mapped the fences constructed along the boundary sepa-rating forest and human settlements/agricultural lands.Members of the survey team walked along the fences in allBZUCs with a GPS device (Garmin etrex 10) using the tracklog. Waypoints were recorded every 200 m and the type offence, condition and functionality of fence, and yearestablished were recorded in a standardized data form. TheGPS tracks were downloaded by DNRGPS software and thefence line feature was extracted from the GPS track.Characteristics of the fences recorded in the data form wereassociated to a line feature. Spatial analysis such as type andlength of fence in different user committees and managementsectors of the parks was done in QGIS 2.7 (QGISDevelopment Team 2016).
The status of the fences and their role in conflict mitigationwere assessed through a focused group discussion in each ofthe four sectors of CNP with 12–20 participants. One day-long focused group discussion was conducted in each sector(Fig. 1) during August and September 2016. Two authors(BRL and SP) facilitated the group discussions. The chairman,the secretary, and an office assistant of the BZUCs, who arekey persons responsible for designing/implementing bufferzone programs and conflict management, were invited to par-ticipate in the discussion. The sub-group of three persons fromeach BZUC spent 2–4 h to assess the status of human-wildlifeconflict, current practices, and future priorities of conflict mit-igation within the respective BZUC area. For each of the mit-igation measures, the group was asked to rank as high, medi-um or low construction costs, maintenance costs and
effectiveness in reducing conflict along with the risks/chal-lenges. Each group member presented their findings writtenin a chart for all the participants. The participants providedfeedback on the presentations and the chart papers were final-ized for each committee. All BZUC representatives participat-ed in the workshops actively. The information on the finalchart paper was entered into the excel spreadsheet to representthe summary for each buffer zone user committee. This infor-mation is summarized from all BZUCs and presented in atable.
Questionnaire Survey
We conducted a questionnaire survey in the buffer zone ofCNP during April–June 2016 to assess attitudes towards buff-er zone management practices and human-wildlife conflictmanagement. To ensure spatial coverage, we stratified oursurvey in four management sectors of the CNP and three buff-er zone user committees (BZUC) were randomly selectedwithin a sector. Within the map of the 12 selected BZUCs(three in each sector), we generated 35 random GPS pointsusing QGIS. The nearest household to the GPS point wasnavigated using a map and GPS device. If there was no house-hold within 500 m of the random point, it was excluded fromthe survey. We requested the household head to participate inthe survey whenever possible. If the household head was notavailable or willing to participate, we interviewed anothermember of the household aged 16 or above. We moved tothe next household for the survey if there were no membersof the first household available or they were not willing toparticipate in the survey. Consent to participate in the surveywas read out to the respondent as some of themwere unable toread themselves. All the households approached agreed toparticipate in the survey. Four trained field assistants with longexperience in the buffer zone conducted face-to-face inter-views using a structured questionnaire that took one hour onaverage to fill out. The questionnaire was originally preparedin English and translated into a local Nepali language. A pilotsurvey (n = 12) was conducted to test the questionnaire andtrain the field assistants. The questionnaire was reviewed andapproved by the ethics committee of Institute of CulturalAnthropology and Development Sociology, LeidenUniversity (Supplementary file S1). Similarly, theDepartment of National Parks and Wildlife Conservation inNepal issued a research permit for this study after approvalfrom a ‘technical committee’ at the department that reviewsresearch applications in Nepal’s in protected areas.
The questionnaire was divided into four sections: 1) per-sonal and household information such as age, gender, ethnic-ity, occupation, migration, household income sources, landand livestock owned, forest resources need; 2) past experiencewith wildlife and their impacts on the households; 3) conflictmanagement and compensation practices; and 4) attitude
Hum Ecol
towards the wildlife and buffer zone program. Attitude of therespondents towards different statements related to wildlifeconservation, national park, buffer zone, and conflict manage-ment was measured on a five point Likert scale where 1 de-noted ‘Strongly agree’ and 5 denoted ‘Strongly disagree’(Likert 1932; Stapp et al. 2016). The statements were read tothe respondents and they were asked to score the statementson the scale.
Data Analysis and Statistics
We categorized income sources of the BZUCs derived fromaudit reports into four categories: 1) committee internalsources, such as fees or royalties for resource extraction (most-ly sand gravel, sometimes wood) within committee’s area,memberships, fines, and income from investments; 2) parkrevenue shared according to existing buffer zone guidelines(30–50% of the total park income); 3) grants and subsidiesfrom other government line agencies (municipalities, districtcoordination committees); and 4) support provided by conser-vation NGOs, projects, and environmental non-governmentalagencies for conservation actions within the BZUC.Redundant budget headings such as programs advance andbank balance from previous year that could be repeated withthe previous year’s budget were excluded from the analysis.
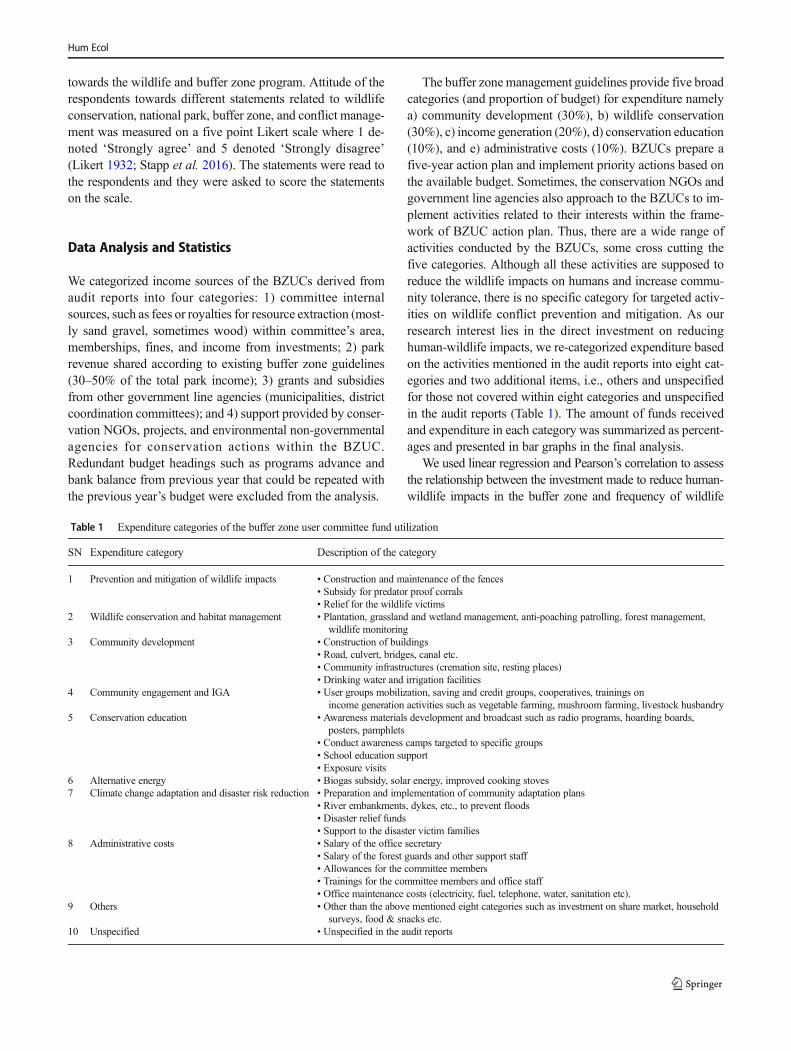
The buffer zone management guidelines provide five broadcategories (and proportion of budget) for expenditure namelya) community development (30%), b) wildlife conservation(30%), c) income generation (20%), d) conservation education(10%), and e) administrative costs (10%). BZUCs prepare afive-year action plan and implement priority actions based onthe available budget. Sometimes, the conservation NGOs andgovernment line agencies also approach to the BZUCs to im-plement activities related to their interests within the frame-work of BZUC action plan. Thus, there are a wide range ofactivities conducted by the BZUCs, some cross cutting thefive categories. Although all these activities are supposed toreduce the wildlife impacts on humans and increase commu-nity tolerance, there is no specific category for targeted activ-ities on wildlife conflict prevention and mitigation. As ourresearch interest lies in the direct investment on reducinghuman-wildlife impacts, we re-categorized expenditure basedon the activities mentioned in the audit reports into eight cat-egories and two additional items, i.e., others and unspecifiedfor those not covered within eight categories and unspecifiedin the audit reports (Table 1). The amount of funds receivedand expenditure in each category was summarized as percent-ages and presented in bar graphs in the final analysis.
We used linear regression and Pearson’s correlation to assessthe relationship between the investment made to reduce human-wildlife impacts in the buffer zone and frequency of wildlife
Table 1 Expenditure categories of the buffer zone user committee fund utilization
SN Expenditure category Description of the category
1 Prevention and mitigation of wildlife impacts • Construction and maintenance of the fences• Subsidy for predator proof corrals• Relief for the wildlife victims
2 Wildlife conservation and habitat management • Plantation, grassland and wetland management, anti-poaching patrolling, forest management,wildlife monitoring
3 Community development • Construction of buildings• Road, culvert, bridges, canal etc.• Community infrastructures (cremation site, resting places)• Drinking water and irrigation facilities
4 Community engagement and IGA • User groups mobilization, saving and credit groups, cooperatives, trainings onincome generation activities such as vegetable farming, mushroom farming, livestock husbandry
5 Conservation education • Awareness materials development and broadcast such as radio programs, hoarding boards,posters, pamphlets
• Conduct awareness camps targeted to specific groups• School education support• Exposure visits
6 Alternative energy • Biogas subsidy, solar energy, improved cooking stoves7 Climate change adaptation and disaster risk reduction • Preparation and implementation of community adaptation plans
• River embankments, dykes, etc., to prevent floods• Disaster relief funds• Support to the disaster victim families
8 Administrative costs • Salary of the office secretary• Salary of the forest guards and other support staff• Allowances for the committee members• Trainings for the committee members and office staff• Office maintenance costs (electricity, fuel, telephone, water, sanitation etc).
9 Others • Other than the above mentioned eight categories such as investment on share market, householdsurveys, food & snacks etc.
10 Unspecified • Unspecified in the audit reports
Hum Ecol
attacks on humans and livestock. The data on frequency of wild-life attacks over the years were obtained from Lamichhane et al.(2018). Analysis was done in R (R Core Team 2017).
The Likert scale attitude data were converted into the attitudeindex by summing response values for each question divided bynumber of respondents (DeVaus 2013; Spiteri andNepal 2008).We also assessed the socioeconomic variable explaining thepositive attitude using a binary logistic regression in SPSS 20(IBM 2012). The attitude index towards buffer zone manage-ment was converted into a dichotomous value to use as responsevariable in logistic regression. Values below the mean value onthe 1-to-5 were scored as ‘1’ representing the positive attitudeand vice versa. Eight independent variables included in the re-gression analysis which could affect the attitude of people
(Carter et al. 2014) were 1) distance to the park, 2) distance tothe forest edge, 3) ethnicity, 4) management sector, 5) sex, 6)education, 7) land ownership, and 8) occupation.
Results
Buffer Zone Investments and Fund Utilization
Through the BZUCs more than US$5.6 million of direct in-vestment was made during 2005/06–2014/15 in the bufferzone of CNP, an average of US$558,000 (range 130,000 –1,173,000) per annum. Revenue shared by the national parkcontributed more than half of the BZUC budget (Fig. 2a).
51.6
22.017.8
7.4
1.20
10
20
30
40
50
60
Na�onal park revenueshared in buffer zone
program
Conserva�on NGOs &projects
Internal sources of thebuffer zonecommi�ee
Other Governmentline agencies
Othet/Unspecified
Perc
enta
ge o
f the
bud
get
Source of budget
(a)
24.5
15.1 14.4 13.7
8.76.9
4.3 4.2
1.3
6.9
0.0
5.0
10.0
15.0
20.0
25.0
30.0
Perc
enta
ge o
f the
bud
ge
Expenditure category
(b)
Fig. 2 a Income sources and bexpenditure by the buffer zoneuser committees of ChitwanNational Park, Nepal during2005–2015 based on annual auditreports
Hum Ecol
Contrary to our expectation, the buffer zone user committeesspent only a small portion (13.7%) of their fund directly onprevention and mitigation of human-wildlife conflict throughactivities such as construction/maintenance of fences and pro-viding relief for victims (Fig. 2b). However, the amount spentfor wildlife conflict prevention and mitigation has been increas-ing gradually as the total park revenue has been increasing(Fig. 3a). The investment for conflict mitigation interventionswas negatively correlated to wildlife attacks on humans (−0.49)and livestock depredation (−0.56) but the relationship was notsignificant (p = 0.14 and 0.09 respectively) (Fig. 3b).
Assessment of the Mitigation Measures
Out of the total budget spent on conflict prevention and mitiga-tion, BZUCs invested most of the funds in the construction andmaintenance of the physical barriers (85%). The buffer zone
communities have constructed approximately 275 km of fencealong the forest–settlement border (Fig. 4), about half includingelectric fences (140 km). The other half includes fences (singleor combination with electric fence) made from barbed wire,mesh wire, PCC with mesh wire, or a dyke (along the rivers)(Table 2). Community leaders evaluated multiple mitigationmeasures undertaken within the BZUCs during the focusedgroup discussions (Table 3). Most of the BZUCs (13 of 22)proposed mesh wire fences (5–7 ft) with PCC on the bottom(2–3 ft) as the priority for conflict mitigation in future (Table 3).
Attitude towards the Buffer Zone Programsand Conflict Mitigation
A total of 399 respondents were interviewed, a majority male(58%) and involved in farming (85%). Ages ranged between16 and 78 years with an average of 45 years. About three
0
50
100
150
200
250
-
10
20
30
40
50
60
70
80
90
100
No.
of w
ildlif
e a�
acks
on
Hum
ans
& l
ives
tock
Years
Amount of investment in HWC mi�ga�on
A�acks on livestok
A�acks on Humans
(a)
50000 100000 150000 200000
2530
3540
Attacks on humans
(b)
50000 100000 150000 200000
5010
015
020
0 Livestock depredation
(c)
Buffer zone investment in conflict prevention and mitigation (US dollar)
Buffe
r zon
e In
vert
men
t in
confl
ict p
reve
n�on
and
mi�
ga�o
n (T
hous
ands
US
Dolla
r)
No.
of i
ncid
ents
repo
rted
Fig. 3 Buffer zone investments tominimize human-wildlife impactsand number of incidents (wildlifeattacks on humans and livestock)over the years based on audit re-ports (a); linear regression of in-vestment versus wildlife attackson humans (b); livestock depre-cation (c)
Hum Ecol
quarters (73%) of respondents had primary education whilefewer than 10% had secondary or higher education, and 17%were illiterate. Ethnicity was divided into four categories 1)High cast Hindu (44%), 2) Hill Tibeto-Burmese (24%), 3)Terai Tibeto-Burmese (21%), and 4) Lower caste Hindu(11%). Average land holding per household was 0.5 ha.Most of households (87.5%) have livestock or poultry.
The overall attitude of respondents towards wildlife conser-vation was positive (2.37 ± SE 0.25) on a 1-to-5 scale (Table 4).People’s attitudes towards the participation of households inwildlife conservation, particularly willingness to managehuman-wildlife conflicts, were more positive (1.91) comparedwith attitudes towards current practices of conflict mitigation(2.51), the role of the national park (2.42), and the role of thebuffer zone program (2.84). Regression analysis shows the pos-itive attitude is associated with the management sectors (Eastand Kasara) and ethnicity (Table 5).
Conflict Management and Compensation Paymentsin Buffer Zone
About half of the respondents (44.6%) reported the in-crease in damage from wildlife during the previous fiveyears primarily due to widespread crop raiding byhervivores, while 43.9% think damage either decreasedor has not changed (11.5%). The highest number of therespondents (67%) reported wild boar as the main problemcausing species around CNP followed by rhino and chital.Conflicts with carnivores were reported to be less severe.Five carnivores – tiger, jackal, sloth bear, leopard, andjungle cat – were reported to be affecting local residentsby threatening safety or predating on livestock/poultry.Additionally, smaller animals such as monkeys, birds,snakes, and porcupines were also reported having negativeimpacts on lives and livelihoods on smaller scales (Fig. 5).
Fig. 4 Fences installed along the forest-settlement borders in the buffer zone of Chitwan National Park, Nepal
Table 2 Types and lengths of thefences in different managementsectors of buffer zone in ChitwanNP based on field survey inOctober–December 2017
Managementsector
Types and lengths of fences (km) Total
Electric Barbed Meshwire
Mesh wire withPCC
Concretewall
Others
East 25.5 21.9 8.9 5.8 4.1 1.8 68.02
Kasara 26.4 13.6 24.0 15.0 1.9 – 80.95
South 47.4 4.8 – – – 1.5 53.78
West 40.9 10.5 21.0 – – – 72.36
Total 140.2 50.9 53.9 20.8 6.0 3.4 275.10
Hum Ecol
Table3
Major
typesof
fences
andotherpreventiv
emeasurescurrently
practices
practiced
forreducing
HWCin
buffer
zone
ofChitwna
NP
Type
ofinterventio
nYearsof
implem
entatio
nNo.of
BZUCs
practicing
Totallength
ofthefences
(km)
Future
priority
actio
nforno.
ofBZUCs
Targetspecies
Construction
costs#
Maintenance
costs
Effectiv
eness
inreducing
conflict
Additionalevaluatio
n/remarks
Physical
barriers
Barbedfence
1989–2017
1650.9
–All
Medium
Medium
Low
Effectiv
efordeer,not
effectiveforwild
boar,rhino
andelephants
Electricfence
2001–2017
19140.2
9Rhino,
elephant
Medium
High
Medium
Effectiv
ewhenmaintainedproperly,
regularmaintenance
isachallenge
Meshwirefences
2008–2012
1253.9
–All
Medium
Medium
Low
Stopsdeer
butn
oteffectiveforwild
boars,rhinos
Meshwirefences
with
PCC
2013–2017
720.8
13All
High
Low
High
Effectiv
eformosto
fspeciesexcept
elephants,costof
constructio
nishigh
Concretewall
2015–2017
35.9
1All
VeryHigh
Low
High
Highconstructio
ncosts,stopsnatural
water
flow
infloodproneareas
Other
Predator-proof
corrals
2015–2017
7NA
6Tiger,leopard
Low
Medium
High
Chances
ofpredationwhenanim
alsare
outo
fthecorrals
Com
munity
Guarding
machan
Alltim
e4
NA
–Allspecies
Low
Medium
Medium
Labor
intensive,needsactiv
eguarding
Awarenessprograms
1995–2017
All
NA
15Allspecies
Low
Medium
Low
Effectiv
ein
reducing
wild
lifeattacks
onhumans,moreaw
areness
programsneeded
Other*
Different
periods
73.4
8Selected
species
NA
NA
NA
•Other
includes
flashlights,dykes,fish
ponds,etc
#costs(U
SD)perkm
offenceconstructio
n(Veryhigh
–morethan
10,000;H
igh–between5000
and10,000;M
edium
between1000
and5000;low
–less
than
1000)
Hum Ecol
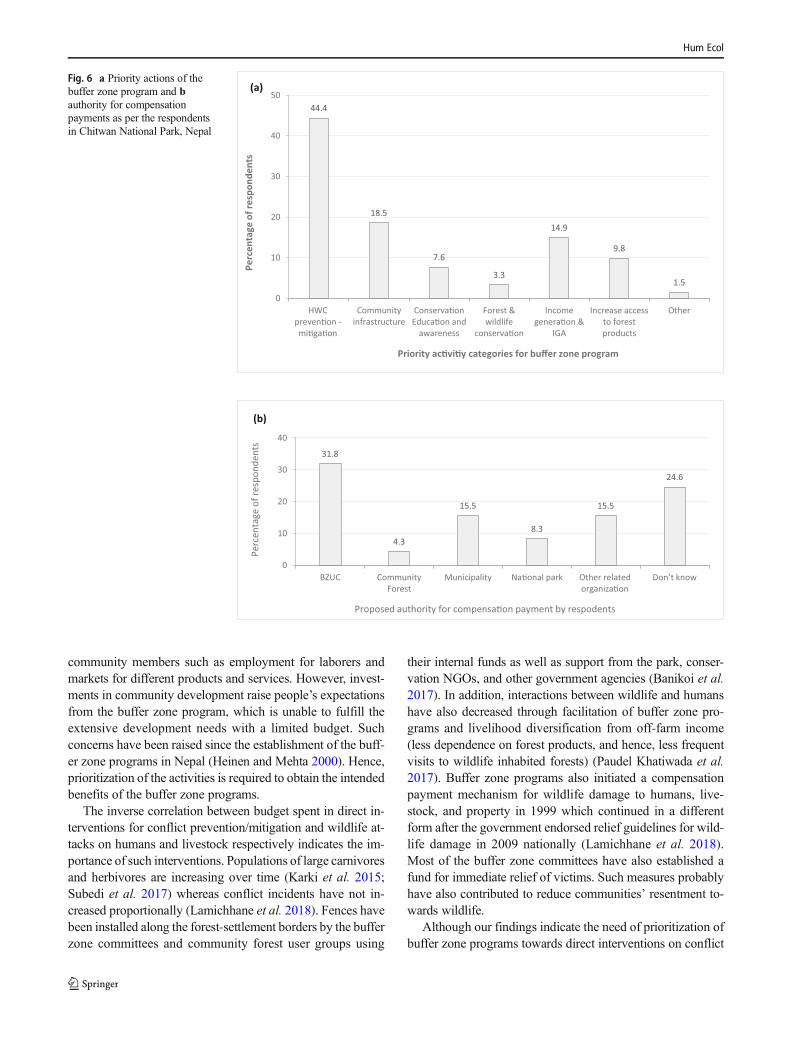
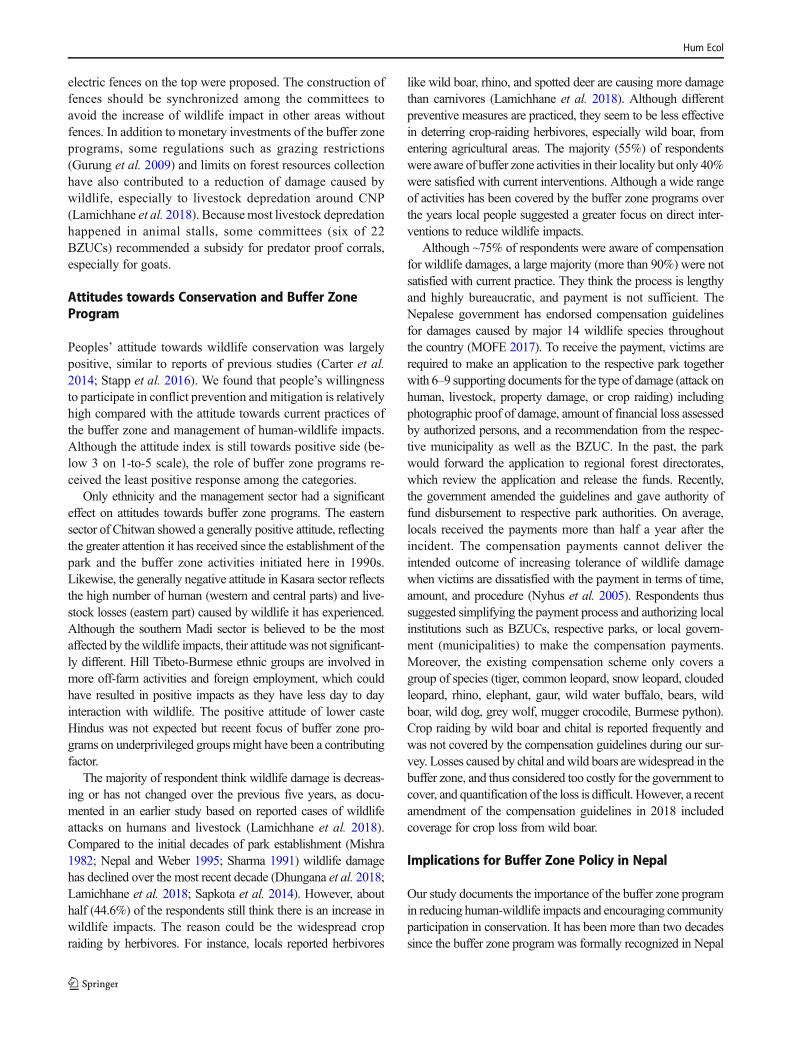
The majority of the respondents (60%) was not satisfiedwith the buffer zone programs and suggested more focus ondirect interventions to reduce wildlife impacts (Fig. 6a).Similarly, more than two-thirds of respondents (71.7%) wereaware of government compensation for wildlife damage.However, most (more than 90%) were not satisfied with theexisting payment mechanism. It took an average of 6.6monthsto receive payments and most respondents viewed it as alengthy and highly bureaucratic procedure. The highest num-ber of people (36.1%, n = 399) prefer that compensation pay-ments be made by buffer zone committees or community for-est user groups, while others think municipalities, other con-servation organizations, or the national park authority itselfshould make the payments (Fig. 6b).
Discussion
We found buffer zone program around CNP has been firmlyinstitutionalized. They receive regular support from the gov-ernment (30–50% of the park revenue is shared with bufferzone) as well as grants and subsidies provided by other con-servation organizations and government line agencies. Wedocumented that a relatively low proportion of the budgetwas spent on direct interventions to reduce wildlife impactson communities (13.7%). However, amount of investment in
buffer zone programs as well as funds spent on reducinghuman-wildlife impacts are gradually increasing over theyears with increasing revenue of the park. We suggest thatvarious preventive and mitigation measures practiced by theBZUCs have contributed to reduce wildlife attacks on humansand livestock, although crop raiding was found to be wide-spread. Most people were positive towards wildlife conserva-tion but they were not satisfied with current practices of thebuffer zone program as well as conflict prevention and miti-gation measures.
Buffer Zone Fund Utilization
The annual budget of all buffer zone user committees amountsmore than US$1.2 million in recent years, which is a largeamount in a poor country such as Nepal. The annual budgetof the park and buffer zone substantially increased after thegovernment raised the daily entry fee for foreign visitors in2013 from Nepalese Rupees 500 (~ US$5) to Rupees 1500(~US$15). The number of visitors is also increasing gradually(CNP 2017). In addition to park revenue, more than 70 com-munity forests in the buffer zone also earn approximatelyUS$0.5 million annually from ecotourism activities (CNP2017), spending some of it to manage human-wildlife im-pacts. Not all parks/reserves in Nepal have such a large reve-nue (DNPWC 2017). Despite such large and sustained
Table 4 Attitude of peopletowards carnivore conservation,participation, and conflictmitigation in Chitwan NationalPark, Nepal, based onquestionnaire survey in April –June 2016
General attitude towards wildlife 2.041 Wild animals have a right to live in the forest 1.45 0.062 Wildlife attracts tourists and brings revenue to the Park, which benefits us 1.90 0.053 If tiger and leopard disappear from Chitwan, it is a not a good news for me. 1.55 0.044 Tiger and leopard population should be increased in coming years 2.29 0.085 Wildlife conservation benefits me directly. 3.01 0.07Conflict management 2.516 Wildlife should be conserved only if conflict with humans can be reduced. 1.43 0.057 Existing conflict-mitigation measures for wildlife conflict is not adequate 1.89 0.058 In case of severe conflict, problem animals should be terminated 4.20 0.05Role of national park 2.429 National Park authorities are responsible for HWC, they should manage it 1.89 0.0610 National Park authorities are playing a positive role for human wildlife conflict
mitigation2.75 0.05
11 Government relief for loss done by wildlife is helping to victim families. 2.63 0.05Role of buffer zone 2.8412 Buffer zone institutions playing a positive role for human wildlife conflict mitigation 2.57 0.0513 Buffer zone institutions have given adequate priority to HWC mitigation 3.34 0.0514 Community forests are playing a positive role for HWC management 2.62 0.05Household responsibility & participation for conflict mitigation 1.9115 I live close to the forest with risk of wild animals and it’s also my responsibility to avoid it 2.30 0.0516 I would like to participate in community wildlife conflict mitigation programs. 1.84 0.0417 I would like to learn more about wild animals, their behavior and ecology. 1.66 0.0418 I should participate to maintain electric fences and physical barriers constructed to
avoid conflict1.85 0.04
x̅ and S.E., mean and standard error of the attitude scores for each questions; G x̅, mean attitude score for eachgroup of questions
Hum Ecol
investments over two decades in Chitwan’s buffer zone, wild-life damage to lives and livelihoods of the local communitiesis still substantial (Dhungana et al. 2018; Lamichhane et al.2018; Pant et al. 2016; Silwal et al. 2017). Studies show amarginal decrease of wildlife attacks on humans and livestockby carnivores in recent years (Dhungana et al. 2018;Lamichhane et al. 2018) while people reported a rise in cropraiding by wild herbivores.
The buffer zones are designed primarily to create human-wildlife coexistence by providing an ecological buffer to wild-life and a socioeconomic buffer to the communities(Budhathoki 2004; Heinen and Mehta 2000; Nepal andWeber 1994). Although, Nepal endorses these aims, the bufferzone program in Chitwan has given higher priority to commu-nity development (24.5%) compared with prevention and mit-igation of human-wildlife impacts (13.7%). Similar findingsof a much higher proportion of budget spent on infrastructuredevelopment (42%) have been reported by Silwal et al.(2013). Additionally, community engagement and IGA pro-grams (15.1%) and alternative energy such as biogas subsi-dies, solar energy, and improved stoves (8.7%) were also im-plemented to develop alternative livelihoods and reduce forestdependency. In contrast only 7% was spent on wildlife andhabitat management. Such preference towards community de-velopment programs is influenced by the political interest ofthe buffer zone leaders. Although the buffer committees areelected through a democratic process, local political partieshave a great influence. The elected members are also interest-ed in gaining popularity in the community through such de-velopment activities to support their political careers. The in-frastructure development and construction work also generatelocal economic opportunities for a broader range of
Table 5 Binary logistic regression examining relation between socio-demographic variables and positive attitudes towards buffer zone man-agement in Chitwan National Park
Variables B S.E. Wald P
Distance to park 0.00 0.00 0.85 0.36Distance to forest edge 0.00 0.00 1.56 0.21EthnicityHigh caste Hindu – – 5.51 0.14Hill Tibeto-Burmese 1.39 0.61 5.25 0.02*Terai Tibeto-Burmese 1.18 0.65 3.29 0.07Lower caste Hindu 1.39 0.63 4.85 0.03*Management sectorEast – – 9.75 0.02*Kasara −0.97 0.45 4.59 0.03*South 0.04 0.39 0.01 0.91West 0.48 0.42 1.34 0.25GenderMale – – – –Female 0.21 0.29 0.53 0.47Have livestockYes – – – –No −0.27 0.50 0.30 0.58EducationIlliterate – – 5.30 0.15Primary education −0.83 0.75 1.23 0.27Secondary education 0.13 0.60 −4 0.83Higher education 0.72 0.79 0.82 0.37Land ownershipless than 0.1 ha – – 2.91 0.410.1–0.5 ha −0.09 0.57 0.02 0.880.5–1 ha 0.50 0.46 1.22 0.27greater than 1 ha 0.48 0.48 1.01 0.32OccupationAgriculture – – 2.67 0.45Off-farm business −0.47 0.69 0.46 0.50Student 0.14 0.90 0.02 0.88Other 0.43 0.91 0.22 0.64
232
173
131
101
71
48 44 4436
2113 12 8 7 5
70
0
50
100
150
200
250
Freq
uenc
y of
esp
onde
nts
Wildlife
Fig. 5 Frequency of respondentsreports of problems caused bydifferent wildlife species during aquestionnaire survey conductedin April – June 2016 in the bufferzone of Chitwan National Park,Nepal
Hum Ecol
community members such as employment for laborers andmarkets for different products and services. However, invest-ments in community development raise people’s expectationsfrom the buffer zone program, which is unable to fulfill theextensive development needs with a limited budget. Suchconcerns have been raised since the establishment of the buff-er zone programs in Nepal (Heinen and Mehta 2000). Hence,prioritization of the activities is required to obtain the intendedbenefits of the buffer zone programs.
The inverse correlation between budget spent in direct in-terventions for conflict prevention/mitigation and wildlife at-tacks on humans and livestock respectively indicates the im-portance of such interventions. Populations of large carnivoresand herbivores are increasing over time (Karki et al. 2015;Subedi et al. 2017) whereas conflict incidents have not in-creased proportionally (Lamichhane et al. 2018). Fences havebeen installed along the forest-settlement borders by the bufferzone committees and community forest user groups using
their internal funds as well as support from the park, conser-vation NGOs, and other government agencies (Banikoi et al.2017). In addition, interactions between wildlife and humanshave also decreased through facilitation of buffer zone pro-grams and livelihood diversification from off-farm income(less dependence on forest products, and hence, less frequentvisits to wildlife inhabited forests) (Paudel Khatiwada et al.2017). Buffer zone programs also initiated a compensationpayment mechanism for wildlife damage to humans, live-stock, and property in 1999 which continued in a differentform after the government endorsed relief guidelines for wild-life damage in 2009 nationally (Lamichhane et al. 2018).Most of the buffer zone committees have also established afund for immediate relief of victims. Such measures probablyhave also contributed to reduce communities’ resentment to-wards wildlife.
Although our findings indicate the need of prioritization ofbuffer zone programs towards direct interventions on conflict
44.4
18.5
7.6
3.3
14.9
9.8
1.5
0
10
20
30
40
50
HWCpreven�on -mi�ga�on
Communityinfrastructure
Conserva�onEduca�on and
awareness
Forest &wildlife
conserva�on
Incomegenera�on &
IGA
Increase accessto forestproducts
Other
Perc
enta
ge o
f res
pond
ents
Priority ac�vi�y categories for buffer zone program
(a)
31.8
4.3
15.5
8.3
15.5
24.6
0
10
20
30
40
BZUC CommunityForest
Municipality Na�onal park Other relatedorganiza�on
Don’t know
Perc
enta
ge o
f res
pond
ents
Proposed authority for compensa�on payment by respodents
(b)
Fig. 6 a Priority actions of thebuffer zone program and bauthority for compensationpayments as per the respondentsin Chitwan National Park, Nepal
Hum Ecol
prevention and mitigation, the existing buffer zone policy ofNepal favors community development with 30% of the annualbudget (Budhathoki 2004). However, the policy suggests suchactivities should be small-scale and production-oriented withclear linkage to reducing pressure on forests and enhancinghuman-wildlife coexistence (MOFSC 1998). In contrast, thecommunity development activities in Chitwan’s buffer zoneinclude community buildings and infrastructure (30%), riverembankments (26.1%), road construction (24.1%), and drink-ing water and irrigation facilities (13.7%). A study focusingon conservation incentive distribution in Chitwan’s bufferzone shows residents experiencing the greatest costs in termsof crop damage or livestock have benefited least from thesedevelopments (Spiteri and Nepal 2008). Thus, despite largeinvestments in buffer zone programs, the affected communi-ties remain disadvantaged.
Direct Interventions to Reduce Human-WildlifeImpacts
We documented a range of preventive and mitigation mea-sures practiced over time in the buffer zone of CNP for reduc-tion of detrimental wildlife impacts on local communities.During the initial years of the buffer zone programs (early1990s), barbed fences (sometimes accompanied by trenches)were installed along forest borders with the dual purpose ofpreventing domestic livestock grazing and limiting wildlifeaccess to settlements (Sharma 1990). These fences effectivelystopped some wild herbivores such as chital and muntjac,although rhinos and wild boars usually break through suchfences (Sharma 1990).
In early 2000, electric fences were adopted (constructedusing local materials) in the buffer zone to stop large animalslike elephants and rhinos (Sapkota et al. 2014). Generally, theelectric fences are 5–6 ft tall with 2–3 parallel galvanized-wires attached to wooden poles using plastic insulators andconnected to the energizer, which gives intermittent electricpulses. Electric fences became very popular; 19 of the 22BZUCs installed them in their areas during 2006–2012 witha total length of 140 km. In some communities, electric fencesreduced up to 60% livestock depredation and 70% of crop lossespecially from the rhinos (Sapkota et al. 2014). Regularmaintenance of the electric fences is necessary to functionwell, which was the major challenge in CNP’s buffer zone.Banikoi et al. (2017) reported only 26% of the electric fencesare operational around CNP, the rest are non-functional due tolack of maintenance. Although BZUC receive funds from thepark annually, they do not automatically allocate funds formaintenance of the fences. During our survey we also ob-served that local people sometimes break the fences to enterforests for collection of forest resources.
With the recent failure of the electric fences, the BZUCs arereplacing or complementing them with the construction ofmesh wire fences or concrete walls. During the focused groupdiscussions with community leaders, a majority expressed apreference for construction of fences that are effective forwide range of species, of reasonable cost, durable, and requir-ing a low level of maintenance. Among the different types ofthe fences, most of them preferred the 5–7 ft tall mesh wirefence with a 2–3 ft concrete base along the forest-settlementborders (Fig. 7). In areas with frequent elephant visits, theysuggested two electric fence wires attached towards the forestside of the mesh wire fence. Along the rivers, dykes with
Fig. 7 An example of the meshwire fence communities prefer toconstruct along the forest-settlement border. The fence has aconcrete base of about 2 ft and 5 fttall mesh wire anchored to theiron poles set in a concrete base
Hum Ecol
electric fences on the top were proposed. The construction offences should be synchronized among the committees toavoid the increase of wildlife impact in other areas withoutfences. In addition to monetary investments of the buffer zoneprograms, some regulations such as grazing restrictions(Gurung et al. 2009) and limits on forest resources collectionhave also contributed to a reduction of damage caused bywildlife, especially to livestock depredation around CNP(Lamichhane et al. 2018). Becausemost livestock depredationhappened in animal stalls, some committees (six of 22BZUCs) recommended a subsidy for predator proof corrals,especially for goats.
Attitudes towards Conservation and Buffer ZoneProgram
Peoples’ attitude towards wildlife conservation was largelypositive, similar to reports of previous studies (Carter et al.2014; Stapp et al. 2016). We found that people’s willingnessto participate in conflict prevention and mitigation is relativelyhigh compared with the attitude towards current practices ofthe buffer zone and management of human-wildlife impacts.Although the attitude index is still towards positive side (be-low 3 on 1-to-5 scale), the role of buffer zone programs re-ceived the least positive response among the categories.
Only ethnicity and the management sector had a significanteffect on attitudes towards buffer zone programs. The easternsector of Chitwan showed a generally positive attitude, reflectingthe greater attention it has received since the establishment of thepark and the buffer zone activities initiated here in 1990s.Likewise, the generally negative attitude in Kasara sector reflectsthe high number of human (western and central parts) and live-stock losses (eastern part) caused by wildlife it has experienced.Although the southern Madi sector is believed to be the mostaffected by thewildlife impacts, their attitudewas not significant-ly different. Hill Tibeto-Burmese ethnic groups are involved inmore off-farm activities and foreign employment, which couldhave resulted in positive impacts as they have less day to dayinteraction with wildlife. The positive attitude of lower casteHindus was not expected but recent focus of buffer zone pro-grams on underprivileged groups might have been a contributingfactor.
The majority of respondent think wildlife damage is decreas-ing or has not changed over the previous five years, as docu-mented in an earlier study based on reported cases of wildlifeattacks on humans and livestock (Lamichhane et al. 2018).Compared to the initial decades of park establishment (Mishra1982; Nepal and Weber 1995; Sharma 1991) wildlife damagehas declined over the most recent decade (Dhungana et al. 2018;Lamichhane et al. 2018; Sapkota et al. 2014). However, abouthalf (44.6%) of the respondents still think there is an increase inwildlife impacts. The reason could be the widespread cropraiding by herbivores. For instance, locals reported herbivores
like wild boar, rhino, and spotted deer are causing more damagethan carnivores (Lamichhane et al. 2018). Although differentpreventive measures are practiced, they seem to be less effectivein deterring crop-raiding herbivores, especially wild boar, fromentering agricultural areas. The majority (55%) of respondentswere aware of buffer zone activities in their locality but only 40%were satisfied with current interventions. Although a wide rangeof activities has been covered by the buffer zone programs overthe years local people suggested a greater focus on direct inter-ventions to reduce wildlife impacts.
Although ~75% of respondents were aware of compensationfor wildlife damages, a large majority (more than 90%) were notsatisfied with current practice. They think the process is lengthyand highly bureaucratic, and payment is not sufficient. TheNepalese government has endorsed compensation guidelinesfor damages caused by major 14 wildlife species throughoutthe country (MOFE 2017). To receive the payment, victims arerequired to make an application to the respective park togetherwith 6–9 supporting documents for the type of damage (attack onhuman, livestock, property damage, or crop raiding) includingphotographic proof of damage, amount of financial loss assessedby authorized persons, and a recommendation from the respec-tive municipality as well as the BZUC. In the past, the parkwould forward the application to regional forest directorates,which review the application and release the funds. Recently,the government amended the guidelines and gave authority offund disbursement to respective park authorities. On average,locals received the payments more than half a year after theincident. The compensation payments cannot deliver theintended outcome of increasing tolerance of wildlife damagewhen victims are dissatisfied with the payment in terms of time,amount, and procedure (Nyhus et al. 2005). Respondents thussuggested simplifying the payment process and authorizing localinstitutions such as BZUCs, respective parks, or local govern-ment (municipalities) to make the compensation payments.Moreover, the existing compensation scheme only covers agroup of species (tiger, common leopard, snow leopard, cloudedleopard, rhino, elephant, gaur, wild water buffalo, bears, wildboar, wild dog, grey wolf, mugger crocodile, Burmese python).Crop raiding by wild boar and chital is reported frequently andwas not covered by the compensation guidelines during our sur-vey. Losses caused by chital andwild boars are widespread in thebuffer zone, and thus considered too costly for the government tocover, and quantification of the loss is difficult. However, a recentamendment of the compensation guidelines in 2018 includedcoverage for crop loss from wild boar.
Implications for Buffer Zone Policy in Nepal
Our study documents the importance of the buffer zone programin reducing human-wildlife impacts and encouraging communityparticipation in conservation. It has been more than two decadessince the buffer zone program was formally recognized in Nepal
Hum Ecol
(Budhathoki 2004; Heinen and Mehta 2000). At present, Nepalis in political transition after promulgation of a new constitutionin 2015 establishing a federal democratic republic. Subsequently,a range of policies and institutional reforms has been ongoingwithin the framework of the new constitution. The position ofnational parks and wildlife reserves are well defined under theresponsibility of the federal government, whereas the status ofbuffer zonemanagement is not clear. As the buffer zone is part ofan integrated system of a protected area, its close associationwiththe respective park is important. However, the buffer zone mayfall under the jurisdiction of the state government and the localgovernment (municipalities) based on constitutional provisions.This could impact effective implementation of the buffer zoneprograms.
Along with institutional arrangement, buffer zone manage-ment guidelines also need a prioritization of activities. Our studyshows the need for increasing investment in direct intervention toreduce human-wildlife impacts. Local residents of the bufferzone in our study suggested prioritizing buffer zone activities tominimizewildlife impacts on people and increase access to forestproducts rather than emphasizing community development.There are various government line agencies to carry out devel-opment works. Thus, we recommend amendment of the bufferzone management guidelines with the provision of 25–50% ofthe buffer zone budget for direct interventions for conflict pre-vention and mitigation. Recently, Shivapuri-Nagarjun NationalPark outside Kathmandu (the capital city of Nepal) has devel-oped separate guidelines for its buffer zone management allocat-ing 25% for the prevention and mitigation measures of human-wildlife impacts. This could be adopted by other buffer zones ofthe national parks and reserves in Nepal.
Conclusion
Our study has several implications for conservation policy par-ticularly on designating buffer zones and prioritizing actions.First, prioritizing the buffer zones programs in direct interven-tions to reduce wildlife impacts by provisioning certain portion(25–50%) of buffer zone funds will benefit local communities aswell as reduce conflict. The communities preferred constructionof 5–7 ft tall mesh wire fences with 2–3 ft concrete base alongforest-settlement border through buffer zone funds. Second, im-proving benefit sharing by targeting the most affected communi-ties will result in more positive attitudes towards wildlife man-agement and conservation efforts (Spiteri and Nepal 2008).Similarly, compensation payment guidelines should be revisedto cover all conflict-causing wildlife and payment proceduresshould be simplified by givingmore responsibility to buffer zoneuser committees, local government bodies like municipalities, orthe respective protected areas. We also recommend a systematicreview of current implementation of buffer zone programs tounderstand existing problems and design improved strategies
for local engagement in wildlife management and conservationin the changing national and global context.
Acknowledgements We thank the National Trust for NatureConservation, Leiden University, and Antwerp University for their sup-port for this study. We acknowledge funding from USAID – Hariyo BanProgram throughWWFNepal (Agreement #EN32) to conduct fieldwork.We also thank the US Fish and Wildlife Service for the grant throughNTNC. The Louwes Fund for Research on Water and Food at LeidenUniversity provided a fellowship for the first author during this study. Wewould like to acknowledge the contribution of late Amar Thapa, BikashPathak, Shyam Prasad Regmi, Kewal Prasad Chaudary, and IshwariPathak during data collection. We also thank Biraj Chaudhary andPratigya Gyawali for their support during data compilation.
Funding The study was funded by USAID – Hariyo Ban Programthrough WWF Nepal (Agreement #EN32), US Fish and WildlifeService, and the Louwes Fund for Research on Water and Food atLeiden University.
Compliance with Ethical Standards
Conflict of Interest Authors declare that they have no conflict ofinterest.
Open Access This article is distributed under the terms of the CreativeCommons At t r ibut ion 4 .0 In te rna t ional License (h t tp : / /creativecommons.org/licenses/by/4.0/), which permits unrestricted use,distribution, and reproduction in any medium, provided you giveappropriate credit to the original author(s) and the source, provide a linkto the Creative Commons license, and indicate if changes were made.
Publisher’s Note Springer Nature remains neutral with regard to juris-dictional claims in published maps and institutional affiliations.
References
Andrade, G. S. M., and Rhodes, J. R. (2012). Protected areas and localcommunities: An inevitable partnership toward successful conser-vation strategies? Ecol. Soc. 17(4).
Banikoi, H., Shuvani, T., Bhattarai, N., Kandel, R.C., Chaudhary, S. et al.(2017). Mitigating human-wildlife conflict in Nepal: A case study offences around Chitwan National Park. International Centre for inte-grated mountain development (ICIMOD), Kathmandu.
Bruner, A. G., Gullison, R. E., Rice, R. E., and da Fonseca, G. A. B.(2001). Effective ess of parks in protecting tropical biodiversity.Science 291(80): 126–128.
Budhathoki, P. (2004). Linking communities with conservation in devel-oping countries: Buffer zone management initiatives in Nepal. Oryx.38(3): 334–341.
Carter, N. H., Riley, S. J., Shortridge, A., Shrestha, B. K., and Liu, J.(2014). Spatial assessment of attitudes toward tigers in Nepal.Ambio. 43(2): 125–137.
Central Bureau of Statistics (2012). National population and housingcensus 2011. Central Bureau of Statistics, Kathmandu.
CNP. (2013). Management Plan of Chitwan Naitonal Park and BufferZone Area. Chitwan National Park, Kasara, Chitwan.
CNP. (2015). Grassland habitat mapping in Chitwan National Park.Chitwan National Park, Kasara, Chitwan.
CNP. (2017). Annual Report 2073/74. Chitwan National Park, Kasara,Chitwan.
Hum Ecol
De Vaus, D. A. (2013). Surveys in social research, 5th edn., Allen &Unwin, Sydney.
Dhungana, R., Savini, T., Karki, J. B., Dhakal, M., Lamichhane, B. R.,and Bumrungsri, S. (2018). Living with tigers Panthera tigris:Patterns, correlates, and contexts of human-tiger conflict inChitwan National Park, Nepal. Oryx. 52(1): 55–65.
Dickman, A.J. (2010). Complexities of conflict: The importance of con-sidering social factors for effectively resolving human-wildlife con-flict. Anim. Conserv. 13(5): 458–466.
DNPWC. (2017). Annual Report FY 2074/75. Department of NationalParks and Wildlife Conservation, Kathmandu.
Goodrich, J.M. (2010). Human-tiger conflict: A review and call for com-prehensive plans. Integr. Zool. 5(4): 300–312.
Gurung, B., Nelson, K. C., and Smith, J. L. D. (2009). Impact of grazingrestrictions on livestock composition and husbandry practices inMadi Valley, Chitwan National Park, Nepal. Environ. Conserv.36(4): 338–347.
Heinen, J. T., and Mehta, J. N. (2000). Emerging issues in legal andprocedural aspects of buffer zone management with case studiesfrom Nepal. J. Environ. Dev. 9(1): 45–67.
IBM. (2012). IBM SPSS Statistics for Windows, Version 20.0. IBMCorporation, New York.
IUCN. (2008). Defining Protected Areas: IUCN Protected AreasCategories Summit Proceedings. International Union forConservation of Nature and Natural Resources, Glan.
Karanth, K.U., Madhusudan, M.D. (2002). Mitigating human-wildlife con-flicts in southern Asia. In J. Terborgh, C. Van Schaik, L. Davenport, M.Rao (Eds.), Making Parks Work: Strategies for Preserving TropicalNature. Island Press, Washington, DC, pp. 250–64.
Karki, J. B., Pandav, B., Jnawali, S. R., Shrestha, R., Pradhan, N. M. B.,et al (2015). Estimating the abundance of Nepal’s largest populationof tigers Panthera tigris. Oryx. 49(1): 150–156.
Kolipaka, S. S. (2018). Can tigers survive in human-dominated land-scapes?. Leiden University, Leiden.
Lambin, E. F., and Meyfroidt, P. (2011). Global land use change, eco-nomic globalization, and the looming land scarcity. Proc. Natl.Acad. Sci. 108(9): 3465–3472.
Lamichhane, B. R., Persoon, G. A., Leirs, H., Poudel, S., Subedi, N., et al(2018). Spatio-temporal patterns of attacks on human and economiclosses from wildlife in Chitwan national park. Nepal. PLoS ONE.13(4): e0195373.
Likert, R. (1932). A technique for the measurement of attitudes. Archivesof Psychology. 22(140): 5–55.
Madden, F. (2004). Creating coexistence between humans and wildlife:Global perspectives on local efforts to address human–wildlife con-flict. Hum. Dimens. Wildl. 9(4): 247–257.
Mishra, H. R. (1982). Balancing human needs and conservation in Nepal’sRoyal Chitwan Park ( rhinoceros, tiger). Ambio. 11(5): 246–251.
MOFSC. (1998). Buffer Zone Management Guidelines. Ministry ofForests and Soil Conservation, Kathmandu.
MOFE. (2017). Guidelines for compensation payments on damages fromwildlife (third amendment). Ministry of Forests and Environment,Kathmandu.
Naughton-treves, L., Holland,M. B., and Brandon, K. (2005). The role ofprotected areas in conserving biodiveresity and sustaining local live-lihoods. Annu. Rev. Environ. Resour. 30: 219–252.
Nepal, S. K., and Weber, K. E. (1994). A buffer zone for biodiversityconservation: Viability of the concept in Nepal’s royal Chitwan na-tional park. Environ. Conserv. 21(4): 333–341.
Nepal, S. K., andWeber, K. E. (1995). The quandary of local people-parkrelations in Nepal’s Royal Chitwan National Park. Environ.Manage. 19(6): 853–866.
Nyhus, P., Osofsky, S., Ferraro, P., Fischer, H., and Madden, F. (2005).Bearing the costs of human-wildlife conflict : The challenges ofcompensation schemes. In Woodroffe, R., Thirgood, S., and
Rabinowitz, A. (eds.), People and wildlife: Conflict or coexistence?Oxford University Press, Oxford, pp. 107–121.
Pant, G., Dhakal, M., Pradhan, N.M.B., Leverington, F., Hockings, M.(2016). Nature and extent of human-elephant Elephas maximus con-flict in Central Nepal. Oryx. 50(4): 724–731.
Paudel Khatiwada, S., Deng,W., Paudel, B., Khatiwada, J., Zhang, J., and Su,Y. (2017). Household livelihood strategies and implication for povertyreduction in rural areas of Central Nepal. Sustainability. 9(4): 612.
Persoon, G.A., Van Est D.M.E. (2003). Co-management of natural re-sources: The concept and aspects of implementation. In Persoon G.A., Van Est D. M. E., and Sajise P. (eds.), Co-Management ofNatural Resources in Asia: A Comparative Perspective. NordicInstitute of Asian Studies, Copenhagen, pp. 1–24.
QGIS Development Team. (2016). QGIS Version 2.7. Qgis. http://www.qgis.org/en/site/
R Core Team. (2017). R: A Language and Environment for StatisticalComputing, Version 3.14. R Core Team.
Sapkota, S., Aryal, A., Baral, S. R., Hayward, M.W., and Raubenheimer,D. (2014). Economic analysis of electric fencing for mitigatinghuman-wildlife conflict in Nepal. J. Resour. Ecol. 5(3): 237–243.
Sayer, J. (1991). Rainforest buffer zones: Guidelines for protected areamanagers. International Union for Conservation of Nature andNatural Resources, Glan.
Sharma, U. R. (1990). An overview of park-people interactions in RoyalChitwan National Park. Nepal. Landscape and Urban Planning.19(2): 133–144.
Sharma, U.R. (1991). Park-people interactions in Royal ChitwanNational Park, Nepal. The University of Arizona, Tucson.
Silwal, T., Shrestha, B. P., Bhatta, B. P., and Devkota, B. P. (2013).Revenue distribution pattern and park-people conflict in ChitwanNational Park, Nepal. Banko Janakari. 23(1): 35–41.
Silwal, T., Kolejka, J., Bhatta, B. P., Rayamajhi, S., Sharma, R. P., andPoudel, B. S. (2017). When, where and whom: Assessing wildlifeattacks on people in Chitwan National Park, Nepal. Oryx. 51(2):370–377.
Spiteri, A., and Nepal, S. K. (2008). Distributing conservation incentivesin the buffer zone of Chitwan National Park. Nepal. Environ.Conserv. 35(1): 76–86.
Stapp, J. R., Lilieholm, R. J., Leahy, J., and Upadhaya, S. (2016). Linkingattitudes, policy, and Forest cover change in buffer zone communi-ties of Chitwan National Park. Nepal. Environ. Manage. 57(6):1292–1303.
Subedi, N., Lamichhane, B. R., Amin, R., Jnawali, S. R., and Jhala, Y. V.(2017). Demography and viability of the largest population of greaterone-horned rhinoceros in Nepal. Glob. Ecol. Conserv. 12: 241–252.
Thapa, T. B. (2011). Habitat Suitability Evaluation for Leopard (Pantherapardus) Using Remote Sensing and GIS in and Around ChitwanNational Park, Nepal. Saurastra University, Rajkot and WildlifeInstitute of India, Dehradun.
Treves, A., Wallace, R. B., Naughton-Treves, L., and Morales, A. (2006).Co-managing human–wildlife conflicts: A review. Hum. Dimens.Wildl. 11(6): 383–396.
Treves, A., Wallace, R. B., and White, S. (2009). Participatory planningof interventions to mitigate human-wildlife conflicts. Conserv. Biol.23(6): 1577–1587.
Walston, J., Robinson, J. G., Bennett, E. L., Breitenmoser, U., daFonseca, G. A. B., et al (2010). Bringing the tiger back from thebrink-the six percent solution. PLoS Biol. 8(9): e100048.
Wegge, P., Yadav, S. K., and Lamichhane, B. R. (2018). Are corridorsgood for tigers Panthera tigris but bad for people? An assessment ofthe Khata corridor in lowland Nepal. Oryx. 52(1): 35–45.
Woodroffe, R., Thirgood, S., and Rabinowitz, A. (2005). The impact ofhuman – wildlife conflict on natural systems. In Woodroffe, R.,Thirgood, S., and Rabinowitz, A. (eds.), People and Wildlife, Conflictor Co-Existence? Oxford University Press, Oxford. pp. 1–12