52
Marion County Urban Growth Boundaries (UGB) & Area Outside UGBs Through 2021 2071 Coordinated Population Forecast
Marion County
Urban Growth
Boundaries (UGB)
& Area Outside UGBs
Through
2021
2071
Coordinated
Population
Forecast

Photo Credit: Gary Halvorson, March 2005. https://commons.wikimedia.org/wiki/File:Public_Service_Building_(Marion_County,_Oregon_scenic_im
ages)_(marD0027c).jpg

1
Coordinated Population Forecast for Marion County, its Urban Growth
Boundaries (UGB), and Area Outside UGBs
2021 – 2071
Prepared by
Population Research Center
College of Urban and Public Affairs
Portland State University
June 30, 2021
This project is funded by the State of Oregon through the Department of Land Conservation and
Development (DLCD). The contents of this document do not necessarily reflect the views or policies of
the State of Oregon.
2
Population Research Center (PRC) Project Staff
Cindy Chen, Population Forecast Program Manager
Ethan Sharygin, Director
Paul Runge, Graduate Research Assistant
Kevin Rancik, GIS & Research Analyst
Deborah Loftus, Accounting Technician
Charles Rynerson, Oregon State Data Center Coordinator
Huda Alkitkat, Population Estimates Program Manager
The PRC project staff wish to acknowledge and express gratitude for support from the Forecast Advisory
Committee (DLCD) and the hard work of many people who contributed to the development of these
forecasts by answering questions, lending insight, providing data, or giving feedback.

3
How to Read this Report
This report should be read with reference to the documents listed below, which are downloadable on
the Forecast Program website (https://www.pdx.edu/population-research/population-forecasts).
• Methods and Data for Developing Coordinated Population Forecasts: Provides a detailed
description and discussion of the forecast methods employed. This document also describes the
assumptions that feed into these methods and determine the forecast output.
• Forecast Tables: Provides complete tables of population forecast numbers by county and all sub‐
areas within each county for each five‐year interval of the forecast period (2021‐2071).

4
Table of Contents 1. Methodology ......................................................................................................................................... 6
1.1 Data and Assumptions ........................................................................................................................ 6
2. County Summary ................................................................................................................................... 7
3. Historical Trend and Population Forecast ............................................................................................. 7
3.1 County Population .............................................................................................................................. 7
3.2 Births and Deaths ................................................................................................................................ 8
3.3 Migration ........................................................................................................................................... 10
3.4 Age Structure .................................................................................................................................... 11
3.5 Race/Ethnicity ................................................................................................................................... 13
3.6 Component of Change ................................................................................................................ 13
3.7 Sub-Area Population ......................................................................................................................... 14
3.7.1 Larger UGBs ................................................................................................................................ 15
3.7.2 Smaller UGBs .............................................................................................................................. 16
4. Glossary of Key Terms ......................................................................................................................... 18
5. Appendix A: General Survey and Responses for the Oregon Forecast Program ................................ 19
6. Appendix B: Detail Population Forecast Results ................................................................................. 49
7. Appendix C: Comparison of Current and Previous Forecast ............................................................... 50

5
List of Figures
Figure 1. Historical total county population and AAGR, 1975-2020. ............................................................ 7
Figure 2. Forecasted total county population and AAGR, 2021-2071. ......................................................... 8
Figure 3. Historical and projected total fertility rate (TFR), 2010-2045........................................................ 9
Figure 4. Historical and projected annual births/deaths trend, 2010-2045. ................................................ 9
Figure 5. Net migration rates by age in Marion County and Oregon, 2000-2010. ..................................... 10
Figure 6. Historical and projected total county net migration, 2011-2045. ............................................... 11
Figure 7. Population structure by age and sex, 2000, 2010, 2030, and 2045. ............................................ 12
Figure 8. Components of population change, 2021-2045. ......................................................................... 14
List of Tables
Table 1. County population by race/ethnicity. ........................................................................................... 13
Table 2. Historical and forecasted population and AAGR in Marion County and its sub-areas. ................ 15
Table 3. Population forecast for larger sub-areas and their shares of county population. ........................ 16
Table 4. Population forecast for smaller sub-areas and their shares of county population. ..................... 17

6
1. Methodology The cohort component model and housing unit method were used for the population forecast. Details
are described in the methodology document posted on the Population Research Center’s website.
1.1 Data and Assumptions This section lists the source of data and assumptions applied to the forecast.
1. Fertility and mortality:
a) Deaths and survival rates were projected based on historical trends (2000-2019) and
based on the methodology published by Clark and Sharrow 20111. Mortality rates for
the 85+ age group were further divided into 5-year age groups up to 100+.
b) We applied some constrains to ensure the number of deaths maintain in a reasonable
range as the elderly populations grow, accounting for positive factors associated with
life expectancy (e.g., advanced medical treatments, life-style changes).
c) Fertility rates were projected based on historical trend up to 2030 and remain constant
afterwards.
d) Births and deaths were estimated for the year 2020 and 2021 to account for the events
that take place between July 2019 and July 2022. The 2020 preliminary data from the
Oregon Health Authority (OHA) was used at the time of this report.
2. Net migration rates were based on the data published by the University of Wisconsin-Madison
for 2000-2010, with minor adjustments made based on the following assumptions:
a) In/out migration would gradually approach zero for populations over 65, assuming there
is minimal moving for people as they approach the age of 85+.
b) Considered and mitigated the uncertainties of in/out migration among college students
when applicable.
c) Considered the impacts associated with the COVID-19 pandemic that has been taking
place since March 2020. Assumptions were made based on the differences between the
2019 and 2020 net migration data. Details are described in the methodology
documentation.
3. Populations in sub-areas were forecasted using the housing unit method based on survey
responses and historical pattern.
4. COVID-19 Impacts:
a) COVID-19 impacts on the components of population were not incorporated in the
forecast because they are considered as short-term and temporary impacts that do not
expect to post significantly influence the long-term population trends.
b) The impacts are reflected for the years 2020 and 2021 in some individual figures related
to the population components (e.g., births and deaths, net migration) for illustration
purpose. The 2020 and 2021 estimates shown in the historical figures are preliminary
and may change when the data are finalized by the organizations that produce them.
1 https://csss.uw.edu/research/working-papers/contemporary-model-life-tables-developed-countries-application-model-based

7
2. County Summary Marion county's economic base is government, agriculture, food processing, and manufacturing. The
county centers on the county seat, Salem, which is home to about half the county's population. Based
on the general and housing surveys collected by the Population Research Center, steady housing
developments in Salem and communities within commuting distance to Salem/Portland/Albany are
expected to continue. Smaller cities seem to grow based on availability of annexed/annexable
undeveloped land within their UGB usually used for single family residential (SFR) subdivisions. Growing
cities also cite low infrastructure barriers to development. Some smaller cities proposed infrastructure
development plans that are taking or will take place within their UGBs, which can promote future
population growth in these areas.
3. Historical Trend and Population Forecast
3.1 County Population Marion County’s population growth reached its peak in 1975-1980 at 3.7% and has remained around
1.0% since 2005. Over the period from 1975 to 2020, Marion County’s population increased from
171,519 to 349,121, reflecting a 104% growth in a 45-year timeframe (Figure 1). The county-wide
population experienced the most robust growth in the late 1970s and the 1990s. The forecast shows
that the county’s population will increase to 416,327 in 2045 and 463,420 in 2071, reflecting a total of
30% growth over 50 years. The county is forecasted to experience a relatively higher population growth
rate in the next several years. The AAGR is anticipated to gradually decline to around 0.4% by 2045. This
rate is carried out to the rest of the forecast.
Figure 1. Historical total county population and AAGR, 1975-2020.

8
Figure 2. Forecasted total county population and AAGR, 2021-2071.
3.2 Births and Deaths The total fertility rate (TFR) for women between the ages of 15 and 44 is shown in Figure 3. Marion
County’s TFR experienced a drop after 2016, in which the TFR declined to under 2.0 in 2017 from 2.05 in
2016. Because of the recent declining trend, the TFR in Marion County is projected to remain in the
1.62-1.75. Due to the COVID-19 pandemic in 2020, the fertility rate may have experienced short-term
changes that does not follow the historical pattern. Therefore, without finalized 2020 age-specific birth
data at the time of this report, the TFR in 2020 was intentionally excluded. Nonetheless, the impacts
associated with COVID-19 are expected to diminish in the next several years and the TFR is expected to
return to normal.
As shown in Figure 4, the county-wide annual births are projected to remain in the upper 3,000 and
lower 4,000 range. In contrast, annual deaths are projected to increase significantly in the next several
years and outnumber annual births by 2029. By 2045, the projected annual births and deaths are 4,138
and 5,474, respectively. Preliminary and estimated birth and death data are shown for 2020 and 2021 to
reflect impacts associated with the COVID-19 pandemic. Fewer births and more deaths in 2020 and 2021
can be attributed to changing behaviors in response to the pandemic.

9
Figure 3. Historical and projected total fertility rate (TFR), 2010-2045.
Figure 4. Historical and projected annual births/deaths trend, 2010-2045.
10
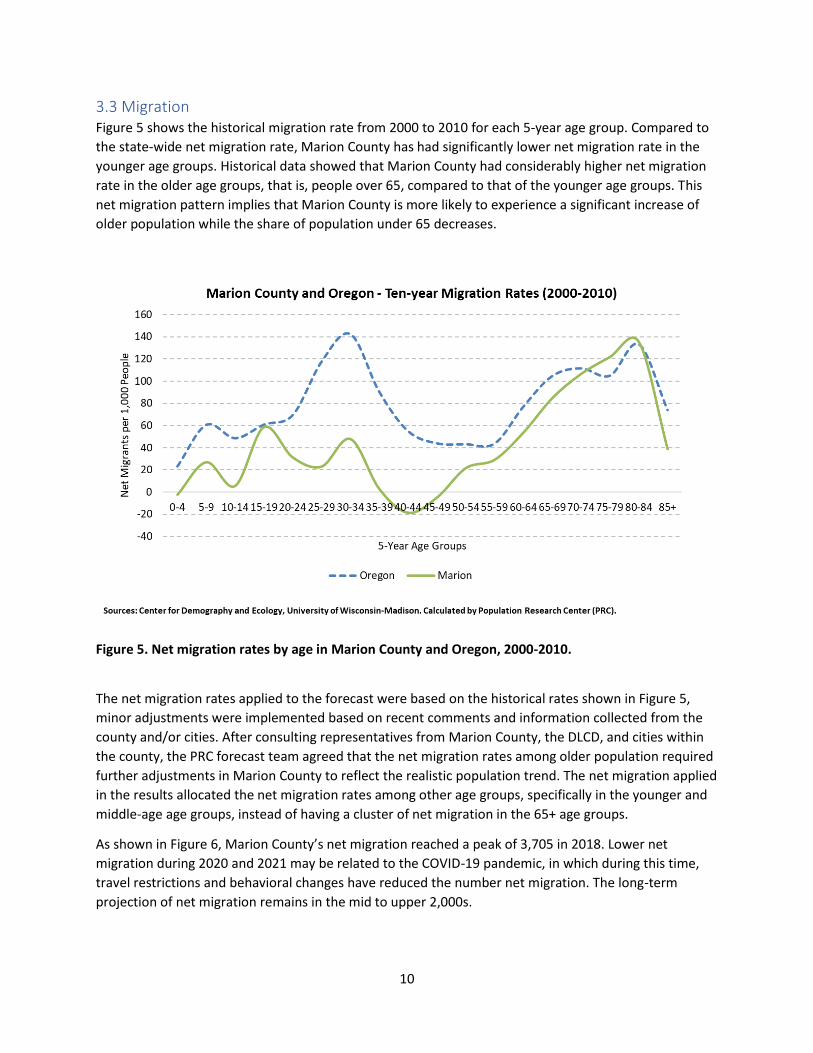
3.3 Migration Figure 5 shows the historical migration rate from 2000 to 2010 for each 5-year age group. Compared to
the state-wide net migration rate, Marion County has had significantly lower net migration rate in the
younger age groups. Historical data showed that Marion County had considerably higher net migration
rate in the older age groups, that is, people over 65, compared to that of the younger age groups. This
net migration pattern implies that Marion County is more likely to experience a significant increase of
older population while the share of population under 65 decreases.
Figure 5. Net migration rates by age in Marion County and Oregon, 2000-2010.
The net migration rates applied to the forecast were based on the historical rates shown in Figure 5,
minor adjustments were implemented based on recent comments and information collected from the
county and/or cities. After consulting representatives from Marion County, the DLCD, and cities within
the county, the PRC forecast team agreed that the net migration rates among older population required
further adjustments in Marion County to reflect the realistic population trend. The net migration applied
in the results allocated the net migration rates among other age groups, specifically in the younger and
middle-age age groups, instead of having a cluster of net migration in the 65+ age groups.
As shown in Figure 6, Marion County’s net migration reached a peak of 3,705 in 2018. Lower net
migration during 2020 and 2021 may be related to the COVID-19 pandemic, in which during this time,
travel restrictions and behavioral changes have reduced the number net migration. The long-term
projection of net migration remains in the mid to upper 2,000s.

11
Figure 6. Historical and projected total county net migration, 2011-2045.
3.4 Age Structure Compared to the 2000 and 2010 decennial census, the forecast shows the younger population aging
forward and the proportion of the older population increases (Figure 7). While population 85+ only
accounted for about 2% of the county population in 2010, this percentage increases to 3% in 2030, and
then to 5% in 2045. The proportion of the youngest age groups (e.g., 0-4, 5-9, and 10-14) is projected to
decrease. The changing age structure can be attributed to many factors, including longer life
expectancy, lower fertility rate, and higher net migration in population over 65. Relatively lower net
migration in population between the ages of 35 and 50 can impact the net migration for children under
18, as they often move with their parents.

12
Figure 7. Population structure by age and sex, 2000, 2010, 2030, and 2045.

13
3.5 Race/Ethnicity Table 1 shows the race/ethnicity characteristics in Marion County from the 2000 and 2010 census, as
well as the 2019 American Community Survey (ACS) estimates. It is important to note that the 2019 ACS
is an estimation, and the sampling methodology is different from the 2000 and 2010 census. Race factor
was not included as a part of the forecast but is provided in this report for reference. Among non-White
alone and non-Hispanic/Latino populations, population that identified as “two or more races” showed
the most absolute change between 2000 and 2019, followed by Native Hawaiian and Alaska Native. The
Hispanic/Latino population showed significant increase between the two periods, 2000-2010 and 2010-
2019. Between 2000 and 2019, the Hispanic/Latino population showed a significant increase in both
absolute number and county share. In the 10-year period between 2000 and 2010, the Hispanic/Latino
population increased from 48,714 to 76,594, a 57% growth. According to the 2019 estimate, the
Hispanic/Latino population grew to 90,277, a 18% growth from 2010.
Table 1. County population by race/ethnicity.
3.6 Component of Change The component of population changes up to 2045 is shown in Figure 8. The darker blue shade indicates
the natural increase/decrease, while the lighter blue shade indicates the net migration. Positive net
migration implies that in-migration is higher than out-migration, and vice versa. In Marion County,
natural increase is projected to increase in the next several years and natural decrease occurs in 2029.
Natural decrease continues throughout the rest of the forecast. Net migration remains positive and
contributes to the county-wide population growth. Unusually lower net migration in 2021 was
estimated using the 2020 migration data to reflect the potential impacts of the COVID-19 pandemic.

14
Figure 8. Components of population change, 2021-2045.
3.7 Sub-Area Population All UGBs in Marion County are projected to growth according to the forecast. Smaller sub-areas show a
more robust growth compared to larger sub-areas (Table 2). The Aurora, Donald, and Mill City UGBs are
projected to experience an average annual growth rate of at least 2.0% between 2020 and 2045. With a
projected population of 218,273 by 2045, the Salem UGB continues to be the most populated in Marion
County. The Keizer UGB is the second most populated UGB in Marion County and is projected to have
44,927 people by 2045. Some smaller UGBs such as Aumsville, Detroit, Idanha, Jefferson, Mill City, St.
Paul, and Turner are expected to have robust growth throughout the forecast period. In contrast,
population outside of the UGBs is projected to decrease during the second half of the forecast period,
mainly due to higher population increases within the UGBs.

15
Table 2. Historical and forecasted population and AAGR in Marion County and its sub-areas.
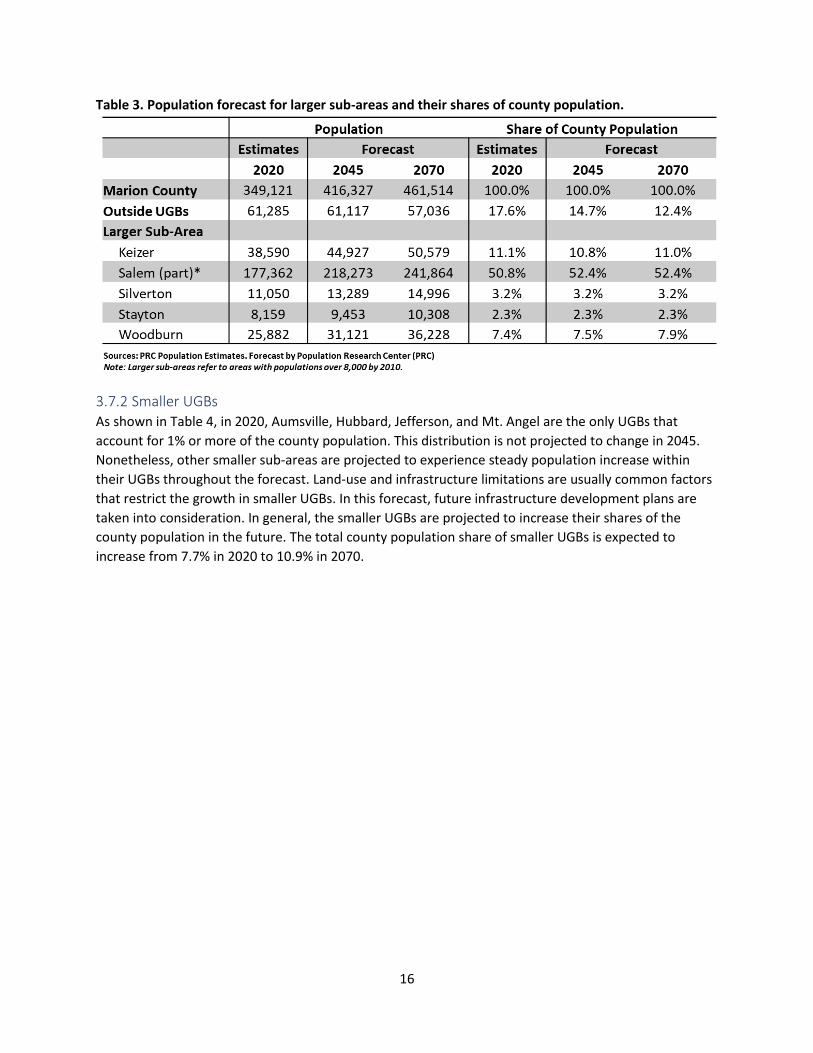
3.7.1 Larger UGBs As shown in Table 3, among larger sub-areas, the Keizer and Salem UGBs account for most of the
population shares. The Keizer/Salem combined UGB is shown as two separate UGBs instead of a
combined UGB in this report. By 2045, there expect to be 218,273 people within Marion County’s
portion of the Salem UGB. As the second most populated UGB in Marion County, the Keizer UGB expects
to have 44,927 people by 2045. The Salem UGB is expected to account for 52.4% of the county
population in 2045, compared to 50.8% in 2020. Woodburn is projected to maintain a steady growth
within its UGB. With 31,121 people projected, Woodburn is expected to account for 7.5% of the county
population by 2045. Both Silverton and Stayton UGBs are projected to maintain their current shares of
the county.
16
Table 3. Population forecast for larger sub-areas and their shares of county population.
3.7.2 Smaller UGBs As shown in Table 4, in 2020, Aumsville, Hubbard, Jefferson, and Mt. Angel are the only UGBs that
account for 1% or more of the county population. This distribution is not projected to change in 2045.
Nonetheless, other smaller sub-areas are projected to experience steady population increase within
their UGBs throughout the forecast. Land-use and infrastructure limitations are usually common factors
that restrict the growth in smaller UGBs. In this forecast, future infrastructure development plans are
taken into consideration. In general, the smaller UGBs are projected to increase their shares of the
county population in the future. The total county population share of smaller UGBs is expected to
increase from 7.7% in 2020 to 10.9% in 2070.

17
Table 4. Population forecast for smaller sub-areas and their shares of county population.

18
4. Glossary of Key Terms Cohort-Component Method: A method used to forecast future populations based on changes in births,
deaths, and migration over time.
Coordinated population forecast: A population forecast prepared for the County along with population
forecasts for its urban growth boundary (UGB) areas and non-UGB area.
Housing unit: A house, apartment, mobile home or trailer, group of rooms, or single room that is
occupied or is intended for occupancy.
Housing-Unit Method: A method used to forecast future populations based on changes in housing unit
counts, vacancy rates, the average numbers of persons per household (PPH), and group quarter
population counts.
Occupancy rate: The proportion of total housing units that are occupied by an individual or group of
persons.
Persons per household (PPH): The average household size (i.e. the average number of persons per
occupied housing unit).
Replacement Level Fertility: The average number of children each woman needs to bear in order to
replace the population (to replace each male and female) under current mortality conditions in the U.S.
This is commonly estimated to be 2.1 children per woman.

19
5. Appendix A: General Survey and Responses for the Oregon Forecast
Program
SUMMARY Town of 200 people an hour from Salem by car. Devestated by fire: 80% homes destroyed, all three hotels and almost all of commercial area. No new economic or housing development plans. Unclear whether people will rebuild. Population in town has been aging as well.
County Marion
Timestamp 10/30/2020 12:58
Email Address [email protected]
Jurisdiction City of Detroit
Name and Title Shelley Engle, Council Presidebt
Observations about Population (e.g. birth rates, aging, immigration, racial and ethnic change)
Our city has aged. We have under 10 children of school age.
Observations about Housing (Vacancy rates, seasonal occupancy, demolitions, renovations)
Due to the forest fires, we have lost 80% of homes, all hotels, and at this time of year, seasonal occupancy would be down anyway.
Planned Housing Developments or Group Quarters Facilities (including number of units, occupancy, and estimated year of completion)
We have no plans for new housing developments or group quarters facilities.
Economic Development (e.g. new employers or facilities, including number of jobs and est. year of completion)
Economic development is stalled due to lack of infrastructure and sewers
Infrastructure Projects (e.g. transportation and utilities)
A planned sewer system, underground fiber and underground power lines
Other Factors Promoting Population or Housing Growth
none
Other Factors Hindering Population or Housing Growth
Forest fires and lack of industry, commerce and sewer system

20
Other findings, including, if not discussed above: (a) Summary of current or proposed policies affecting growth in your jurisdiction. (b) Findings related to growth or population change from studies conducted in your jurisdiction. (c) The effects of wildfires or other disasters in your jurisdiction on housing, employment/economics, and infrastructure. (d) The effects of the COVID-19 pandemic and policy measures on employment and current and planned developments.
The forest fires of Labor Day weekend were devastating to the City of Detroit. The retail/commercial district was almost 100% destroyed, as were 80% of all homes. Both marinas were destroyed as were all three hotels. There is one tiny restaurant left and a small convenience store. City Hall and the fire station have vanished. Schools left Detroit over 15 years ago.
Comments?
21
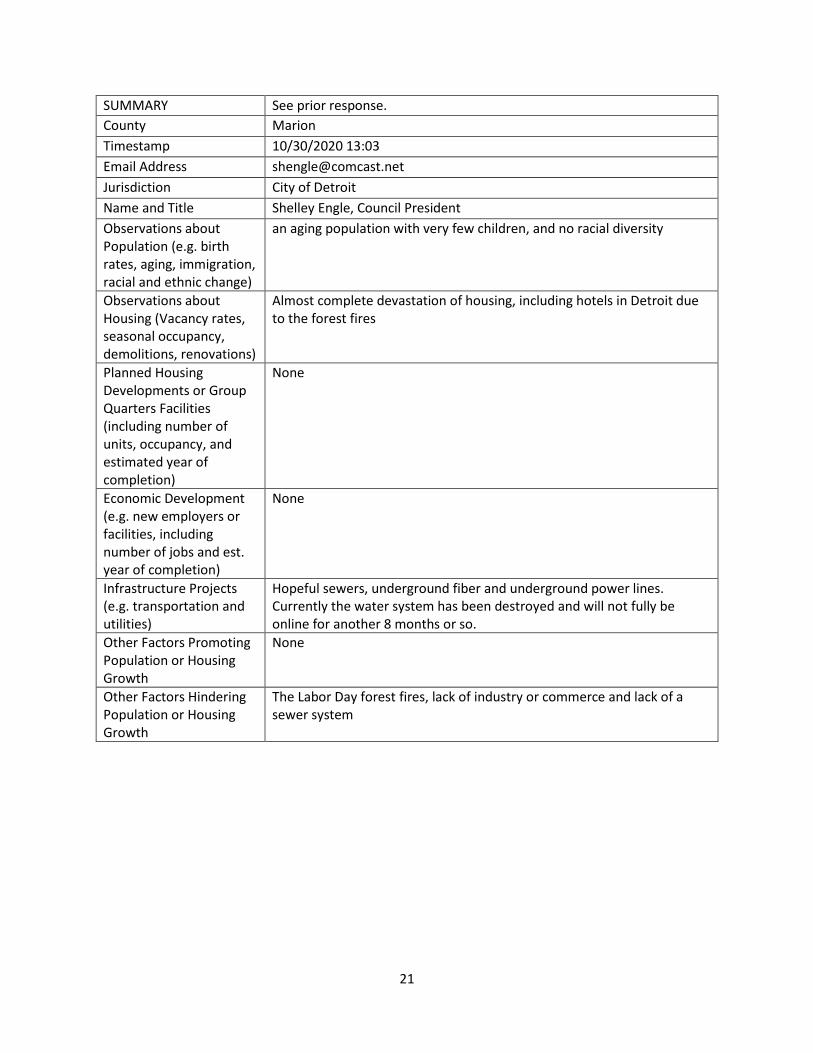
SUMMARY See prior response.
County Marion
Timestamp 10/30/2020 13:03
Email Address [email protected]
Jurisdiction City of Detroit
Name and Title Shelley Engle, Council President
Observations about Population (e.g. birth rates, aging, immigration, racial and ethnic change)
an aging population with very few children, and no racial diversity
Observations about Housing (Vacancy rates, seasonal occupancy, demolitions, renovations)
Almost complete devastation of housing, including hotels in Detroit due to the forest fires
Planned Housing Developments or Group Quarters Facilities (including number of units, occupancy, and estimated year of completion)
None
Economic Development (e.g. new employers or facilities, including number of jobs and est. year of completion)
None
Infrastructure Projects (e.g. transportation and utilities)
Hopeful sewers, underground fiber and underground power lines. Currently the water system has been destroyed and will not fully be online for another 8 months or so.
Other Factors Promoting Population or Housing Growth
None
Other Factors Hindering Population or Housing Growth
The Labor Day forest fires, lack of industry or commerce and lack of a sewer system

22
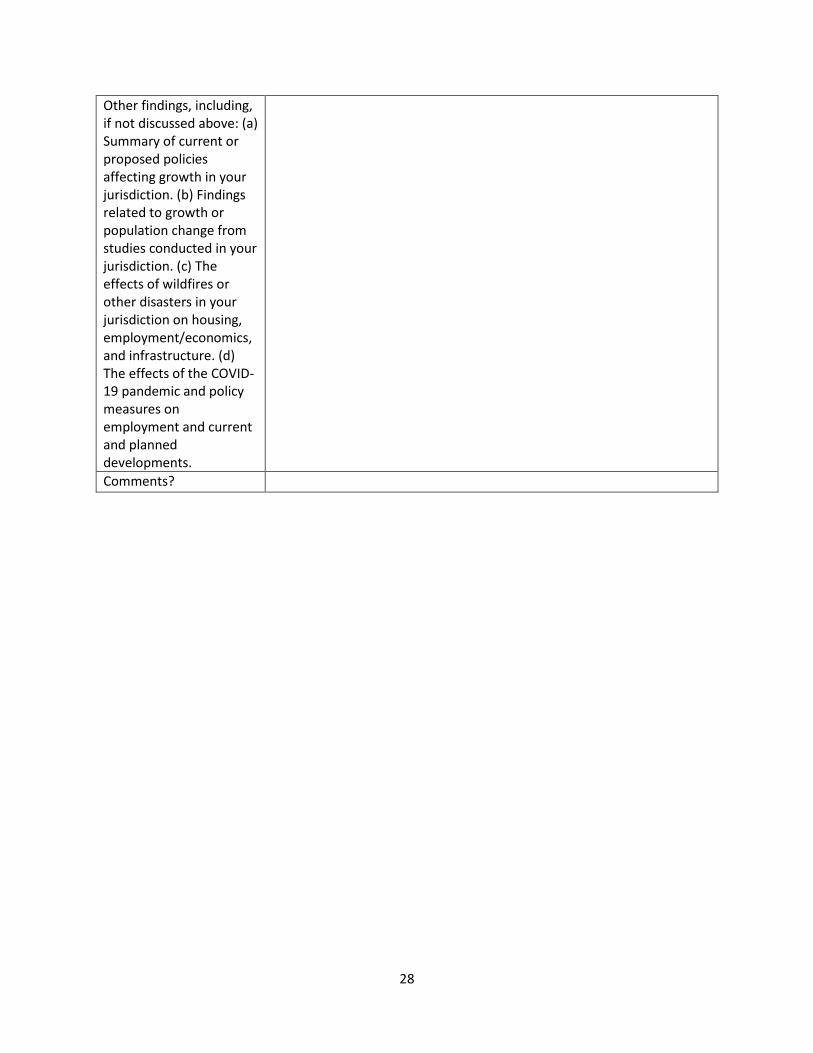
Other findings, including, if not discussed above: (a) Summary of current or proposed policies affecting growth in your jurisdiction. (b) Findings related to growth or population change from studies conducted in your jurisdiction. (c) The effects of wildfires or other disasters in your jurisdiction on housing, employment/economics, and infrastructure. (d) The effects of the COVID-19 pandemic and policy measures on employment and current and planned developments.
the almost and complete destruction due to the Labor Day forest fires, the timber wars due to the spotted owl, and lack of a sewer system has completely hindered the growth and development of the City of Detroit
Comments?

23
SUMMARY See prior response. Town of 200 people an hour from Salem by car. Devestated by fire: 80% homes destroyed, all three hotels and almost all of commercial area. No new economic or housing development plans. Unclear whether people will rebuild. Population in town has been aging as well.
County Marion
Timestamp 12/2/2020 9:12
Email Address [email protected]
Jurisdiction Municipality
Name and Title Kelly Galbraith, City Recorder
Observations about Population (e.g. birth rates, aging, immigration, racial and ethnic change)
City of Detroit 2nd home owners growing(younger group of people)full-time residents population not growing as much
Observations about Housing (Vacancy rates, seasonal occupancy, demolitions, renovations)
Hardly any vacancies in Detroit. Hard to find house rentals. Seasonal rentals more prevalent than more permanent rentals. Now 75% of homes gone due to wildfire.
Planned Housing Developments or Group Quarters Facilities (including number of units, occupancy, and estimated year of completion)
None
Economic Development (e.g. new employers or facilities, including number of jobs and est. year of completion)
Do not know who will rebuild now. Too early to tell
Infrastructure Projects (e.g. transportation and utilities)
Do not know yet
Other Factors Promoting Population or Housing Growth
None
Other Factors Hindering Population or Housing Growth
The wildfires will hinder population growth as some people will not rebuild.

24
Other findings, including, if not discussed above: (a) Summary of current or proposed policies affecting growth in your jurisdiction. (b) Findings related to growth or population change from studies conducted in your jurisdiction. (c) The effects of wildfires or other disasters in your jurisdiction on housing, employment/economics, and infrastructure. (d) The effects of the COVID-19 pandemic and policy measures on employment and current and planned developments.
Comments?

25
SUMMARY Donald is a town of 1000, 15-20 minutes from the southern Portland metro and 15 minutes from Woodburn by car. UGB expanded by 90 acres in 2019. Only two housing units constructed in 2020, but 350-450 units were permitted in 2020 for development over the next decade (80% SFR). Still leaves 15 acres of undeveloped UGB land zoned for residential. Some small levels of employment growth this year, perhaps 10-20 jobs. City planning to expand sewer and water systems to support the new subdivision and an industrial park, but lacks budget to do so themselves. This raises issues for decade long subdivision build out.
County Marion
Timestamp 11/30/2020 15:28
Email Address [email protected]
Jurisdiction City of Donald
Name and Title Holly Byram, City Planner
Observations about Population (e.g. birth rates, aging, immigration, racial and ethnic change)
No changing trends noticed generally.
Observations about Housing (Vacancy rates, seasonal occupancy, demolitions, renovations)
Only two new units housing units in 2020. Very low vacancy rates. No known seasonal vacation rentals.
Planned Housing Developments or Group Quarters Facilities (including number of units, occupancy, and estimated year of completion)
In 2020 the City of Donald approved the Harvest Gardens Subdivision which plans for 297 single-family homes over a 12-year timeframe. The subdivision also includes a pad for multi-family residential development, to include between 49 -133 additional multi-family units within the same 12 year time frame, to be determined. Phase 1 of the Subdivision designed with 29 homes will begin construction in early 2021.
Economic Development (e.g. new employers or facilities, including number of jobs and est. year of completion)
New business licenses in 2020 included: two new small convenience stores, one food cart, three small specialty contractor/parts businesses, and the expansion of an existing electrical company. Only a couple of employees each of the above. The City was just notified that a lot in the Donald Industrial Park sold to a business specializing in lumber/trusses. Unknown job numbers associated with this yet.
Infrastructure Projects (e.g. transportation and utilities)
The City is underway planning projects to expand capacity of water and sewer systems in support of the Harvest Gardens Subdivision, as well as the full build-out of the Donald Industrial Park, and remaining UGB area.
Other Factors Promoting Population or Housing Growth
The City of Donald expanded their UGB by 87.6 acres in 2019. Of that expansion area, 76.7 acres were designated for residential development. Approximately 61.8 acres of that residential area were annexed in 2020 for the Harvest Gardens Subdivision described above (297 single-family homes plus at least 49 multi-family units). ODOT's project to redesign the Donald-Aurora I-5 Interchange will increase safety and capacity of the regional transportation system, and

26
potential expansion of interchange area business park in Marion County Jurisdiction (outside of City UGB).
Other Factors Hindering Population or Housing Growth
Largest factor hindering growth is money for sewer infrastructure, water infrastructure, and transportation infrastructure.
Other findings, including, if not discussed above: (a) Summary of current or proposed policies affecting growth in your jurisdiction. (b) Findings related to growth or population change from studies conducted in your jurisdiction. (c) The effects of wildfires or other disasters in your jurisdiction on housing, employment/economics, and infrastructure. (d) The effects of the COVID-19 pandemic and policy measures on employment and current and planned developments.
In 2019 the City adopted a package of code changes which included new PUD standards to guide residential growth, residential design standards, and a new Mixed Use Downtown zone which design standards for the small commercial core of the city.
Comments?

27
SUMMARY Idanha is a city of 100-200 people, over an hour from Salem. No development or economic development. Some seasonal occupancy.
County Linn/Marion
Timestamp 11/24/2020 11:08
Email Address [email protected]
Jurisdiction linn/marion
Name and Title rebecca oladeinde/ city recorder
Observations about Population (e.g. birth rates, aging, immigration, racial and ethnic change)
none
Observations about Housing (Vacancy rates, seasonal occupancy, demolitions, renovations)
more summer homes are now rentals year around
Planned Housing Developments or Group Quarters Facilities (including number of units, occupancy, and estimated year of completion)
0
Economic Development (e.g. new employers or facilities, including number of jobs and est. year of completion)
0
Infrastructure Projects (e.g. transportation and utilities)
just completed our water project we got a 1.7 million dollar grant for new water plant and distribution lines
Other Factors Promoting Population or Housing Growth
Other Factors Hindering Population or Housing Growth
no new developments going on
28
Other findings, including, if not discussed above: (a) Summary of current or proposed policies affecting growth in your jurisdiction. (b) Findings related to growth or population change from studies conducted in your jurisdiction. (c) The effects of wildfires or other disasters in your jurisdiction on housing, employment/economics, and infrastructure. (d) The effects of the COVID-19 pandemic and policy measures on employment and current and planned developments.
Comments?
29
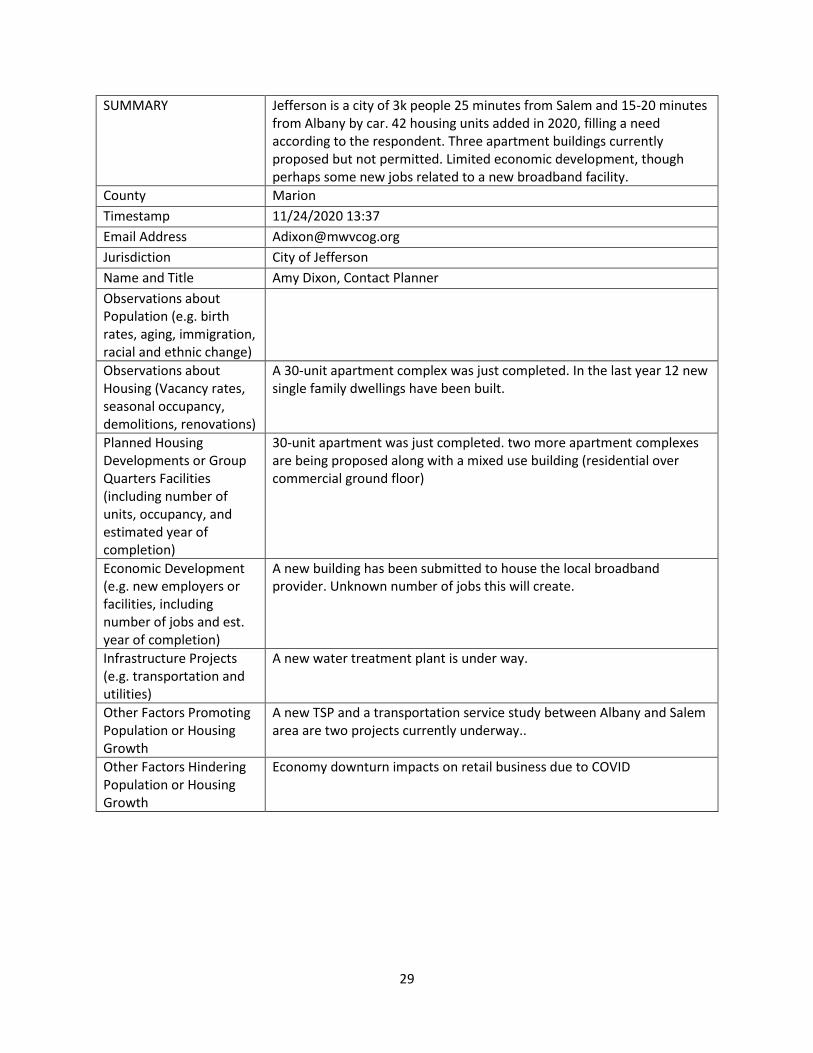
SUMMARY Jefferson is a city of 3k people 25 minutes from Salem and 15-20 minutes from Albany by car. 42 housing units added in 2020, filling a need according to the respondent. Three apartment buildings currently proposed but not permitted. Limited economic development, though perhaps some new jobs related to a new broadband facility.
County Marion
Timestamp 11/24/2020 13:37
Email Address [email protected]
Jurisdiction City of Jefferson
Name and Title Amy Dixon, Contact Planner
Observations about Population (e.g. birth rates, aging, immigration, racial and ethnic change)
Observations about Housing (Vacancy rates, seasonal occupancy, demolitions, renovations)
A 30-unit apartment complex was just completed. In the last year 12 new single family dwellings have been built.
Planned Housing Developments or Group Quarters Facilities (including number of units, occupancy, and estimated year of completion)
30-unit apartment was just completed. two more apartment complexes are being proposed along with a mixed use building (residential over commercial ground floor)
Economic Development (e.g. new employers or facilities, including number of jobs and est. year of completion)
A new building has been submitted to house the local broadband provider. Unknown number of jobs this will create.
Infrastructure Projects (e.g. transportation and utilities)
A new water treatment plant is under way.
Other Factors Promoting Population or Housing Growth
A new TSP and a transportation service study between Albany and Salem area are two projects currently underway..
Other Factors Hindering Population or Housing Growth
Economy downturn impacts on retail business due to COVID

30
Other findings, including, if not discussed above: (a) Summary of current or proposed policies affecting growth in your jurisdiction. (b) Findings related to growth or population change from studies conducted in your jurisdiction. (c) The effects of wildfires or other disasters in your jurisdiction on housing, employment/economics, and infrastructure. (d) The effects of the COVID-19 pandemic and policy measures on employment and current and planned developments.
There are code amendments in progress that will encourage needed dwelling units.
Comments?
31
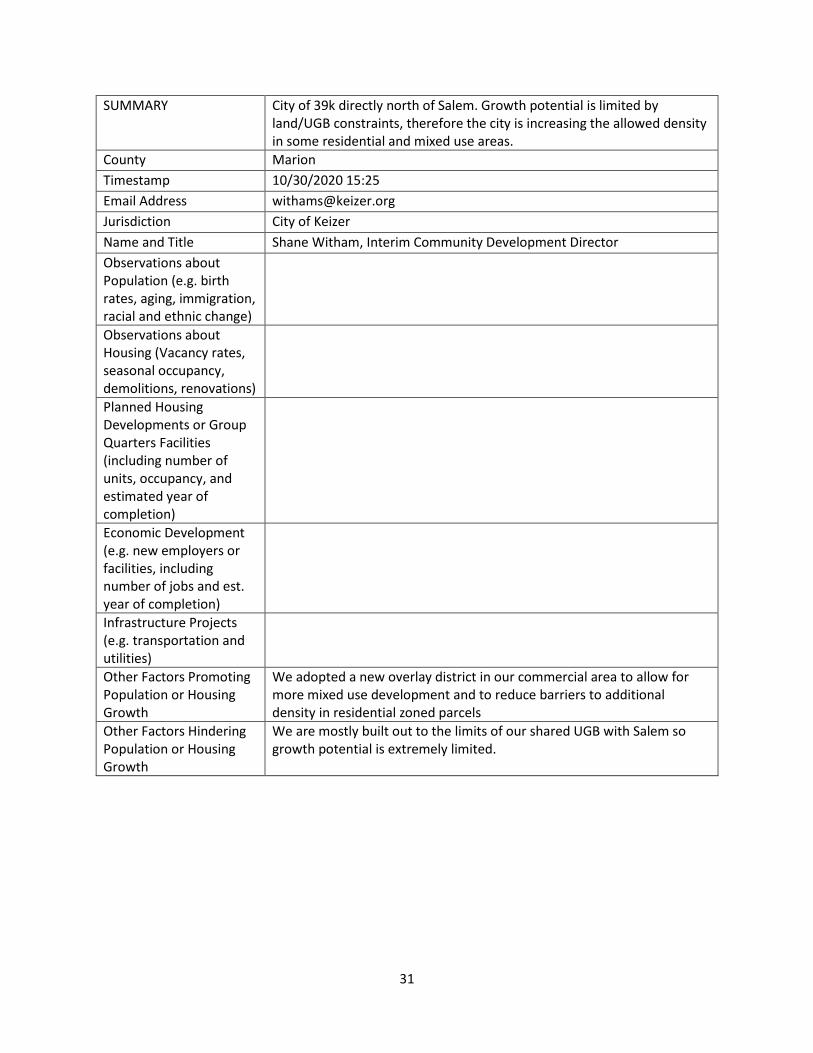
SUMMARY City of 39k directly north of Salem. Growth potential is limited by land/UGB constraints, therefore the city is increasing the allowed density in some residential and mixed use areas.
County Marion
Timestamp 10/30/2020 15:25
Email Address [email protected]
Jurisdiction City of Keizer
Name and Title Shane Witham, Interim Community Development Director
Observations about Population (e.g. birth rates, aging, immigration, racial and ethnic change)
Observations about Housing (Vacancy rates, seasonal occupancy, demolitions, renovations)
Planned Housing Developments or Group Quarters Facilities (including number of units, occupancy, and estimated year of completion)
Economic Development (e.g. new employers or facilities, including number of jobs and est. year of completion)
Infrastructure Projects (e.g. transportation and utilities)
Other Factors Promoting Population or Housing Growth
We adopted a new overlay district in our commercial area to allow for more mixed use development and to reduce barriers to additional density in residential zoned parcels
Other Factors Hindering Population or Housing Growth
We are mostly built out to the limits of our shared UGB with Salem so growth potential is extremely limited.

32
Other findings, including, if not discussed above: (a) Summary of current or proposed policies affecting growth in your jurisdiction. (b) Findings related to growth or population change from studies conducted in your jurisdiction. (c) The effects of wildfires or other disasters in your jurisdiction on housing, employment/economics, and infrastructure. (d) The effects of the COVID-19 pandemic and policy measures on employment and current and planned developments.
Comments?
33
SUMMARY City of 1800 people about 45 minutes by car from Salem. Roughly 25 SFR under construction or permitted, though 20 SFR homes lost in 2020 wildfires. Replacement units and add'l subdivision activity possible in next 2-5 years. FEMA assisting with temporary housing 20+ units. No add'l economic development.
County Linn/Marion
Timestamp 11/30/2020 11:27
Email Address [email protected]
Jurisdiction Mill City
Name and Title David W. Kinney, Planning Consultant
Observations about Population (e.g. birth rates, aging, immigration, racial and ethnic change)
Observations about Housing (Vacancy rates, seasonal occupancy, demolitions, renovations)
Mill City lost 20 homes in Beachie Creek wildfire on September 7-8, 2020. FEMA and the City of Mill City are working to provide temporary housing for N. Santiam Canyon residents who lost homes due to the wildfire. The # of housing units that will be provided and the duration of the temporary housing is unknown as of 11-30-2020. Due to fire, housing opportunities in Mill City & North Santiam Canyon are very limited.
Planned Housing Developments or Group Quarters Facilities (including number of units, occupancy, and estimated year of completion)
See housing questionnaire. Residential Housing Units SFR Units Destroyed by Wildfire 2020 (20 units) SFR Units lost to fire to be replaced 2021-2026 16 units SFR New Construction 2021-2026 55 units Temp Housing (FEMA & City RV Pk) 2021 20-40 units (guesstimate) New construction includes the 16-lot Freeman Meadows Subdivision (approved), 8 permits approved in 2020 and small infill projects throughout the City. An 85+ unit subdivision has been proposed. The City has approved a UGB modification to include the property in the City limits, but no applications have been filed. At the earliest this project would be developed from 2022-2027.
Economic Development (e.g. new employers or facilities, including number of jobs and est. year of completion)
Santiam Canyon School District will complete a MIddle School/High School campus classroom, gymnasium and campus site improvements by June 2021. The project includes 3 new classroom buildings, a 2nd gymnasium, new Elem cafeteria and central campus improvements. Building capacity should handle student growth for the next 10-20 years. Wood products firms in area (Frank Lumber, Freres Lumber) are doing well. No significant changes are anticipated.
34
Infrastructure Projects (e.g. transportation and utilities)
City will complete $2.5 million water system upgrade in 2023. Replaces aging water mains. North Santiam Canyon communities will complete a Wastewater Facilities Plan for Mill City, Gates, Detroit and Idanha. Funding not expected for 5-10 years. Mill City's WWTF appears to be adequate and will handle growth in the City for thenext 5-7 years.
Other Factors Promoting Population or Housing Growth
Other Factors Hindering Population or Housing Growth
Other findings, including, if not discussed above: (a) Summary of current or proposed policies affecting growth in your jurisdiction. (b) Findings related to growth or population change from studies conducted in your jurisdiction. (c) The effects of wildfires or other disasters in your jurisdiction on housing, employment/economics, and infrastructure. (d) The effects of the COVID-19 pandemic and policy measures on employment and current and planned developments.
Comments?

35
SUMMARY Mt Angel is a city of 4k people about 30-35 minutes from Salem. Residents tend to be elderly. Lots are large enough to partition, and that is more common now than in past. In addition, roughly 160 SFR homes are under construction. No economic development, some businesses closed due to pandemic. Low SDCs promote growth, large lot requirements hinder it.
County Marion
Timestamp 11/23/2020 11:29
Email Address [email protected]
Jurisdiction City of Mt. Angel
Name and Title Colby Kemp - Assistant to the City Manager
Observations about Population (e.g. birth rates, aging, immigration, racial and ethnic change)
Population has been steadily increasing. Continue to see a large number of residents in the 65+ age range. Ethnicity percentages continue to remain steady. No influx in certain ethnicities.
Observations about Housing (Vacancy rates, seasonal occupancy, demolitions, renovations)
Housing continues to expand in the form of new homes being constructed. More Partition applications submitted now than ever before. Mt. Angel has a definite lack of affordable and rental housing options. Buildable lands inventory needs to be conducted.
Planned Housing Developments or Group Quarters Facilities (including number of units, occupancy, and estimated year of completion)
Mt. Angel currently has three subdivisions under construction. Maryhill Phase III will consist of 43 single family homes, and is currently under construction with a completion target of 2021. Wachter Meadows will consist of 62 single family homes. The have been moving slowly, and hope to be completed by 2023.Grandview Estates, a 55+ community, will consist of 56 single family units. They should be completed in 2021.
Economic Development (e.g. new employers or facilities, including number of jobs and est. year of completion)
No new business moving in to the City. Due to COVID we have lost 3 small businesses who have had to close due to lack of business.
Infrastructure Projects (e.g. transportation and utilities)
Transportation Plan update, Paving Projects for unimproved roads. Waterline Upgrade ( Marion Court,) and a Sewer Trunk Line project.
Other Factors Promoting Population or Housing Growth
Interest from people wanting to move to this area. SDC fees are lower than surrounding cities.
Other Factors Hindering Population or Housing Growth
Lack of buildable lands inventory. Minimum lot size requirement of 7,000 sqft.

36
Other findings, including, if not discussed above: (a) Summary of current or proposed policies affecting growth in your jurisdiction. (b) Findings related to growth or population change from studies conducted in your jurisdiction. (c) The effects of wildfires or other disasters in your jurisdiction on housing, employment/economics, and infrastructure. (d) The effects of the COVID-19 pandemic and policy measures on employment and current and planned developments.
No Comments
Comments? None

37
SUMMARY Salem is Marion County's seat and has roughly 170k people. The city's economic base is the state, county, and local government, eds and meds, and food processing and packing. The hospital is expanding, adding 50-75 jobs by 2022 and a new hotel is scheduled to open that year as well. In 2019-20, the city approved ~1000 SFR, and ~800 MFR. Another 450 units are currently under review, mostly MFR. Zoning has shifted to accomodate MFR (smaller parking requirements) and affordable housing development (no SDCs). Respondent believes upcoming comprehensive plan process will add MFR zoned land.
County Marion/Polk
Timestamp 11/25/2020 13:58
Email Address [email protected]
Jurisdiction City of Salem
Name and Title Eunice Kim, Long Range Planning Manager
Observations about Population (e.g. birth rates, aging, immigration, racial and ethnic change)
Salem appears to be getting more diverse in terms of racial and ethnic backgrounds. Our Housing Needs Analysis specifically projects that our Hispanic and Latino population will continue to grow. The community is also expected to see an increase in residents who are at least 60 years old.
Observations about Housing (Vacancy rates, seasonal occupancy, demolitions, renovations)
We have been seeing an increase in applications/building permits for multifamily projects, including smaller new infill projects and additions to/reuse of existing buildings. Salem is expected to also see its first mico-apartment project downtown (146 new residents) open in early 2021.
Planned Housing Developments or Group Quarters Facilities (including number of units, occupancy, and estimated year of completion)
In addition to multifamily development (see above), we have continued to see the development of single-family subdivisions on vacant land. We have also seen more development projects to house and serve our homeless population and those at risk of becoming homeless, including new temporary and permanent shelters and transitional housing.
Economic Development (e.g. new employers or facilities, including number of jobs and est. year of completion)
Salem Hospital is expanding, with 150 new beds and 50-75 new jobs in 2022. A new hotel is expected to open downtown in 2022.
Infrastructure Projects (e.g. transportation and utilities)
Other Factors Promoting Population or Housing Growth
We have recently updated our zoning code to make it easier to develop multifamily housing to help accommodate our growing population. This included reducing parking requirements (and eliminating them along frequent bus routes), simplifying the approval process, and reducing the number of design standards. You can learn more here: https://www.cityofsalem.net/Pages/multifamily-housing-design-standards.aspx

38
We have waived system development charges (SDCs) for affordable housing projects to encourage that type of development. We have also temporarily waived SDCs for accessory dwelling units.
Other Factors Hindering Population or Housing Growth
In terms of group living, it is a challenge for the Salem Housing Authority – and other housing providers – to find funding for the on-site services needed to support the population being housed (e.g., chronically homeless population, people with disabilities, and others).
Other findings, including, if not discussed above: (a) Summary of current or proposed policies affecting growth in your jurisdiction. (b) Findings related to growth or population change from studies conducted in your jurisdiction. (c) The effects of wildfires or other disasters in your jurisdiction on housing, employment/economics, and infrastructure. (d) The effects of the COVID-19 pandemic and policy measures on employment and current and planned developments.
We are in the process of updating our Comprehensive Plan, which is expected to include updated goals, policies, and comprehensive plan map. We anticipate redesignating more land for multifamily housing throughout Salem, including more mixed-use designations that allow multifamily housing outright (as opposed to through a conditional use permit as is required today). You can learn more here: https://www.cityofsalem.net/our-salem Our existing Comprehensive Plan can be found here: https://www.cityofsalem.net/Pages/salem-area-comprehensive-plan.aspx We completed our Housing Needs Analysis several years ago. It includes many observations related to our projected population and future housing needs: https://www.cityofsalem.net/CityDocuments/econorthwest-housing-needs-analysis-2015-2035.pdf Our Economic Opportunities Analysis can be found here: https://www.cityofsalem.net/CityDocuments/econorthwest-economic-opportunities-analysis-2015-2035.pdf The City has declared housing emergencies this year, which have made it easier for permanent and temporary shelters to locate and expand in Salem.
Comments?

39
SUMMARY City of 10k about 25-30 minutes east of Salem by car. Low vacancy. Roughly 270 units permitted (80% SFR) to be constructed over next 1-5 years. One large employer, a meat packing plant, is closing, leaving 80k sf of industrial space unfilled. No other economic development activity. Not all residential lots shovel ready, and may require infrastructure.
County Marion
Timestamp 11/23/2020 11:09
Email Address [email protected]
Jurisdiction CIty of Silverton
Name and Title Jason Gottgetreu, Community Development Director
Observations about Population (e.g. birth rates, aging, immigration, racial and ethnic change)
Fairly steady
Observations about Housing (Vacancy rates, seasonal occupancy, demolitions, renovations)
Low vacancy, no demolitions the past two years
Planned Housing Developments or Group Quarters Facilities (including number of units, occupancy, and estimated year of completion)
3 subdivisions that have received PC approval but yet to be constructed representing 138 lots that will be completed in the next year or two. 1 PUD with 64 apartments, 30 SFA, and 40 SFD also approved to be completed in phases over the next 5 years.
Economic Development (e.g. new employers or facilities, including number of jobs and est. year of completion)
Large employer, BrucePac will be leaving town. No movement yet on filling the 80,000 sq. ft. facility
Infrastructure Projects (e.g. transportation and utilities)
Water Supply line upgrade in process
Other Factors Promoting Population or Housing Growth
Recent adoption of a Housing Needs Analysis
Other Factors Hindering Population or Housing Growth
Lack of available shovel ready lots

40
Other findings, including, if not discussed above: (a) Summary of current or proposed policies affecting growth in your jurisdiction. (b) Findings related to growth or population change from studies conducted in your jurisdiction. (c) The effects of wildfires or other disasters in your jurisdiction on housing, employment/economics, and infrastructure. (d) The effects of the COVID-19 pandemic and policy measures on employment and current and planned developments.
None of the above listed issues appear to be having an impact on housing development in Silverton
Comments?
41
SUMMARY City of 400 people, 15 minutes from Newberg and 20 minute from Wilsonville. Growth capacity limited due to water and sewer capacity. No housing or economic development activity.
County Marion
Timestamp 10/30/2020 11:19
Email Address [email protected]
Jurisdiction St. Paul, Oregon
Name and Title Petricia Wright, Recorder
Observations about Population (e.g. birth rates, aging, immigration, racial and ethnic change)
Observations about Housing (Vacancy rates, seasonal occupancy, demolitions, renovations)
It is about the same.
Planned Housing Developments or Group Quarters Facilities (including number of units, occupancy, and estimated year of completion)
none
Economic Development (e.g. new employers or facilities, including number of jobs and est. year of completion)
none
Infrastructure Projects (e.g. transportation and utilities)
Well project; Wilson St. drainage project
Other Factors Promoting Population or Housing Growth
none
Other Factors Hindering Population or Housing Growth
Water and sewer reserves are at full capacity with the current population.
42
Other findings, including, if not discussed above: (a) Summary of current or proposed policies affecting growth in your jurisdiction. (b) Findings related to growth or population change from studies conducted in your jurisdiction. (c) The effects of wildfires or other disasters in your jurisdiction on housing, employment/economics, and infrastructure. (d) The effects of the COVID-19 pandemic and policy measures on employment and current and planned developments.
The reduction of revenues due to the loss of employment associated with the COVID-19 pandemic and also the loss of revenues from event rentals of the Community Hall have reduced the City's working capital to fund our projects.
Comments?

43
SUMMARY See prior response for St. Paul. Same info.
County Marion
Timestamp 11/10/2020 9:34
Email Address [email protected]
Jurisdiction St Paul, Oregon
Name and Title Cherry Haas, Treasurer
Observations about Population (e.g. birth rates, aging, immigration, racial and ethnic change)
Stable, older population of 435 people
Observations about Housing (Vacancy rates, seasonal occupancy, demolitions, renovations)
Very limited new housing stock until new well is drilled.
Planned Housing Developments or Group Quarters Facilities (including number of units, occupancy, and estimated year of completion)
none
Economic Development (e.g. new employers or facilities, including number of jobs and est. year of completion)
none
Infrastructure Projects (e.g. transportation and utilities)
water and sewer utility owned by the city. Electricity by PGE
Other Factors Promoting Population or Housing Growth
none--no new housing allowed at present
Other Factors Hindering Population or Housing Growth
water availability for new housing and new business is on hold

44
Other findings, including, if not discussed above: (a) Summary of current or proposed policies affecting growth in your jurisdiction. (b) Findings related to growth or population change from studies conducted in your jurisdiction. (c) The effects of wildfires or other disasters in your jurisdiction on housing, employment/economics, and infrastructure. (d) The effects of the COVID-19 pandemic and policy measures on employment and current and planned developments.
Comments?
45
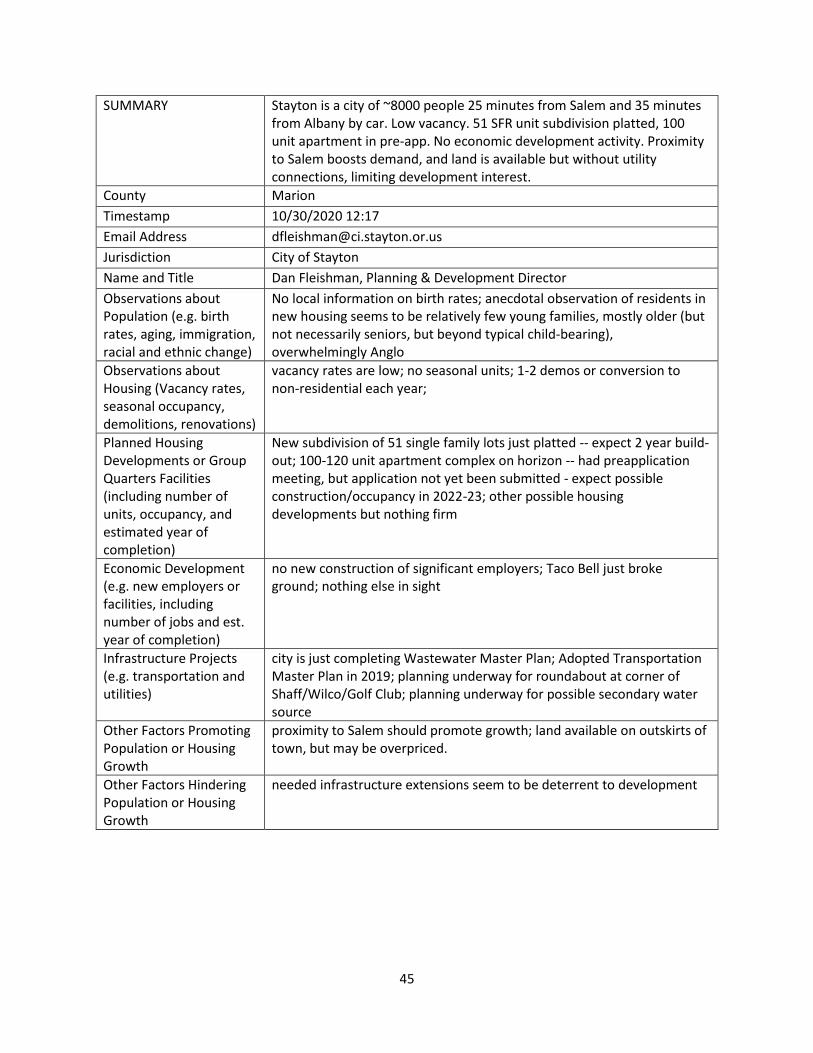
SUMMARY Stayton is a city of ~8000 people 25 minutes from Salem and 35 minutes from Albany by car. Low vacancy. 51 SFR unit subdivision platted, 100 unit apartment in pre-app. No economic development activity. Proximity to Salem boosts demand, and land is available but without utility connections, limiting development interest.
County Marion
Timestamp 10/30/2020 12:17
Email Address [email protected]
Jurisdiction City of Stayton
Name and Title Dan Fleishman, Planning & Development Director
Observations about Population (e.g. birth rates, aging, immigration, racial and ethnic change)
No local information on birth rates; anecdotal observation of residents in new housing seems to be relatively few young families, mostly older (but not necessarily seniors, but beyond typical child-bearing), overwhelmingly Anglo
Observations about Housing (Vacancy rates, seasonal occupancy, demolitions, renovations)
vacancy rates are low; no seasonal units; 1-2 demos or conversion to non-residential each year;
Planned Housing Developments or Group Quarters Facilities (including number of units, occupancy, and estimated year of completion)
New subdivision of 51 single family lots just platted -- expect 2 year build-out; 100-120 unit apartment complex on horizon -- had preapplication meeting, but application not yet been submitted - expect possible construction/occupancy in 2022-23; other possible housing developments but nothing firm
Economic Development (e.g. new employers or facilities, including number of jobs and est. year of completion)
no new construction of significant employers; Taco Bell just broke ground; nothing else in sight
Infrastructure Projects (e.g. transportation and utilities)
city is just completing Wastewater Master Plan; Adopted Transportation Master Plan in 2019; planning underway for roundabout at corner of Shaff/Wilco/Golf Club; planning underway for possible secondary water source
Other Factors Promoting Population or Housing Growth
proximity to Salem should promote growth; land available on outskirts of town, but may be overpriced.
Other Factors Hindering Population or Housing Growth
needed infrastructure extensions seem to be deterrent to development

46
Other findings, including, if not discussed above: (a) Summary of current or proposed policies affecting growth in your jurisdiction. (b) Findings related to growth or population change from studies conducted in your jurisdiction. (c) The effects of wildfires or other disasters in your jurisdiction on housing, employment/economics, and infrastructure. (d) The effects of the COVID-19 pandemic and policy measures on employment and current and planned developments.
(a) The planning commission is working on a set of code amendments to provide greater flexibility and innovation in residential development -- moving away from a minimum lot size/frontage-based regulation to a density-based regulation; unknown when it will be adopted; Sewer capacity could impact ability to develop in some areas. Storm water is an issue. (b) nothing (c) The Santiam Canyon wildfires could result in additional demand for housing in Stayton -- particularly temporarily (d) COVID seems to have slowed things down, but not killed projects. we've had a couple of new businesses start up since the pandemic struck. we've extended approval deadlines in reaction to the virus
Comments?
47
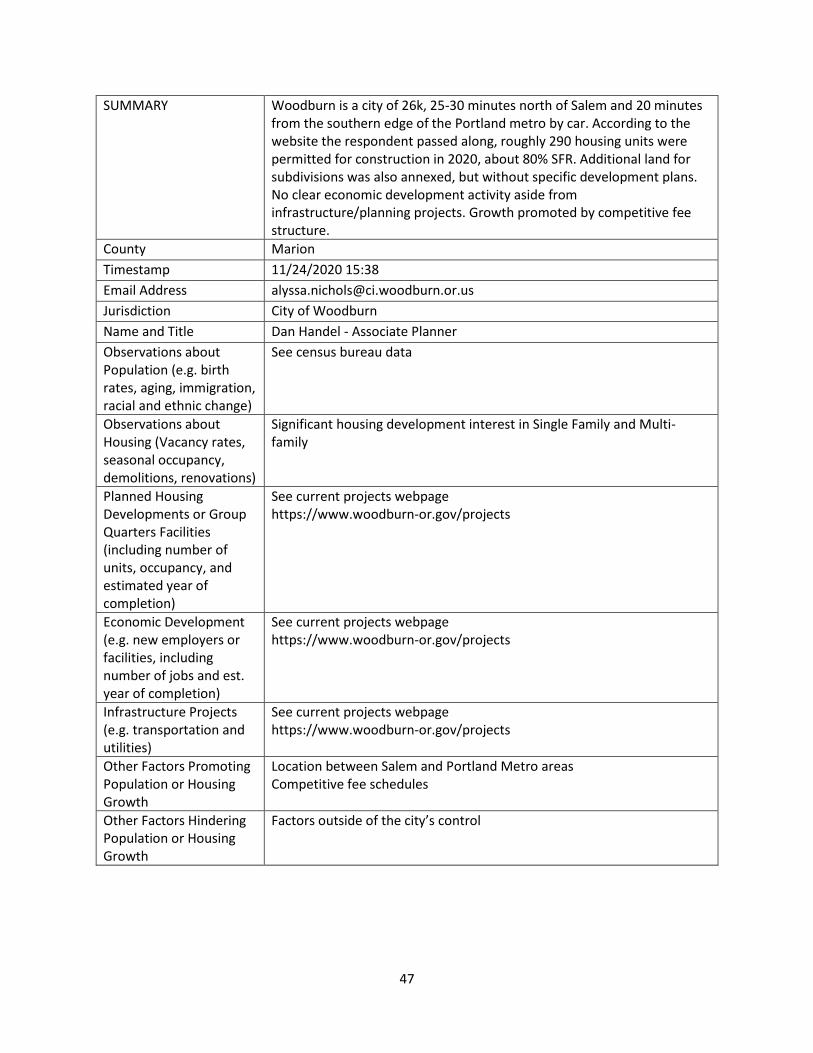
SUMMARY Woodburn is a city of 26k, 25-30 minutes north of Salem and 20 minutes from the southern edge of the Portland metro by car. According to the website the respondent passed along, roughly 290 housing units were permitted for construction in 2020, about 80% SFR. Additional land for subdivisions was also annexed, but without specific development plans. No clear economic development activity aside from infrastructure/planning projects. Growth promoted by competitive fee structure.
County Marion
Timestamp 11/24/2020 15:38
Email Address [email protected]
Jurisdiction City of Woodburn
Name and Title Dan Handel - Associate Planner
Observations about Population (e.g. birth rates, aging, immigration, racial and ethnic change)
See census bureau data
Observations about Housing (Vacancy rates, seasonal occupancy, demolitions, renovations)
Significant housing development interest in Single Family and Multi-family
Planned Housing Developments or Group Quarters Facilities (including number of units, occupancy, and estimated year of completion)
See current projects webpage https://www.woodburn-or.gov/projects
Economic Development (e.g. new employers or facilities, including number of jobs and est. year of completion)
See current projects webpage https://www.woodburn-or.gov/projects
Infrastructure Projects (e.g. transportation and utilities)
See current projects webpage https://www.woodburn-or.gov/projects
Other Factors Promoting Population or Housing Growth
Location between Salem and Portland Metro areas Competitive fee schedules
Other Factors Hindering Population or Housing Growth
Factors outside of the city’s control
48
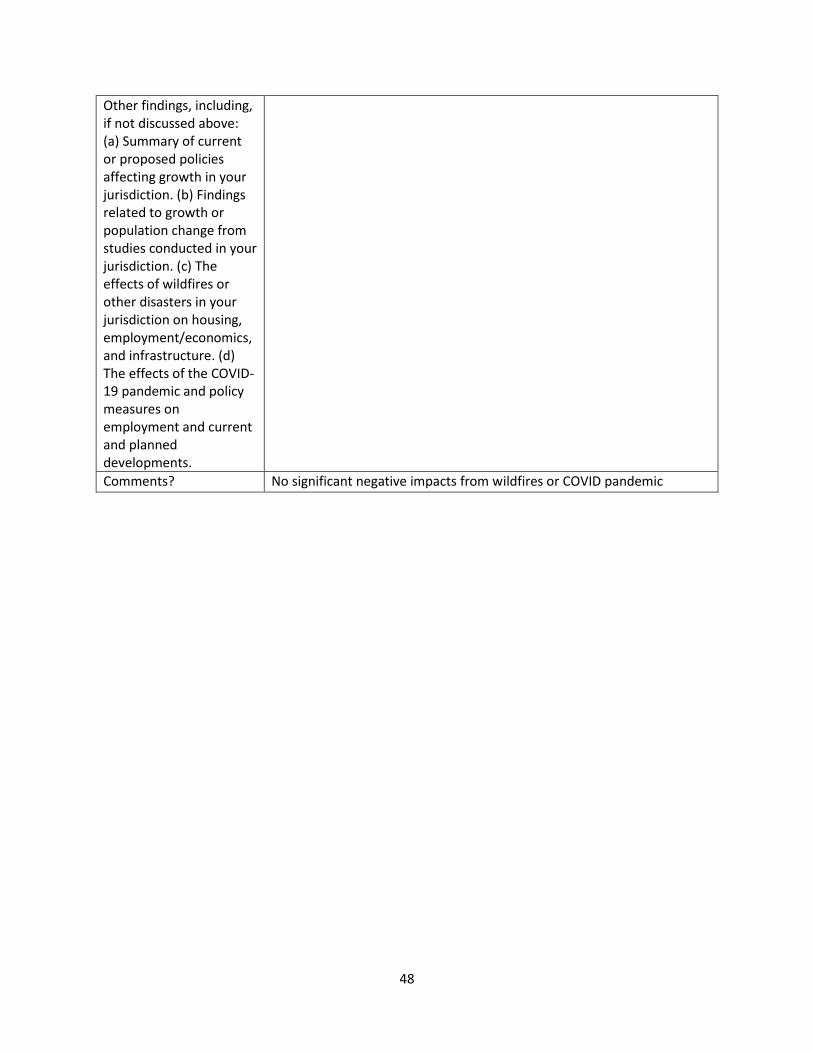
Other findings, including, if not discussed above: (a) Summary of current or proposed policies affecting growth in your jurisdiction. (b) Findings related to growth or population change from studies conducted in your jurisdiction. (c) The effects of wildfires or other disasters in your jurisdiction on housing, employment/economics, and infrastructure. (d) The effects of the COVID-19 pandemic and policy measures on employment and current and planned developments.
Comments? No significant negative impacts from wildfires or COVID pandemic
49
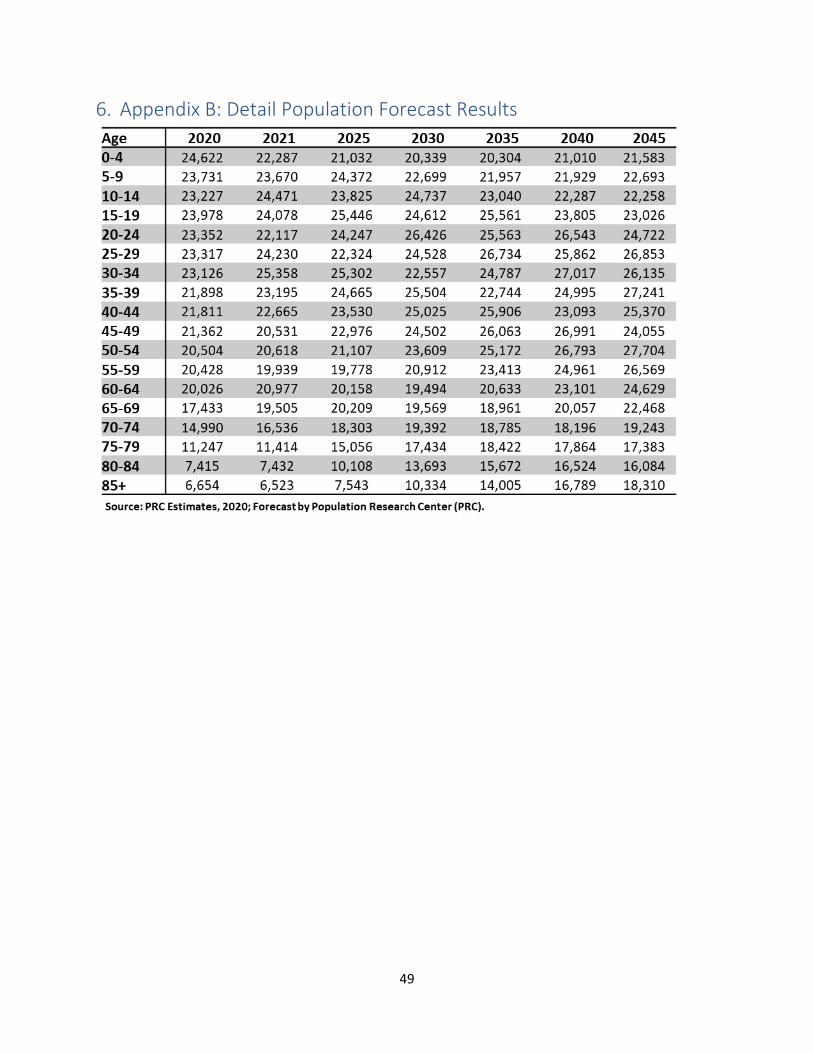
6. Appendix B: Detail Population Forecast Results
50
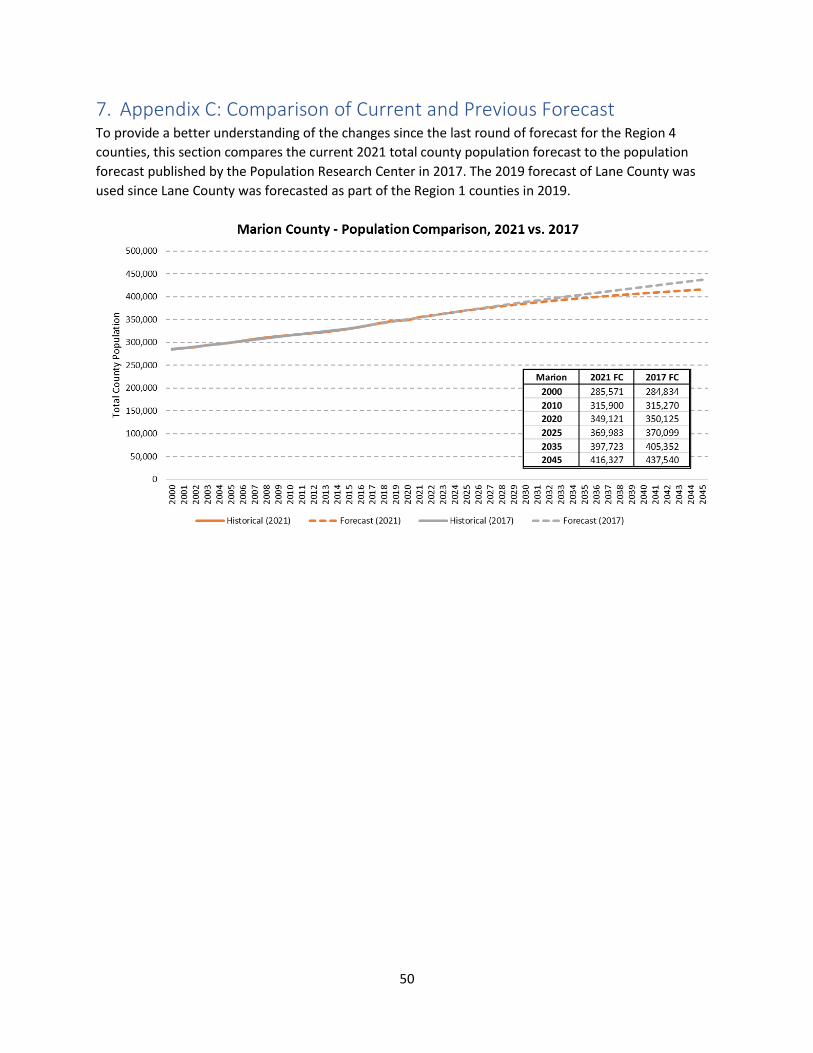
7. Appendix C: Comparison of Current and Previous Forecast To provide a better understanding of the changes since the last round of forecast for the Region 4
counties, this section compares the current 2021 total county population forecast to the population
forecast published by the Population Research Center in 2017. The 2019 forecast of Lane County was
used since Lane County was forecasted as part of the Region 1 counties in 2019.


