Page 1
Indonesia’sApproachinImprovingitsLivestockEmissionsInventory
Improving MRV for Agricultural Emission Reductions in the Livestock Sector7 November 2016
Dr.BessTiesnamurti
DirectorofIndonesianCentreforAnimalResearchandDevelopment
Page 2
I.ActivityData
II.ProgresstodateforLivestockEmissionfactorusingTier2
III.Coordinationofagencies
OUTLINEOFPRESENTATION
Page 3
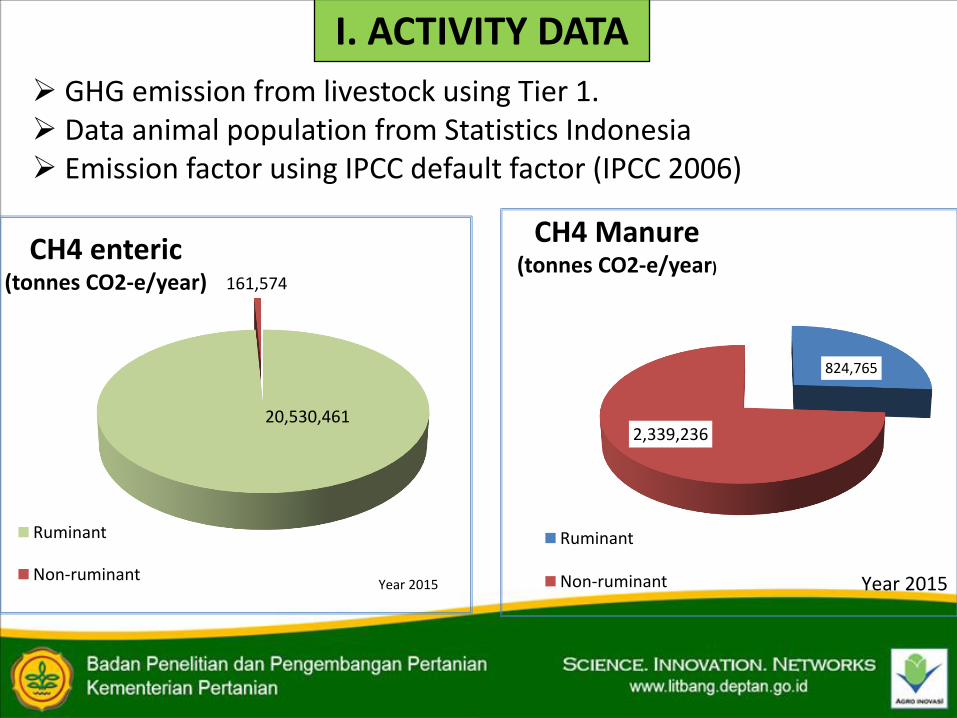
20,530,461
161,574
CH4enteric(tonnesCO2-e/year)
Ruminant
Non-ruminant Year2015
824,765
2,339,236
CH4Manure(tonnesCO2-e/year)
Ruminant
Non-ruminant Year2015
Ø GHG emission from livestock using Tier 1.Ø Data animal population from Statistics IndonesiaØ Emission factor using IPCC default factor (IPCC 2006)
I.ACTIVITYDATA
Page 4
14,535,549
644,343
1,689,660
1,957,200
1,541,925
161,784
beefcattle
dairycattle
sheep
goat
bufallo
horse
CH4enteric(tonnesCO2-e/year)
ContributionofmethaneamongruminantusingTier1
Page 5
0
10
20
30
40
50
60
Male Female Young(1year)
Indonesia
Malaysia
IPCCDefaultEmissionFactorforAsia
ActualcalculatedemissionfactorsforbeefcattleforIndonesiaandMalaysiarelativetothedefaultIPCCemissionfactors
(AdjustedTier1)
Page 6
II.ProgresstodateforLivestockEmissionfactorusingTier2
• TypeofLivestock• Subcategory
LivestockPopulation
• Typeofdiet• Feedconsumption
FeedIntake
• GE contentofdiet• proximate/Feedpedia
GrossEnergiIntake
MethaneConversionRatio • IPCC2006 guidance
StatisticsIndonesia,DirectoratGeneralofLivestockandAnimalHealth
ExperimentalResults
ExperimentalResults
DatausedtogetEmissionfactorsUsingTier2
=EmissionFactorLocalDatacombinedwithIPCC2006
Page 7
65%
4%
11%
9%
7% 4%
BEEFCATTLE
DAIRYCATTLE
BUFFALO
SHEEP
GOAT
HORSE
Contributionofmethanefromentericfermentationfromeachspeciesoflivestockinyear2014usingTier2
Page 8
0.000
0.200
0.400
0.600
0.800
1.000
1.200
1.400
1.600
1.800
2006 2007 2008 2009 2010 2011 2012 2013 2014
poultry
horse
swine
goat
sheep
buffalo
dairycattle
CH4from
Manure(CO2-eGg
/year)
Year
MethanefromManuremanagementinyear2014usingTier2
Page 9
0.000
0.500
1.000
1.500
2.000
2.500
3.000
3.500
4.000
4.500
2006 2007 2008 2009 2010 2011 2012 2013 2014
poultry
horse
swine
goat
sheep
buffalo
dairycattle
beefcattle
Year
N2Ofrom
manure(CO2-eGg
/year)
N2OfromManuremanagementinyear2014usingTier2
Page 10
0.000
5.000
10.000
15.000
20.000
25.000
30.000
2006 2007 2008 2009 2010 2011 2012 2013 2014Tier1 Tier2Year
TrendofCH4fromentericfermentationyear2006to2016(Tier1vsTier2)
0.000
0.500
1.000
1.500
2.000
2.500
3.000
3.500
4.000
2006 2007 2008 2009 2010 2011 2012 2013 2014
Tier1 Tier2YearCH
4from
manure(CO2-eGg
/year)
Page 11
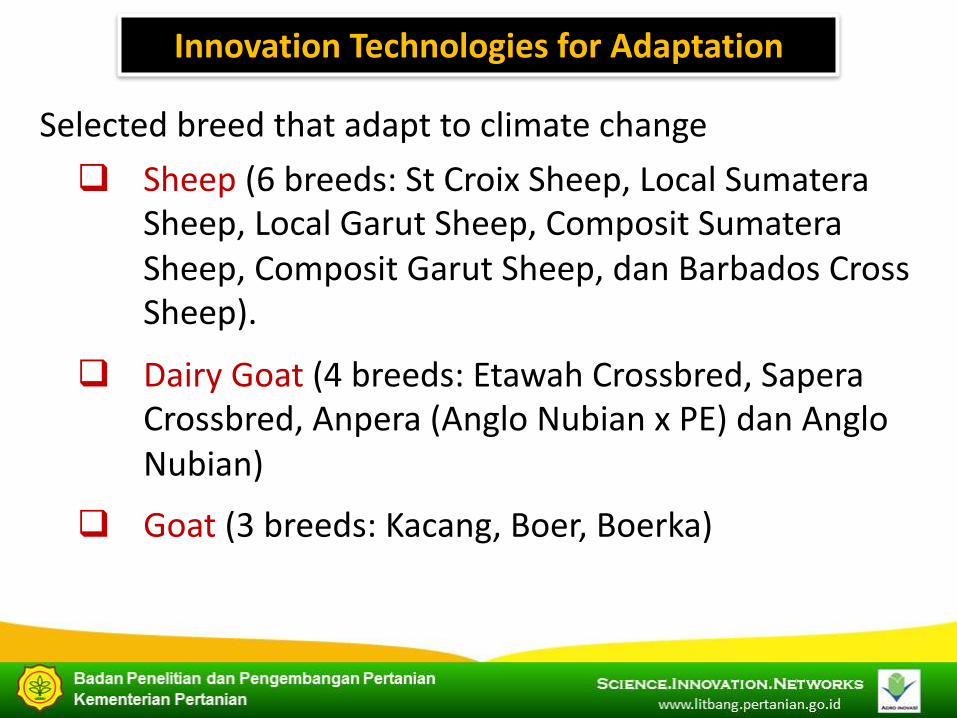
InnovationTechnologiesforAdaptation
Selectedbreedthatadapttoclimatechangeq Sheep(6breeds:StCroix Sheep,LocalSumatera
Sheep,LocalGarut Sheep,Composit SumateraSheep,Composit Garut Sheep,dan Barbados CrossSheep).
q DairyGoat(4breeds:EtawahCrossbred,SaperaCrossbred,Anpera(AngloNubian xPE) danAngloNubian)
q Goat(3breeds:Kacang, Boer,Boerka)
Page 12
MitigationTechnologiesforentericmethane
A.FeedProcessing :Ensilage,ammoniation,fermentation
B.FeedSupplement:Leguminouseleaves,balanceration
C.Feedadditives:1.Saponin(Lerak/Sapinduslerak)2.Tannin(Acasia,Calliandra)3.Probiotic(Acetoanaerobium noterae and A.woodii)4.Completerumenmodifier(CRM)
Page 13
NO Animal PARAMETER Results
1 Beefcattle 1) Averagedailygain 20%
2 Sheep2) Averagedailygain 40– 44%
Feed ConversionRatio 20%
CH4entericemmited 31%
ExtractsaponinfromSapindusrarak
1) Astuti et al.,2007.2) Amlius,2004
FeedAdditives
Page 14
NO Animal PARAMETER Methaneentericemmited
1 A. Wodii CH4fromenteric 9.4%
2 A.Wodii+saponin
CH4fromenteric 12.4%
3 A.Noterae CH4fromenteric 11.6%
4 A.Noterae +saponin
CH4fromenteric 19.1%
EffectofadditionofprobioticsAcetoanaerobium noterae andAcetoanaerobium woodii)onentericmethaneemmited
Amlius,2008
Page 15
NO PARAMETER RESULT
1 Average dailygain 30– 47%
2 FeedConversionRatio 18%
3 Feed efficiency 38%
4 CH4productionfromenteric 21– 40%
AdditionofCompleteRumenModifier(CRM) onsheep
Thalibetal.,2011
Page 16
0
5
10
15
20
25
30
35
40
2006 2007 2008 2009 2010 2011 2012 2013 2014 2015 2016 2017 2018 2019 2020
CH4Em
ission(m
illiontonn
esCO2-e/year
years
15%Reduction
Aftermitigationtecnologies
Estimationofmethanereductionaftertecnologiesmitigationwereapplied.
withoutmitigationtechnologies
Page 17
III.COORDINATIONAMONGAGENCIES
BAPPENAS(National Planning
Agency)
MINISTRY OF FORESTRY AND ENVIRONMENT
MINISTRY OF AGRICULTURE
LOCAL GOVERMENT
LIVESTOCK FARMERS EXTENTION
Coordinationtocollectdata
Page 18
InstitutionalArrangementforGHGInventoryinIndonesia
MoEF(DirectorateforGHGInventoryandMRV)
Source:NationalPlanningAgencyofIndonesia,2011
LocalEmissionFactorsfromResearch/UniversitiesForLivestok,Rice
Cultivation,Fertilizer
Page 19
…Indonesiacommitstoreduce(itsGHGemission)by26%fromBAUlevelby2030and41%withInternational assistance…
1.PresidentDecree61(2011):
2. NAP-GHG,2014
PresidentialRegulationNo.61Year2011:NAP-GHG(NationalActionPlanonGHGEmissionsReduction)
NAP-GHG:Dualapproachforallocatingmitigationefforts
SectoralAgriculture,forestry&landuse,energy,waste
RegionalDeveloplocal
mitigationactionplans(RegionalActionPlanonGHGEmissions
Reduction/RAP-GHG)atprovincialanddistrictlevel
INDONESIA’SPOLICIES TOSUPPORTACTIONPLANONCLIMATECHANGE