116
STYX AEE August 2012 Report No. 0878105590 - 087813714 APPENDIX L Styx River Ecology Survey Extension (Golder 2009c)

STYX AEE
August 2012
Report No. 0878105590 - 087813714
APPENDIX L Styx River Ecology Survey Extension (Golder 2009c)

November 2009
STYX INTEGRATED CATCHMENT MANAGEMENT PLAN
Styx River Ecology Survey Extension (Stage 2)
REPO
RT
Report Number: 087813714
Submitted to:Christchurch City Council
STYX ICMP ECOLOGY SURVEY (STAGE 2)
November 2009 Report No. 087813714
EXECUTIVE SUMMARY The Styx River is one of three main spring-fed river systems in Christchurch and is located on the northern urban edge of the city. Christchurch City Council is preparing an integrated catchment management plan (ICMP) for the Styx River. The Styx ICMP Area includes the Styx River and main tributaries, namely Smacks Creek and Kaputone Creek, as well as a number of smaller, natural and artificial waterways, and Wilson’s Drain. The purpose of this report is to contribute to the ICMP process by extending the previous ecological survey of the Belfast Area to the entire Styx ICMP Area and to describe the ecological values present in the waterways within this area. Landuse. The upper reaches of the Styx River, Kaputone Creek and Smacks Creek fall within the urban area of Belfast and adjoining suburbs. The lower reaches of Styx River and Kaputone Creek are within farmland and the majority of the Styx River Catchment is rural. River flows. The Styx River and major tributaries are spring-fed, although they also receive varying amounts of stormwater runoff following rainfall. There is a paucity of good hydrology data for the entire Styx ICMP Area due partly to weed growth and accumulation in the river channel affecting water level monitoring. Field survey. Twenty aquatic ecological sampling sites were selected following consultation with CCC from the Styx River and Wilson Drain catchment. Field surveys included collecting information on habitat, water quality macroinvertebrates and fish and were undertaken in April 2009. Habitat. Riparian vegetation was dominated by exotic species at most sites and was typical of other modified waterways in the Christchurch area. Stream shading was generally low, macrophyte cover was variable and periphyton cover was relatively minimal at most sampling sites. Most sites were dominated by run habitat and soft bed sediments. The drain sites were the poorest due to the lack of instream habitat diversity or cover features for sensitive macroinvertebrate taxa or fish. Overall, instream habitat (measured as total habitat scores) was better in the Styx River Catchment sites than in the Avon or Heathcote Rivers. Water quality. During the survey, water pH, electrical conductivity and temperature were similar at all sites but dissolved oxygen concentrations tended to be more variable and in some instances may be limiting aquatic life. Macroinvertebrates. Macroinvertebrate communities in the Styx River catchment are dominated by more pollution-tolerant taxa such as crustaceans, molluscs and oligochaetes (worms). These taxa are most often associated with waterways that have sluggish to moderate flow, soft silty beds and high macrophyte cover. Pollution sensitive mayflies and caddisflies were uncommon. Koura (freshwater crayfish), a threatened species, was present in the Styx River at Styx Mill Reserve. Indices of macroinvertebrate community health were typically highest in the upper Styx River. Fish. Eels and bullies are the most common and widespread fish present in the Styx River catchment. Sections of the Styx River, upstream of Main North Road and especially in the vicinity of Styx Mill Reserve provides habitat for trout spawning. Smacks Creek has also been identified as providing trout spawning habitat, and the lower section of the Styx River near Kainga Road provides habitat for Inanga spawning. Sites with high ecological value. The Styx River in the vicinity of the Styx Mill Reserve and Smacks Creek had predominately high aquatic ecological values due to relatively high macroinvertebrate taxa richness, moderate trout spawning habitat and high habitat scores compared to other Christchurch waterways. The Styx River at the Styx Mill Reserve also ranked relatively high due to the presence of Koura. Recommendations. Two objectives for catchment management for waterways within the Styx ICMP Area are recommended being:
Protect waterways of high ecological value (for example, Styx Mill Reserve)
Enhance waterways of moderate and low ecological value (especially upstream of the Styx Mill Reserve and Smacks Creek).
A range of established measures are available to achieve these objectives. Long-term monitoring of pressures on, and ecological state of, waterways in the Styx ICMP Area is recommended in conjunction with targeted monitoring of the implementation and efficacy of catchment management measures.

STYX ICMP ECOLOGY SURVEY (STAGE 2)
November 2009 Report No. 087813714 i
Table of Contents
EXECUTIVE SUMMARY.....................................................................................................................................................1 1.0 INTRODUCTION........................................................................................................................................................1
1.1 Background...................................................................................................................................................1 1.2 Objective .......................................................................................................................................................1 1.3 Report Scope ................................................................................................................................................1
2.0 CATCHMENT OVERVIEW.........................................................................................................................................3 2.1 Introduction ...................................................................................................................................................3 2.2 Catchment Landuse ......................................................................................................................................3 2.3 Catchment Imperviousness...........................................................................................................................5 2.4 River Flow .....................................................................................................................................................5
3.0 BACKGROUND ECOLOGY INFORMATION ............................................................................................................7 3.1 Overview .......................................................................................................................................................7 3.2 Monitoring programmes ................................................................................................................................7 3.2.1 Christchurch City Council ........................................................................................................................7 3.2.2 Environment Canterbury..........................................................................................................................7 3.2.3 Styx Living Laboratory Trust....................................................................................................................7 3.3 Investigations and surveys............................................................................................................................8 3.3.1 Boffa Miskell: Belfast Area Aquatic Ecology Study..................................................................................8 3.3.2 CREAS....................................................................................................................................................8 3.3.3 Trout and inanga spawning .....................................................................................................................8 3.3.4 Upper Kaputone Stream aquatic ecology................................................................................................8 3.4 Other Data Sources ......................................................................................................................................9
4.0 AQUATIC ECOLOGY FIELD PROGRAMME..........................................................................................................11 4.1 Introduction .................................................................................................................................................11 4.2 Sites ............................................................................................................................................................11 4.2.1 Selection rationale.................................................................................................................................11 4.2.2 Site descriptions ....................................................................................................................................15 4.3 Habitat characteristics.................................................................................................................................17 4.4 Macrophytes and periphyton.......................................................................................................................17 4.5 Benthic macroinvertebrates ........................................................................................................................18 4.6 Fish communities ........................................................................................................................................18 4.7 Water quality ...............................................................................................................................................19 4.8 Data Analyses.............................................................................................................................................19
5.0 RESULTS.................................................................................................................................................................19 5.1 Stream Habitat Sampling Results ...............................................................................................................19 5.2 Macrophytes and Periphyton Sampling results ...........................................................................................22 5.2.1 Relationships between variables ...........................................................................................................24

STYX ICMP ECOLOGY SURVEY (STAGE 2)
November 2009 Report No. 087813714 ii
5.3 Comparison with Other Studies ..................................................................................................................26 5.3.1 Styx River catchment.............................................................................................................................26 5.3.2 Other rivers in Christchurch...................................................................................................................26 5.4 Overview of Styx ICMP Area.......................................................................................................................27
6.0 BENTHIC MACROINVERTEBRATES.....................................................................................................................29 6.1 Introduction .................................................................................................................................................29 6.2 Sampling Results ........................................................................................................................................30 6.2.1 Taxa Richness.......................................................................................................................................30 6.2.2 Percent EPT Abundance .......................................................................................................................30 6.2.3 MCI and QMCI ......................................................................................................................................30 6.2.4 Effects of macrophyte removal on aquatic biota....................................................................................34 6.3 Relationship with instream habitat ..............................................................................................................37 6.4 Relationship with sediment quality ..............................................................................................................37 6.5 Comparison with Other Studies ..................................................................................................................38 6.5.1 Styx River Catchment............................................................................................................................38 6.5.1.1 Long term Environment Canterbury monitoring programme ..............................................................38 6.5.1.2 Other Studies .....................................................................................................................................39 6.5.2 Other Rivers in Christchurch .................................................................................................................40 6.6 Overview of Styx ICMP Area.......................................................................................................................41
7.0 FISH COMMUNITIES...............................................................................................................................................44 7.1 Sampling Results ........................................................................................................................................44 7.1.1 Styx River ..............................................................................................................................................44 7.1.2 Smacks Creek and Kaputone Stream ...................................................................................................44 7.1.3 Drain Sites.............................................................................................................................................45 7.2 Comparison with Other Studies ..................................................................................................................47 7.2.1 Styx River Catchment............................................................................................................................47 7.2.2 Other Rivers in Christchurch .................................................................................................................47 7.3 Overview of Styx ICMP Area.......................................................................................................................48 7.4 Trout Spawning...........................................................................................................................................51 7.5 Inanga Spawning ........................................................................................................................................51 7.6 Salmonid Habitat.........................................................................................................................................51
8.0 WATER QUALITY....................................................................................................................................................51 8.1 Sampling Results ........................................................................................................................................51 8.2 Overview of Styx ICMP Area.......................................................................................................................52
9.0 CHARACTERISATION, CATEGORISATION AND PRIORITISATION OF WATERWAYS.....................................53 9.1 Overview .....................................................................................................................................................53 9.2 Approach to ranking sites by aquatic ecological values ..............................................................................53 9.3 Aquatic Ecological Values...........................................................................................................................54 9.3.1 High Value Sites....................................................................................................................................54 9.3.2 Moderate Value Sites Site .....................................................................................................................55

STYX ICMP ECOLOGY SURVEY (STAGE 2)
November 2009 Report No. 087813714 iii
9.3.3 Low Value Sites.....................................................................................................................................55 10.0 RECOMMENDATIONS ............................................................................................................................................57
10.1 Catchment Management.............................................................................................................................57 10.1.1 Overview ...............................................................................................................................................57 10.1.2 Approach ...............................................................................................................................................57 10.1.3 Methods.................................................................................................................................................58 10.2 Monitoring Programme................................................................................................................................60
11.0 REFERENCES.........................................................................................................................................................61
TABLES Table 1: Percentage of the Styx River catchment area covered by different land cover types. ...........................................5 Table 2: Sites sampled within the Styx River catchment. ..................................................................................................12 Table 3: Golder Ecological Sampling Sites in April 2009. ..................................................................................................15 Table 4: Summary of periphyton categories used for field assessments. .......................................................................17 Table 5: MfE and WRRP periphyton maximum cover guidelines. .....................................................................................17 Table 6: Habitat characteristics at sites surveyed in April 2009.........................................................................................21 Table 7: Macrophyte cover (%) and dominant macrophytes recorded at sampling sites during the survey in April
2009..................................................................................................................................................................24 Table 8: Interpretation of MCI and QMCI values from stony riffles. ................................................................................30 Table 9: Macroinvertebrate index scores from sites sampled in April 2009. Mean (±1SE) index scores for
Canterbury lowland streams are also shown. ...................................................................................................33 Table 10: Number of fish recorded at the Styx River sampling sites in April 2009.............................................................44 Table 11: Number of fish recorded at Smack Creek (SC-prefix) and Kaputone Stream (KC-prefix) sites in April
2009..................................................................................................................................................................44 Table 12: Number of fish recorded at drain sites in April 2009. .........................................................................................45 Table 13: Number of fish records, and years recorded in the NZFFD from the Styx River and Kaputone Stream. ...........48 Table 14: Number of fish recorded from Kaputone Stream at sites sampled by Boffa Miskell (2007) and Golder in
2009..................................................................................................................................................................50 Table 15: Water quality parameters measured in the field during the site surveys in April 2009. ......................................52 Table 16: Framework for ranking ecological values in the Styx River catchment ..............................................................54 Table 17: A brief summary of measures for protecting and enhancing aquatic ecological values. ....................................58
FIGURES Figure 1: Styx ICMP Project Area........................................................................................................................................2 Figure 2: Land use on the Styx ICMP area..........................................................................................................................4 Figure 3: Water level in Styx River measured at Radcliffe Road (Data source Christchurch City Council). ........................6 Figure 4: Comparisons of flood flow in the Avon (mostly urban) and Styx River (mostly rural)............................................6 Figure 5: Belfast Area aquatic ecology sampling sites (Boffa 2007) and ECan monitoring sites. ......................................10 Figure 6: Aquatic ecology site selection rationale..............................................................................................................14 Figure 7: Aquatic ecology sampling sites. .........................................................................................................................16 Figure 8: Fine-mesh Gee minnow trap sitting in the water. ...............................................................................................18 Figure 9: Rhodes Drain (left), showing boxed sides in comparison to a more natural open channel in the Styx
River (right) April 2009......................................................................................................................................19 Figure 10: Composition of streambed sediments at survey sites in April 2009..................................................................22 Figure 11: Percentage of total habitat scores at each site recorded during the survey in April 2009. ...............................23
STYX ICMP ECOLOGY SURVEY (STAGE 2)
November 2009 Report No. 087813714 iv
Figure 12: Percentage of macrophyte cover recorded at sites sampled in April 2009. ......................................................25 Figure 13: Total stream habitat scores as recorded in the three brooks, N=North Brook, M=Middle Brook, and
S=South Brook sampling sites in 2008. ............................................................................................................27 Figure 14. Total stream habitat scores from selected Canterbury lowland streams. .........................................................27 Figure 15: Overview if the ICMP Area - Percent habitat scores.........................................................................................28 Figure 16: Freshwater crayfish (koura), similar to the one caught at Site SR3, April 2008................................................31 Figure 17: Macroinvertebrate Taxa Richness at Sites Sampled in April 2009. ..................................................................32 Figure 18: Percent relative abundance of major taxonomic groups recorded at sampling sites in April 2009. ..................34 Figure 19: QMCI-sb scores recorded at sampling sites in April 2009. ...............................................................................34 Figure 20: Mechanical macrophyte (aquatic plant) clearance in the Styx River (22 April 2009 (left)), and
macrophytes on the side of the bank at Site SR4 as seen during the current survey. ......................................35 Figure 21: QMCI-sb scores recorded at sites sampled within the Styx ICMP Project Area in 2009. .................................36 Figure 22: Relationship between the percent of fine bed substrates and MCI-sb scores (left), and %EPT (right).............37 Figure 23: Mean annual QMCI scores recorded from the Styx River at the Styx Mill Reserve (left) from 1999 to
2008, and from Kaputone Stream at Belfast Road (right) from 2002 to 2008. ..................................................38 Figure 25: Annual mean percent total habitat scores (left) at Styx Mill Reserve and reactive phosphorus (right) at
Claridges Road over time. ................................................................................................................................39 Figure 26: Overview of the Styx River ICMP area: EPT abundances................................................................................42 Figure 27: Overview of the Styx River ICMP area: QMCI-sb scores. ................................................................................43 Figure 28: One of the giant bullies caught in Spencerville Drain (Site D7) in April 2009. ..................................................45 Figure 29: Number of fish taxa recorded at sites within the Styx River ICMP Project area in April 2009...........................46 Figure 30: Styx River catchment Ecological Values in relation to designated business and residential development
areas.................................................................................................................................................................56
APPENDICES Appendix A Report Limitations Appendix B Site Selection Presentation to Christchurch City Council Appendix C Habitat Field Sheet Example Appendix D Photographs of Golder Aquatic Sampling Sites Appendix E Spearman Rank Correlation Results Appendix F Raw Macroinverterbrate Data

STYX ICMP ECOLOGY SURVEY (STAGE 2)
November 2009 Report No. 087813714 1
1.0 INTRODUCTION
1.1 Background Christchurch City Council (CCC) is developing an Integrated Catchment Management Plan (ICMP) for the Styx River and Wilsons Drain (Styx ICMP Area) catchments. This catchment includes the urbanised area of Belfast, for which an area plan is currently being developed. The ICMP process includes the review of existing information, gathering of information to fill identified gaps and assessment of information in terms of integrated catchment management and effects of urban development.
An aquatic ecological survey has been undertaken that concentrated on the Belfast Area Plan area (Boffa 2007). The purpose of the current ecology survey is to document the extension of the aquatic ecological assessment to cover the remainder of the Styx ICMP area, referred to as the Styx Ecology Extension.
1.2 Objective The objectives of the Styx Ecology Extension are to provide ecological information to guide surface water management and the selection of surface water treatment options in the Styx River catchment. The sampling and analysis methods used to deliver the Styx Ecology Extension information were, wherever possible, consistent with those used in the previous aquatic ecological survey of the Belfast Area Plan area to enable the results of both studies to be used to obtain a complete picture of the baseline and response of aquatic ecology within the Styx ICMP Area.
1.3 Report Scope Golder Associates (NZ) Limited (Golder) has been engaged by CCC to extend the aquatic ecological assessment of the Belfast Area Plan area to the remainder of the Styx ICMP Area. This report provides an ecological assessment of the waterways within the Styx ICMP Area with an emphasis on characterising, categorising and prioritising waterways for management. The report includes:
An explanation of site selection.
A detailed methodology of the field programme and analysis of results undertaken.
A summary of the ecological values associated with the waterways within the Styx ICMP Area.
Comment on the relationship between aquatic ecology and environmental variables (e.g., habitat quality and degree of urban development); and
Recommendations for further monitoring.
Recommendations for catchment management in order to protect ecological values from the pressures of urbanisation.
The Styx ICMP Area includes the main tributaries of the Styx River, namely Smacks Creek and Kaputone Creek, as well as a number of smaller, natural and artificial waterways. The focus of the report is on ecological values. Thus, environmental variables such as river flows or water quality are discussed only as they relate to ecological values, but are not discussed in detail. Similarly, this report does not include detailed recommendations on urban stormwater design. This report is provided subject to the limitations in Appendix A.

Kaputone Stream
Smac
ks C
reek
Styx R
iver
Wils
ons
Dra
in
2468790
2468790
2478790
2478790
2488790
2488790 5744
290
5754
290
5754
290
¯In
form
atio
n co
ntai
ned
in th
is d
raw
ing
is th
e co
pyrig
ht o
f Gol
der A
ssoc
iate
s (N
Z) L
td. U
naut
horis
ed u
se o
r rep
rodu
ctio
n of
this
pla
n ei
ther
who
lly o
r in
part
with
out w
ritte
n pe
rmis
sion
infri
nges
cop
yrig
ht.
©
Gol
der A
ssoc
iate
s (N
Z) L
td.
STYX ICMP PROJECT AREA 1NOVEMBER 20090878103714PROJECT
TITLE
0 1 2 3 KilometresDatum: NZGD 1949Projection: New Zealand Map Grid
LegendStyx ICMP project area
Cranford Basin catchment (outside of Styx River catchment)
Sitelocation
K:\GIS\Projects-Numbered\2008\08781x\03xxx\0878103_714_CCC_StyxRiverICMP\MapDocuments\StyxEcologicalSurvey\Sept09\Fig01_StyxICMPLocationPlan.mxd

STYX ICMP ECOLOGY SURVEY (STAGE 2)
November 2009 Report No. 087813714 3
2.0 CATCHMENT OVERVIEW
2.1 Introduction The Styx River is one of the three main spring-fed rivers in Christchurch, and is located on the northern urban edge of the city. The Styx River is approximately 18 km long with a predominately low lying and relatively small catchment (55 km²). The Styx River originates in the Harewood area in the north of Christchurch City. The river meanders northwards through reserve, pasture, horticultural areas and residential developments before discharging into the sea via Brooklands Lagoon and the Waimakariri River. The principal tributaries of the Styx River are Smacks Creek and Kaputone Stream, which are also spring-fed waterways. There are also a number of other smaller waterways, both natural and constructed, which also drain into the Styx River. Kaputone Stream, the largest tributary of the Styx River is approximately 11 km long and has a catchment of 6.8 km², which includes a mixture of agriculture, residential, and industrial land use. Kaputone Stream has its head waters located west of State Highway 74, near Northwood and has previously been known to dry in these upper reaches. Smacks Creek is a much shorter waterway of approximately 2 km and has its source upstream of Wilkinsons Road. Wilsons Drain Catchment is a relatively small area to the north of the Styx River Catchment. Wilson Drain flows north from Belfast into the Otukaikino Creek. To avoid any confusion reference to the Styx River Catchment also includes the Wilson’s Drain Catchment, unless otherwise stated.
2.2 Catchment Landuse Land use within the Styx ICMP area ranges from urban to rural as determined by Renard et al. (2004) and shown in Figure 2. Overall the Styx River catchment is still largely a rural river, with 62% of the catchment classified as farming (Renard et al. 2004), and this is predominantly pasture but also forestry and agroforestry. Urban land use covers 34% (22% residential, 4% industrial, 4% amenity, 4% transport) of the catchment. The main urban areas are adjacent to Main North Road between Redwood and Belfast. New residential areas represent an increasing proportion of the total urban area, such as at the source of the Kaputone Stream in the north of the Styx Mill basin. Undeveloped and natural areas are extremely limited with only 3.6% of the catchment area remaining undeveloped. The undeveloped area is mainly on the banks of the Styx River and in the Styx Mill Basin Reserve. Grass and grass-like plants make up 48% of the vegetated areas within the Styx River catchment as shown in Figure 2. Unfenced pasture bordering the edge of the Styx River increases the risk of cattle access to the water and associated potential pollution (Renard et al. 2004). Forests and scrub are not well developed within the catchment and most of what is there is within Chaney’s plantation near the river mouth. A large part of the river is bounded on at least one side by willows. Only 3.6% of the catchment is covered by native trees and shrubs. Native vegetation is mostly found within reserves, or land managed by the CCC such as Styx Mill Reserve and Janet Stewart Reserve. It is likely that private gardens, street plantings and parks would also contain some indigenous vegetation. Waterways, within the urban areas are typically piped or are boxed drains such as Kruses Drain and those which are primarily rural are generally more open, such as the lower Styx River.

!
!
!
!
!
!
!
!!
!
!
!
!
!
!
!
!
!
!
!
Kaputone Stream
Smac
ks C
reek
D8
D7
D6
D5
D4
D3
D2
D1
KC4
KC3
KC2
KC1SC1
SR7
SR6
SR5
SR4SR3
SR2SR1
Styx River
Wils
ons
Drai
n
2468880
2468880
2478880
2478880
2488880
2488880 5743
800
5753
800
5753
800
¯In
form
atio
n co
ntai
ned
in th
is d
raw
ing
is th
e co
pyrig
ht o
f Gol
der A
ssoc
iate
s (N
Z) L
td. U
naut
horis
ed u
se o
r rep
rodu
ctio
n of
this
pla
n ei
ther
who
lly o
r in
part
with
out w
ritte
n pe
rmis
sion
infri
nges
cop
yrig
ht.
©
Gol
der A
ssoc
iate
s (N
Z) L
td.
LANDUSE ON THE STYX ICMP AREA. 2NOVEMBER 20090878103714PROJECT
TITLE
0 1 2 3 KilometresDatum: NZGD 1949Projection: New Zealand Map Grid
Legend! Ecological Survey Site
Styx ICMP project area
Cranford Basin catchment (outside of Styx River catchment)
K:\GIS\Projects-Numbered\2008\08781x\03xxx\0878103_714_CCC_StyxRiverICMP\MapDocuments\StyxEcologicalSurvey\Sept09\Fig02_Landuse.mxd

STYX ICMP ECOLOGY SURVEY (STAGE 2)
November 2009 Report No. 087813714 5
2.3 Catchment Imperviousness Impervious cover is the amount of roads, roofs, driveways and parking lots and is the most obvious feature of any urban area (Suren & Elliot 2004). In general, as the impervious area within a catchment increases, so does the adverse effect on aquatic biota (Schueler 1994; Arnold & Gibbons 1996). For example, Schueler et al. (1999) suggested that negative impacts of stormwater run-off for stream biota can occur with as little as 15% of the catchment in urban landuse (i.e., impervious surfaces). The area of imperviousness in relation to each sampling site was not known at the time of writing this report. However, broad scale land cover types for the Styx River catchment were obtained from Renard et al. (2004) and are shown in Table 1. Table 1: Percentage of the Styx River catchment area covered by different land cover types. Land Cover % Catchment Tree communities (>3 m tall) 22.9 Shrub communities (<3 m tall) 7.3 Fernland <0.1 Forb communities (non-graminoid herbs) 3.7 Grass/graminoid communities) 34.5 Semi-barren land (e.g. roads) 7.1 Buildings/built structures or surfaces 1.8 Residences (complex unit) 22.3 Water 0.4 Note: Source Renard et al 2004
2.4 River Flow Water levels are recorded at several locations along the Styx River. One of these locations includes a site at Radcliffe Road where water level is recorded in 15 minute intervals. The site is jointly operated by Environment Canterbury (ECan) and CCC and has been operational since 1992. The water level record for 2007-2008 is shown in Figure 3. Water levels in the Styx River are strongly affected by weed growth and accumulation in the river channel, particularly over the summer months. This can be clearly seen by the gradual increase in water levels between January and May 2007 before weed cutting dropped the water level significantly (Figure 3) (Golder 2009a). The Styx River is spring-fed and baseflow conditions tend to dominate. Short duration high flow events due to rainfall runoff occur periodically throughout the record. The July 2008 spike coincided with a 52 mm rainfall event (NIWA Cliflo Database Christchurch Airport site). One of the key effects of urban development on river flows is to reduce baseflows, reduce flood duration and increase the size of peak floods. These urban effects on river hydrology are caused by increased imperviousness, resulting in less groundwater recharge and more rapid surface runoff. Comparison of continuous flow monitoring data from the Avon and Styx Rivers in Christchurch illustrates the effect of urbanisation on river flows. Figure 4 shows that despite the two rivers having similar baseflow, rainfall events resulted in flood peaks of 2-4 times greater flow in the completely urbanised Avon River compared with the predominantly rural Styx River. Similarly, the rate of flow increase and decrease was considerably slower in the rural Styx River compared with the urban Avon River. Environment Canterbury is currently reviewing minimum flows for lowland tributaries of the Waimakariri River including the Styx River and Kaputone Creek. Golder has completed an ecology report making recommendations on this project although the environmental flows review process is still underway.

STYX ICMP ECOLOGY SURVEY (STAGE 2)
November 2009 Report No. 087813714 6
10.4
10.6
10.8
11.0
11.2
11.4
11.6
11.8
12.0Ja
n-07
Feb-
07M
ar-0
7A
pr-0
7M
ay-0
7Ju
n-07
Jul-0
7A
ug-0
7S
ep-0
7O
ct-0
7N
ov-0
7D
ec-0
7Ja
n-08
Feb-
08M
ar-0
8A
pr-0
8M
ay-0
8Ju
n-08
Jul-0
8A
ug-0
8S
ep-0
8O
ct-0
8N
ov-0
8D
ec-0
8
Wat
er L
evel
(m)
Note: Figure from Golder (2009a).
Figure 3: Water level in Styx River measured at Radcliffe Road (Data source Christchurch City Council).
0
5
10
15
20
25
29-J
ul-0
7 00
:00
29-J
ul-0
7 12
:00
30-J
ul-0
7 00
:00
30-J
ul-0
7 12
:00
31-J
ul-0
7 00
:00
31-J
ul-0
7 12
:00
01-A
ug-0
7 00
:00
01-A
ug-0
7 12
:00
02-A
ug-0
7 00
:00
02-A
ug-0
7 12
:00
03-A
ug-0
7 00
:00
03-A
ug-0
7 12
:00
04-A
ug-0
7 00
:00
04-A
ug-0
7 12
:00
05-A
ug-0
7 00
:00
05-A
ug-0
7 12
:00
06-A
ug-0
7 00
:00
Date and time
Flow
(m³/s
)
Avon River
Styx River
Note: Figure first shown in Golder (2008a). Data sourced from ECan.
Figure 4: Comparisons of flood flow in the Avon (mostly urban) and Styx River (mostly rural).

STYX ICMP ECOLOGY SURVEY (STAGE 2)
November 2009 Report No. 087813714 7
3.0 BACKGROUND ECOLOGY INFORMATION
3.1 Overview Waterways within the Styx ICMP Area have been the focus of a number of past environmental investigations, although historically the majority of work has focussed on the upper, more accessible reaches of the Styx River and Kaputone Stream. This section briefly summarises key information sources of relevance to the Styx ICMP Area. This information is referred to later in this report where relevant.
3.2 Monitoring programmes 3.2.1 Christchurch City Council The CCC in conjunction with ECan and the Avon-Heathcote Estuary Ihutai Trust have begun a long-term monitoring programme of aquatic macroinvertebrates and habitat within the city’s waterways. The habitat and macroinvertebrate monitoring programme will incorporate sampling of the Styx, Otukaikino, Avon, Heathcote and Halswell catchments every five years. As part of this initiative EOS Ecology (EOS) surveyed habitat and macroinvertebrates at 9 sites within the Styx River catchment in March 2008. Habitat variables such as substrate composition, organic material, depths, velocity, bank, and riparian information were accessed using similar measurements and categories to those in the Christchurch River Environment Assessment Survey (CREAS) criteria.
3.2.2 Environment Canterbury Environment Canterbury (ECan) has two sites in the Styx River catchment where macroinvertebrate communities and stream habitat are routinely monitored as part of an annual stream health monitoring programme (Figure 5). One site is in Kaputone Creek (Belfast Road) and the other is in the Styx River (Styx Mill Reserve). The sites are sampled approximately twice a year, usually in January and/or November. The monitoring data is used by ECan for regional scale reporting and was used to prepare the report titled Ecosystem health of Canterbury Rivers: Development and implementation of biotic and habitat assessment Methods 1999/2000 (Meredith et al. 2003). Macroinvertebrate health is assessed using a range of indices including the index of biotic integrity (IBI) which comprises five composition and tolerance metrics. Stream habitat assessment also occurs at these sites as part of the macroinvertebrate monitoring. ECan stream habitat monitoring measures catchment features, riparian and banks features, reach features and instream habitat quality features.
3.2.3 Styx Living Laboratory Trust A monitoring programme undertaken by the Styx Living Laboratory Trust (SLLT) collects data on macroinvertebrates, aquatic plants, streambed substrate, riparian vegetation and water velocity. Macroinvertebrate communities are sampled at six different sites within the Styx River catchment. The monitoring sites are located in the Styx River, Kaputone Stream and Smacks Creek and a control site is located in the Otukaikino River. Each site is surveyed twice a year; once in spring and once in summer. Macrophytes (aquatic plants) are monitored at ten sites located in the Styx River, Kaputone Stream, Smacks Creek and Mill Stream. Each site will be sampled twice a year, once in late spring (early December) and again in late summer (mid March) to coincide with active growth and flowering of macrophytes (van den Ende 2007). The results of SLLT’s monitoring have not yet been published.
STYX ICMP ECOLOGY SURVEY (STAGE 2)
November 2009 Report No. 087813714 8
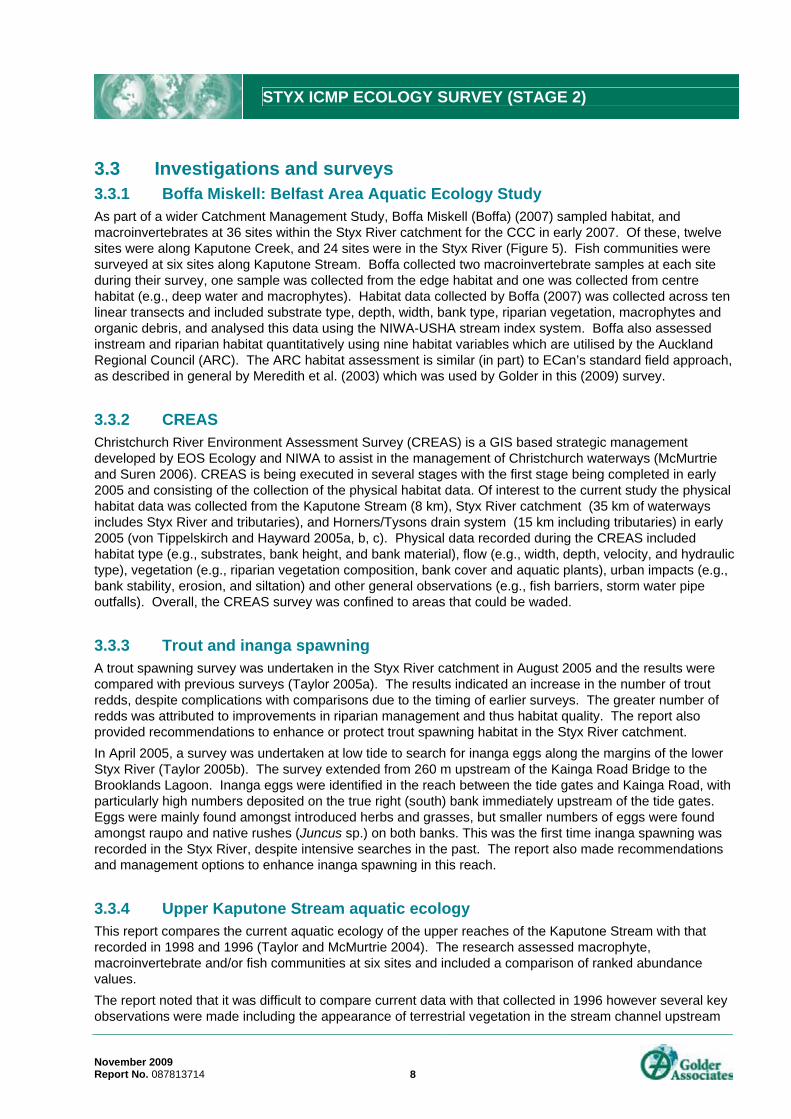
3.3 Investigations and surveys 3.3.1 Boffa Miskell: Belfast Area Aquatic Ecology Study As part of a wider Catchment Management Study, Boffa Miskell (Boffa) (2007) sampled habitat, and macroinvertebrates at 36 sites within the Styx River catchment for the CCC in early 2007. Of these, twelve sites were along Kaputone Creek, and 24 sites were in the Styx River (Figure 5). Fish communities were surveyed at six sites along Kaputone Stream. Boffa collected two macroinvertebrate samples at each site during their survey, one sample was collected from the edge habitat and one was collected from centre habitat (e.g., deep water and macrophytes). Habitat data collected by Boffa (2007) was collected across ten linear transects and included substrate type, depth, width, bank type, riparian vegetation, macrophytes and organic debris, and analysed this data using the NIWA-USHA stream index system. Boffa also assessed instream and riparian habitat quantitatively using nine habitat variables which are utilised by the Auckland Regional Council (ARC). The ARC habitat assessment is similar (in part) to ECan’s standard field approach, as described in general by Meredith et al. (2003) which was used by Golder in this (2009) survey.
3.3.2 CREAS Christchurch River Environment Assessment Survey (CREAS) is a GIS based strategic management developed by EOS Ecology and NIWA to assist in the management of Christchurch waterways (McMurtrie and Suren 2006). CREAS is being executed in several stages with the first stage being completed in early 2005 and consisting of the collection of the physical habitat data. Of interest to the current study the physical habitat data was collected from the Kaputone Stream (8 km), Styx River catchment (35 km of waterways includes Styx River and tributaries), and Horners/Tysons drain system (15 km including tributaries) in early 2005 (von Tippelskirch and Hayward 2005a, b, c). Physical data recorded during the CREAS included habitat type (e.g., substrates, bank height, and bank material), flow (e.g., width, depth, velocity, and hydraulic type), vegetation (e.g., riparian vegetation composition, bank cover and aquatic plants), urban impacts (e.g., bank stability, erosion, and siltation) and other general observations (e.g., fish barriers, storm water pipe outfalls). Overall, the CREAS survey was confined to areas that could be waded.
3.3.3 Trout and inanga spawning A trout spawning survey was undertaken in the Styx River catchment in August 2005 and the results were compared with previous surveys (Taylor 2005a). The results indicated an increase in the number of trout redds, despite complications with comparisons due to the timing of earlier surveys. The greater number of redds was attributed to improvements in riparian management and thus habitat quality. The report also provided recommendations to enhance or protect trout spawning habitat in the Styx River catchment. In April 2005, a survey was undertaken at low tide to search for inanga eggs along the margins of the lower Styx River (Taylor 2005b). The survey extended from 260 m upstream of the Kainga Road Bridge to the Brooklands Lagoon. Inanga eggs were identified in the reach between the tide gates and Kainga Road, with particularly high numbers deposited on the true right (south) bank immediately upstream of the tide gates. Eggs were mainly found amongst introduced herbs and grasses, but smaller numbers of eggs were found amongst raupo and native rushes (Juncus sp.) on both banks. This was the first time inanga spawning was recorded in the Styx River, despite intensive searches in the past. The report also made recommendations and management options to enhance inanga spawning in this reach.
3.3.4 Upper Kaputone Stream aquatic ecology This report compares the current aquatic ecology of the upper reaches of the Kaputone Stream with that recorded in 1998 and 1996 (Taylor and McMurtrie 2004). The research assessed macrophyte, macroinvertebrate and/or fish communities at six sites and included a comparison of ranked abundance values. The report noted that it was difficult to compare current data with that collected in 1996 however several key observations were made including the appearance of terrestrial vegetation in the stream channel upstream

STYX ICMP ECOLOGY SURVEY (STAGE 2)
November 2009 Report No. 087813714 9
of Main North Road bridge and an increase in abundance of species tolerant to periods of dewatering (e.g. increase in oligochaetes (worms) and crustaceans and a decrease in snails, bivalves and fly larvae abundance). At permanent water sites the communities were much the same as in 1996. There was a decrease in oligochaete abundance, disappearance of waterbugs, but an increase in crustaceans and the appearance of caddisflies and hydra. Only shortfin eels were found in the 2004 survey however upland bullies were found in a previous survey which was undertaken in 1996.
3.4 Other Data Sources The New Zealand Freshwater Fish Database (NZFFD) was used to search for fish species recorded in the Styx River catchment that may have not been recorded during the Golder (2009) survey. Langlands and Elley (2000) details salmonid distribution and habitat within the Styx River catchment.

"
"
"
"
"
"
"
!!
!
!
!
(
(
#
#
#
#
#
#D8
D7
D6
D5
D4
D3
D2
D1
KC4
KC3
KC2
KC1SC1
SR7
SR6
SR5
SR4SR3
SR2SR1
2469360
2469360
2474360
2474360
2479360
2479360
2484360
2484360
2489360
2489360 5744
290
5749
290
5749
290
5754
290
5754
290
¯In
form
atio
n co
ntai
ned
in th
is d
raw
ing
is th
e co
pyrig
ht o
f Gol
der A
ssoc
iate
s (N
Z) L
td. U
naut
horis
ed u
se o
r rep
rodu
ctio
n of
this
pla
n ei
ther
who
lly o
r in
part
with
out w
ritte
n pe
rmis
sion
infri
nges
cop
yrig
ht.
©
Gol
der A
ssoc
iate
s (N
Z) L
td.
AQUATIC ECOLOGY SAMPLING SITES APRIL 2009 5NOVEMBER 2009087813714PROJECT
TITLE
LegendEcological Survey Site
( DRY
# Drain
" Mainstem
! Tributary
Styx River catchment
Belfast Area Plan0 1 2 3 KilometersDatum: NZGD1949
Projection: New Zealand Map Grid
K:\GIS\Projects-Numbered\2008\08781x\03xxx\0878103_714_CCC_StyxRiverICMP\MapDocuments\StyxEcologicalSurvey\Sept09\Fig05_AquaticEcologySamplingSites.mxd
Kainga Drain
Kaputone StreamStyx River
Shepherd Drain
Wilsons Drain
Smacks Creek
Horners Drain Rhodes Drain
Spencerville Drain

STYX ICMP ECOLOGY SURVEY (STAGE 2)
November 2009 Report No. 087813714 11
4.0 AQUATIC ECOLOGY FIELD PROGRAMME
4.1 Introduction The current ecological survey has been designed to be consistent with surveys undertaken previously for South West Christchurch, the recent Boffa (2007) study, and ECan’s ecological monitoring in the Styx River, in order to allow comparable data to be collected. The focus of the field sampling programme was on collecting instream data that is representative of the range of habitats and ecological values in the catchment waterways, so that the data collected will form the basis of a robust stream classification. Data on habitat quality, physico-chemical water quality, macroinvertebrates and fish was collected by Golder at 18 sites over the week beginning 27 April 2009 in the Styx River ICMP Project Area.
4.2 Sites 4.2.1 Selection rationale The locations of the sampling sites were selected on the basis of the following three objectives:
To overlap with the sediment quality survey sample sites;
To allow comparison between different land uses; and
To geographically cover the project area. Several of the sites from the Boffa (2007) survey were included in the survey to allow better amalgamation of the two sets of survey data. The total number and location of sites were selected in consultation with CCC staff (see Appendix B). Sampling sites were preferentially located in areas where there is a lack of existing information and outside of waterways that have been surveyed as part of the CREAS programme (Figure 6). Consequently, many sampling sites were located in the Lower Styx River and its tributaries. Overall, sampling sites were selected to complement recent ecological monitoring by Boffa (2007), previous studies by Robb (1989), recent sediment quality monitoring by Golder Associates (2009a), as well as providing some overlap with long term CCC and ECan monitoring sites (Table 2).

STYX ICMP ECOLOGY SURVEY (STAGE 2)
November 2009 Report No. 087813714 12
Table 2: Sites sampled within the Styx River catchment.
Stream & Location Easting Northing Styx ICMP Sediment
Site
Robb (1988)
SedimentBoffa Site
WQ (CCC
or ECan)
ECan Inverte-brates
Ecology Site No.
Sediment Site No.
Surrounding landuse
Upstream landuse
Styx River Sawyers Arms Rd 2476501 5748493 SR1 12 Urban Rural Gardiners Rd 2476806 5748857 SR2 1 Rural Urban Styx Mill at Conservation Reserve 2477910 5749227 SR3 Rural Peri-urban
Immed. downstream Marshlands Rd 2482544 5749472 SR4 3 Rural Mix
Teapes Rd 2484011 5751263 SR5 14 Rural Mix Spencerville Rd 2484926 5753168 SR6 4 Rural Mix Kainga Rd 2484972 5756360 SR7 5 Rural Mix Tributaries Smacks Creek Wilkinsons Rd 2476841 5749546 SC1 Rural res. Rural res.
Kaputone Creek Blakes Rd 2480402 5749654 KC1 7 Urban Urban Belfast Rd (West) 2480848 5750517 KC2 15 Rural Urban Macdonalds Road 2482018 5751309 KC3 Rural Rural Belfast Rd (East) 2482191 5749891 KC4 8 Rural Mix Drain Sites Unnamed drain (248 Main North Rd) D1 9 Urban Urban
Kruses Drain D2 10 Urban Urban
STYX ICMP ECOLOGY SURVEY (STAGE 2)
November 2009 Report No. 087813714 13
Stream & Location Easting Northing Styx ICMP Sediment
Site
Robb (1988)
SedimentBoffa Site
WQ (CCC
or ECan)
ECan Inverte-brates
Ecology Site No.
Sediment Site No.
Surrounding landuse
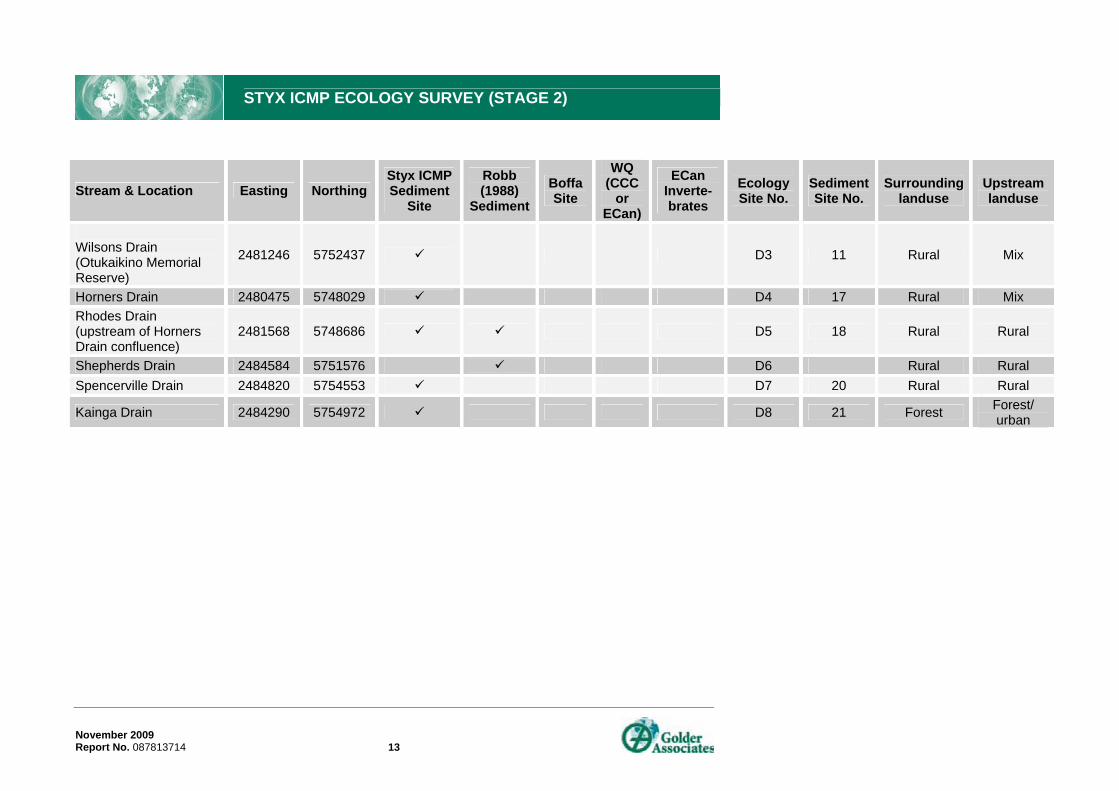
Upstream landuse
Wilsons Drain (Otukaikino Memorial Reserve)
2481246 5752437 D3 11 Rural Mix
Horners Drain 2480475 5748029 D4 17 Rural Mix Rhodes Drain (upstream of Horners Drain confluence)
2481568 5748686 D5 18 Rural Rural
Shepherds Drain 2484584 5751576 D6 Rural Rural Spencerville Drain 2484820 5754553 D7 20 Rural Rural
Kainga Drain 2484290 5754972 D8 21 Forest Forest/ urban

SR1
SR2
D3
KC3
KC1
KC2
SR3SC1
D2
D4
D5
D1
SR4
SR5
SR6
SR7
D6
D7
D8
KC4
6PROJECT | 087813714TITLE | AQUATIC ECOLOGY SITE SELECTION RATIONALE.
Info
rmat
ion
cont
aine
d in
this
dra
win
g is
the
copy
right
of G
olde
r Ass
ocia
tes
(NZ)
Ltd
. Una
utho
rised
use
or r
epro
duct
ion
of th
is p
lan
eith
er w
holly
or i
n pa
rt w
ithou
t writ
ten
perm
issi
on in
fring
es c
opyr
ight
.
© G
olde
r Ass
ocia
tes
(NZ)
Ltd
.
Datum: NZMG 1949 Projection: New Zealand Map Grid
Legend
Overlapped Information
Styx River catchment
Belfast Area Plan
Proposed ecological survey site
Styx ICMP Sediment Site
Robb (1988) Sediment
Boffa Site
WQ (CCC or ECan)
ECan Invertebrates
0 1 2 3
Kilometers
NOVEMBER 2009
K:\Graphics\Projects-numbered\2008\08781x\03xxx\087813714_CCC_StyxRiver_ICMP_Chch\nov09
STYX ICMP ECOLOGY SURVEY (STAGE 2)
November 2009 Report No. 087813714 15
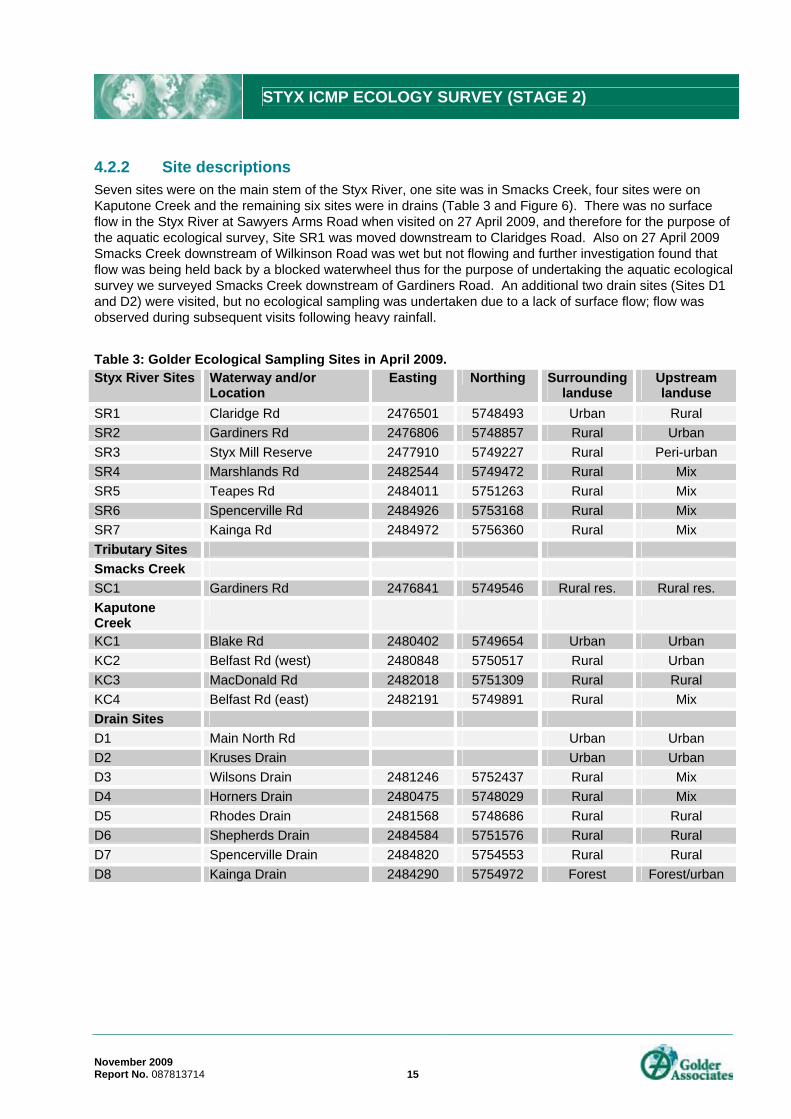
4.2.2 Site descriptions Seven sites were on the main stem of the Styx River, one site was in Smacks Creek, four sites were on Kaputone Creek and the remaining six sites were in drains (Table 3 and Figure 6). There was no surface flow in the Styx River at Sawyers Arms Road when visited on 27 April 2009, and therefore for the purpose of the aquatic ecological survey, Site SR1 was moved downstream to Claridges Road. Also on 27 April 2009 Smacks Creek downstream of Wilkinson Road was wet but not flowing and further investigation found that flow was being held back by a blocked waterwheel thus for the purpose of undertaking the aquatic ecological survey we surveyed Smacks Creek downstream of Gardiners Road. An additional two drain sites (Sites D1 and D2) were visited, but no ecological sampling was undertaken due to a lack of surface flow; flow was observed during subsequent visits following heavy rainfall. Table 3: Golder Ecological Sampling Sites in April 2009. Styx River Sites Waterway and/or
Location Easting Northing Surrounding
landuse Upstream landuse
SR1 Claridge Rd 2476501 5748493 Urban Rural SR2 Gardiners Rd 2476806 5748857 Rural Urban SR3 Styx Mill Reserve 2477910 5749227 Rural Peri-urban SR4 Marshlands Rd 2482544 5749472 Rural Mix SR5 Teapes Rd 2484011 5751263 Rural Mix SR6 Spencerville Rd 2484926 5753168 Rural Mix SR7 Kainga Rd 2484972 5756360 Rural Mix Tributary Sites Smacks Creek SC1 Gardiners Rd 2476841 5749546 Rural res. Rural res. Kaputone Creek
KC1 Blake Rd 2480402 5749654 Urban Urban KC2 Belfast Rd (west) 2480848 5750517 Rural Urban KC3 MacDonald Rd 2482018 5751309 Rural Rural KC4 Belfast Rd (east) 2482191 5749891 Rural Mix Drain Sites D1 Main North Rd Urban Urban D2 Kruses Drain Urban Urban D3 Wilsons Drain 2481246 5752437 Rural Mix D4 Horners Drain 2480475 5748029 Rural Mix D5 Rhodes Drain 2481568 5748686 Rural Rural D6 Shepherds Drain 2484584 5751576 Rural Rural D7 Spencerville Drain 2484820 5754553 Rural Rural D8 Kainga Drain 2484290 5754972 Forest Forest/urban

"
"
"
"
"
"
"
!!
!
!
!
(
(
#
#
#
#
#
#D8
D7
D6
D5
D4
D3
D2
D1
KC4
KC3
KC2
KC1SC1
SR7
SR6
SR5
SR4SR3
SR2SR1
2469360
2469360
2474360
2474360
2479360
2479360
2484360
2484360
2489360
2489360 5744
290
5749
290
5749
290
5754
290
5754
290
¯In
form
atio
n co
ntai
ned
in th
is d
raw
ing
is th
e co
pyrig
ht o
f Gol
der A
ssoc
iate
s (N
Z) L
td. U
naut
horis
ed u
se o
r rep
rodu
ctio
n of
this
pla
n ei
ther
who
lly o
r in
part
with
out w
ritte
n pe
rmis
sion
infri
nges
cop
yrig
ht.
©
Gol
der A
ssoc
iate
s (N
Z) L
td.
AQUATIC ECOLOGY SAMPLING SITES 7NOVEMBER 2009087813714PROJECT
TITLE
LegendEcological Survey Site
( DRY
# Drain
" Mainstem
! Tributary
Styx River catchment0 1 2 3 KilometersDatum: NZGD1949
Projection: New Zealand Map Grid
K:\GIS\Projects-Numbered\2008\08781x\03xxx\0878103_714_CCC_StyxRiverICMP\MapDocuments\StyxEcologicalSurvey\Sept09\Fig07b_AquaticEcologySamplingSites.mxd
Kainga Drain
Kaputone Stream
Styx RiverShepherd Drain
Wilsons Drain
Smacks Creek
Horners Drain
Rhodes Drain
Spencerville Drain

STYX ICMP ECOLOGY SURVEY (STAGE 2)
November 2009 Report No. 087813714 17
4.3 Habitat characteristics Instream and riparian habitat quality was assessed quantitatively using ECan’s standard field approach, as described in general by Meredith et al. (2003), with updated assessment criteria from ECan (Pers. Com., Shirley Hayward, ECan water quality scientist) (see Appendix C) . Briefly, the ECan habitat assessment approach involves scoring various habitat attributes (e.g., riparian vegetation cover, bank stability, fine sediment deposition), then summing the scores to provide an overall habitat score for each site. This method was used in preference to other approaches, such as the Urban Stream Habitat Assessment (USHA) methods used by Boffa (2007), or the Christchurch River Environment Assessment Survey (CREAS) methods, as the ECan method allows for data to be compared against a regional dataset, if desired. For completeness, in addition to the ECan habitat data, the following data was also assessed visually: percent stream shade; streambed sediment composition (e.g., silt, gravel, cobble); and water velocity information was collected at most sites (using a timed float).
4.4 Macrophytes and periphyton A visual qualitative assessment of the percentage of streambed periphyton coverage and composition was made at each site, using the periphyton groups outlined in Biggs and Kilroy (2000). A summary of the periphyton groups used for field assessments is given in Table 4. Table 4: Summary of periphyton categories used for field assessments.
Periphyton Group Colour
Thin mat/film Green
(<0.5 mm thick) Light brown
Black/dark brown Medium mat Green
(0.5 - 3 mm thick) Light brown
Black/dark brown Thick mat Green/light brown
(>3 mm thick) Black/dark brown Filaments, short Green
(<20 mm long) Brown/reddish Filaments, long Green
(>20 mm long) Brown/reddish
Notes: After Biggs and Kilroy (2000).
Percent cover for thick mats and long filaments were compared to the periphyton standards in the Waimakariri River Regional Plan (WRRP) (ECan 2004), and the Ministry for the Environment (MfE) periphyton guidelines Biggs (2000). Guideline values for total periphyton coverage are shown in Table 5. Table 5: MfE and WRRP periphyton maximum cover guidelines.
Instream value Diatoms (>3 mm thick)
Filamentous algae (>20 mm long)
MfE 60%a 30%a, b
WRRPc 40% 40% Note: a Aesthetics/recreation (period 1 November - 30 April), bTrout angling, c Water being water managed for drinking water for animals, fisheries, fish spawning, aquatic ecosystems, public health, and aesthetic purposes.

STYX ICMP ECOLOGY SURVEY (STAGE 2)
November 2009 Report No. 087813714 18
Notes on macrophyte species and streambed coverage were also made at each site. Macrophyte cover at each site was compared to the Proposed Natural Resource Regional Plan (PNRRP) standards for lowland streams which state that emergent macrophytes shall not cover 50 percent of the water surface of the wetted channel.
4.5 Benthic macroinvertebrates Benthic macroinvertebrates were collected using Protocol C2 the semi-quantitative protocol for sampling soft bottom streams of Stark et al. (2001). Briefly, this involved sampling available habitats in proportion to their presence in each stream reach (streambed and macrophytes) using a kick net (500µm mesh size) over an area of approximately 1 m², and in water depths up to around 0.6 m deep. This sampling method varied from that used by Boffa (2007) where two macroinvertebrate samples were collected per site: one in edge habitat, the other in mid-stream. Macroinvertebrate samples were preserved in 70% ethanol, and macroinvertebrates visible to the naked eye were identified to the taxonomic level recommended in Stark et al. (2001) for the calculation of Macroinvertebrate Community Index (MCI) scores using keys of Winterbourn et al. (2006). A fixed 200-count method with a scan for rare taxa was used (Protocol P2 of Stark et al. 2001). This method has been shown to provide accurate assessments of water quality in lowland streams elsewhere in New Zealand (Duggan et al. 2002).
4.6 Fish communities Fish communities were sampled using one or more of the following methods:
Electric fishing.
Gee minnow traps.
Fyke nets. Electro-fishing was employed at sites that were sufficiently shallow and macrophyte-free, which is consistent with the South West Christchurch and Boffa (2007) approaches. In the lower Styx River (where water depth is greater than 0.6 m) and in a number of smaller tributaries (with dense macrophyte cover) Fyke nets (the same as those used by commercial eel fishermen) and Gee minnow traps (for catching smaller fish, such as bullies and inanga) were used (e.g., Figure 8). Two marmite baited Fyke nets and five Gee minnow trap was deployed at each sampling site, left overnight and cleared the next day. Gee minnow traps were set on the stream bed in the vicinity of the Fyke nets. Fine mesh (<3 mm mesh) Gee minnow traps were used, as they have been found to be more effective in catching small fish than conventional, coarse mesh traps. All captured fish were placed in holding buckets, identified and released back into the waterway. It is worth noting that it may not have been the optimal period for capturing fish due to the time of the year (April).
Figure 8: Fine-mesh Gee minnow trap sitting in the water.

STYX ICMP ECOLOGY SURVEY (STAGE 2)
November 2009 Report No. 087813714 19
4.7 Water quality Dissolved oxygen (DO), temperature, pH and conductivity were measured at each site, on each occasion using calibrated hand-held meters. Water quality data was collected to assist with ecological data interpretation and to provide consistency with the Boffa (2007) data. Golder also did not collect water for analysis as part of this ecological study as it was outside the scope.
4.8 Data Analyses Spearman rank correlations (rs) were used to explore relationships between a range of environmental and biological parameters. There are a very limited number of sites in the Styx River catchment where both the collection of ecological data and water quality data are paired and thus the relationship between water quality and benthic macroinvertebrate communities within the Styx River catchment can not be easily investigated. The only site that is known to have both long term macroinvertebrates and water quality data is on Kaputone Stream (Site KC2). There is one water quality site on the Styx River at Claridges Road which is approximately 1 km upstream from the Styx Mill Reserve and the ECan macroinvertebrate monitoring site. For the purpose of the current report these two latter sites have been paired to allow investigation of the possible relationship between water quality and macroinvertebrates. It should be noted that any review of existing water quality data collected by ECan or CCC in relation to macroinvertebrate data has been limited to a very brief commentary on the information presented in Main (2008), which is a recognised support document to the Styx ICMP, and water quality data from ECan long-term monitoring sites.
5.0 RESULTS 5.1 Stream Habitat Sampling Results In general, the average width of the Styx River sampling sites increased with distance downstream (e.g., <2m at Site SR1 and 12 m at Site SR7), and average water depths were variable but also increased with distance downstream (Table 6). The average depth ranged from 0.15 m at Site SC1 to >1 m at two of the Styx River sites (Table 6). The drain sites, in general, were the narrowest and this is likely to be an artefact of their man-made, often boxed nature (e.g., see Figure 9). Almost all sampling sites had flowing water of slow to moderate velocities and were dominated by run habitat during the survey. Site D6 on Shepherds Drain was not flowing during the survey.
Figure 9: Rhodes Drain (left), showing boxed sides in comparison to a more natural open channel in the Styx River (right) April 2009.

STYX ICMP ECOLOGY SURVEY (STAGE 2)
November 2009 Report No. 087813714 20
A few of the sampling sites had a range of mixed sized gravel sediments that could provide good quality habitat for macroinvertebrates and potentially spawning habitat for trout (e.g., Site SR3 and Site SC1) (Figure 10). However, overall the majority of sampling sites were dominated by soft bed sediments with 14 sites having >50% cover of fine sediment. It is likely that a number of stream sites, especially in the upper reaches of the Styx River and Kaputone Creek, would have been dominated by hard bed substrates which are indicated by a few short sections of waterway with coarser bed substrates. Channel banks were moderately stable with only small areas of slumping or erosion at the majority of sites sampled. Kaputone Stream, overall, had the greatest amount bank erosion which was especially evident at Site KC2 where stock had access to the stream and there were areas of extensive pugging. There was also evidence that either horses and/or stock grazed in the paddock adjacent to Site KC3 and several unfenced sections would allow access of the animals down to the water. Stock access can be a source of deposited and suspended sediment to a waterway. Riparian vegetation was generally characteristic of modified waterways and was dominated by exotic grasses and shrubs (e.g., gorse (Ulex europaeus)) and willows (Salix spp.) at most sites. There was little or no native vegetation present at the majority of sites with the exception of Site SR3 at Styx Mill Reserve, Site SC1, on Smacks Creek and Site D3, on Wilsons Drain (which runs along and through the Otukaikino Reserve) which had a mix of natives such as Carex sp. (native grasses), Cordyline sp. (cabbage trees), and broadleafs (Griselinia littoralis). Stream shading (includes bank, overhanging vegetation and overhead shading) at the sampling sites was low (on average 18% shade) and ranged from 0% shade to 60% shade (Table 6). The percentage of the total habitat scores ranged from 41% at Site D4 to 69% at Site SR3 (Figure 11). Overall, the drain sites had the lowest habitat scores which were associated with the relatively poor riparian cover and minimal instream heterogeneity and aquatic habitat. Site SR3, on the Styx River and Site SC1 on Smacks Creek had the highest overall habitat scores (Figure 11). Photographs taken during the field surveys at each sampling site are shown in Appendix D.

STYX ICMP ECOLOGY SURVEY (STAGE 2)
November 2009 Report No. 087813714 21
Table 6: Habitat characteristics at sites surveyed in April 2009.
Styx River
Average width (m)
Average depth
(m) Velocity
(m/s)
Average height to Bank fall
(m) Flow types
(%) Shading
(%) FGA (%)* SR1 1.75 0.55 NM 2 Run (100%) 40 5 SR2 3 0.7 NM 6 Run (100%) 5 0 SR3 3 0.4 0.38 1.5 Run (95%),
Pool (5%) 10 5
SR4 8 0.7 0.31 0.25 Run (100%) 0 0 SR5 10 1 0.61 0.6 Run (100%) 0 15 SR6 10 1.2 0.16 1.5 Run (100%) 10 0 SR7 12 1.2 NM 0.4 Run (75%),
Pool (25%) 10 0
Smacks Creek
SC1 1.75 0.15 0.37 0.3 Run (70%), Pool (30%)
20 0
Kaputone Creek
KC1 2.5 0.6 NM 0.4 Run (60%), Pool (40%)
60 0
KC2 3.5 0.5 0.16 0.1 Run (60%), Pool (40%)
40 0
KC3 2.5 0.6 0.37 0.05 Run (80%), Pool (20%)
15 0
KC4 8 0.6 0.17 0.05 Run (100%) 15 0 Drains D3 2 0.6 0.4 Run (100%) 10 0 D4 3 0.3 0.22 0.8 Run (100%) 0 0 D5 1.3 0.45 0.31 1.4 Run (100%) 60 0 D6 3 1 0.00 0.8 Run (100%) 10 50 D7 2 1 NM 0.8 Run (100%) 10 0 D8 4 0.45 0.11 1.5 Run (100%) 10 25 Note: NM = not measured. *FGA=Streambed coverage with filamentous green algae (>2 cm long).

STYX ICMP ECOLOGY SURVEY (STAGE 2)
November 2009 Report No. 087813714 22
0
20
40
60
80
100S
R1
SR
2
SR
3
SR
4
SR
5
SR
6
SR
7
SC
1
KC
1
KC
2
KC
3
KC
4
D3
D4
D5
D6
D7
D8
Site
% C
ompo
sitio
n
<2 mm2-8 mm8-16 mm16-32 mm32-64 mm64-128 mm128-256 mmWood
Figure 10: Composition of streambed sediments at survey sites in April 2009.
5.2 Macrophytes and Periphyton Sampling results Macrophyte cover ranged from 0% cover at Site KC1 and Site D4 to 70% cover at Site SR5 (Table 7 and Figure 12). Watercress (Rorippa spp), oxygen weed (Elodea spp) (introduced), curly pond weed (Potamogeton crispus) (introduced), Lemna minor (native) and Nitella spp (native) were more common amongst sites (Table 7). Mechanical weed clearance was occurring around the time of the current survey and was most obvious at Site SR4 in the Styx River where there were piles of macrophytes along the stream banks. Evidence of macrophyte clearance, like that observed at Site SR4, was not observed at any of the other sites during the survey. Emergent macrophytes did not exceed the PNRRP standard of 50 percent cover of the water surface of the wetted channel at any of the sites. The mechanical removal of macrophytes from waterways can have an adverse effect on aquatic organisms and is discussed in more detail below in Section 6. Overall, periphyton cover was minimal at most sampling sites. Thick diatom mats (>3 mm) were not recorded at any of the sites, and nuisance growths (>30% cover) of long filamentous algae (>2 mm) were only recorded at Site D6 (Table 6). Greater periphyton cover is often associated with factors such as elevated nutrient concentrations, little shading, slower water velocities, and infrequent floods.

D4
D5
D8
D7
D6
D3
KC4
KC3
KC2
KC1SC1
SR7
SR6
SR5
SR4SR3
SR2SR1
2469360
2469360
2474360
2474360
2479360
2479360
2484360
2484360
2489360
2489360 5744
290
5749
290
5749
290
5754
290
5754
290
¯In
form
atio
n co
ntai
ned
in th
is d
raw
ing
is th
e co
pyrig
ht o
f Gol
der A
ssoc
iate
s (N
Z) L
td. U
naut
horis
ed u
se o
r rep
rodu
ctio
n of
this
pla
n ei
ther
who
lly o
r in
part
with
out w
ritte
n pe
rmis
sion
infri
nges
cop
yrig
ht.
©
Gol
der A
ssoc
iate
s (N
Z) L
td.
PERCENTAGE OF TOTAL HABITAT SCORES AT EACHSITE RECORDED DURING THE SURVEY IN APRIL 2009 11NOVEMBER 2009
087813714PROJECT
TITLE
Legend40% - 50%
50% - 60%
60% - 70%
Styx River catchment0 1 2 3 KilometersDatum: NZGD1949
Projection: New Zealand Map Grid
K:\GIS\Projects-Numbered\2008\08781x\03xxx\0878103_714_CCC_StyxRiverICMP\MapDocuments\StyxEcologicalSurvey\Sept09\Fig11_TotalHabitatScores.mxd
Kainga Drain
Kaputone Stream
Styx RiverShepherd Drain
Wilsons Drain
Smacks Creek
Horners Drain
Rhodes Drain
Spencerville Drain
STYX ICMP ECOLOGY SURVEY (STAGE 2)
November 2009 Report No. 087813714 24
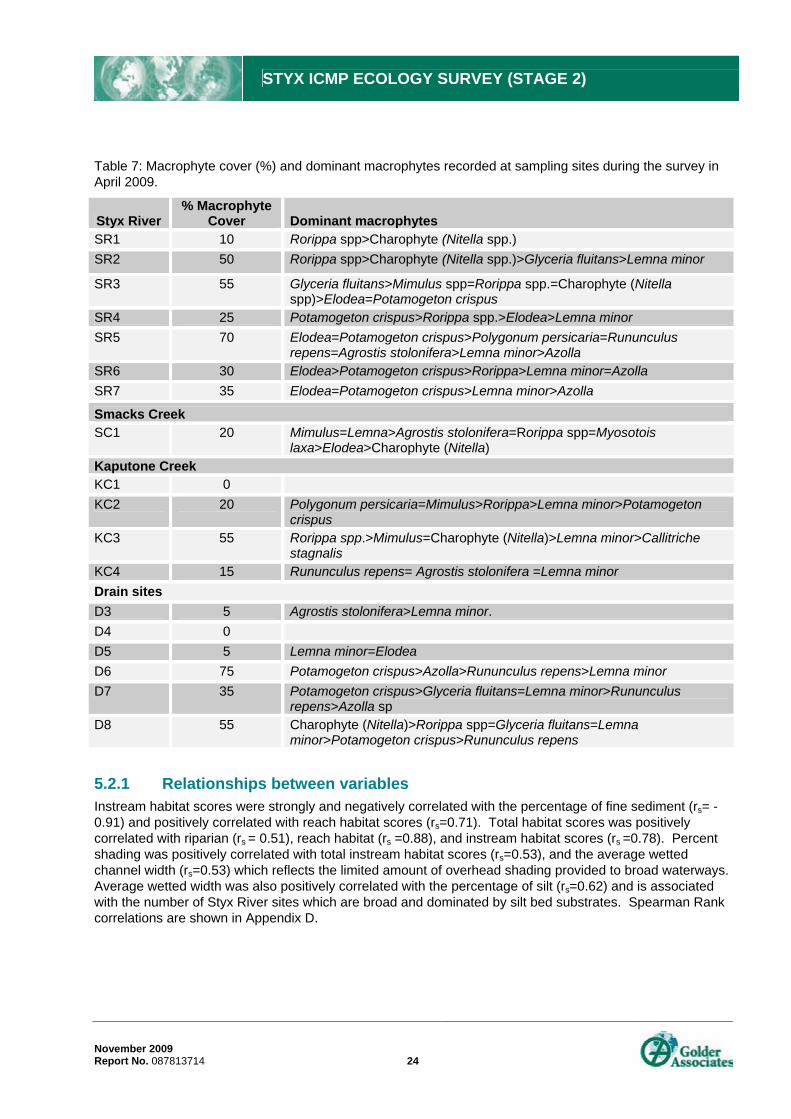
Table 7: Macrophyte cover (%) and dominant macrophytes recorded at sampling sites during the survey in April 2009.
Styx River % Macrophyte
Cover Dominant macrophytes SR1 10 Rorippa spp>Charophyte (Nitella spp.) SR2 50 Rorippa spp>Charophyte (Nitella spp.)>Glyceria fluitans>Lemna minor
SR3 55 Glyceria fluitans>Mimulus spp=Rorippa spp.=Charophyte (Nitella spp)>Elodea=Potamogeton crispus
SR4 25 Potamogeton crispus>Rorippa spp.>Elodea>Lemna minor SR5 70 Elodea=Potamogeton crispus>Polygonum persicaria=Rununculus
repens=Agrostis stolonifera>Lemna minor>Azolla SR6 30 Elodea>Potamogeton crispus>Rorippa>Lemna minor=Azolla SR7 35 Elodea=Potamogeton crispus>Lemna minor>Azolla
Smacks Creek SC1 20 Mimulus=Lemna>Agrostis stolonifera=Rorippa spp=Myosotois
laxa>Elodea>Charophyte (Nitella) Kaputone Creek KC1 0 KC2 20 Polygonum persicaria=Mimulus>Rorippa>Lemna minor>Potamogeton
crispus KC3 55 Rorippa spp.>Mimulus=Charophyte (Nitella)>Lemna minor>Callitriche
stagnalis KC4 15 Rununculus repens= Agrostis stolonifera =Lemna minor Drain sites D3 5 Agrostis stolonifera>Lemna minor. D4 0 D5 5 Lemna minor=Elodea D6 75 Potamogeton crispus>Azolla>Rununculus repens>Lemna minor D7 35 Potamogeton crispus>Glyceria fluitans=Lemna minor>Rununculus
repens>Azolla sp D8 55 Charophyte (Nitella)>Rorippa spp=Glyceria fluitans=Lemna
minor>Potamogeton crispus>Rununculus repens 5.2.1 Relationships between variables Instream habitat scores were strongly and negatively correlated with the percentage of fine sediment (rs= -0.91) and positively correlated with reach habitat scores (rs=0.71). Total habitat scores was positively correlated with riparian (rs = 0.51), reach habitat (rs =0.88), and instream habitat scores (rs =0.78). Percent shading was positively correlated with total instream habitat scores (rs=0.53), and the average wetted channel width (rs=0.53) which reflects the limited amount of overhead shading provided to broad waterways. Average wetted width was also positively correlated with the percentage of silt (rs=0.62) and is associated with the number of Styx River sites which are broad and dominated by silt bed substrates. Spearman Rank correlations are shown in Appendix D.

SR4
D5
D4
D8
D7
D6
D3
KC4
KC3
KC2
KC1SC1
SR7
SR6
SR5
SR4SR3
SR2SR1
2469360
2469360
2474360
2474360
2479360
2479360
2484360
2484360
2489360
2489360 5744
290
5749
290
5749
290
5754
290
5754
290
¯In
form
atio
n co
ntai
ned
in th
is d
raw
ing
is th
e co
pyrig
ht o
f Gol
der A
ssoc
iate
s (N
Z) L
td. U
naut
horis
ed u
se o
r rep
rodu
ctio
n of
this
pla
n ei
ther
who
lly o
r in
part
with
out w
ritte
n pe
rmis
sion
infri
nges
cop
yrig
ht.
©
Gol
der A
ssoc
iate
s (N
Z) L
td.
PERCENTAGE OF MACROPHYTE COVERRECORDED AT SITES SAMPLED IN APRIL 2009. 12NOVEMBER 2009
087813714PROJECT
TITLE
Legend> = 75%
50% - 75%
25% - 50%
10% - 25%
< 10%
Styx River catchment0 1 2 3 KilometersDatum: NZGD1949
Projection: New Zealand Map Grid
K:\GIS\Projects-Numbered\2008\08781x\03xxx\0878103_714_CCC_StyxRiverICMP\MapDocuments\StyxEcologicalSurvey\Sept09\Fig12_Macrophyte.mxd
Kainga Drain
Kaputone Stream
Styx River Shepherd Drain
Wilsons Drain
Smacks Creek
Horners Drain Rhodes Drain
Spencerville Drain

STYX ICMP ECOLOGY SURVEY (STAGE 2)
November 2009 Report No. 087813714 26
5.3 Comparison with Other Studies 5.3.1 Styx River catchment Habitat data collected for the CREAS survey and reported for sites within the Styx River catchment, including Kaputone Stream, Smacks Creek, and Horners Drain was similar to the instream and riparian habitat characteristics observed during the Golder 2009 survey (von Tippelskirch and Hayward 2005a, b, c). Notably, three of five rare native plants that were identified in north east Christchurch by von Tippelskirch and Hayward (2005c) were in the Styx Mill Reserve and these were Utricularia monanthos, Centella uniflora, and Carex buchananii. In 2007, a large scale survey of the macrophyte communities survey found that the macrophyte community within the Styx River catchment was very diverse with some macrophytes being much more abundant and widespread than others. For example, the macrophytes Azolla (native), Lemna minor, Mimulus guttatus (introduced), Rorippa nasturtium-aquatica (introduced), Glyceria fluitans (introduced), and Juncus articulatus were commonly encountered within the catchment and the majority of these were also observed during our survey. Interestingly, one native macrophyte species, Potamogeton ochreatus, which was not recorded in the Styx River catchment during past surveys, was found by van den Ende (2007) during his survey. Golder (2009b) analysed sediment texture at 13 of the 20 sites visited for the ecological survey (see Table 2) and found that many of the sites particularly within Smacks Creek and the drains, had a relatively high proportion of silt-sized particles. Their results support direct visual observations during the ecological survey that the majority of sampling sites were dominated by soft bed sediments.
5.3.2 Other rivers in Christchurch In a study of waterways in the south-west of Christchurch EOS Ecology et al. (2005) described the Heathcote River and Halswell Rivers as being primarily slow-flowing waterways, dominated run habitat and fine bed substrates. Common macrophyte species identified by EOS Ecology et al. (2005) during the survey of waterways in south-west Christchurch were similar to those recorded in the Styx River catchment and included Potamogeton crispus, Callitriche, Nitella and Lemna minor. Similar to sites within the Styx River catchment the dominant riparian vegetation at sites sampled by EOS Ecology et al. (2005) in the Heathcote River and Halswell River catchments was exotic grasses. Golder (2008a) scored habitat parameters using the same ECan method used in this study for the Styx River catchment at 17 sites from the Rangiora Three Brooks (South Brook, Middle Brook, and North Brook). Percent habitat scores for the three brooks are shown in Figure 13 and indicate that habitat scores ranged from 40% to 70%. Overall, habitat scores recorded at sites on the three brooks were higher than scores from the Styx River catchment, especially the drain sites. Meredith et al. (2003) collected quantitative habitat data from numerous streams in Canterbury, including two sites on the Styx River. Unfortunately, ECan’s methods for collecting habitat data have changed slightly since the original survey in 1999/2000, and therefore the summary data shown in Figure 14 should only be used as relative measures of habitat quality, and can not be directly compared with the recently collected data shown in Figure 14.

STYX ICMP ECOLOGY SURVEY (STAGE 2)
November 2009 Report No. 087813714 27
0
20
40
60
80
100
N1 N2 N3 N4 N5 N6 N7 N8 N9 M1 M2 M3 S1 S2 S3 S4 S5Site
Tota
l hab
itat s
core
(%)
Figure 13: Total stream habitat scores as recorded in the three brooks, N=North Brook, M=Middle Brook, and S=South Brook sampling sites in 2008.
0
10
20
30
40
50
60
Sou
th B
rook
Nor
th B
rook
Sty
x R
iver
(Sty
x M
ill)
Sty
x R
iver
(Rad
cliff
eR
d)
Hal
swel
lR
iver
Avo
n R
iver
Hea
thco
teR
iver
Low
land
refe
renc
e
Site
Tota
l hab
itat s
core
(%)
Notes: Data are from ECan and were collected in summer 1999. Lowland reference is the average of three reference sites. Figure
from Golder (2008a).
Figure 14. Total stream habitat scores from selected Canterbury lowland streams.
5.4 Overview of Styx ICMP Area Percent habitat scores for sites sampled along the Styx River and Kaputone Creek by Golder, this study, and Boffa (2007) are shown in Figure 15. These results indicate that overall the Styx River has higher habitat scores (i.e. habitat is of greater quality) then Kaputone Creek, or the drains and that overall stream habitat conditions in the Styx River catchment could be generally described as low to moderate.

2469360
2469360
2474360
2474360
2479360
2479360
2484360
2484360
2489360
2489360 5744
290
5749
290
5749
290
5754
290
5754
290
¯In
form
atio
n co
ntai
ned
in th
is d
raw
ing
is th
e co
pyrig
ht o
f Gol
der A
ssoc
iate
s (N
Z) L
td. U
naut
horis
ed u
se o
r rep
rodu
ctio
n of
this
pla
n ei
ther
who
lly o
r in
part
with
out w
ritte
n pe
rmis
sion
infri
nges
cop
yrig
ht.
©
Gol
der A
ssoc
iate
s (N
Z) L
td.
OVERVIEW OF THE ICMP AREA - PERCENT HABITAT SCORES 15NOVEMBER 2009087813714PROJECT
TITLE
Legend
Boffa (2007)30% - 50%
50% - 60%
60% - 70%
Golder (2009)30 - 50%
50 - 60%
60 - 70%
Styx River catchment
0 2 4 6 KilometresDatum: NZGD1949Projection: New Zealand Map Grid
K:\GIS\Projects-Numbered\2008\08781x\03xxx\0878103_714_CCC_StyxRiverICMP\MapDocuments\StyxEcologicalSurvey\Sept09\Fig15_PercentTotalHabitatScore.mxd
1. Topographic Image: Land information New Zealand 260 Series, Crown Copyright Reserved2. Total habitat scores displayed here are based on habitat scores recorded by Boffa (2007) (using ARC habitat parameters).To allow comparison between the Boffa and Golder dataset we have taken only a subset of the habitat parameters measuredby us to calculate the percent total habitat scores shown here.
Kainga Drain
Kaputone Stream
Styx River Shepherd Drain
Wilsons Drain
Smacks Creek
Horners DrainRhodes Drain
Spencerville Drain

STYX ICMP ECOLOGY SURVEY (STAGE 2)
November 2009 Report No. 087813714 29
6.0 BENTHIC MACROINVERTEBRATES 6.1 Introduction Benthic macroinvertebrates are organisms without backbones that live, on or within streambed sediments and aquatic macrophytes, in rivers and streams. Examples of macroinvertebrates found in rivers include insect larvae (e.g., mayflies, stoneflies, caddisflies, and beetles), aquatic oligochaetes (worms), snails and crustaceans (e.g., shrimps and crayfish). The macroinvertebrate community composition in a river will reflect not only the current but also past water and habitat conditions at any given site. This relationship is due to the importance of macroinvertebrates in processing food through the aquatic food chain, their relatively long life spans (between 3 months and 2 years) and their sedentary nature. Changes to a macroinvertebrate community caused by degradation (e.g., siltation, or organic pollution) may persist for some considerable time. The following section summarises the results of recent macroinvertebrate sampling undertaken by Golder in April 2009, describes the relationships between the macroinvertebrate data and other environmental variables and then compares the findings from April 2009 with those of previous studies. Raw macroinvertebrate data from this survey is shown in Appendix F.
The following indices were calculated to assess macroinvertebrate community health, habitat and water quality at each of the sites:
Taxa Richness: The total number of different taxa (families, genera, and species) recorded at each site. It is often reduced at impacted sites.
%EPT: The percentage of all individuals collected made up of pollution-sensitive Ephemeroptera (mayfly), Plecoptera (stonefly), and Trichoptera (caddisfly) taxa. %EPT is typically reduced at polluted sites.
EPT Taxa Richness: The total number of EPT taxa. EPT richness is typically more negatively affected by pollution than overall taxa richness. Relatively pollution-tolerant Oxyethira and Paraoxytheria caddisflies were excluded from both the %EPT, and EPT taxa richness indices.
MCI and QMCI: The Macroinvertebrate Community Index and the Quantitative MCI (Stark 1985). Macroinvertebrate taxa are assigned scores from 1 to 10 based on their tolerance to organic pollution. Highest scoring taxa (e.g., many EPT taxa) are the least tolerant to organic pollution. The MCI is based on presence-absence data: scores are summed for each taxon in a sample, divided by the total number of taxa collected, then multiplied by a scaling factor of 20. The QMCI requires either total counts or percentage abundance data: MCI scores are multiplied by abundance for each taxon, summed for each sample, and then divided by total macroinvertebrate abundance for each sample. The interpretation of MCI and QMCI values is outlined in Table 8.
MCI-sb and QMCI-sb: As above but macroinvertebrate tolerance values have been adjusted to improve the performance of MCI and QMCI scores in detecting degradation in streams dominated by soft bottoms (-sb) (Stark and Maxted 2007). Stark and Maxted (2007) note that in most cases MCI-sb tolerance values should be used on samples that are collected using the soft-bottomed protocols (e.g., Protocol C4 of Stark et al. 2001).
It should be noted that MCI scores were developed initially to detect organic pollution in hard bottom (or stony) streams (Stark 1985) and thus taxa (e.g., crustaceans, worms, and snails) that are typically associated with sluggish flow, soft bed sediments or high macrophyte abundance (all common characteristics of lowland streams) are actually regarded as indicators of degraded stream conditions by assigned MCI scores. We have included both hard bottom and soft bottom derived MCI scores however the majority of the sites sampled in this survey were primarily dominated by soft bed sediments. Notably, calculation of indices using both soft bottom and hard bottom scores derived similar results.

STYX ICMP ECOLOGY SURVEY (STAGE 2)
November 2009 Report No. 087813714 30
Table 8: Interpretation of MCI and QMCI values from stony riffles. Interpretation MCI QMCI
Clean water >120 >6.00
Doubtful quality or possible mild pollution 100-119 5.00-5.99
Probable moderate pollution 80-99 4.00-4.99
Probable severe pollution <80 <4.00
Notes: Sourced from Boothroyd and Stark (2000).
6.2 Sampling Results 6.2.1 Taxa Richness Overall, there were a total number of 39 taxa collected from the 18 sites sampled in April 2009. On average each site had 16 taxa, with the greatest taxa richness being recorded at Site SR7 and the lowest number of taxa being recorded at Site D5 (20 taxa and 9 taxa respectively) (Table 9; Figure 17). EPT taxa richness was greatest at the three upper Styx River sites (Site SR1 to SR3), and at Site SC1 where EPT taxa richness ranged from 7 to 9 EPT taxa (Table 9). There were no EPT taxa recorded at Site D7 and Site D8 (Table 9). Four taxa were found at all 18 sites, in varying abundances, during our survey and include ostracods, oligochaeta worms, fingernail clams (sphaeriidae), and orthoclad midge larvae. Amphipods were recorded at a total of 16 sites and were by far the most numerically abundant taxa recorded overall during the current survey. The mud snail Potamopyrgus antipodarum was also especially widespread and abundant being recorded at 15 sites and were especially dominant at Site D7 and Site D8 (Figure 18).
6.2.2 Percent EPT Abundance The average percentage of sensitive EPT (Ephemeroptera, Plecoptera, and Trichoptera) (%EPT) abundances at the 18 survey sites was 4%, with the greatest %EPT being recorded at Site SR3, and Site SC1 (20% EPT) (Table 9; Figure 18). Trichoptera (caddisflies) was the most diverse of the EPT groups with a total of 10 different pollution-sensitive caddisfly taxa being recorded. The most abundant of the sensitive caddisfly taxa was Hudsonema and Pycnocentria, which were especially abundant at Site SC1 and Site SR3, respectively. The common mayfly Deleatidium was the only mayfly taxa recorded during the survey and was found at a total of 4 survey sites but was 37 – 68 times more abundant at Site SR3 compared to the other three sites. There were no plecoptera (stoneflies) recorded at any of the sites during the survey (Figure 18).
6.2.3 MCI and QMCI MCI scores ranged from 42 at Site D8 (MCI-sb of 44.8) to a MCI score of 97.1 at Site SR1 (MCI-sb also 97.1) (Table 9). MCI scores at 11 sites were indicative of severe degradation in water and/or habitat quality (MCI<80), and MCI scores at 7 sites were indicative of moderate degradation. In comparison, MCI-sb scores indicate that 10 sites are below the 80 cut-off and MCI scores at the remaining 8 sites were indicative of moderate degradation. QMCI and QMCI-sb scores at sampling sites were on average very low (QMCI<4) and indicated a similar state in stream health as MCI scores (Table 9). QMCI scores ranged from 2.03 at Site D7 (QMCI-sb = 2.0) to a QMCI score of 4.95 at Site SR4 (QMCI-sb = 4.95). QMCI and QMCI-sb scores at 10 sites were indicative of severe degradation in habitat and/or water quality, and the remaining 8 sites had QMCI and QMCI-sb scores indicative of moderate degradation in habitat and water quality (Figure 19). Macroinvertebrate communities at all the sampling sites were characterised by taxa that are tolerant to a broad range of habitat conditions and water quality and this is reflected in the derived community health index scores. However, the Styx River sampling sites did generally have greater QMCI scores than the

STYX ICMP ECOLOGY SURVEY (STAGE 2)
November 2009 Report No. 087813714 31
majority of the drain, and Kaputone Stream sites (Table 9; Figure 19). Sites with QMCI greater than 4 were typically dominated by crustaceans (especially amphipods) and had greater abundances (albeit still relatively low) of sensitive EPT taxa compared to sites that were dominated by oligochaeta worms and molluscs (especially P. antipodarum and Physella) (Table 9; Figure 18). Notably, koura (freshwater crayfish) which is an iconic New Zealand macroinvertebrate species was identified at Site SR3 during the survey (e.g., see Figure 16). Due to their cryptic behaviour koura are often missed by standard macroinvertebrate sampling techniques but can often be found during electric fishing and it was during electric fishing that Koura was found. The presence of Koura in the Styx River is of ecological and conservation interest because they have been identified as threatened as their populations are in gradual decline nationally (Hitchmough et al. 2007). Furthermore, while koura may be abundant in rural streams, they are often absent from urban streams (Allibone et al. 2001), which suggests they are sensitive to urbanisation.
Figure 16: Freshwater crayfish (koura), similar to the one caught at Site SR3, April 2009.
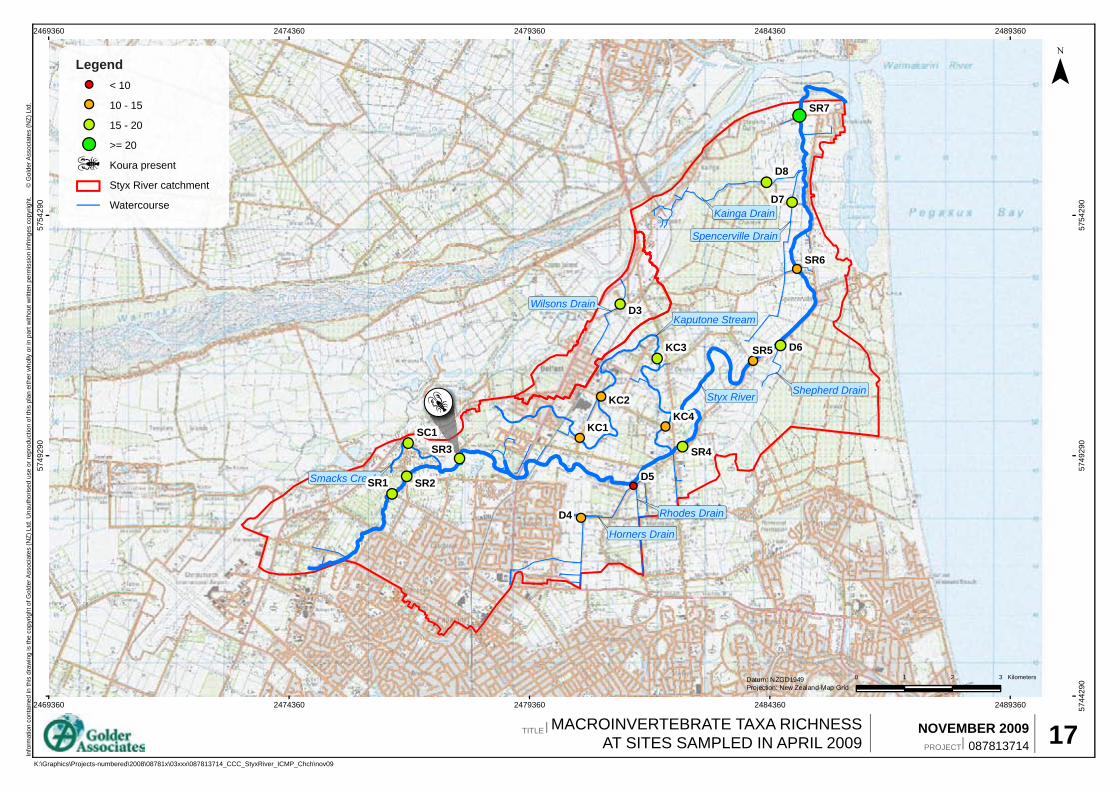
2469360
2469360
2474360
2474360
2479360
2479360
2484360
2484360
2489360
2489360 5744
290
5749
290
5749
290
5754
290
5754
290
Kainga Drain
Kaputone Stream
Styx River Shepherd Drain
Wilsons Drain
Smacks Creek
Horners Drain
Rhodes Drain
Spencerville Drain
D8
D7
D6
D3
KC3
KC2
SC1
SR7
SR6
SR4SR3
SR2SR1
KC4KC1
D4
D5
SR5
¯In
form
atio
n co
ntai
ned
in th
is d
raw
ing
is th
e co
pyrig
ht o
f Gol
der A
ssoc
iate
s (N
Z) L
td. U
naut
horis
ed u
se o
r rep
rodu
ctio
n of
this
pla
n ei
ther
who
lly o
r in
part
with
out w
ritte
n pe
rmis
sion
infri
nges
cop
yrig
ht.
©
Gol
der A
ssoc
iate
s (N
Z) L
td.
087813714PROJECT
0 1 2 3 KilometersDatum: NZGD1949Projection: New Zealand Map Grid
Legend < 10
10 - 15
15 - 20
>= 20
Koura present
Styx River catchment
Watercourse
MACROINVERTEBRATE TAXA RICHNESSAT SITES SAMPLED IN APRIL 2009
TITLE 17NOVEMBER 2009
K:\Graphics\Projects-numbered\2008\08781x\03xxx\087813714_CCC_StyxRiver_ICMP_Chch\nov09

STYX ICMP ECOLOGY SURVEY (STAGE 2)
November 2009 Report No. 087813714 33
Table 9: Macroinvertebrate index scores from sites sampled in April 2009. Mean (±1SE) index scores for Canterbury lowland streams are also shown.
Site No. of taxa
No. of EPT taxa % EPT MCI MCI-sb QMCI
QMCI-sb
Styx River SR1 16 9 2.1 97.1 97.1 4.74 4.74
SR2 18 8 1.0 86.1 91.2 4.83 4.84
SR3 18 8 20.4 89.7 89.7 4.29 4.29
SR4 17 5 0.1 79.3 84.3 4.95 4.95
SR5 14 1 0.5 65.1 70.2 4.10 4.36
SR6 14 1 0.3 58.9 63.4 4.40 4.53
SR7 20 1 0.3 60.7 63.9 3.11 3.13
SR Site Average 17 5 3.5 76.7 80.0 4.3 4.4
Tributary Sites Smacks Creek SC1 16 7 19.9 82.0 82.0 3.62 3.62 Kaputone Stream KC1 13 2 1.0 82.2 89.0 2.57 2.57
KC2 13 2 0.3 66.3 71.8 2.74 2.97
KC3 17 4 3.7 85.6 91.0 4.36 4.47
KC4 12 2 0.1 71.2 77.6 2.51 2.59
KC Site Average 14 3 1.3 76.3 82.4 3.0 3.1
Drain Sites D3 19 3 0.7 73.6 73.6 3.81 3.81
D4 15 1 0.1 53.1 56.9 2.41 2.42
D5 9 3 14.2 85.6 85.6 4.20 4.20
D6 17 1 0.02 64.7 68.8 2.31 2.51
D7 19 0 0.0 52.8 55.8 2.03 2.03
D8 16 0 0.0 42.0 44.8 2.43 2.44
Drain Site Average 16 1 2.5 62.0 64.2 2.9 2.9
Overall Average 16 3 4 72 75 3.52 3.58 Canterbury lowland* 14 ± 0.32 5 ± 0.31 33.8 ±
3.11 4.37 ± 0.14
Note: * Lowland stream data are from 50 lowland Canterbury stream sites sampled by ECan from 1998-2005, and includes sites with three or more records.

STYX ICMP ECOLOGY SURVEY (STAGE 2)
November 2009 Report No. 087813714 34
0
20
40
60
80
100
SR
1
SR
2
SR
3
SR
4
SR
5
SR
6
SR
7
SC
1
KC
1
KC
2
KC
3
KC
4
D3
D4
D5
D6
D7
D8
Site
% A
bund
ance
Other Oligochaeta Mollusca DipteraCrustacea Trichoptera Ephemeroptera
Figure 18: Percent relative abundance of major taxonomic groups recorded at sampling sites in April 2009.
0
1
2
3
4
5
6
SR
1
SR
2
SR
3
SR
4
SR
5
SR
6
SR
7
SC
1
KC
1
KC
2
KC
3
KC
4
D3
D4
D5
D6
D7
D8
Site
QM
CI-s
b Severe degradation
Possible degradation
Moderate degradation
Clean water
Figure 19: QMCI-sb scores recorded at sampling sites in April 2009.
6.2.4 Effects of macrophyte removal on aquatic biota Excessive growth of macrophytes in waterways can interfere with drainage by reducing water flow in channels which can result in surface flooding during periods of high flow (Taylor et al. 2000). Additionally, during periods of low flow macrophytes can become smelly and visually unappealing decomposing masses (Taylor et al. 2000). Excessive growth of macrophytes can be a common feature in Canterbury lowland waterways and dense growths of macrophyte beds occur along the Styx River, especially downstream of Marshlands Road. Mechanical cutting and removal of macrophytes is currently used in the Styx River to control the ‘nuisance’
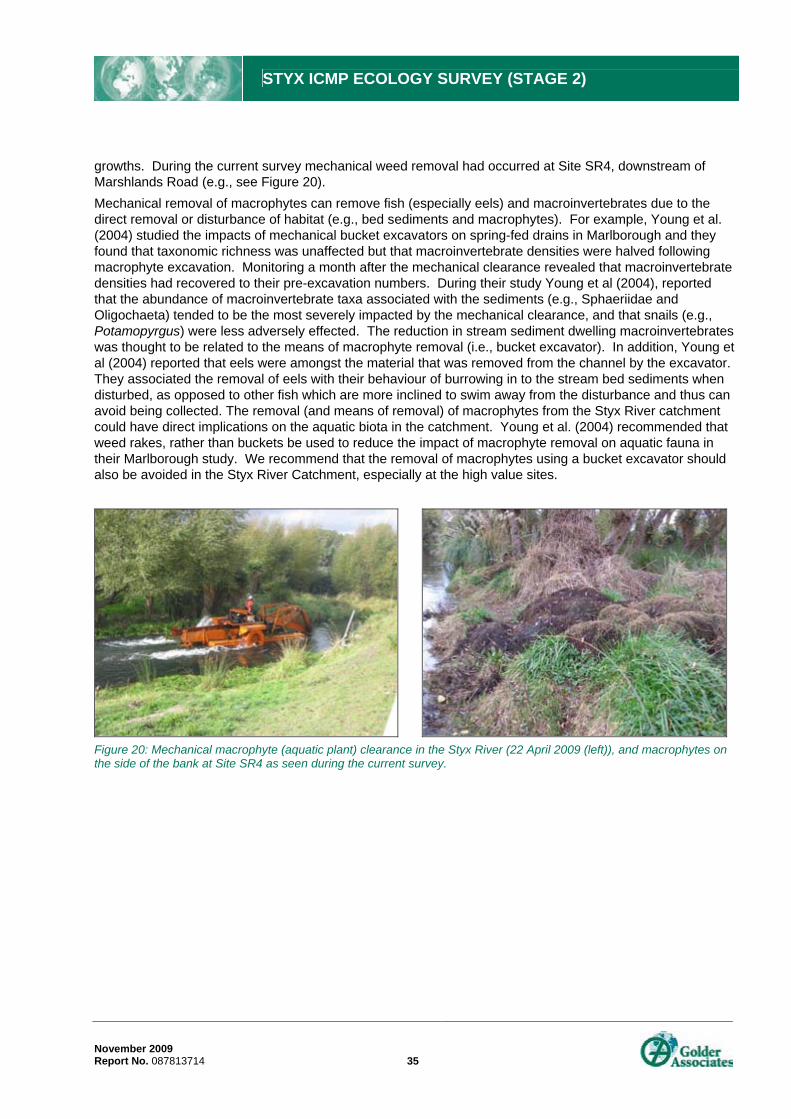
STYX ICMP ECOLOGY SURVEY (STAGE 2)
November 2009 Report No. 087813714 35
growths. During the current survey mechanical weed removal had occurred at Site SR4, downstream of Marshlands Road (e.g., see Figure 20). Mechanical removal of macrophytes can remove fish (especially eels) and macroinvertebrates due to the direct removal or disturbance of habitat (e.g., bed sediments and macrophytes). For example, Young et al. (2004) studied the impacts of mechanical bucket excavators on spring-fed drains in Marlborough and they found that taxonomic richness was unaffected but that macroinvertebrate densities were halved following macrophyte excavation. Monitoring a month after the mechanical clearance revealed that macroinvertebrate densities had recovered to their pre-excavation numbers. During their study Young et al (2004), reported that the abundance of macroinvertebrate taxa associated with the sediments (e.g., Sphaeriidae and Oligochaeta) tended to be the most severely impacted by the mechanical clearance, and that snails (e.g., Potamopyrgus) were less adversely effected. The reduction in stream sediment dwelling macroinvertebrates was thought to be related to the means of macrophyte removal (i.e., bucket excavator). In addition, Young et al (2004) reported that eels were amongst the material that was removed from the channel by the excavator. They associated the removal of eels with their behaviour of burrowing in to the stream bed sediments when disturbed, as opposed to other fish which are more inclined to swim away from the disturbance and thus can avoid being collected. The removal (and means of removal) of macrophytes from the Styx River catchment could have direct implications on the aquatic biota in the catchment. Young et al. (2004) recommended that weed rakes, rather than buckets be used to reduce the impact of macrophyte removal on aquatic fauna in their Marlborough study. We recommend that the removal of macrophytes using a bucket excavator should also be avoided in the Styx River Catchment, especially at the high value sites.
Figure 20: Mechanical macrophyte (aquatic plant) clearance in the Styx River (22 April 2009 (left)), and macrophytes on the side of the bank at Site SR4 as seen during the current survey.

D8
D7
D6
D5
D4
D3
KC4
KC3
KC2
KC1SC1
SR7
SR6
SR5
SR4SR3
SR2SR1
2469360
2469360
2474360
2474360
2479360
2479360
2484360
2484360
2489360
2489360 5744
290
5749
290
5749
290
5754
290
5754
290
¯In
form
atio
n co
ntai
ned
in th
is d
raw
ing
is th
e co
pyrig
ht o
f Gol
der A
ssoc
iate
s (N
Z) L
td. U
naut
horis
ed u
se o
r rep
rodu
ctio
n of
this
pla
n ei
ther
who
lly o
r in
part
with
out w
ritte
n pe
rmis
sion
infri
nges
cop
yrig
ht.
©
Gol
der A
ssoc
iate
s (N
Z) L
td.
QMCI-SB SCORES RECORDED AT SITES SAMPLEDWITHIN THE STYX ICMP PROJECT AREA IN 2009 21NOVEMBER 2009
087813714PROJECT
TITLE
LegendPoor ( < 4 )
Moderate ( 4 - 5 )
Styx River catchment0 1 2 3 KilometersDatum: NZGD1949
Projection: New Zealand Map Grid
K:\GIS\Projects-Numbered\2008\08781x\03xxx\0878103_714_CCC_StyxRiverICMP\MapDocuments\StyxEcologicalSurvey\Sept09\Fig21_QMCIScores.mxd
Kainga Drain
Kaputone Stream
Styx RiverShepherd Drain
Wilsons Drain
Smacks Creek
Horners DrainRhodes Drain
Spencerville Drain

STYX ICMP ECOLOGY SURVEY (STAGE 2)
November 2009 Report No. 087813714 37
6.3 Relationship with instream habitat EPT taxa richness and percent EPT abundance were strongly and negatively correlated with the percentage of fine bed substrates (rs= -0.78, and rs= -0.88, respectively). Similarly, MCI and MCI-sb scores were also strongly and negatively correlated with the percentage of fine bed substrates (rs= -0.84, and rs= -0.79, respectively). Figure 22 shows the relationship between the percentage of fine bed substrates and MCI-sb and percent EPT abundance. Notably, Figure 22 shows that the relationship between MCI-sb scores and the percentage of fine bed substrates was not linear and thus there is a marked decline in MCI-sb scores once the percentage of fine bed substrates is greater than 80%. The abundance of caddisflies (Trichoptera) and mayflies (Ephemeroptera) were both negatively correlated with the percent of fine bed substrates (rs= -0.65 and rs= -0.62, respectively). The negative relationship between percent fines, EPT, and MCI scores is not surprising as EPT taxa typically favour coarse bed substrates (which are rare in the Styx River catchment) and ‘sensitive’ EPT taxa have higher MCI tolerance scores. Instream habitat scores were positively correlated with MCI (rs= 0.72), MCI-sb (rs= 0.67), %EPT (rs= 0.73) and EPT taxa richness (rs= 0.72). The percentage of mayflies was positively correlated with reach habitat (rs=0.51), and catchment habitat (rs= 0.51). Both mayflies and caddisfly abundances were positively correlated with instream habitat scores (rs = 0.66, and rs= 0.5, respectively).
0
20
40
60
80
100
120
0 20 40 60 80 100
% Fine bed substrates
MC
I-sb
rs= -0.79
0
5
10
15
20
25
0 20 40 60 80 100% Fine bed substrates
%E
PT
rs=-0.88
Note: Spearman Rank Correlation rs values are shown on plots.
Figure 22: Relationship between the percent of fine bed substrates and MCI-sb scores (left), and %EPT (right).
No meaningful significant relationships were detected between the analysed macroinvertebrate index scores and water quality parameters collected on the day of each survey (i.e., pH, conductivity, temperature, DO), using Spearman Rank correlation (e.g., p>0.05).
6.4 Relationship with sediment quality QMCI-sb scores were weakly and negatively correlated with the concentration of arsenic recorded in sediment by Golder (2009) (rs=0.56). Crustacea abundance was strongly and negatively correlated with arsenic concentrations in sediments (rs=-0.70), and worm abundance was positively correlated with arsenic (rs=0.61). The abundance of diptera was positively correlated with chromium (rs=0.68), and zinc (rs=0.58). There were no other significant correlations found between measured metal concentrations in sediment and macroinvertebrate index scores (p>0.05) during our survey.

STYX ICMP ECOLOGY SURVEY (STAGE 2)
November 2009 Report No. 087813714 38
These results indicate that overall, there was no clear relationship between metal concentrations in sediment and stream ecology. It is likely that other factors including stream substrate and physical habitat drive the instream ecology in the Styx River ICMP area.
6.5 Comparison with Other Studies
6.5.1 Styx River Catchment 6.5.1.1 Long term Environment Canterbury monitoring programme ECan have been monitoring macroinvertebrate communities in the Styx River at the Styx Mill Reserve almost annually since the summer of 1998/1999. A second site on the Kaputone Stream at Belfast Road has also been sampled by ECan but on a less regular basis between 2002 and 2009. ECan’s long term monitoring data from the Styx River at the Styx Mill Reserve shows a weak but significant negative correlation with QMCI scores declining over time. In comparison, QMCI scores from Kaputone Stream have remained relatively constant over time and there was no significant correlation found between sampling date and QMCI scores (p>0.05) (Figure 23). Examination of annual mean total ECan habitat scores at the Styx Mill Reserve for 1999 - 2007 show that over the same period that QMCI scores were declining, habitat scores at the Styx Mill Reserve were increasing (1999 to 2002), but since 2002 scores become relatively stable, and there was no correlation found between sampling date and habitat scores (p>0.05)). In comparison, mean annual reactive Phosphorus (P) concentrations increased significantly over time at the Styx River (Claridges Road) site (rs=0.87, p<0.05) (Error! Reference source not found.). Over the same time period, none of the other water quality parameters examined (Nitrite, Nitrate, Ammonia, TSS) showed a significant increasing or decreasing trend (e.g., p>0.05). Without a longer monitoring dataset it is not possible to detect the reasons for the observed decline in macroinvertebrate health at the Styx Mill Reserve however changes in stream habitat or water quality are possible factors.
0
1
2
3
4
5
6
7
1999
2000
2001
2002
2003
2004
2005
2006
2007
Date
QM
CI
rs=-0.68
0
1
2
3
4
5
6
7
2002
2003
2004
2005
2006
2007
2008
Date
QM
CI
rs= -0.32
Note: Raw data are from ECan. Spearman Rank Correlation rs values are shown on plots.
Figure 23: Mean annual QMCI scores recorded from the Styx River at the Styx Mill Reserve (left) from 1999 to 2008, and from Kaputone Stream at Belfast Road (right) from 2002 to 2008.
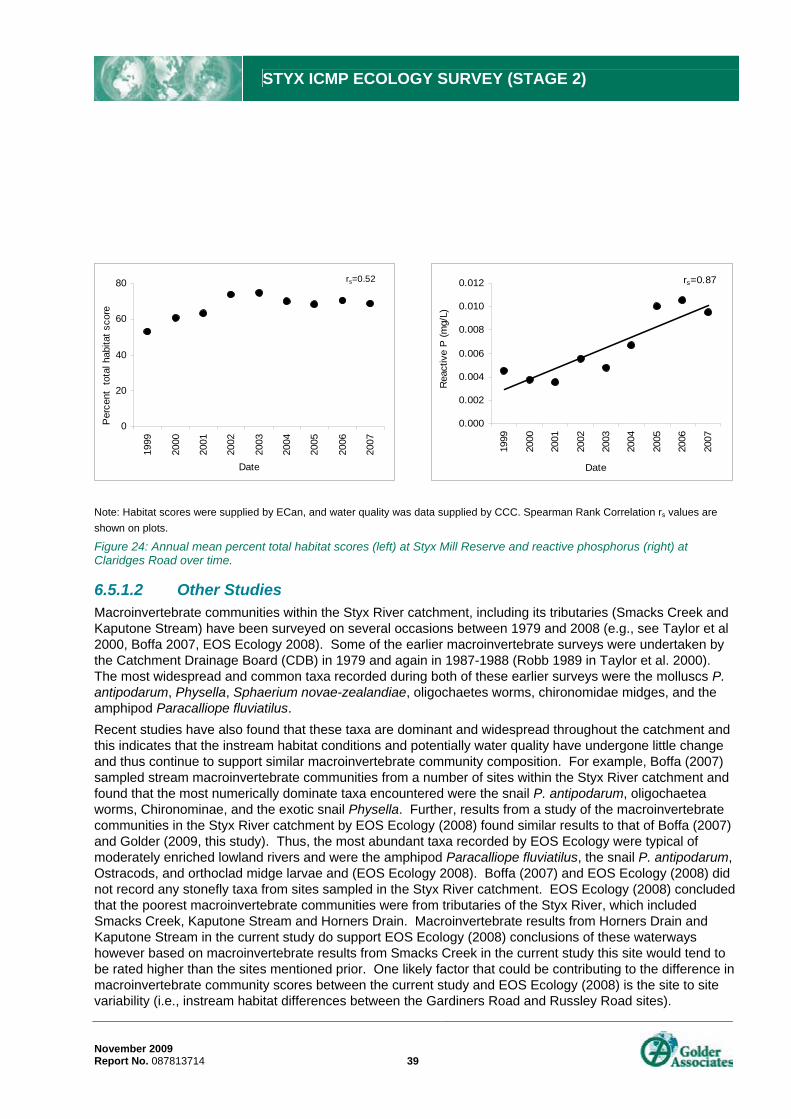
STYX ICMP ECOLOGY SURVEY (STAGE 2)
November 2009 Report No. 087813714 39
0
20
40
60
80
1999
2000
2001
2002
2003
2004
2005
2006
2007
Date
Per
cent
tot
al h
abita
t sco
re
rs=0.52
0.000
0.002
0.004
0.006
0.008
0.010
0.012
1999
2000
2001
2002
2003
2004
2005
2006
2007
Date
Rea
ctiv
e P
(mg/
L)
rs=0.87
Note: Habitat scores were supplied by ECan, and water quality was data supplied by CCC. Spearman Rank Correlation rs values are shown on plots.
Figure 24: Annual mean percent total habitat scores (left) at Styx Mill Reserve and reactive phosphorus (right) at Claridges Road over time.
6.5.1.2 Other Studies Macroinvertebrate communities within the Styx River catchment, including its tributaries (Smacks Creek and Kaputone Stream) have been surveyed on several occasions between 1979 and 2008 (e.g., see Taylor et al 2000, Boffa 2007, EOS Ecology 2008). Some of the earlier macroinvertebrate surveys were undertaken by the Catchment Drainage Board (CDB) in 1979 and again in 1987-1988 (Robb 1989 in Taylor et al. 2000). The most widespread and common taxa recorded during both of these earlier surveys were the molluscs P. antipodarum, Physella, Sphaerium novae-zealandiae, oligochaetes worms, chironomidae midges, and the amphipod Paracalliope fluviatilus. Recent studies have also found that these taxa are dominant and widespread throughout the catchment and this indicates that the instream habitat conditions and potentially water quality have undergone little change and thus continue to support similar macroinvertebrate community composition. For example, Boffa (2007) sampled stream macroinvertebrate communities from a number of sites within the Styx River catchment and found that the most numerically dominate taxa encountered were the snail P. antipodarum, oligochaetea worms, Chironominae, and the exotic snail Physella. Further, results from a study of the macroinvertebrate communities in the Styx River catchment by EOS Ecology (2008) found similar results to that of Boffa (2007) and Golder (2009, this study). Thus, the most abundant taxa recorded by EOS Ecology were typical of moderately enriched lowland rivers and were the amphipod Paracalliope fluviatilus, the snail P. antipodarum, Ostracods, and orthoclad midge larvae and (EOS Ecology 2008). Boffa (2007) and EOS Ecology (2008) did not record any stonefly taxa from sites sampled in the Styx River catchment. EOS Ecology (2008) concluded that the poorest macroinvertebrate communities were from tributaries of the Styx River, which included Smacks Creek, Kaputone Stream and Horners Drain. Macroinvertebrate results from Horners Drain and Kaputone Stream in the current study do support EOS Ecology (2008) conclusions of these waterways however based on macroinvertebrate results from Smacks Creek in the current study this site would tend to be rated higher than the sites mentioned prior. One likely factor that could be contributing to the difference in macroinvertebrate community scores between the current study and EOS Ecology (2008) is the site to site variability (i.e., instream habitat differences between the Gardiners Road and Russley Road sites).
STYX ICMP ECOLOGY SURVEY (STAGE 2)
November 2009 Report No. 087813714 40
Perhaps, one of the biggest differences in the macroinvertebrate sampling results from previous surveys and the present survey undertaken in 2009 is the total number of taxa recorded. For example in the present survey a total of 39 different taxa were collected, in comparison to 75 taxa and 62 taxa (1979 and 1988, respectively) (Robb 1989 in Taylor et al. 2000), 50 taxa in 2007 (Boffa 2007) and 56 taxa in 2008 (EOS Ecology 2008). The exact reason for the lower observed taxa richness in 2009 compared to other years is unclear but factors influencing the number of taxa identified include the time of sampling, the collection of a single sample, or the level of taxonomic identification (e.g., family, genus, or species). Another obvious difference between the current macroinvertebrate survey and previous surveys in 1979 and 1988 is the number of mayfly taxa identified in the Styx River catchment. During the current survey the only mayfly taxa identified was the common mayfly Deleatidium spp., however in the 1979-1988 surveys four mayfly taxa were identified from the Styx River and three mayfly taxa were identified from Smacks Creek (Taylor et al. 2000). Robb (1989) reported that the mayflies recorded in Smacks Creek during the 1988 survey were Deleatidium, Coloburiscus and Zephlebia. During two more recent surveys of the Styx River catchment (i.e., Boffa 2007 and EOS Ecology 2008) only one mayfly taxa, the common mayfly, Deleatidium was identified. Macroinvertebrate health scores reported for the Styx River catchment in EOS Ecology (2008) (QMCI, MCI) and Boffa (2007) (MCI-sb, QMCI-sb) were indicative of severe to moderate degradation in habitat and water quality and thus are comparable to macroinvertebrate health scores reported in this study.
6.5.2 Other Rivers in Christchurch Dominant macroinvertebrate communities recorded from the Styx River catchment in 2009 were similar to those recorded in other waterways in the Christchurch region. EOS Ecology et al. (2005), in a study of waterways from south-west Christchurch, recorded a total of 35 invertebrate taxa from 15 sites in the Heathcote catchment. The most diverse invertebrate group was Diptera, followed by caddisflies and snails. Taxa that were widespread and occurred at more than three-quarters of sites were snails (especially P. antipodarum and Physella), amphipods (P. fluviatilis), orthoclad midges, worms and ostracods. EPT abundances were >10% at only three of the 15 sites from the Heathcote River catchment. As part of the same south-west Christchurch waterway survey EOS Ecology et al. (2005) recorded a total number of 37 taxa from 11 sites in the Halswell River catchment. The most abundant and widespread taxa in this catchment were amphipods (especially P. fluviatilis), snails (especially P. antipodarum), and ostracods. Of the sites sampled in the Halswell River catchment only one site had >10% abundances of EPT taxa. In a study of 17 sites within Rangiora’s Three Brooks (South Brook, Middle Brook, and North Brook), Golder (2008a) found a total of 67 macroinvertebrate taxa. The snail, P. antipodarum and oligochaete worms were the most widespread taxa found at all the sites sampled. Pollution sensitive EPT taxa were in high abundances (>50%) at five of the 17 sites sampled and 4 of these sites were on South Brook, and one site was on North Brook. Macroinvertebrates in South Brook, upstream of the former Rangiora wastewater treatment plant (WWTP) discharge have been monitored by ECan since 1999. South Brook is similar to the Styx River in that its catchment is also primarily rural, and similar to the trend in macroinvertebrate health observed for the Styx River at Styx Mill Reserve QMCI scores in South Brook also have been declining over time (Golder 2008a). The Avon River (Avon), like the Styx River is a spring-fed lowland waterway however the Avon is highly modified and is dominated by urban land use. ECan have monitored macroinvertebrate health at two sites (Victoria Square, and at the University of Canterbury UCSA building) on the Avon River since 2000. Mean taxa richness at the two ECan long-term monitoring sites on the Avon River is 10 to 11 taxa which is markedly lower than the mean taxa richness recorded amongst the sampling sites in the Styx River catchment (16 taxa). The average QMCI score between the ECan sampling sites on the Avon is a QMCI score of 3 and scores below 4 indicate severe degradation in habitat and/or water quality. These data indicate that overall the sites along the Styx River are in greater ecological condition than to the Avon River and is likely to be a reflection on the differences in dominate land use (e.g., rural versus urban). Macroinvertebrate data collected by ECan from Canterbury streams categorised as having a ‘lowland source of flow’ (Meredith el al. 2003) were summarised and results from the current study was compared to mean

STYX ICMP ECOLOGY SURVEY (STAGE 2)
November 2009 Report No. 087813714 41
macroinvertebrate index values for ECan’s lowland stream category (i.e., the means of site mean values). Taxa richness was on average higher at the sites sampled for this survey than the regional average for lowland streams (a mean of 16 taxa versus 14 taxa, respectively) (Table 9). In comparison the average EPT taxa richness and percent EPT recorded from the sampling sites in the current survey was lower than the regional average (Table 9). However EPT taxa richness recorded at Sites SR1, SR2, SR3 on the Styx River and Site SC1 on Smacks Creek was greater then the mean for lowland streams throughout Canterbury. Mean QMCI scores (hard bottomed) for lowland streams was greater than the average QMCI score recorded for the sites in this survey (i.e., 4.37 versus 3.52, respectively) but QMCI scores recorded at Sites SR1, SR2 and SR4 on the Styx River were marginally higher (Table 9). Overall, the average QMCI score from ‘lowland source of flow streams’ indicate moderate degradation and was generally typical of scores recorded during this survey for the Styx River catchment. Although some of the stream health index scores recorded in the Styx River may be lower than the Canterbury regional average for lowland streams, in comparison to other streams in and around Christchurch the ecological integrity in the Styx River catchment is similar if not higher, in comparison.
6.6 Overview of Styx ICMP Area The most widespread and common macroinvertebrate taxa within the Styx River catchment are typically taxa tolerant of a wide range of habitat and water quality conditions and include molluscs (especially, P. antipodarum, Physella, Sphaerium novae-zealandiae), oligochaetes worms, diptera (especially chironomidae midge larvae), and amphipods (especially, Paracalliope fluviatilus). Sensitive EPT taxa are typically rare within the catchment and are only found in relatively high abundances at a small number of sites. MCI and QMCI scores indicative of moderate to poor habitat and/or water quality are common place throughout the catchment. For example, Figure 25 and Figure 26 shows EPT abundances and QMCI-sb scores recorded at sites sampled by Boffa (2007), and Golder during the current study. Of particular interest was the koura identified at Site SR3 (Styx Mill Reserve) during the current survey.

2469360
2469360
2474360
2474360
2479360
2479360
2484360
2484360
2489360
2489360 5744
290
5749
290
5749
290
5754
290
5754
290
¯In
form
atio
n co
ntai
ned
in th
is d
raw
ing
is th
e co
pyrig
ht o
f Gol
der A
ssoc
iate
s (N
Z) L
td. U
naut
horis
ed u
se o
r rep
rodu
ctio
n of
this
pla
n ei
ther
who
lly o
r in
part
with
out w
ritte
n pe
rmis
sion
infri
nges
cop
yrig
ht.
©
Gol
der A
ssoc
iate
s (N
Z) L
td.
OVERVIEW OF THE STYX RIVER ICMP AREA: EPT ABUNDANCES 25NOVEMBER 2009087813714PROJECT
TITLE
LegendGolder Sites (2009)
0% - 10%
10% - 30%
30% - 60%
60% - 90%
Boffa Sites (2007)0% - 10%
10% - 30%
30% - 60%
60% - 90%
Styx River catchment
0 1 2 3 KilometersDatum: NZGD1949Projection: New Zealand Map Grid
K:\GIS\Projects-Numbered\2008\08781x\03xxx\0878103_714_CCC_StyxRiverICMP\MapDocuments\StyxEcologicalSurvey\Sept09\Fig25_EPToverview.mxd
1. Map Image: Land information New Zealand Topographic 260 Series, Crown Copyright Reserved2. Displayed Boffa %EPT abundances are an average between edge and centre macroinvertebrate samples
Kainga Drain
Kaputone Stream
Styx RiverShepherd Drain
Wilsons Drain
Smacks Creek
Horners DrainRhodes Drain
Spencerville Drain

2469360
2469360
2474360
2474360
2479360
2479360
2484360
2484360
2489360
2489360 5744
290
5749
290
5749
290
5754
290
5754
290
¯In
form
atio
n co
ntai
ned
in th
is d
raw
ing
is th
e co
pyrig
ht o
f Gol
der A
ssoc
iate
s (N
Z) L
td. U
naut
horis
ed u
se o
r rep
rodu
ctio
n of
this
pla
n ei
ther
who
lly o
r in
part
with
out w
ritte
n pe
rmis
sion
infri
nges
cop
yrig
ht.
©
Gol
der A
ssoc
iate
s (N
Z) L
td.
OVERVIEW OF THE STYX RIVER ICMP AREA: QMCI-SB SCORES 26NOVEMBER 2009087813714PROJECT
TITLE
LegendGolder Sites (2009)
Poor ( < 4 )
Moderate ( 4 - 5 )
Boffa Sites (2007)Poor ( < 4 )
Moderate ( 4 - 5 )
Good ( > 5 )
Styx River catchment
0 1 2 3 KilometersDatum: NZGD1949Projection: New Zealand Map Grid
K:\GIS\Projects-Numbered\2008\08781x\03xxx\0878103_714_CCC_StyxRiverICMP\MapDocuments\StyxEcologicalSurvey\Sept09\Fig26_QMCIoverview.mxd
1. Map Image: Land information New Zealand Topographic 260 Series, Crown Copyright Reserved2. displayed Boffa QMCI-sb scores are an average between edge and centre macroinvertebrate samples.
Kainga Drain
Kaputone Stream
Styx RiverShepherd Drain
Wilsons Drain
Smacks Creek
Horners Drain
Rhodes Drain
Spencerville Drain

STYX ICMP ECOLOGY SURVEY (STAGE 2)
November 2009 Report No. 087813714 44
7.0 FISH COMMUNITIES
7.1 Sampling Results 7.1.1 Styx River Seven fish species were collected from the Styx River sites, including six native species and one introduced species (Brown trout) (Table 10). Juvenile brown trout (<150 mm) were only recorded at the Styx Mill reserve (Site SR3). Adult brown trout were not observed at Site SR3 during the survey however; a passer-by commented that he regularly saw large trout in a pool upstream of our sampling reach. Common bullies were the most widespread fish species and were recorded at four of the seven Styx River sites in varying abundances. Table 10: Number of fish recorded at the Styx River sampling sites in April 2009.
Site Brown trout*
Common bully
Giant Bully
Upland bully
Longfin eel
Shortfin eel
Inanga Eels unident.
Koura present
No. fish spp.
SR1 10 1 SR2 1 1 SR3 2 2 2 2 SR4 3 1 1 3 SR5 18 1 1 2 1 5 SR6 6 1 2 SR7 14 1 2
Note: Koura=freshwater crayfish. * Introduced species (Salmo trutta)
7.1.2 Smacks Creek and Kaputone Stream A total of six fish species were identified between Smacks Creek and Kaputone Stream sites (Table 11). Five of the six fish species recorded in April 2009 were native species, and juvenile brown trout (<150 mm) were only recorded at Site SC1 (Table 11). Common bullies (Gobiomorphus cotidianus) were the most widespread and abundant fish amongst the sites and was recorded at all sites except Site SC1. Inanga (Galaxius maculatus) one of the species that makes up the whitebait run was recorded at Site KC4. Fish communities from Site KC1 and Site KC2 on Kaputone Stream are further discussed in Section 7.5 below. Figure 28 shows the total number of fish taxa recorded by Golder in April 2009 and by Boffa in 2007. Table 11: Number of fish recorded at Smack Creek (SC-prefix) and Kaputone Stream (KC-prefix) sites in April 2009.
Site Brown trout*
Common bully
Upland bully
Longfin eel
Shortfin eel
Inanga Eels unident.
No. fish spp.
SC1 2 3 1 4 4 4 KC1 32 6 3 3 KC2 4 1 2 KC3 3 14 2 KC4 6 1 1 3
Note: *Introduced species (Salmo trutta).

STYX ICMP ECOLOGY SURVEY (STAGE 2)
November 2009 Report No. 087813714 45
7.1.3 Drain Sites Six fish species were recorded from the drain sites during the April 2009 survey (Table 12). There were no new fish species identified from the drain sites that had not been identified at the Smacks Creek, Kaputone Stream and Styx River sampling sites. Common bullies, and shortfin eels were the most widespread and abundant species recorded during the April 2009 survey and were found at four of the five drain sites. Brown trout were not recorded in any of the drain sites in April 2009. There were no fish recorded at Site D8 in April 2009. There were fish mortalities at Site D6 during the fish survey with almost all of the netted inanga, and common bullies found to be dead on emptying of the nets. It is most likely that low DO concentrations (<50%) lead to asphyxiation of the fish caught.
Figure 27: One of the giant bullies caught in Spencerville Drain (Site D7) in April 2009.
Table 12: Number of fish recorded at drain sites in April 2009.
Site Common bully
Giant Bully
Upland bully
Longfin eel
Shortfin eel
Inanga Eels unident.
No. fish spp.
D3 7 1 D4 6 2 1 8 12 4 D5 2 1 1 2 D6 20 3 19 6 4 D7 9 9 9 3 D8 0
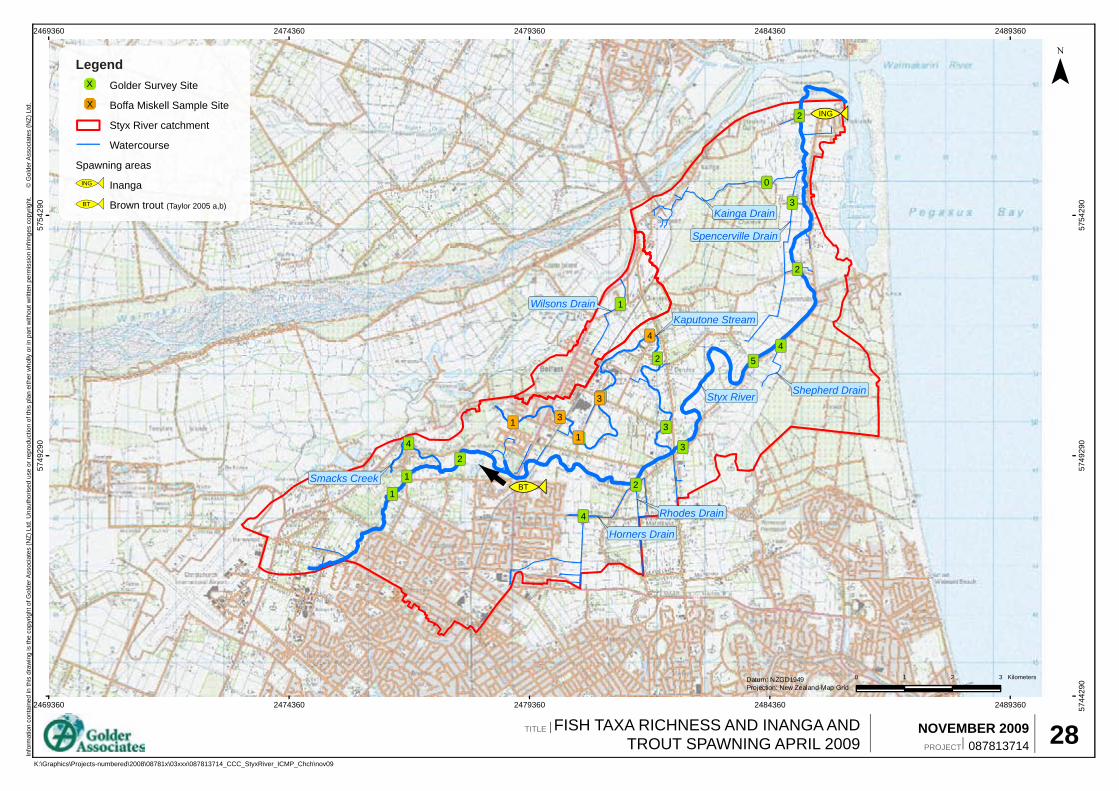
!(
!(
!(
!(
!(
!(
!(
!(
!(
!(
!(
!(
!(
!(
!(
!(
!(
!(
!(
!(
!(
!(
!(
2469360
2469360
2474360
2474360
2479360
2479360
2484360
2484360
2489360
2489360 5744
290
5749
290
5749
290
5754
290
5754
290
Kainga Drain
Kaputone Stream
Styx River Shepherd Drain
Wilsons Drain
Smacks Creek
Horners Drain
Rhodes Drain
Spencerville Drain
0
3
4
2
4
1
3
2
2
34
2
2
5
32
1
1
4
3
1
31
ING
BT
Legend Golder Survey Site
Boffa Miskell Sample Site
Styx River catchment
Watercourse
Spawning areas
Inanga
Brown trout (Taylor 2005 a,b)
¯In
form
atio
n co
ntai
ned
in th
is d
raw
ing
is th
e co
pyrig
ht o
f Gol
der A
ssoc
iate
s (N
Z) L
td. U
naut
horis
ed u
se o
r rep
rodu
ctio
n of
this
pla
n ei
ther
who
lly o
r in
part
with
out w
ritte
n pe
rmis
sion
infri
nges
cop
yrig
ht.
©
Gol
der A
ssoc
iate
s (N
Z) L
td.
FISH TAXA RICHNESS AND INANGA ANDTROUT SPAWNING APRIL 2009 28087813714PROJECT
TITLE
0 1 2 3 KilometersDatum: NZGD1949Projection: New Zealand Map Grid
'
'
X
X
ING
BT
NOVEMBER 2009
K:\Graphics\Projects-numbered\2008\08781x\03xxx\087813714_CCC_StyxRiver_ICMP_Chch\nov09

STYX ICMP ECOLOGY SURVEY (STAGE 2)
November 2009 Report No. 087813714 47
7.2 Comparison with Other Studies
7.2.1 Styx River Catchment A search of the New Zealand freshwater fish database (NZFFD) reveals that a total of 11 fish species have been recorded in the Styx River, and five fish species have been recorded in Kaputone Stream (Table 13). The most common species recorded in the NZFFD from the Styx River was shortfin eels, and brown trout, while records for the Kaputone Stream reveal that shortfin eels, and upland bullies are commonly found (Table 13). During the fish survey in April 2009 all five fish species recorded in the NZFFD from Kaputone Stream were found by Golder, and seven of the 12 fish species recorded in the Styx River were identified. These records indicate that the Styx River catchment is relatively diverse in fish, especially native species. Lamprey have historically been recorded in the Styx River. The NZFFD holds five records of lamprey from the Styx River with the latest record being from 1990 (Table 13). During a fisheries survey in 1990 an adult migrating lamprey was recorded in the Styx River in the Styx Mill Conservation Reserve (in the vicinity of Site SR3) (Eldon and Taylor 1990). As far as we are aware lamprey (adults or ammocoetes) have not been identified from the Styx River since 1990. Large brown trout, eels (Anguilla spp.), and bullies (Gobimorphus spp.) were also observed in Smacks Creek during the CREAS survey (von Tippelskirch and Hayward 2005c). Kingett Mitchell (2006) used nets (i.e., Fyke nets and G-minnow traps) and identified large numbers of longfin eels (some >1 m long) during their fish survey in Kaputone Stream near Radcliffe Road in May 2006. These results, and results from the present survey indicate that Kaputone Stream provides good eel habitat. Notably, one fish species that Boffa (2007) recorded in Kaputone Stream that was not recorded by Golder (2009), or in the NZFFD was the redfin bully (G. huttoni). Boffa (2007) recorded redfin bullies from Kaputone Stream near the Spring Grove Homestead (Golder Site KC2) and at a site at the Gutheries Road Reserve. The presence of redfin bullies is of interest because they are regionally rare and are most often found in moderately swift waterways with coarse (e.g., cobbles and boulder) open stream bed substrates (McDowall 1990). This particular habitat type is rare in the Kaputone Stream and the distribution of red fin bullies is likely to be patchy due to its habitat preferences.
7.2.2 Other Rivers in Christchurch A similar range of fish species, as recorded in the Styx River catchment have been recorded in other waterways within the Christchurch area (e.g., Golder 2008a; EOS Ecology et al. (2005)). EOS Ecology et al. (2005) in a study of waterways in Christchurch’s south-west identified seven freshwater fish taxa from 15 sites sampled within the Heathcote River catchment. During their survey (in order of abundance) these species were upland bully, shortfin eel, common bully, longfin eel, bluegill bully, inanga, and brown trout. In the same study EOS Ecology et al. (2005) also recorded a total of seven fish species from 11 sites sampled in the Halswell catchment. These species (in order of abundance) were the upland bully, shortfin eel, longfin eel, perch, common bully, inanga, and brown trout. The only species that have been recorded in the Heathcote River catchment, and the Halswell River catchment that has not been recorded in the Styx River catchment, in any known past survey, is the bluegill bully (G. hubbsi) and perch (Perca fluviatilis), respectively. These results suggest that the fish species recorded within the Styx River catchment are fairly common within Christchurch waterways.

STYX ICMP ECOLOGY SURVEY (STAGE 2)
November 2009 Report No. 087813714 48
Table 13: Number of fish records, and years recorded in the NZFFD from the Styx River and Kaputone Stream.
Species Threat status Styx River Years Recorded
Kaputone Stream Years Recorded
Longfin eel Gradual decline 15 1989,1990, 2000, 2007 3 1990, 1993
Shortfin eel Common native 14 1990, 2000, 2001, 2007 6 1990, 1993
Brown trout Introduced 13 1989, 1999, 2000 - -
Common bully Common native 9 1990, 2000, 2001, 2002, 2007 4 1990, 1993
Inanga Common native 7 1990, 2000, 2002 3 1990, 1993
Upland bully Common native 3 1990, 2000 6 1990, 1993
Black flounder Common native 4 1990, 2000, 2002 - -
Giant bully Common native 4 1990, 2000, 2001 - -
Yelloweye mullet Common native 3 1990, 2000 - -
Lamprey Sparse 5 1934, 1989, 1990 - -
Common smelt Common native 2 1990, 2002 - -
Koura* Gradual decline 1 1990 - -
Taxa richness 11 5
Total Number of Records 81 22
Note: * Freshwater crayfish. Threat status after Hitchmough et al. (2007). Last record in the NZFFD for the Styx River catchment is for 2007.
7.3 Overview of Styx ICMP Area Fish surveys undertaken by Boffa (2007) at several sites along Kaputone Stream in 2007 identified three of the five species Golder recorded in April 2009 (i.e., common bullies, longfin and shortfin eels) (Table 14). Longfin eels were recorded in much higher abundances by Boffa at Site KC1 and Site KC2 in 2007 than during our survey in 2009. However, the difference in abundances is possibly an artefact of sampling methods (i.e., electric fishing versus setting nets). Results from previous studies, the NZFFD, and the survey undertaken in April 2009 indicate that the fish communities in the Styx River catchment are relatively diverse but are characterised by shortfin eels, long fin eels, common bullies and brown trout. Results from this survey, and previous survey indicate that inanga also appear to be relatively common within the catchment and juvenile inanga form the major component of the whitebait catch, and the mouth of the Styx River is a highly valued location for white baiting. Notably, both brown trout and inanga have been found recently to spawn within different areas of the Styx River catchment which is important in helping to sustain the local populations of these species. The only recognised threatened fish species in the Styx River catchment was the longfin eel and although they appear to be relatively common (this and previous surveys) and were identified at several sites in the current study it is significant and important that their presence within the catchment is noted due to their declining populations nationally.

STYX ICMP ECOLOGY SURVEY (STAGE 2)
November 2009 Report No. 087813714 49
Appendix 3 of the WRRP provides an overview of the main aquatic values present throughout the Waimakariri River. The WRRP lists the Styx River and Kaputone Creek as providing significant habitat for eel, “other native fish” and trout.

STYX ICMP ECOLOGY SURVEY (STAGE 2)
November 2009 Report No. 087813714 50
Table 14: Number of fish recorded from Kaputone Stream at sites sampled by Boffa (2007) and Golder in 2009.
Site Location Length of survey (m)
Angiulla australlis (Shortfin
eel)
A. dieffenbachii (Longfin eel)
Gobiomorphus cotidianus (Common
bully)
G. breviceps (Upland bully)
G.huttoni (Redfin bully)
Galaxias maculatus (Inanga)
23 Northwood playing grounds 10 8 26 School grounds 40 3 13 1 27 Culvert under Blakes Road 75 51 KC1 Site downstream of Blakes road Nets 3 32 6 30 Beside Spring Grove Homestead 20 17 1 4 KC2 Belfast Road (West) Nets 1 4 34 Gutheries Road reserve 50 8 42 10 5 KC3 MacDonalds Road Nets 3 14 KC4 Belfast Road (East) Nets 1 6 1 Note: Sites are listed upstream to downstream. Numbered sites were sites sampled by Boffa (2007), and KC# sites were sites sampled by Golder (2009). Site KC1a is comparable to Site 27, Site and KC2b is comparable to Site 30.

STYX ICMP ECOLOGY SURVEY (STAGE 2)
November 2009 Report No. 087813714 51
7.4 Trout Spawning Taylor (2005a) undertook a survey of trout spawning redds (gravels “nests” containing eggs) in the Styx River catchment in 2000 and 2005. Reaches were surveyed along the main stem of the Styx River, Smacks Creek Kaputone Stream, and boxed drains within the Styx Mill Reserve. Results from these surveys showed that in 2005 there was a greater number of redds observed within the Styx River catchment than in 2000 (47 versus 26 redds, respectively). The total number of trout observed in the catchment during the 2000 and 2005 surveys was similar (24 versus 23 trout, respectively). There were no redds, or trout observed in the survey reaches of Kaputone Stream during either the 2000 or 2005 survey. The majority of redds recorded in the Styx River catchment during both surveys were recorded upstream of Main North Road and is where the most productive trout spawning habitat can be found. Taylor (2005a) attributed the increase in trout redds found during the 2005 survey to an increase in riparian management, and habitat quality within key trout spawning areas.
7.5 Inanga Spawning Taylor (2005b) conducted a survey of inanga eggs along the lower Styx River in 2005. Taylor (2005b) surveyed a reach which extended from approximately 260 m upstream of Kainga Road to Brooklands Lagoon with a focus on bank habitat considered appropriate for inanga egg deposition (e.g., suitable vegetation and low bank gradients). The highest numbers of eggs were observed along the 280 m stretch between Kainga Road and the Styx River high-tide gates. No inanga eggs were observed upstream of Kainga Road or downstream of the high-tide gates. The survey undertaken by Taylor (2005b) was the first time inanga eggs had been identified in the lower Styx River, despite earlier extensive searches in the late 1980’s (Taylor 2005b). Taylor (2005b) considered that the improvement in inanga spawning habitat (e.g., the development of native raupo and Juncus spp.) since the late 1980’s was a factor influencing the abundance of eggs found during the 2005 survey.
7.6 Salmonid Habitat Langlands and Elley (2000) described the Upper Styx River and Kaputone Creek as having low value habitat for brown trout, resident brown trout and sea-run spawning Chinook salmon in the Upper Styx only. The Lower Styx River was described as having medium value habitat for resident and sea-run migratory brown trout, and only low value habitat for brown trout and sea-run spawning Chinook salmon. Smacks Creek was described as having low value habitat for resident brown trout but was recognised as having important habitat for brown trout smolt (Langlands and Elley 2000).
8.0 WATER QUALITY 8.1 Sampling Results Spot water temperature measurements showed that the water was generally cool ranging from 9.1 °C at Site D8, to a warmer 17.3 °C at Site KC1 during the survey in April 2009 (Table 15). Water pH was generally similar among the sampling sites and ranged from pH 5.6 to pH 6.6 (Table 15). Electrical conductivity was similar among the Styx River and Smack Creek sampling sites (ranging from 146 µS/cm at Site SC1 to 165 µS/cm at Site SR6) (Table 15). Electrical conductivity was slightly more variable between sites on Kaputone Stream, and the drain sites ranging from 135 µS/cm at Site KC1 to 291 µS/cm at Site D8. Water conductivity is affected by the presence of inorganic dissolved solids (e.g., nitrate and phosphate) and thus very high conductivities can indicate potential issues with inorganic pollution. Spot measurements of dissolved oxygen (DO) measurements indicated that DO was more variable within the catchment (Table 15). For example, DO concentrations ranged from a low 3.8 mg/L / 32% at Site D8, to 9.1 mg/L / 83% at Site D3 (Table 15). DO concentrations in aquatic systems undergo diurnal cycles and can fluctuate considerably. DO saturation declines during the night and increases during the day, thus the differences observed in DO concentrations among sites may be associated (in part) with the time sampling was undertaken. Low dissolved oxygen concentrations can have an adverse effect on aquatic life (e.g., fish, macroinvertebrates, and micro-organisms). For example, DO concentrations of less than 5 mg/L can adversely affect fish (ANZECC 2000).

STYX ICMP ECOLOGY SURVEY (STAGE 2)
November 2009 Report No. 087813714 52
Visually, water clarity was clearest at the three upper Styx River sites (Sites SR1, SR2, and SR3) and Site SC1 on Smacks Creek (downstream of Gardiners Road) and tended to decline with distance downstream during the current survey. Table 15: Water quality parameters measured in the field during the site surveys in April 2009. Water way Styx River Date Time Temp (°C) pH
Cond. (µS/cm)
DO (mg/L) DO (%)
SR1 27/04/2009 9:14 11.9 5.6 153 4.7 44 SR2 27/04/2009 11:00 11.9 5.8 156 5.9 55 SR3 27/04/2009 13:30 12.8 6 158 7.8 73 SR4 1/05/2009 12:30 10.6 6.6 153 8.2 74 SR5 30/04/2009 15:30 10.6 6.3 163 4.6 42 SR6 1/05/2009 13:30 10.5 6.5 165 6.8 60 SR7 1/05/2009 14:00 9.5 6.5 157 6.1 54 Smacks Creek SC1 28/04/2009 10:00 14.2 6 146 6.2 59 Kaputone Creek KC1 28/04/2009 16:00 17.3 6.4 135 6.5 67 KC2 28/04/2009 15:30 14.9 6.3 166 4.4 43 KC3 29/04/2009 10:00 13.8 6.1 196 5.1 48 KC4 1/05/2009 12:00 9.5 6.2 177 7.2 63 Drains D3 29/04/2009 12:00 12.4 5.6 143 9.1 83 D4 28/04/2009 12:30 16.7 6.6 178 7.7 78 D5 27/04/2009 16:00 12.4 6.6 136 8.6 80 D6 30/04/2009 14:30 9.4 6 196 5.4 49 D7 29/4/2009 13:00 13.9 6.3 161 6.4 61 D8 30/04/2009 13:00 9.1 6.1 291 3.8 32
8.2 Overview of Styx ICMP Area Water pH and electrical conductivity was measured at 18 sites by Boffa in May 2007 and their results showed that pH ranged from 6.7 to pH 7.3, and conductivity from 111 µS/cm to 199 µS/cm among sites. DO was variable among sites in May 2007 but was lowest at Site 33 on Kaputone Stream (Figure 5), immediately downstream of the Belfast meat works discharge (DO saturation 0.52 mg/L). Water temperatures recorded by Boffa in May 2007 at sites within the catchment were relativity cool and ranged from 8.8 °C to 13.8 °C. Results from the field survey undertaken by Boffa (2007) and Golder (this study) indicate that there is some slight variation in pH, conductivity and temperature among the sites but that in general these water parameters were similar. DO concentrations in comparison tended to have greater variability throughout the catchment and in some instances may be limiting aquatic life.
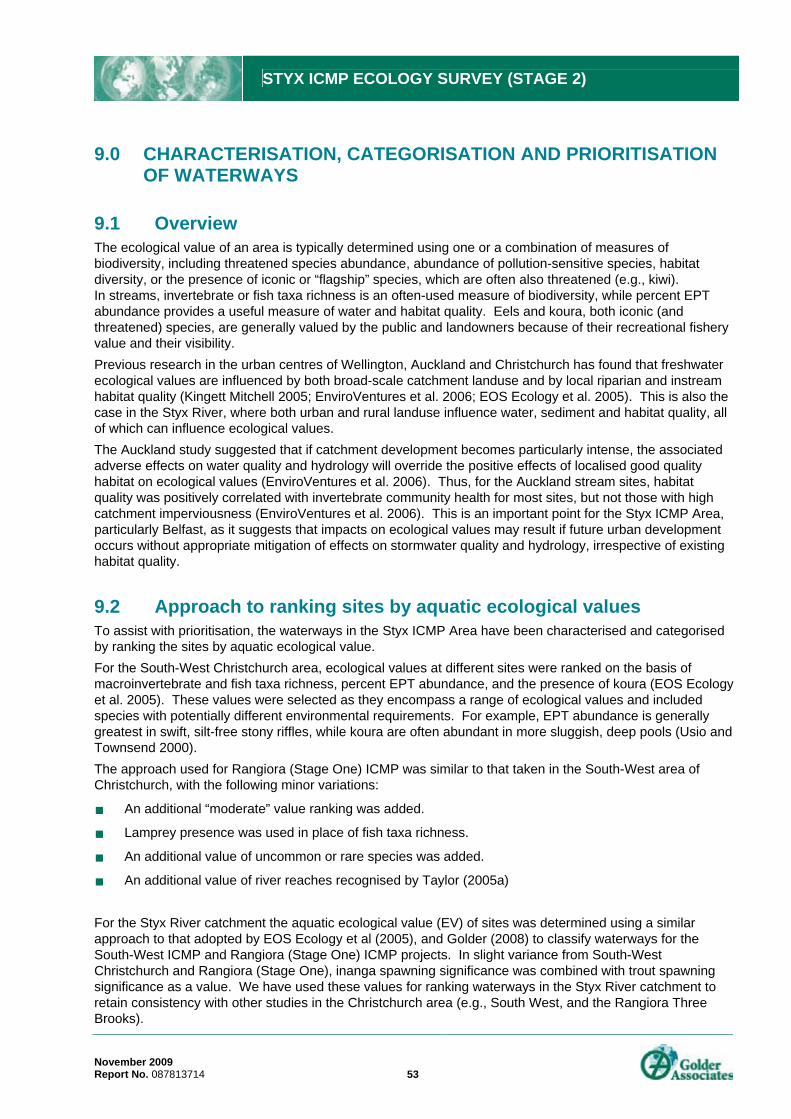
STYX ICMP ECOLOGY SURVEY (STAGE 2)
November 2009 Report No. 087813714 53
9.0 CHARACTERISATION, CATEGORISATION AND PRIORITISATION OF WATERWAYS
9.1 Overview The ecological value of an area is typically determined using one or a combination of measures of biodiversity, including threatened species abundance, abundance of pollution-sensitive species, habitat diversity, or the presence of iconic or “flagship” species, which are often also threatened (e.g., kiwi). In streams, invertebrate or fish taxa richness is an often-used measure of biodiversity, while percent EPT abundance provides a useful measure of water and habitat quality. Eels and koura, both iconic (and threatened) species, are generally valued by the public and landowners because of their recreational fishery value and their visibility. Previous research in the urban centres of Wellington, Auckland and Christchurch has found that freshwater ecological values are influenced by both broad-scale catchment landuse and by local riparian and instream habitat quality (Kingett Mitchell 2005; EnviroVentures et al. 2006; EOS Ecology et al. 2005). This is also the case in the Styx River, where both urban and rural landuse influence water, sediment and habitat quality, all of which can influence ecological values. The Auckland study suggested that if catchment development becomes particularly intense, the associated adverse effects on water quality and hydrology will override the positive effects of localised good quality habitat on ecological values (EnviroVentures et al. 2006). Thus, for the Auckland stream sites, habitat quality was positively correlated with invertebrate community health for most sites, but not those with high catchment imperviousness (EnviroVentures et al. 2006). This is an important point for the Styx ICMP Area, particularly Belfast, as it suggests that impacts on ecological values may result if future urban development occurs without appropriate mitigation of effects on stormwater quality and hydrology, irrespective of existing habitat quality.
9.2 Approach to ranking sites by aquatic ecological values To assist with prioritisation, the waterways in the Styx ICMP Area have been characterised and categorised by ranking the sites by aquatic ecological value. For the South-West Christchurch area, ecological values at different sites were ranked on the basis of macroinvertebrate and fish taxa richness, percent EPT abundance, and the presence of koura (EOS Ecology et al. 2005). These values were selected as they encompass a range of ecological values and included species with potentially different environmental requirements. For example, EPT abundance is generally greatest in swift, silt-free stony riffles, while koura are often abundant in more sluggish, deep pools (Usio and Townsend 2000). The approach used for Rangiora (Stage One) ICMP was similar to that taken in the South-West area of Christchurch, with the following minor variations:
An additional “moderate” value ranking was added.
Lamprey presence was used in place of fish taxa richness.
An additional value of uncommon or rare species was added.
An additional value of river reaches recognised by Taylor (2005a) For the Styx River catchment the aquatic ecological value (EV) of sites was determined using a similar approach to that adopted by EOS Ecology et al (2005), and Golder (2008) to classify waterways for the South-West ICMP and Rangiora (Stage One) ICMP projects. In slight variance from South-West Christchurch and Rangiora (Stage One), inanga spawning significance was combined with trout spawning significance as a value. We have used these values for ranking waterways in the Styx River catchment to retain consistency with other studies in the Christchurch area (e.g., South West, and the Rangiora Three Brooks).
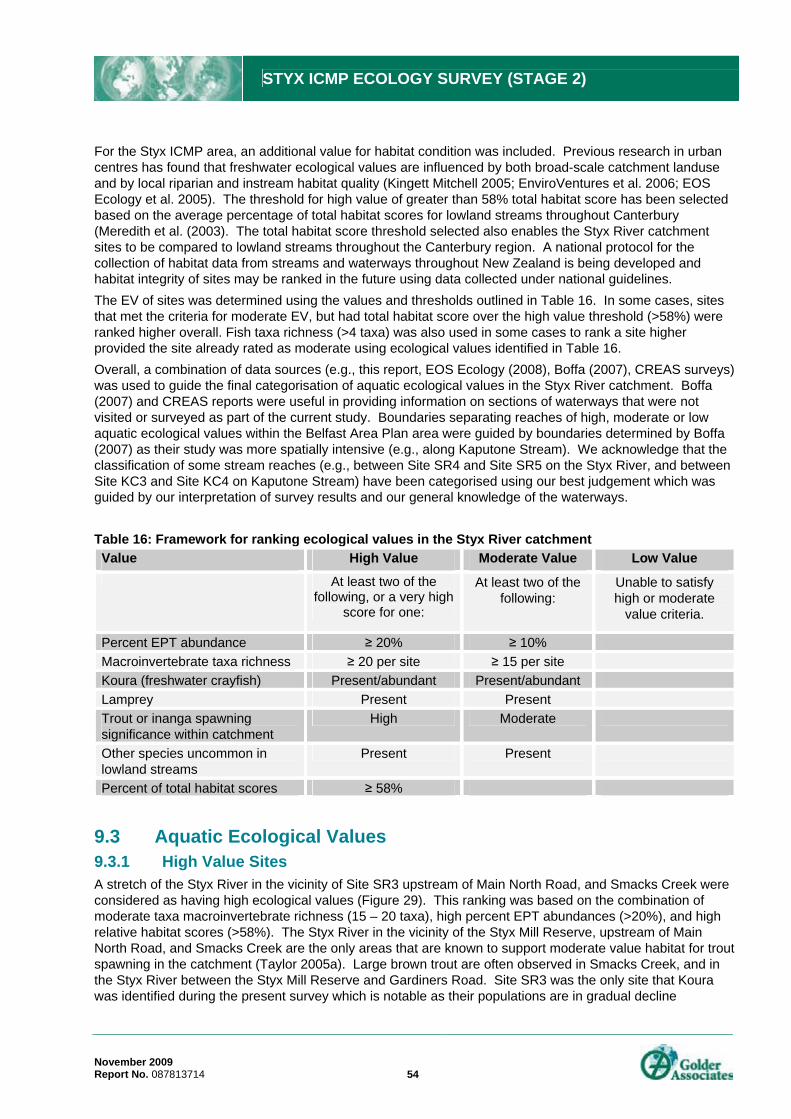
STYX ICMP ECOLOGY SURVEY (STAGE 2)
November 2009 Report No. 087813714 54
For the Styx ICMP area, an additional value for habitat condition was included. Previous research in urban centres has found that freshwater ecological values are influenced by both broad-scale catchment landuse and by local riparian and instream habitat quality (Kingett Mitchell 2005; EnviroVentures et al. 2006; EOS Ecology et al. 2005). The threshold for high value of greater than 58% total habitat score has been selected based on the average percentage of total habitat scores for lowland streams throughout Canterbury (Meredith et al. (2003). The total habitat score threshold selected also enables the Styx River catchment sites to be compared to lowland streams throughout the Canterbury region. A national protocol for the collection of habitat data from streams and waterways throughout New Zealand is being developed and habitat integrity of sites may be ranked in the future using data collected under national guidelines. The EV of sites was determined using the values and thresholds outlined in Table 16. In some cases, sites that met the criteria for moderate EV, but had total habitat score over the high value threshold (>58%) were ranked higher overall. Fish taxa richness (>4 taxa) was also used in some cases to rank a site higher provided the site already rated as moderate using ecological values identified in Table 16. Overall, a combination of data sources (e.g., this report, EOS Ecology (2008), Boffa (2007), CREAS surveys) was used to guide the final categorisation of aquatic ecological values in the Styx River catchment. Boffa (2007) and CREAS reports were useful in providing information on sections of waterways that were not visited or surveyed as part of the current study. Boundaries separating reaches of high, moderate or low aquatic ecological values within the Belfast Area Plan area were guided by boundaries determined by Boffa (2007) as their study was more spatially intensive (e.g., along Kaputone Stream). We acknowledge that the classification of some stream reaches (e.g., between Site SR4 and Site SR5 on the Styx River, and between Site KC3 and Site KC4 on Kaputone Stream) have been categorised using our best judgement which was guided by our interpretation of survey results and our general knowledge of the waterways. Table 16: Framework for ranking ecological values in the Styx River catchment Value High Value Moderate Value Low Value
At least two of the following, or a very high
score for one:
At least two of the following:
Unable to satisfy high or moderate
value criteria.
Percent EPT abundance ≥ 20% ≥ 10% Macroinvertebrate taxa richness ≥ 20 per site ≥ 15 per site Koura (freshwater crayfish) Present/abundant Present/abundant Lamprey Present Present Trout or inanga spawning significance within catchment
High Moderate
Other species uncommon in lowland streams
Present Present
Percent of total habitat scores ≥ 58%
9.3 Aquatic Ecological Values 9.3.1 High Value Sites A stretch of the Styx River in the vicinity of Site SR3 upstream of Main North Road, and Smacks Creek were considered as having high ecological values (Figure 29). This ranking was based on the combination of moderate taxa macroinvertebrate richness (15 – 20 taxa), high percent EPT abundances (>20%), and high relative habitat scores (>58%). The Styx River in the vicinity of the Styx Mill Reserve, upstream of Main North Road, and Smacks Creek are the only areas that are known to support moderate value habitat for trout spawning in the catchment (Taylor 2005a). Large brown trout are often observed in Smacks Creek, and in the Styx River between the Styx Mill Reserve and Gardiners Road. Site SR3 was the only site that Koura was identified during the present survey which is notable as their populations are in gradual decline

STYX ICMP ECOLOGY SURVEY (STAGE 2)
November 2009 Report No. 087813714 55
(Hitchmough et al. 2007). The Styx River within the Styx Mill Reserve also stands out as having the most significant area of diverse native vegetation in the catchment.
9.3.2 Moderate Value Sites Site Site SR1 on the Styx River was regarded as having low ecological values using the criteria outlined in Table 16. This site did have moderate taxa macroinvertebrate richness (18 taxa respectively) but the dominance of soft bed sediments does not support sensitive EPT taxa which may have increased the ecological value. Although Site SR1 comes out as having low ecological value using the specified criteria we have ranked it as having moderate ecological value as it did have moderate taxa richness, good riparian cover providing shade, overhanging vegetation providing cover for fish and longfin eels were common. The bottom end of the Styx River in the vicinity of Site SR7 was rated as having moderate values because it had high taxa macroinvertebrate richness (20 taxa), and has been recognised as having moderate inanga spawning habitat (Taylor 2005b). All Kaputone Stream sites were rated as having low ecological values which was based on the criteria in Table 16 not being met. This waterway is primarily dominated by soft fine bed sediments, and run habitat which does not typically support sensitive ecological communities. Although Kaputone Stream, overall, did not met the criteria outlined in Table 16 there are two reaches in the vicinity of Site KC1 and Site KC3 that are worth mentioning. Large longfin eels were recorded at Site KC1, as well as relatively high total habitat scores, and Boffa (2007) recorded relatively high %EPT (20%) in the vicinity. The presence of longfin eels in this waterway is of interest due to their overall population decline (especially the number of large longfin eels) nationally. In addition, the combination of sampling by Golder (2009) and Boffa (2007) from MacDonalds Road (Site KC3) upstream to Gutheries Road Reserve indicates that this section supports a relatively diverse fish community and Boffa (2007) reported high abundances of longfin eels which indicates that Kaputone Stream overall provides good habitat for this species and thus these sections have been ranked as having moderate ecological value.
9.3.3 Low Value Sites The remaining sections of Kaputone Stream have been rated as having low ecological values based on the criteria in Table 16 not being met. The majority of Kaputone Stream generally has homogenous instream habitat dominated by soft fine bed sediments, and run habitat of similar widths and depths. This type of habitat does not provide suitable instream conditions to support ecologically diverse and sensitive macroinvertebrate communities. The reach of Kaputone Stream above Main North Road often forms pool of standing water, or dries completely (e.g., von Tippelskirch and Haywood 2005b) and thus has been considered to provide little to no instream habitat and has been categorised as having low ecological value. Similarly, the Styx River downstream of Gardiners Road has been ranked as having low ecological values because this particular reach forms standing pools of water or drys completely (e.g., during the current study) and therefore provides little to no instream habitat. The Styx River downstream of Marshlands Road, except Site SR7, is considered as having low ecological values. This ranking was given because this section is primarily dominated by soft bed sediments, run habitat, is similar in terms of widths and depths and typically has high macrophyte cover (prior to weed removal). These habitat characteristics typically support macroinvertebrate communities tolerant to degradation in habitat and/or water quality. The section of the Styx River along Site SR2 was regarded as having low ecological values based on the criteria in Table 16 not being met. This site did have moderate taxa macroinvertebrate richness (16 taxa) but the dominance of soft bed sediments does not support the sensitive EPT taxa which may have increased the ecological value. It is worth mentioning that the Styx River between Gardiners Road and Styx Mill Reserve, which includes Site SR2 was identified by von Tippelskirch and Hayward (2005c) as having potential for restoration through natural recession. The high steep banks and continued fencing off from cattle would support this. All of the drain sites visited as part of the current survey were ranked as having low ecological value, this was primarily because the majority of sites had poor instream habitat (e.g., similar width, depth, flow, and little to no instream cover) which did not support diverse or ‘sensitive’ ecological communities.
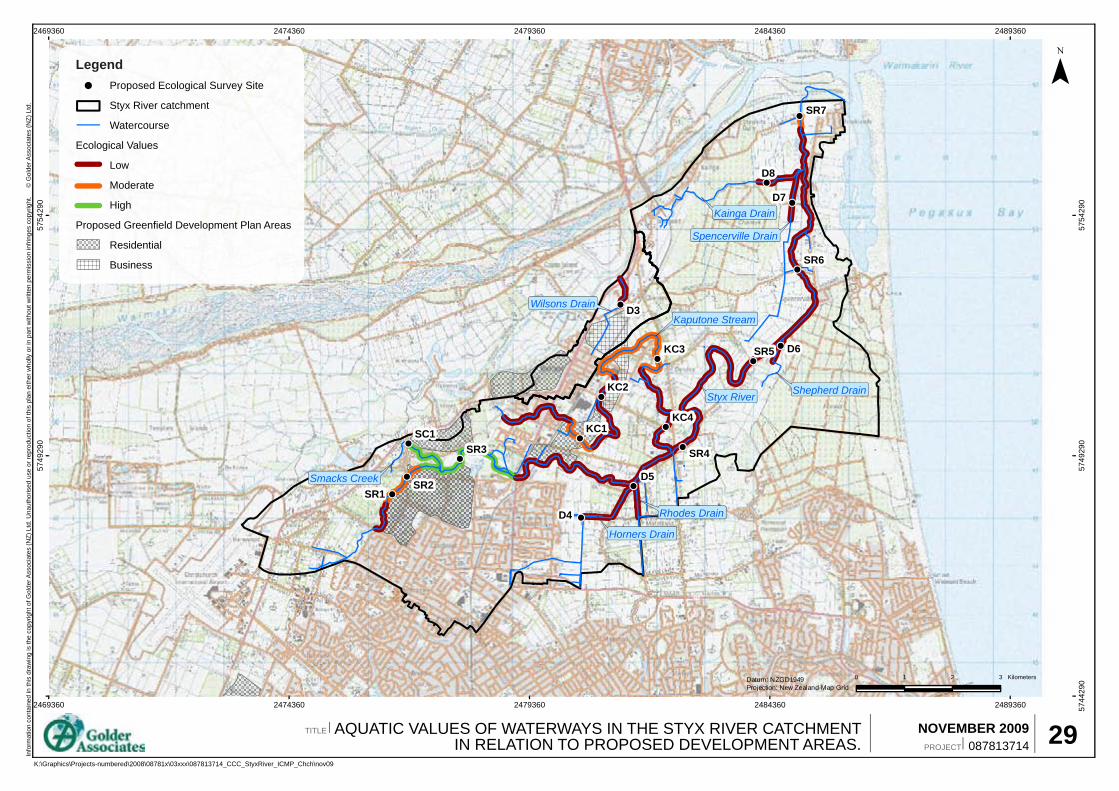
2469360
2469360
2474360
2474360
2479360
2479360
2484360
2484360
2489360
2489360 5744
290
5749
290
5749
290
5754
290
5754
290
Kainga Drain
Kaputone Stream
Styx River Shepherd Drain
Wilsons Drain
Smacks Creek
Horners Drain
Rhodes Drain
Spencerville Drain
D8
D7
D6
D3
KC3
SC1
SR7
SR6
SR4
SR2SR1 !!
!
!
!
!
!
!
!!
!
!
!
!
!
!
!
KC4
KC2
KC1
SR5
SR3
D4
D5
¯In
form
atio
n co
ntai
ned
in th
is d
raw
ing
is th
e co
pyrig
ht o
f Gol
der A
ssoc
iate
s (N
Z) L
td. U
naut
horis
ed u
se o
r rep
rodu
ctio
n of
this
pla
n ei
ther
who
lly o
r in
part
with
out w
ritte
n pe
rmis
sion
infri
nges
cop
yrig
ht.
©
Gol
der A
ssoc
iate
s (N
Z) L
td.
AQUATIC VALUES OF WATERWAYS IN THE STYX RIVER CATCHMENTIN RELATION TO PROPOSED DEVELOPMENT AREAS. 29NOVEMBER 2009
087813714PROJECT
TITLE
!
0 1 2 3 KilometersDatum: NZGD1949Projection: New Zealand Map Grid
K:\Graphics\Projects-numbered\2008\08781x\03xxx\087813714_CCC_StyxRiver_ICMP_Chch\nov09
Legend Proposed Ecological Survey Site
Styx River catchment
Watercourse
Ecological Values
Low
Moderate
High
Proposed Greenfield Development Plan Areas
Residential
Business

STYX ICMP ECOLOGY SURVEY (STAGE 2)
November 2009 Report No. 087813714 57
10.0 RECOMMENDATIONS
10.1 Catchment Management 10.1.1 Overview This study has identified stream localities of high ecological value in the Styx ICMP Area along with sections of moderate and low ecological value. Figure 29 shows ecological values for the Styx ICMP Area with potential future greenfield development areas overlain (RPS Change 1). The proposed areas for future greenfield development in the Styx ICMP Area include Belfast, West Belfast, East Belfast and Upper Styx. Waterways in these areas (The upper Styx River, upper Kaputone Creek and Smacks Creek) have moderate or high ecological values. Urban development in the Styx River catchment has the potential to degrade aquatic ecosystem health due to short-term and long-term disturbances. Short-term disturbances occur during the construction phase and include fine sediment deposition on streambeds caused by poor erosion and sediment control. Although the duration of sediment discharges may be short, deposited sediment persists in low-gradient spring-fed streams, resulting in poor quality aquatic habitat and long-term ecological effects. Long-term disturbances include changes in hydrology, riparian and instream habitat and reduced water and sediment quality from untreated stormwater discharges. Future urban development will therefore need to consider the aquatic values present when considering urban design features such as stormwater management.
10.1.2 Approach Catchment management recommendations for waterways within the Styx ICMP Area have been broadly divided into two objectives:
Protect waterways of high ecological value.
Enhance waterways of moderate and low ecological value. The main premise to protecting the key ecological areas identified above involves prevention or mitigation of the impacts of landuse intensification. However, as waterways are flowing systems, ensuring the protection of key ecological areas cannot occur without a catchment-based approach that considers all connected waterways upstream and downstream of these areas. This is because processes and impacts operating at a catchment scale may place overarching constraints on areas of particular importance. The same applies to enhancement of waterways in that while a particular site can be enhanced on a reach-scale by improving its physical habitat and establishing a planted riparian zone, factors operating upstream (such as untreated stormwater inputs, sources of sediment, etc) could continue to cause the ongoing deterioration of the site. Similarly, landuse and drainage activities downstream can have deleterious effects on aquatic ecosystems, by creating barriers to upstream migration of fish and macroinvertebrates. For catchments containing high ecological value sites, particular care should be given to ensuring best management practises are used for minimising construction effects. It is also important to protect (and enhance) waterways prior to urban development. If aquatic habitats and communities are left to decline further during the period of urbanisation it will be more costly and difficult (if possible at all) to retrospectively ‘enhance’ these systems and restore aquatic biota (Suren et al. 2005). A recent study of five Christchurch urban waterways indicated that, despite the restoration of areas of instream habitat and riparian vegetation, there has been little significant change to the aquatic invertebrate fauna five years after habitat restoration (Suren & McMurtrie 2005). They suggested that catchment-wide urban related factors such as sediment contamination and habitat isolation were preventing the natural establishment of a more diverse macroinvertebrate fauna. This reinforces the need to plan for mitigation on a catchment-wide scale and to set in place protection measures prior to urban development. The key to managing high ecological value sites in the current study is to manage the upstream catchment and to prevent degradation in water quality from further urban development.

STYX ICMP ECOLOGY SURVEY (STAGE 2)
November 2009 Report No. 087813714 58
10.1.3 Methods Catchment management recommendations can be largely regarded as current “standard best practice”. Mitigation measures recommended to ensure the appropriate level of protection for areas of ecological importance are summarised in Table 17. Table 17: A brief summary of measures for protecting and enhancing aquatic ecological values. Issue Mitigation and Protection Measures
Sediment entering waterway Ensure appropriate erosion and sediment control measures (and monitoring) during development, river and bank works to keep sediment input to a minimum (e.g., especially along the waterways in the upper catchment where urban expansion is occurring/ongoing). Fence off waterways from stock. Riparian planting and retirement of bare river banks.
Stormwater contamination and quantity control Appropriate stormwater treatment and attenuation (source and end of pipe). Stormwater should be directed into treatment systems (e.g., swales, soakage basins) instead of directly into waterways.
Habitat fragmentation Restoration projects should include migration corridors appropriate for the fauna they are protecting (e.g., adult aquatic insects typically only fly short distances, although this is influenced by vegetation types). Minimise barriers to fish and macroinvertebrate passage by following CCC (2003) culvert design guidelines when renewing culverts and weirs. Avoid use of culverts if upstream movement of adult insects is desired.
River maintenance Minimise macrophyte clearance in soft-bottomed streams (macrophytes provide the main habitat in these locations), or if removal is necessary, concentrate removal in the centre of the stream only and consider the means of removal. Minimise streambed disturbance and removal of detritus and small debris jams during routine maintenance.
Maintenance of hydraulic regime Minimise disturbance of existing hydraulic regime. Stormwater attenuation should not result in reduced baseflow.
Impermeable area Minimise increase in impervious area where possible. Minimise further drainage and lowering of the water table.
Stream restoration Maximise opportunities for habitat restoration, including riparian planting and naturalisation of stream channels (e.g., removal of timber or concrete lining of drains and increasing channel and substrate heterogeneity).

STYX ICMP ECOLOGY SURVEY (STAGE 2)
November 2009 Report No. 087813714 59
Unrecognised values Inform and educate the public of the ecological values of waterways that may be perceived as low value (or ecologically poor).
Much of this information is included in CCC (2003) “Waterways, Wetlands and Drainage Guide”, which should be referred to for further guidance. The management objective for most high ecological value sites should be to protect and maintain the macroinvertebrate and fish diversity and abundance. Appropriate riparian management and protection of instream habitat will assist in the protection of waterways that currently have high ecological values but would also aid in enhancing the overall value of the entire catchment long term. We understand that there are difficulties in protecting riparian margins along smaller waterways due to the limitations of the esplanade reserve policy (pers. com. Ken Couling, CCC) however in waterways with high to moderate aquatic ecological values riparian margins will be vital in maintaining the current aquatic values. For example:
To maximise upstream colonisation via adult insects such as caddisflies, maintaining (or creating) a riparian zone would be required. Research on the dispersal of adult caddisflies in forests alongside New Zealand streams indicates that the main area of activity was within 30 m of the stream edge (Collier & Smith, 1998). Enhancement of the riparian zone has occurred at Site SR3 and unofficial plantings between Styx Mill Reserve upstream to Gardiners Road are likely to be ongoing (e.g., private plantings). The protection,, maintenance and/or ongoing planting of riparian vegetation / margins along stream reaches containing high ecological values should be continued (or implemented).
The addition of coarse instream substratum to waterways has been suggested during the restoration of urban waterways to enhance the oviposition locations for aquatic insects (Blakey et al. 2006). This could also include the addition of woody debris.
In order to maintain or improve the populations of freshwater crayfish (in particular) the existing hydraulic regime of the Styx River through Styx Mill Reserve will need to be maintained in addition to protecting the riparian vegetation. This would involve protecting existing springs, current groundwater recharge levels and stable flow characteristics of the waterway network. The maintenance of existing flow regimes in general is critical for the protection of instream ecology.
Further, upstream and adjacent land development is a source of sediment and contaminants (e.g., from storm water) to the Styx River catchment. To protect the biota including the crayfish population at the Styx Mill reserve the prevention of direct storm water inputs and sediment inputs (catchment and bank) upstream should be kept to a minimum (as also mentioned in Table 17). Preventing stock access, via fencing would also be beneficial (e.g., Site KC2) which would help prevent bank erosion and thus reduce the amount of sediment entering the waterway.
Bank stabilisation, if required, should avoid any ‘hard’ measures as freshwater crayfish often dig burrows into stream banks. Natural stabilisation techniques are recommended, including the placement of upturned hardwood stumps, the placement of rocks that creates a rough edge with lots of ‘nooks and crannies’. Riparian plantings also act to stabilise the banks and over time canopy growth will help to increase the amount of stream shading. This in turn can also help reduce the growth of aquatic plants by limiting light which may assist in reducing the need for mechanical weed clearance.
The use of culverts over waterways in the currently non-urban upper Styx River and Smacks Creek is not recommended due to their potential effect on instream values. Culverts have been implicated as colonisation barriers for the upstream aerial movement of adult caddisflies (terrestrial stage) in Christchurch waterways (Blakey et al. 2006) and incorrectly designed culverts can hinder the upstream migration of weaker swimming fish (see Boubee et al. 1999 for a review). Bridges with a reasonable area of clearance over the channel should be used in the first instance (CCC 2003).
Opportunities for protection and enhancement of waterways should be maximised wherever site maintenance or modification is planned.

STYX ICMP ECOLOGY SURVEY (STAGE 2)
November 2009 Report No. 087813714 60
10.2 Monitoring Programme The Pressure-State-Response (PSR) framework was developed to analyse the interactions between environmental pressures, the state of the environment and environmental responses and it is used as a standard model for state of the environment reporting at local, regional, national and international scales (OECD 2004). The PSR framework requires monitoring not only of environmental pressures and state, but also monitoring of management responses, to provide feedback on the effectiveness of the environmental management framework. PSR was the recommended framework for future monitoring in the Integrated Monitoring Strategy for the Styx (Golder 2008b). Recommendations for pressure and state monitoring identified in the monitoring strategy should be used to guide ongoing ecological monitoring in the Styx ICMP Area. It is recommended that long term ecological monitoring is conducted in the Styx ICMP Area that is:
Consistent with that proposed under the South-West Christchurch ICMP;
Sufficient to determine whether receiving environment objectives developed as part of the Styx ICMP are being met;
Implements relevant recommendations in the Integrated Monitoring Strategy for the Styx (Golder 2008b) (i.e., compliments current monitoring effort); and
Includes sites in current rural and urban areas and in sections of waterways with high, moderate and low ecological values.
Builds on the current long term monitoring sites (i.e., ECan monitoring sites on Kaputone Creek, and at the Styx Mill Reserve), and sites identified and sampled by EOS Ecology (2008).
Includes monitoring sites downstream of proposed residential and business developments. For example, a monitoring site in the vicinity of Site KC3 would assist in the detection of degradation following further development of the Belfast business area and a monitoring site downstream of the Kaputone Creek confluence (e.g., Site SR4) would allow the effects of the Northlands/Papanui intensification area to be monitored. The Styx River, downstream of Marshlands Road, gets increasingly deep and can not always be sampled safely (or easily) and this should to be considered when planning future monitoring sites.
In order to determine whether there have been changes in macroinvertebrate communities over time analysis of macroinvertebrate community monitoring data should compare commonly used indices such as taxa richness, and the relative abundance of degradation sensitive orders specifically mayflies (Ephemeroptera) and caddisflies (Trichoptera). Further, macroinvertebrate abundance data could be analysed using multivariate analysis to investigate or detect change in macroinvertebrate communities between sampling occasions. There is currently no flow monitoring in the upper Styx catchment, however flow monitoring is strongly recommended for these waterways, given that both base flows and flood flows can be affected by urbanisation. For areas containing high ecological value sites (i.e., the upper Styx River), implementation of best management practises for minimising construction effects should be backed by regular monitoring of suspended and deposited fine sediment upstream and downstream of the development, coupled with ongoing biological monitoring to track any change in the aquatic ecosystem. While this report has discussed certain environmental pressures and measured the ecological state of waterways, it will be important to monitor the implementation and effectiveness of waterway protection and enhancement measures used. There is value in targeted monitoring of current (e.g., ECan long term monitoring site at Styx Mill Reserve) and proposed restoration sites, to properly evaluate the relative effects of development and the benefits of restoration.

STYX ICMP ECOLOGY SURVEY (STAGE 2)
November 2009 Report No. 087813714 61
11.0 REFERENCES Allibone, R.; Horrox, J.; Parkyn, S. 2001: Stream classification and instream objectives for Auckland’s urban streams. A report prepared for Auckland Regional Council. NIWA Client Report ARCC00257, May 2001.
ANZECC. 2000: Australian and New Zealand guidelines for fresh and marine water quality. National Water Quality Management Strategy Series, Vol 4. Australian and New Zealand Environment and Conservation Council, Artarmon.
Arnold, C. L. Jnr.; Gibbons, C. J. 1996: Impervious surface coverage the emergence of a key environmental indicator. Journal of the American Planning Association 62 243-258. Biggs B. J. F. 2000: New Zealand periphyton guideline: detecting, monitoring and managing enrichment of streams. Ministry for the Environment, Wellington. Biggs, B.J.F. Kilroy, C. 2000: Stream periphyton monitoring manual. Prepared for the Ministry for the Environment, Wellington.
Blakey, T. J., Harding, J. S., McIntosh, A. R., Winterbourn, M. J., 2006: Barriers to the recovery of aquatic insect communities in urban streams. Freshwater Biology, 51: 1634 – 1645.
Boffa Miskell, 2007: Belfast Integrated Catchment Management Study: Aquatic Ecology. Report prepared for the Christchurch City Council, August 2007.
Boothroyd I.; Stark J. 2000: Use of invertebrates in monitoring. In: Collier K. J.; Winterbourn M. J. eds. New Zealand stream invertebrates: ecology and implications for management, pp. 344-376. New Zealand Limnological Society, Christchurch. Boubee, J.; Jowett, I.; Nichols, S.; Williams. E., 1999. Fish Passage at Culverts. A Review, with Possible Solutions for New Zealand Indigenous Species. Joint NIWA and Department of Conservation Publication. Christchurch City Council 2003: Waterways, Wetlands and Drainage Guide- Ko Ta Anga Whakaora mo Nga Arawai Repo. Part B: Design. McMurtrie, S and Walter, J. (eds). Christchurch, Christchurch City Council. Collier, K. J., Smith, B. J., 1998: Dispersal of adult caddisflies (Trichoptera) into forests alongside three New Zealand streams. Hydrobiologia, 361: 53-65. Duggan I. C.; Collier K. J.; Lambert P. W. 2002: Evaluation of invertebrate biometrics and the influence of subsample size using data from some Westland, New Zealand, lowland streams. New Zealand Journal of Marine and Freshwater Research 36: 117-128. EOS Ecology, 2008: Long-term Monitoring of Aquatic Invertebrates in Christchurch’s Waterways: Otukaikino and Styx River Catchments 2008. Report prepared for Christchurch City Council. EOS Ecology Ltd; Aquatic Ecology Ltd; Kingett Mitchell Ltd, 2005: Aquatic Values and Management. South-West Christchurch Integrated Catchment Management Plan Technical Series, Report No. 3, July 2005. Report prepared on behalf of the Christchurch City Council. Eldon, G., A., Taylor, M.J., 1990: Fisheries Survey of the Styx River, Summer 1990, Ministry of Fisheries, Christchurch. New Zealand Freshwater Fisheries Report No 120. EnviroVentures Ltd; Diffuse Sources Ltd; Kingett Mitchell Ltd. 2006: Project Twin Streams pressure and state of the environment: synthesis. Report prepared for EcoWater Solutions. Environment Canterbury. 2004: Waimakariri River Regional Plan. Environment Canterbury Report R04/7, October 2004. Golder 2009a: Metal concentrations in the Styx River catchment 2007-2008. Report prepared on behalf of Christchurch City Council, June 2009. Golder 2009b: Styx Intergrated catchment Management Plan. Styx River Sediment Study. Report prepared on behalf of Christchurch City Council, June 2009. Golder 2008a: Rangiora ICMP Stage One – Ecology of the Three Brooks. Report prepared on behalf of Waimakariri District Council. June 2008. Golder 2008b: Styx catchment Monitoring Strategy – Background Research Associated with Stages 1-4. Report prepared on behalf of Christchurch City Council and Environment Canterbury. April 2008.

STYX ICMP ECOLOGY SURVEY (STAGE 2)
November 2009 Report No. 087813714 62
Hitchmough, R.; Bull, L.; Cromarty, P. 2007: New Zealand threat classification system lists - 2005, Department of Conservation, Wellington. Kingett Mitchell Ltd. 2005: Aquatic ecology and stream management groups for urban streams in the Wellington Region. Report prepared for Wellington Regional Council, June 2005. Langlands, P.; Elley, R. 2000: Survey of salmonid distribution and habitats in the Canterbury Region. Environment Canterbury Report U00/31. Main, M. 2008: An analysis of water quality data for Christchurch City waterways and the standards in the proposed natural resources regional plan. Report prepared by Aquatic Ecology Limited for Christchurch City Council. AEL Report No. 58. April 2008. Meredith, A. S.; Cottam, D.; Anthony, M,; Lavender, R. 2003: Ecosystem health of Canterbury Rivers: development and implementation of biotic and habitat assessment methods 1999/2000. Environment Canterbury Report RO3/3, March 2003. Meredith A. S.; Hayward S. A. 2002: An overview of the water quality of the rivers and streams of the Canterbury region. Environment Canterbury Report R02/25, November 2002. OECD 2004: OECD key environmental indicators. Organisation for Economic Co-operation and Development, Paris. Renard, T.; Meurk, C.; Phillips, C.; Ferriss, S.; Barrabe, A. 2004. Land Cover and Land Use Mapping of the Styx River catchment, April 2003 – June 2004. Report prepared for Christchurch City Council. Landcare Research, Lincoln. October 2004.
Robb, J. A. 1989: A biological survey of the Styx River catchment. Christchurch Drainage Board.
Schueler, T. R.; Claytor, D.; Zielinski, J. 1999: Better design as a stormwater management practice. Proceedings of the comprehensive stormwater and aquatic ecosystem management conference, February 22-26, Auckland. New Zealand Wastes and Water Association, Auckland. Pp. 11-23. Schueler, T. R. 1994: The importance of imperviousness. Watershed Protection techniques 1 100-111.
Stark J. D. 1985: A macroinvertebrate community index of water quality for stony streams. Water and Soil Miscellaneous Publication 87: 53 p.
Stark, J. D.; Maxted, J. R. 2007: A biotic index for New Zealand’s soft-bottomed streams. New Zealand Journal of Marine and Freshwater Research, 41:43-61. Stark J. D.; Boothroyd I. K. G.; Harding J. S.; Maxted J. R.; Scarsbrook M. R. 2001: Protocols for sampling macroinvertebrates in wadeable streams. New Zealand Macroinvertebrate Working Party Group Report No. 1. Ministry for the Environment, Wellington. Suren, A, M.; McMurtrie, S. 2005: Assessing the effectiveness of enhancement activities in urban streams: II. Responses of invertebrate communities. River Research and Applications 21: 439-453. Suren, A., M.; RIIS, T.; Biggs, B. J. F.; McMurtrie, S.; Barker, R. 2005: Assessing the effectiveness of enhancement activities in urban streams: I. Habitat Responses. River Research and Applications 21: 381-401.
Suren, A.; Elliot, E. 2004: Impacts of urbanization on streams. In: Harding, J. S.; Mosely, M. P.; Pearson, C. P.; Sorrel, B. K. eds., 2004. Freshwaters of New Zealand. New Zealand Hydrological Society Inc. and New Zealand Limnological Society Inc., Christchurch, New Zealand. Pp 35.1-35.18. Taylor, M., 2005a: Trout spawning survey in the Styx River: An update. Report prepared by AEL, October 2005. Taylor, M., 2005b: Inanga spawning in the Lower Styx River. Report prepared by AEL, May 2005. Taylor, M., Suren, A. M., Sorrell, B. K., 2000: A consideration of aspects of the Styx River ecology, and its implications for whole-river management. Report prepared by NIWA for Waterways and Wetland team, Water Service Unit, Christchurch City Council, May 2000. Taylor, M., 1999: Fish and Invertebrate values of the Styx River catchment: a strategic review. Report prepared by NIWA for Waterways and Wetland team, Water Service Unit, Christchurch City Council.

STYX ICMP ECOLOGY SURVEY (STAGE 2)
November 2009 Report No. 087813714 63
Taylor, M., McMurtrie, S. 2004: The aquatic ecology of the upper Kaputone Stream, and the effects of reduced flows. Aquatic Ecology Limited, Christchurch. USEPA 2004: Water quality standards handbook, 2nd edition. EPA publication No. EPA-823-B-94-003, August 2004. Usio, N. and C. R. Townsend. 2000. Distribution of the New Zealand crayfish Paranephrops zealandicus in relation to stream physico-chemistry, predatory fish, and invertebrate prey. New Zealand Journal of Marine and Freshwater Research 34:557–567. Van den Ende, W. C. 2007: Styx catchment Macrophyte Survey and Monitoring Program. Von Tippelskirch, M.; Hayward, M. 2005a: Horners /Tysons Stream. Natural Asset Condition Report prepared for the Christchurch City Council, CREAS Project. Von Tippelskirch, M.; Hayward, M. 2005b: Kaputone Creek. Natural Asset Condition Report prepared for the Christchurch City Council, CREAS Project. Von Tippelskirch, M.; Hayward, M. 2005c: Styx River / Pūrākaunui. Natural Asset Condition Report prepared for the Christchurch City Council, CREAS Project. Winterbourn M. J.; Gregson K. L. D.; Dolphin C. H. 2006: Guide to the aquatic insects of New Zealand, fourth edition. Bulletin of the Entomological Society of New Zealand 14. Young, R. G., Keeley, N. B., Shearer, K. A., Crowe, A. L. M., 2004: Impacts of diquat herbicide and mechanical excavation on spring-fed drains in Marlborough, New Zealand. Science for Conservation 240.

STYX ICMP ECOLOGY SURVEY (STAGE 2)
November 2009 Report No. 087813714
APPENDIX A Report Limitations

APPENDIX A Report Limitations
September 2009 Project No. 08781 3 714 1/2
REPORT LIMITATIONS This Document has been provided by Golder Associates (NZ) Ltd (“Golder”) subject to the following limitations: (i). This Document has been prepared for the particular purpose outlined in Golder’s proposal
and no responsibility is accepted for the use of this Document, in whole or in part, in other contexts or for any other purpose.
(ii). The scope and the period of Golder’s Services are as described in Golder’s proposal, and
are subject to restrictions and limitations. Golder did not perform a complete assessment of all possible conditions or circumstances that may exist at the site referenced in the Document. If a service is not expressly indicated, do not assume it has been provided. If a matter is not addressed, do not assume that any determination has been made by Golder in regards to it.
(iii). Conditions may exist which were undetectable given the limited nature of the enquiry Golder
was retained to undertake with respect to the site. Variations in conditions may occur between investigatory locations, and there may be special conditions pertaining to the site which have not been revealed by the investigation and which have not therefore been taken into account in the Document. Accordingly, additional studies and actions may be required.
(iv). In addition, it is recognised that the passage of time affects the information and assessment
provided in this Document. Golder’s opinions are based upon information that existed at the time of the production of the Document. It is understood that the Services provided allowed Golder to form no more than an opinion of the actual conditions of the site at the time the site was visited and cannot be used to assess the effect of any subsequent changes in the quality of the site, or its surroundings, or any laws or regulations.
(v). Any assessments made in this Document are based on the conditions indicated from
published sources and the investigation described. No warranty is included, either express or implied, that the actual conditions will conform exactly to the assessments contained in this Document.
(vi). Where data supplied by the client or other external sources, including previous site
investigation data, have been used, it has been assumed that the information is correct unless otherwise stated. No responsibility is accepted by Golder for incomplete or inaccurate data supplied by others.
(vii). The Client acknowledges that Golder may have retained subconsultants affiliated with
Golder to provide Services for the benefit of Golder. Golder will be fully responsible to the Client for the Services and work done by all of its subconsultants and subcontractors. The Client agrees that it will only assert claims against and seek to recover losses, damages or other liabilities from Golder and not Golder’s affiliated companies. To the maximum extent allowed by law, the Client acknowledges and agrees it will not have any legal recourse, and waives any expense, loss, claim, demand, or cause of action, against Golder’s affiliated companies, and their employees, officers and directors.
(viii). This Document is provided for sole use by the Client and is confidential to it and its
professional advisers. No responsibility whatsoever for the contents of this Document will be

APPENDIX A Report Limitations
September 2009 Project No. 08781 3 714 2/2
accepted to any person other than the Client. Any use which a third party makes of this Document, or any reliance on or decisions to be made based on it, is the responsibility of such third parties. Golder accepts no responsibility for damages, if any, suffered by any third party as a result of decisions made or actions based on this Document.
i:\projects-numbered\08781x\3xxx\087813714_ccc_styxriver_icmp_chch\styx ecological survey\reports (golder)\appendices\appendix a - report limitations.doc

STYX ICMP ECOLOGY SURVEY (STAGE 2)
November 2009 Report No. 087813714
APPENDIX B Site Selection Presentation to Christchurch City Council

NEW ZEALAND:tel +64 3 377 5696 fax. +64 3 377 9944www.golder.co.nz
Styx Ecology SurveySite Selection: April 2009
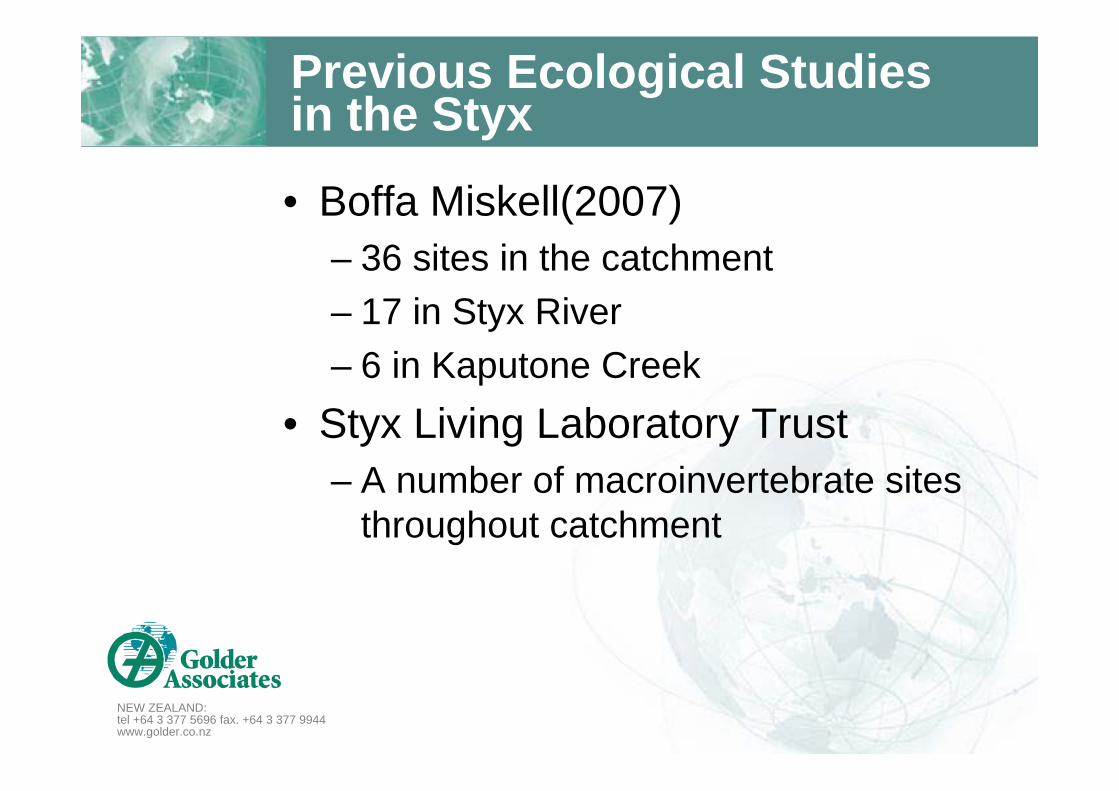
NEW ZEALAND:tel +64 3 377 5696 fax. +64 3 377 9944www.golder.co.nz
Previous Ecological Studies in the Styx
• Boffa Miskell(2007)– 36 sites in the catchment– 17 in Styx River– 6 in Kaputone Creek
• Styx Living Laboratory Trust– A number of macroinvertebrate sites
throughout catchment

NEW ZEALAND:tel +64 3 377 5696 fax. +64 3 377 9944www.golder.co.nz
CCC and ECan monitoring• CCC
– 7 longterm water quality sites• 5 in Styx River• 2 in Kaputone Creek• 1 in Smacks Creek
• ECan– Water quality
• 1 longterm site in Styx River (Teapes Rd)– Macroinvertebrates
• 2 longterm sites (Styx Mill Reserve and Kaputone Creek)

NEW ZEALAND:tel +64 3 377 5696 fax. +64 3 377 9944www.golder.co.nz
Landuse

NEW ZEALAND:tel +64 3 377 5696 fax. +64 3 377 9944www.golder.co.nz
Surface Waterways and Reticulated Network
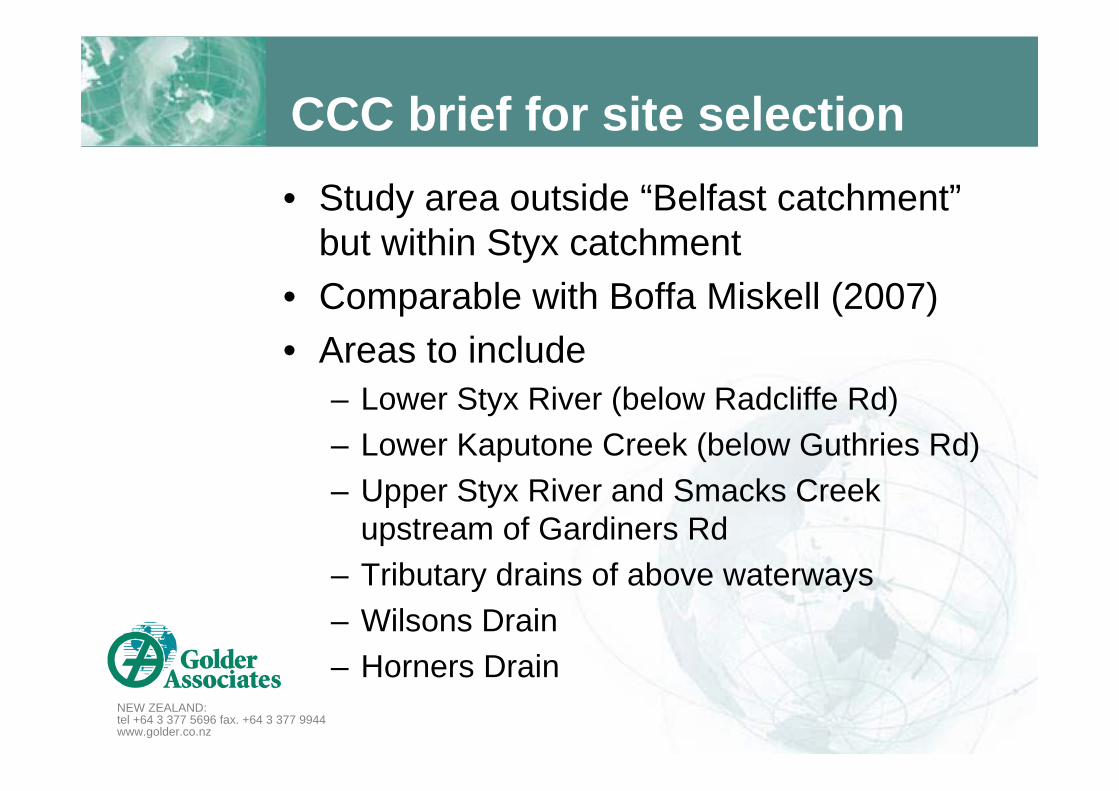
NEW ZEALAND:tel +64 3 377 5696 fax. +64 3 377 9944www.golder.co.nz
CCC brief for site selection• Study area outside “Belfast catchment”
but within Styx catchment• Comparable with Boffa Miskell (2007)• Areas to include
– Lower Styx River (below Radcliffe Rd)– Lower Kaputone Creek (below Guthries Rd)– Upper Styx River and Smacks Creek
upstream of Gardiners Rd– Tributary drains of above waterways– Wilsons Drain– Horners Drain

NEW ZEALAND:tel +64 3 377 5696 fax. +64 3 377 9944www.golder.co.nz
Proposed Ecological Survey Locations
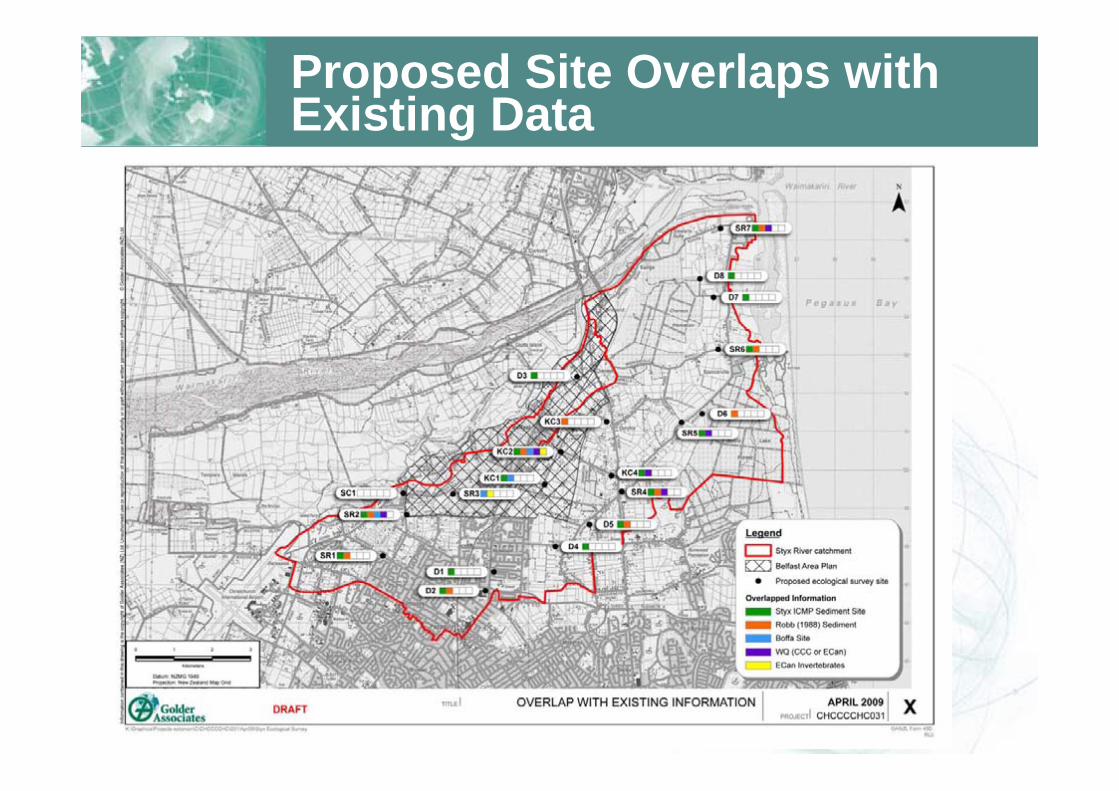
NEW ZEALAND:tel +64 3 377 5696 fax. +64 3 377 9944www.golder.co.nz
Proposed Site Overlaps with Existing Data

NEW ZEALAND:tel +64 3 377 5696 fax. +64 3 377 9944www.golder.co.nz
Examples of Styx River Sites- Gardiners Road (SR2)
Insert 1_Styx_ds1

NEW ZEALAND:tel +64 3 377 5696 fax. +64 3 377 9944www.golder.co.nz
Examples of Styx River Sites- Marshland Road (SR4)
Insert 3_Styx_ds

NEW ZEALAND:tel +64 3 377 5696 fax. +64 3 377 9944www.golder.co.nz
Examples of Styx River Sites- Spencerville Road (SR6)
Insert 4_Styx_ds

NEW ZEALAND:tel +64 3 377 5696 fax. +64 3 377 9944www.golder.co.nz
Examples of Styx River Sites- Kainga Road (SR7)
Insert 5_Styx_ds

NEW ZEALAND:tel +64 3 377 5696 fax. +64 3 377 9944www.golder.co.nz
Examples of Kaputone Creek Sites – Belfast Rd west (KC2)
Insert 15_Kaputone_ds1
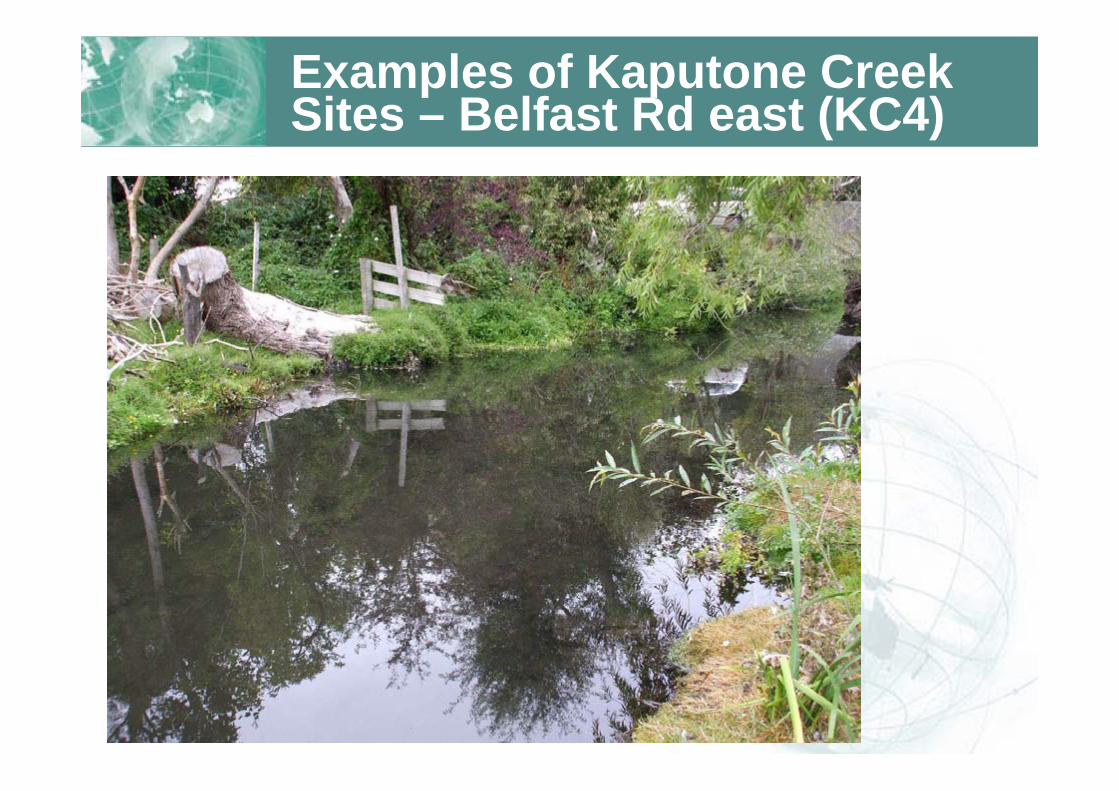
NEW ZEALAND:tel +64 3 377 5696 fax. +64 3 377 9944www.golder.co.nz
Examples of Kaputone Creek Sites – Belfast Rd east (KC4)
Insert 8_Kaputone_ds1

NEW ZEALAND:tel +64 3 377 5696 fax. +64 3 377 9944www.golder.co.nz
Examples of Drain Sites- Wilsons Drain (D3)
Insert 11_Wilsons_us
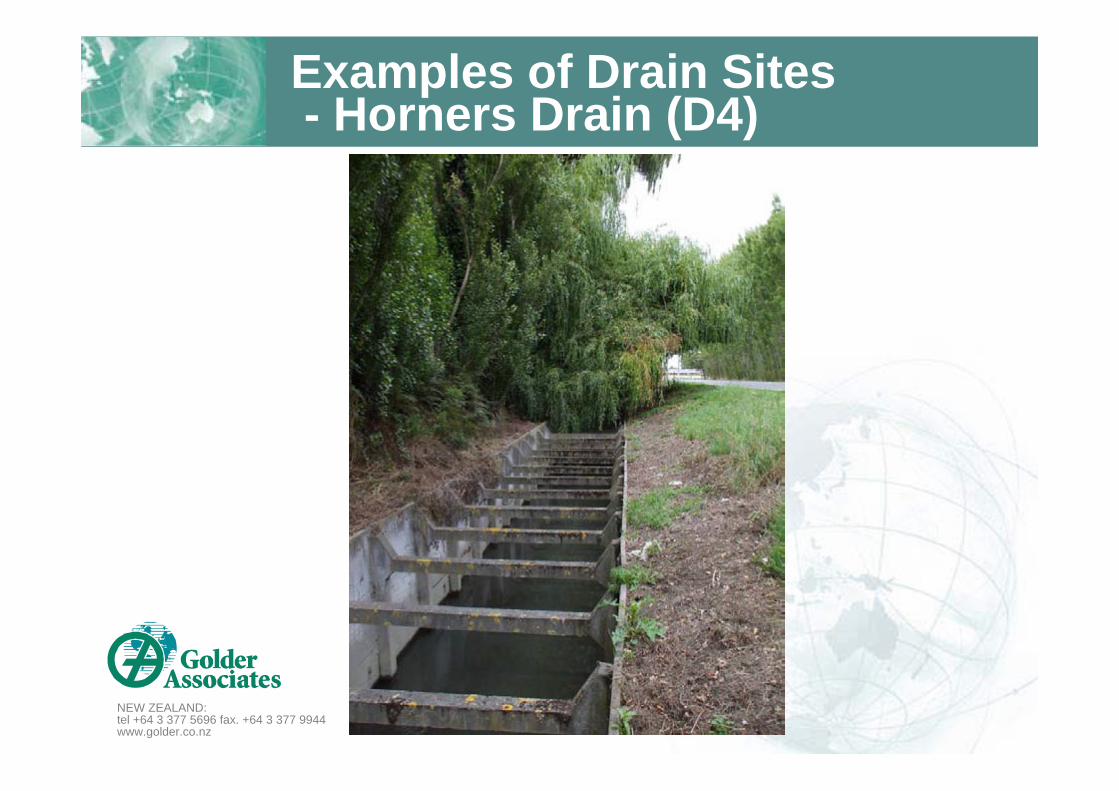
NEW ZEALAND:tel +64 3 377 5696 fax. +64 3 377 9944www.golder.co.nz
Examples of Drain Sites- Horners Drain (D4)
Insert 17_Horners_us
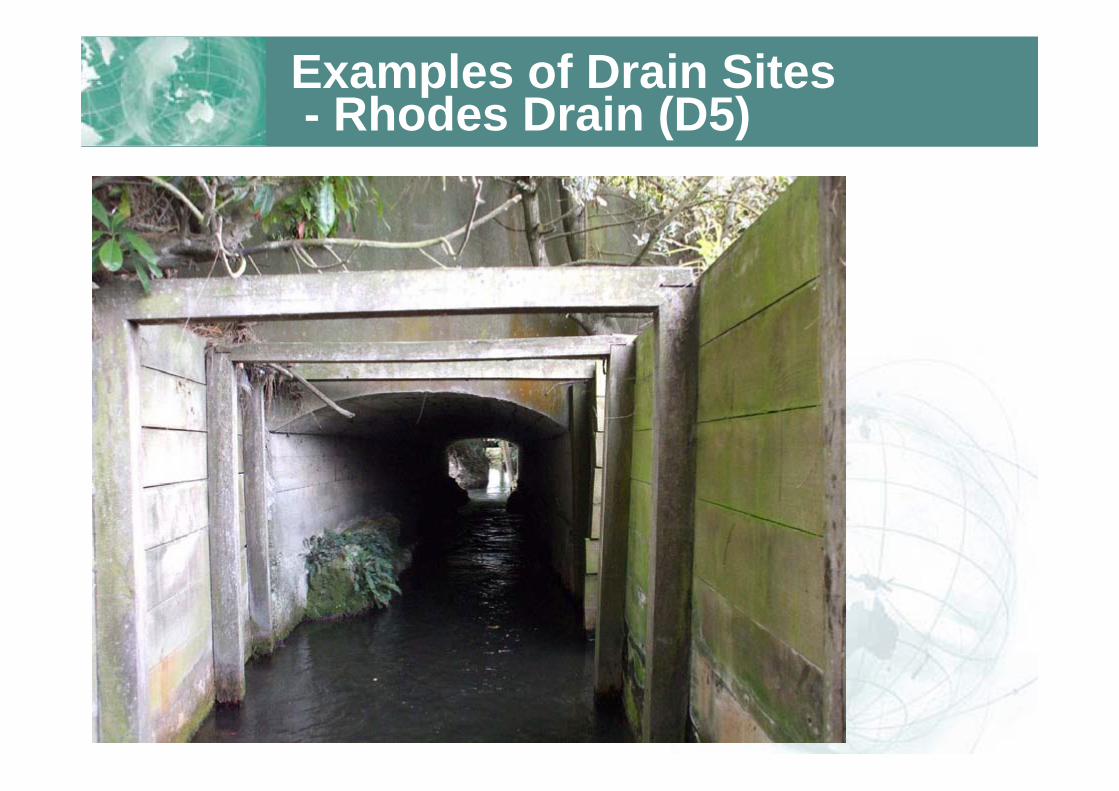
NEW ZEALAND:tel +64 3 377 5696 fax. +64 3 377 9944www.golder.co.nz
Examples of Drain Sites- Rhodes Drain (D5)
Insert 18_Rhodes_ds

NEW ZEALAND:tel +64 3 377 5696 fax. +64 3 377 9944www.golder.co.nz
Examples of Drain Sites- Spencerville Drain (D7)
Insert 20_Spencerville_ds

NEW ZEALAND:tel +64 3 377 5696 fax. +64 3 377 9944www.golder.co.nz
Sampling Locations 1-12Ecology Site No. Stream & Location
Styx ICMP Sediment
Site
Robb (1988)
SedimentBoffa Site
WQ (CCC or ECan)
ECan Invertebrates
Surrounding landuse
Upstream landuse
SR1 Styx River, Sawyers Arms Rd Urban Rural
SR2 Styx River, Gardiners Rd Rural Urban
SR3 Styx River, Styx Mill Conservation Reserve
SR4 Styx River, Marshlands Rd (downstream Kaputone confluence)
Rural Mix
SR5 Styx River, Teapes Rd Rural Mix
SR6 Styx River, Spencerville Rd Rural Mix
SR7 Styx River, Kainga Rd Rural Mix
SC1 Smacks Creek, Wilkinsons Rd Rural res. Rural res.
KC1 Kaputone Creek, Blakes Rd Urban Urban
KC2 Kaputone Creek, Belfast Rd (west) Rural Urban
KC3 Kaputone Creek, end of Fords Rd or Everglades Golf Course
Rural Rural
KC4 Kaputone Creek, Belfast Rd east Rural Mix
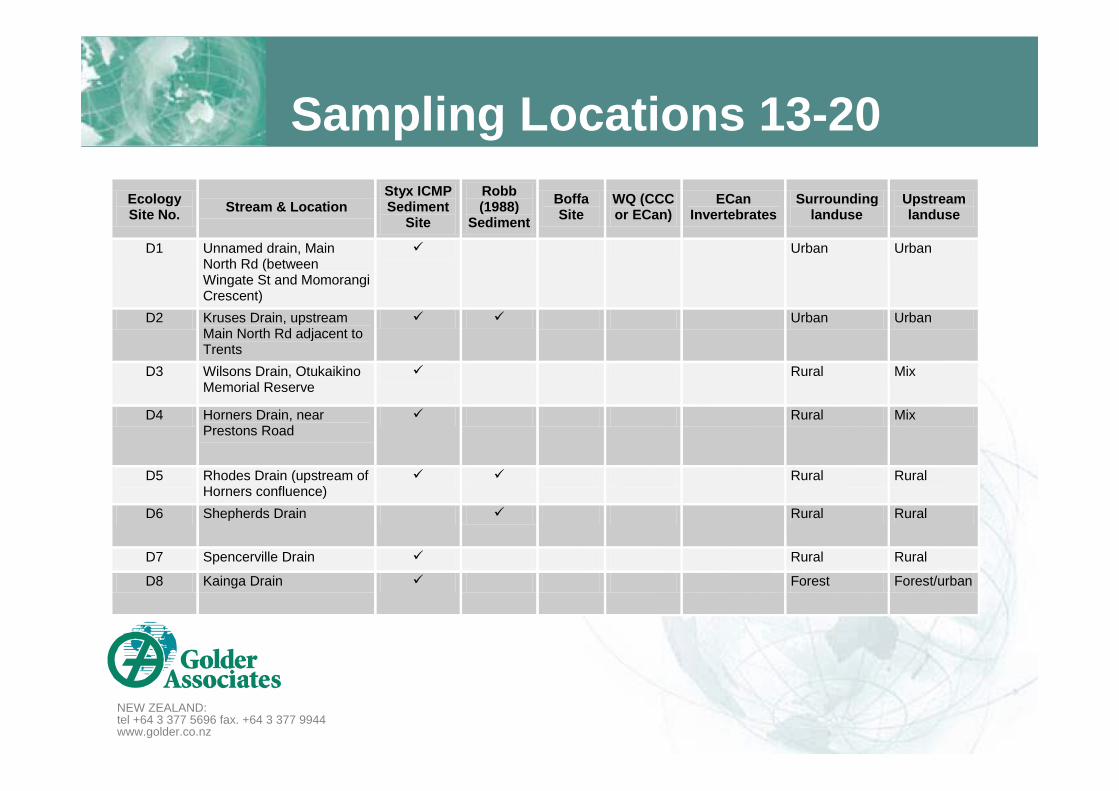
NEW ZEALAND:tel +64 3 377 5696 fax. +64 3 377 9944www.golder.co.nz
Sampling Locations 13-20Ecology Site No. Stream & Location
Styx ICMP Sediment
Site
Robb (1988)
SedimentBoffa Site
WQ (CCC or ECan)
ECan Invertebrates
Surrounding landuse
Upstream landuse
D1 Unnamed drain, Main North Rd (between Wingate St and Momorangi Crescent)
Urban Urban
D2 Kruses Drain, upstream Main North Rd adjacent to Trents
Urban Urban
D3 Wilsons Drain, Otukaikino Memorial Reserve
Rural Mix
D4 Horners Drain, near Prestons Road
Rural Mix
D5 Rhodes Drain (upstream of Horners confluence)
Rural Rural
D6 Shepherds Drain Rural Rural
D7 Spencerville Drain Rural Rural
D8 Kainga Drain Forest Forest/urban

NEW ZEALAND:tel +64 3 377 5696 fax. +64 3 377 9944www.golder.co.nz
Sampling Methods - Habitat
• ECan’s method– Comparable with Boffa Miskell (2007)– Comparable with South-West
Christchurch
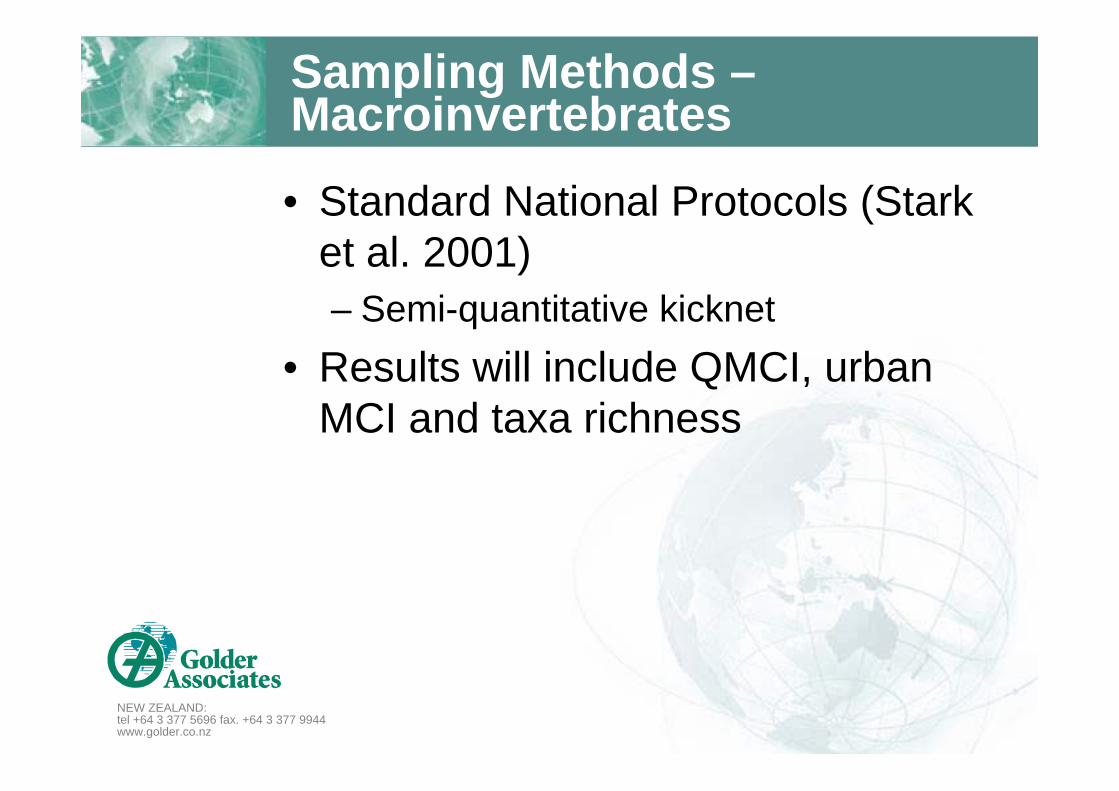
NEW ZEALAND:tel +64 3 377 5696 fax. +64 3 377 9944www.golder.co.nz
Sampling Methods –Macroinvertebrates
• Standard National Protocols (Stark et al. 2001)– Semi-quantitative kicknet
• Results will include QMCI, urban MCI and taxa richness

NEW ZEALAND:tel +64 3 377 5696 fax. +64 3 377 9944www.golder.co.nz
Sampling Methods - Fish
• Electro-fishing– 7 longterm water quality sites
• 5 in Styx River• 2 in Kaputone Creek• 1 in Smacks Creek
• Gee Minnow Traps • Fyke Nets

NEW ZEALAND:tel +64 3 377 5696 fax. +64 3 377 9944www.golder.co.nz
STYX ICMP ECOLOGY SURVEY (STAGE 2)
November 2009 Report No. 087813714
APPENDIX C Habitat Field Sheet Example

Habitat Assessment Sheet


STYX ICMP ECOLOGY SURVEY (STAGE 2)
November 2009 Report No. 087813714
APPENDIX D Photographs of Golder Aquatic Sampling Sites
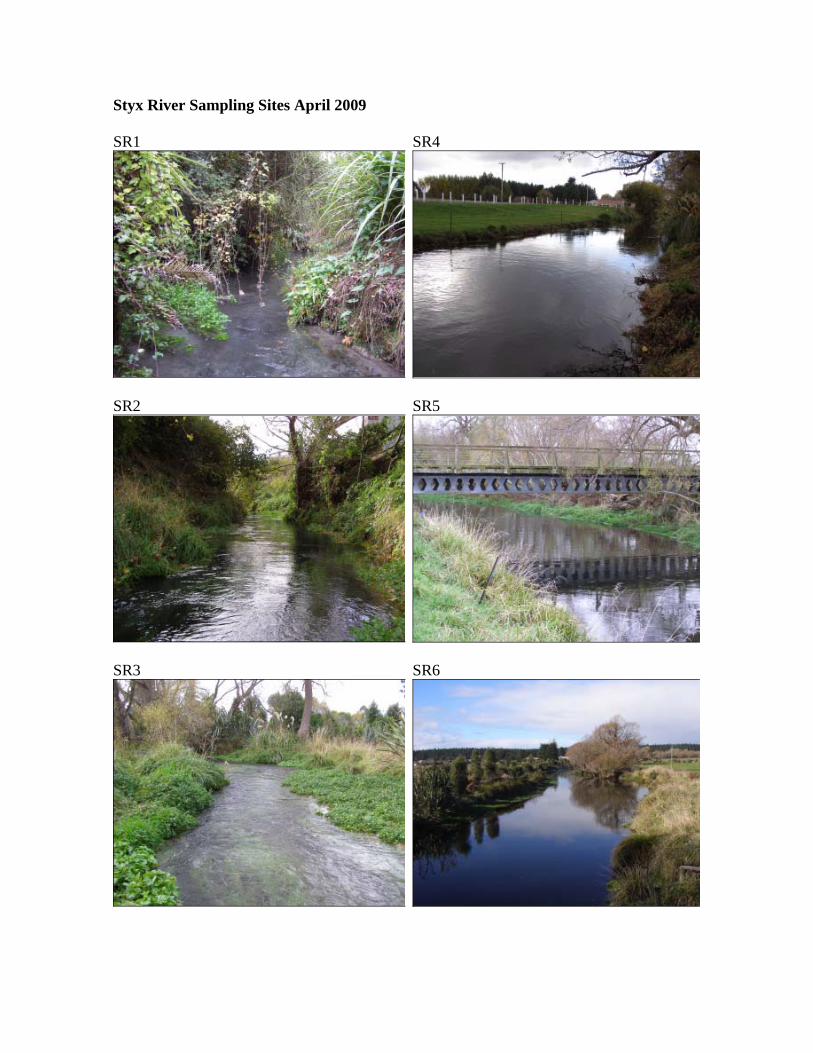
Styx River Sampling Sites April 2009 SR1
SR4
SR2
SR5
SR3
SR6
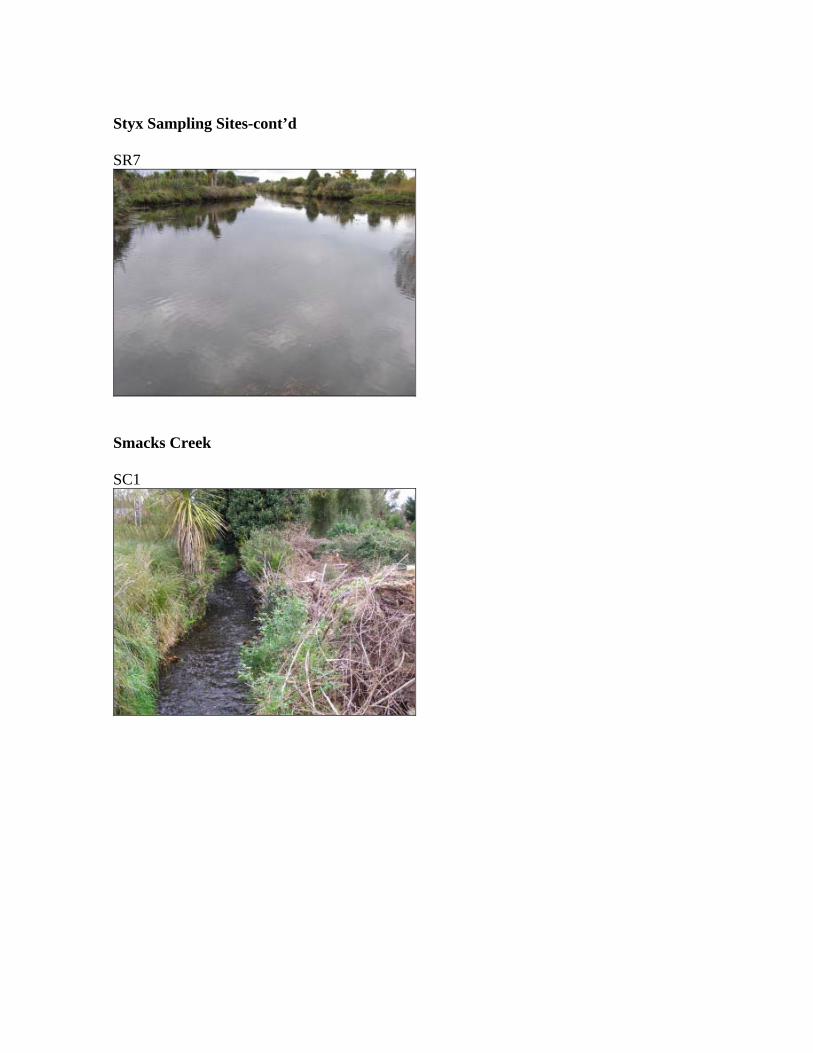
Styx Sampling Sites-cont’d SR7
Smacks Creek SC1

Kaputone Creek Sampling Sites KC1 KC3
KC2
KC4
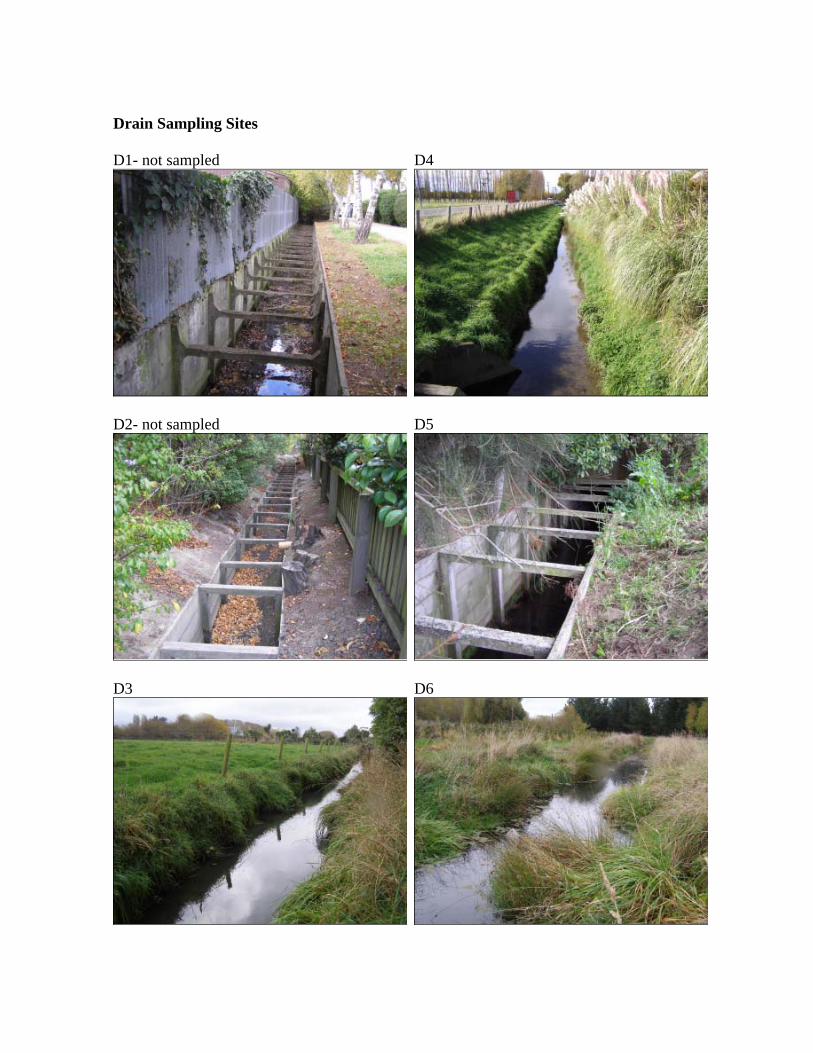
Drain Sampling Sites D1- not sampled
D4
D2- not sampled
D5
D3 D6

Drain Sampling Sites-cont’d D7
D8
STYX ICMP ECOLOGY SURVEY (STAGE 2)
November 2009 Report No. 087813714
APPENDIX E Spearman Rank Correlation Results

SPEARMAN RANK CORRELATION: HABITAT VARIABLES
Velocity (m Temp (°C) DO (mg/L) DO (%) pHCond
(µS/cm)Av. Width
(m)Av. Depth
(m)Large cobble
Small cobble
Large gravel MLG SMG SG Silt-sand Wood
Shading (%)
Long green fils
% Macrophyt
e cover
CatchHab Total score
RipHab Total score
Reachhab Total score
InstreamHab Total
scoreTemp (°C) 0.48DO (mg/L) 0.26 0.20DO (%) 0.15 0.33 0.98pH -0.23 0.01 0.50 0.49Cond (µS/cm) -0.61 -0.36 -0.48 -0.50 -0.12Av. Width (m) -0.16 -0.55 -0.20 -0.30 0.27 0.48Av. Depth (m) -0.27 -0.48 -0.11 -0.18 0.01 0.09 0.51Large cobble 0.58 0.50 0.00 0.05 -0.37 -0.30 -0.34 -0.33Small cobble 0.84 0.39 0.04 0.05 -0.32 -0.54 -0.49 -0.37 0.68Large gravel 0.59 0.53 0.12 0.16 -0.53 -0.44 -0.74 -0.36 0.69 0.76MLG 0.59 0.24 -0.01 -0.02 -0.50 -0.30 -0.53 -0.40 0.54 0.73 0.80SMG 0.59 0.28 -0.02 -0.03 -0.51 -0.04 -0.26 -0.35 0.80 0.58 0.66 0.72SG 0.42 0.12 0.31 0.25 -0.03 -0.19 -0.21 -0.17 0.44 0.29 0.39 0.34 0.63Silt-sand -0.73 -0.52 -0.17 -0.18 0.36 0.57 0.62 0.37 -0.71 -0.85 -0.89 -0.76 -0.66 -0.58Wood -0.26 0.01 -0.30 -0.30 -0.19 0.08 -0.01 -0.18 -0.27 -0.09 -0.07 0.11 -0.24 -0.34 -0.01Shading (%) 0.08 0.35 -0.07 -0.02 -0.34 -0.47 -0.53 -0.35 0.51 0.45 0.53 0.36 0.31 0.24 -0.63 0.37% Long green fils -0.17 -0.48 -0.48 -0.52 -0.35 0.38 0.12 -0.02 -0.16 0.17 -0.08 0.08 -0.04 -0.28 0.15 0.02 -0.18% Macrophyte cover -0.01 -0.51 -0.52 -0.60 -0.48 0.56 0.41 0.40 0.02 -0.06 -0.09 0.01 0.32 0.11 0.15 -0.27 -0.29 0.59CatchHab Total score 0.12 -0.35 0.13 0.09 -0.12 -0.45 -0.06 -0.05 0.06 0.32 0.13 0.25 0.09 0.14 -0.22 -0.08 0.28 0.40 0.09RipHab Total score 0.20 -0.21 0.00 -0.07 0.03 -0.28 0.17 0.07 0.39 0.43 0.12 0.21 0.29 0.22 -0.22 -0.43 0.12 0.16 0.15 0.39Reachhab Total score 0.40 0.39 -0.17 -0.17 -0.41 -0.18 -0.10 -0.17 0.70 0.57 0.59 0.61 0.61 0.22 -0.68 0.31 0.54 -0.15 0.01 -0.04 0.23InstreamHab Total score 0.36 0.53 0.18 0.21 -0.43 -0.54 -0.67 -0.40 0.69 0.68 0.91 0.80 0.63 0.45 -0.91 0.09 0.66 -0.27 -0.26 0.15 0.18 0.71Total habitat score 0.29 0.19 -0.14 -0.16 -0.42 -0.31 -0.20 -0.20 0.71 0.68 0.66 0.80 0.66 0.28 -0.72 0.12 0.49 0.00 0.04 0.24 0.52 0.88 0.78
Notes: n=18rs p
0.47 0.050.50 0.03460.59 0.010.79 0.0001

SPEARMAN RANK CORRELATIONS: HABITAT AND FIELD MEASURED WATER QUALITY AND BIOLOG
Velocity (mTemp (°C) DO (mg/L) DO (%) pH Cond (µS/cAv. Width (Av. Depth (Large cobbSmall cobbLarge grav MLG SMG SG Silt-sand Wood %Shade %LGFA %Macroph TR MCI QMCI MCIsb QMCIsb EPT % EPT EphemeropTrichopteraDiptera Crustacea Mollusca Oligochaet CatchHab RipHab To Reachhab InstreamHab Total scoreTemp (°C) 0.48DO (mg/L) 0.26 0.20DO (%) 0.15 0.33 0.98pH -0.23 0.01 0.50 0.49Cond (µS/c -0.61 -0.36 -0.48 -0.50 -0.12Av. Width ( -0.16 -0.55 -0.20 -0.30 0.27 0.48Av. Depth ( -0.27 -0.48 -0.11 -0.18 0.01 0.09 0.51Large cobb 0.58 0.50 0.00 0.05 -0.37 -0.30 -0.34 -0.33Small cobb 0.84 0.39 0.04 0.05 -0.32 -0.54 -0.49 -0.37 0.68Large grav 0.59 0.53 0.12 0.16 -0.53 -0.44 -0.74 -0.36 0.69 0.76MLG 0.59 0.24 -0.01 -0.02 -0.50 -0.30 -0.53 -0.40 0.54 0.73 0.80SMG 0.59 0.28 -0.02 -0.03 -0.51 -0.04 -0.26 -0.35 0.80 0.58 0.66 0.72SG 0.42 0.12 0.31 0.25 -0.03 -0.19 -0.21 -0.17 0.44 0.29 0.39 0.34 0.63Silt-sand -0.73 -0.52 -0.17 -0.18 0.36 0.57 0.62 0.37 -0.71 -0.85 -0.89 -0.76 -0.66 -0.58Wood -0.26 0.01 -0.30 -0.30 -0.19 0.08 -0.01 -0.18 -0.27 -0.09 -0.07 0.11 -0.24 -0.34 -0.01%Shade 0.08 0.35 -0.07 -0.02 -0.34 -0.47 -0.53 -0.35 0.51 0.45 0.53 0.36 0.31 0.24 -0.63 0.37% LFGA -0.17 -0.48 -0.48 -0.52 -0.35 0.38 0.12 -0.02 -0.16 0.17 -0.08 0.08 -0.04 -0.28 0.15 0.02 -0.18% Macroph -0.01 -0.51 -0.52 -0.60 -0.48 0.56 0.41 0.40 0.02 -0.06 -0.09 0.01 0.32 0.11 0.15 -0.27 -0.29 0.59TR 0.19 -0.13 0.04 0.02 -0.30 -0.03 -0.01 0.31 0.08 0.01 0.27 0.36 0.31 -0.02 -0.01 -0.39 -0.31 0.05 0.40MCI 0.66 0.28 0.16 0.16 -0.30 -0.55 -0.48 -0.31 0.57 0.73 0.68 0.71 0.57 0.49 -0.84 0.20 0.68 -0.07 -0.16 -0.02QMCI 0.49 -0.08 0.14 0.05 -0.01 -0.40 0.01 0.08 0.21 0.39 0.26 0.48 0.37 0.64 -0.55 0.01 0.21 -0.13 0.04 0.08 0.67MCIsb 0.63 0.26 0.11 0.12 -0.30 -0.51 -0.43 -0.24 0.57 0.66 0.63 0.66 0.53 0.46 -0.79 0.22 0.66 -0.11 -0.15 -0.04 0.99 0.67QMCIsb 0.49 -0.16 0.08 -0.02 -0.04 -0.35 0.07 0.17 0.16 0.37 0.21 0.46 0.34 0.59 -0.50 0.03 0.15 -0.07 0.12 0.08 0.64 0.99 0.65EPT 0.64 0.26 0.21 0.21 -0.25 -0.53 -0.43 -0.38 0.51 0.63 0.60 0.78 0.60 0.51 -0.78 0.23 0.55 -0.14 -0.20 0.07 0.94 0.72 0.92 0.69% EPT 0.76 0.47 0.15 0.15 -0.14 -0.58 -0.50 -0.44 0.66 0.86 0.71 0.70 0.64 0.54 -0.88 -0.02 0.62 -0.13 -0.20 -0.07 0.82 0.55 0.76 0.49 0.76Ephemerop 0.52 0.16 -0.05 -0.06 -0.61 -0.32 -0.36 -0.41 0.51 0.65 0.61 0.81 0.67 0.26 -0.62 0.16 0.43 0.22 0.06 0.23 0.65 0.43 0.59 0.40 0.73 0.61Trichoptera 0.34 0.35 0.04 0.07 -0.48 -0.39 -0.74 -0.20 0.48 0.60 0.74 0.49 0.49 0.37 -0.65 -0.25 0.51 0.13 0.12 0.19 0.46 0.05 0.38 0.03 0.33 0.61 0.45Diptera -0.32 -0.24 -0.06 -0.11 0.39 0.20 0.37 0.39 -0.23 -0.25 -0.50 -0.46 -0.41 -0.24 0.35 0.13 -0.14 -0.04 0.00 -0.42 -0.33 -0.29 -0.30 -0.18 -0.39 -0.26 -0.58 -0.27Crustacea 0.35 -0.16 0.04 -0.03 0.08 -0.09 0.34 0.41 0.17 0.24 0.00 0.14 0.13 0.26 -0.23 -0.02 -0.09 0.00 0.16 -0.03 0.43 0.68 0.51 0.73 0.39 0.19 0.04 -0.27 0.14Mollusca -0.32 0.06 -0.24 -0.20 -0.25 0.21 -0.03 -0.15 -0.13 -0.28 0.00 0.13 0.02 -0.38 0.28 0.06 -0.19 -0.03 0.02 0.49 -0.46 -0.42 -0.49 -0.46 -0.28 -0.31 0.17 -0.07 -0.34 -0.67Oligochaet -0.20 0.35 0.08 0.17 0.16 0.04 -0.44 -0.72 0.09 0.01 0.01 -0.13 -0.03 -0.02 -0.01 0.07 0.26 0.02 -0.32 -0.47 -0.09 -0.51 -0.14 -0.56 -0.09 0.05 -0.12 0.21 0.11 -0.63 0.04CatchHab 0.12 -0.35 0.13 0.09 -0.12 -0.45 -0.06 -0.05 0.06 0.32 0.13 0.25 0.09 0.14 -0.22 -0.08 0.28 0.40 0.09 0.17 0.47 0.46 0.43 0.43 0.44 0.31 0.51 0.22 -0.44 0.16 -0.19 -0.20RipHab To 0.20 -0.21 0.00 -0.07 0.03 -0.28 0.17 0.07 0.39 0.43 0.12 0.21 0.29 0.22 -0.22 -0.43 0.12 0.16 0.15 0.08 0.10 0.26 0.04 0.24 0.07 0.40 0.31 0.19 0.07 0.10 -0.02 -0.23 0.39Reachhab 0.40 0.39 -0.17 -0.17 -0.41 -0.18 -0.10 -0.17 0.70 0.57 0.59 0.61 0.61 0.22 -0.68 0.31 0.54 -0.15 0.01 0.04 0.60 0.34 0.60 0.32 0.56 0.59 0.51 0.19 -0.06 0.33 -0.05 -0.18 -0.04 0.23InstreamHa 0.36 0.53 0.18 0.21 -0.43 -0.54 -0.67 -0.40 0.69 0.68 0.91 0.80 0.63 0.45 -0.91 0.09 0.66 -0.27 -0.26 0.16 0.72 0.39 0.67 0.31 0.72 0.73 0.66 0.59 -0.43 0.01 0.05 0.03 0.15 0.18 0.71Total habita 0.29 0.19 -0.14 -0.16 -0.42 -0.31 -0.20 -0.20 0.71 0.68 0.66 0.80 0.66 0.28 -0.72 0.12 0.49 0.00 0.04 0.23 0.63 0.47 0.61 0.43 0.64 0.67 0.68 0.30 -0.21 0.26 0.07 -0.24 0.24 0.52 0.88 0.78Fish taxa ri 0.31 0.20 0.10 0.12 0.12 0.11 0.12 0.09 0.05 -0.02 -0.21 -0.35 -0.09 -0.09 0.19 -0.19 -0.35 0.00 0.02 -0.25 -0.25 -0.38 -0.24 -0.30 -0.27 -0.16 -0.22 0.02 0.43 0.04 -0.25 0.20 -0.40 -0.14 -0.20 -0.34 -0.40
Notes: n=18rs p
0.47 0.050.50 0.03460.59 0.010.79 0.0001
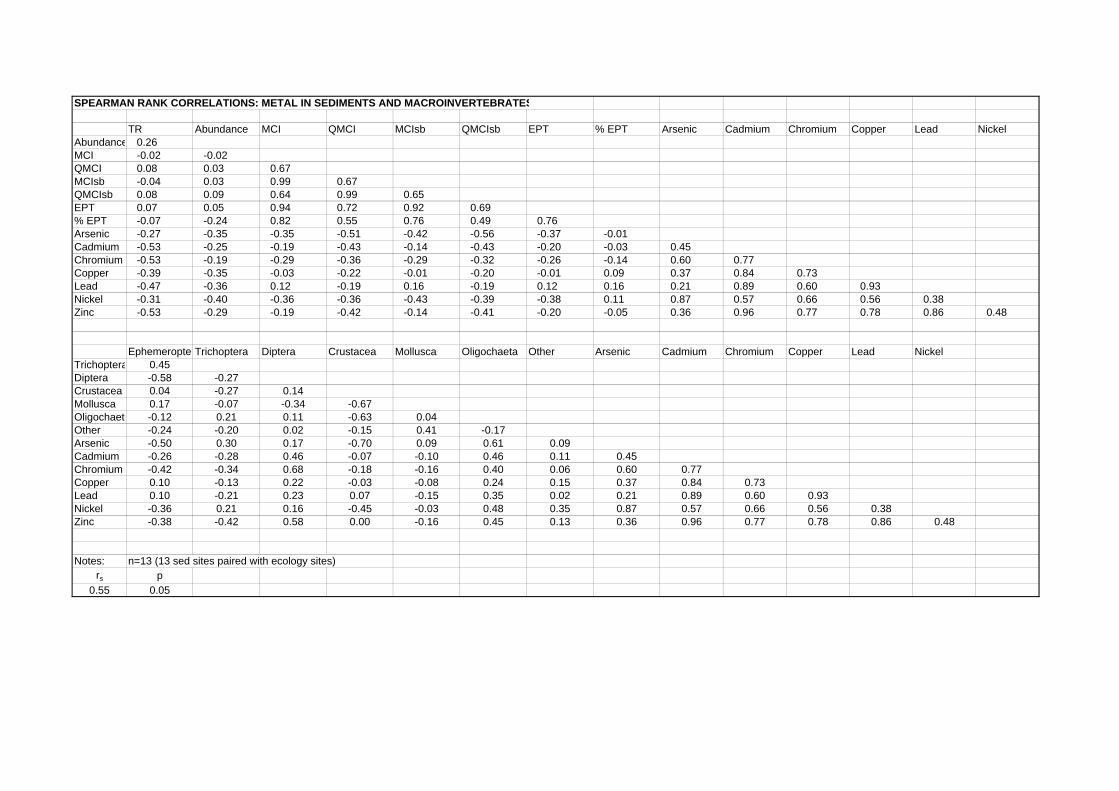
SPEARMAN RANK CORRELATIONS: METAL IN SEDIMENTS AND MACROINVERTEBRATES
TR Abundance MCI QMCI MCIsb QMCIsb EPT % EPT Arsenic Cadmium Chromium Copper Lead NickelAbundance 0.26MCI -0.02 -0.02QMCI 0.08 0.03 0.67MCIsb -0.04 0.03 0.99 0.67QMCIsb 0.08 0.09 0.64 0.99 0.65EPT 0.07 0.05 0.94 0.72 0.92 0.69% EPT -0.07 -0.24 0.82 0.55 0.76 0.49 0.76Arsenic -0.27 -0.35 -0.35 -0.51 -0.42 -0.56 -0.37 -0.01Cadmium -0.53 -0.25 -0.19 -0.43 -0.14 -0.43 -0.20 -0.03 0.45Chromium -0.53 -0.19 -0.29 -0.36 -0.29 -0.32 -0.26 -0.14 0.60 0.77Copper -0.39 -0.35 -0.03 -0.22 -0.01 -0.20 -0.01 0.09 0.37 0.84 0.73Lead -0.47 -0.36 0.12 -0.19 0.16 -0.19 0.12 0.16 0.21 0.89 0.60 0.93Nickel -0.31 -0.40 -0.36 -0.36 -0.43 -0.39 -0.38 0.11 0.87 0.57 0.66 0.56 0.38Zinc -0.53 -0.29 -0.19 -0.42 -0.14 -0.41 -0.20 -0.05 0.36 0.96 0.77 0.78 0.86 0.48
EphemeropterTrichoptera Diptera Crustacea Mollusca Oligochaeta Other Arsenic Cadmium Chromium Copper Lead NickelTrichoptera 0.45Diptera -0.58 -0.27Crustacea 0.04 -0.27 0.14Mollusca 0.17 -0.07 -0.34 -0.67Oligochaeta -0.12 0.21 0.11 -0.63 0.04Other -0.24 -0.20 0.02 -0.15 0.41 -0.17Arsenic -0.50 0.30 0.17 -0.70 0.09 0.61 0.09Cadmium -0.26 -0.28 0.46 -0.07 -0.10 0.46 0.11 0.45Chromium -0.42 -0.34 0.68 -0.18 -0.16 0.40 0.06 0.60 0.77Copper 0.10 -0.13 0.22 -0.03 -0.08 0.24 0.15 0.37 0.84 0.73Lead 0.10 -0.21 0.23 0.07 -0.15 0.35 0.02 0.21 0.89 0.60 0.93Nickel -0.36 0.21 0.16 -0.45 -0.03 0.48 0.35 0.87 0.57 0.66 0.56 0.38Zinc -0.38 -0.42 0.58 0.00 -0.16 0.45 0.13 0.36 0.96 0.77 0.78 0.86 0.48
Notes: n=13 (13 sed sites paired with ecology sites)rs p
0.55 0.05

STYX ICMP ECOLOGY SURVEY (STAGE 2)
November 2009 Report No. 087813714
APPENDIX F Raw Macroinverterbrate Data
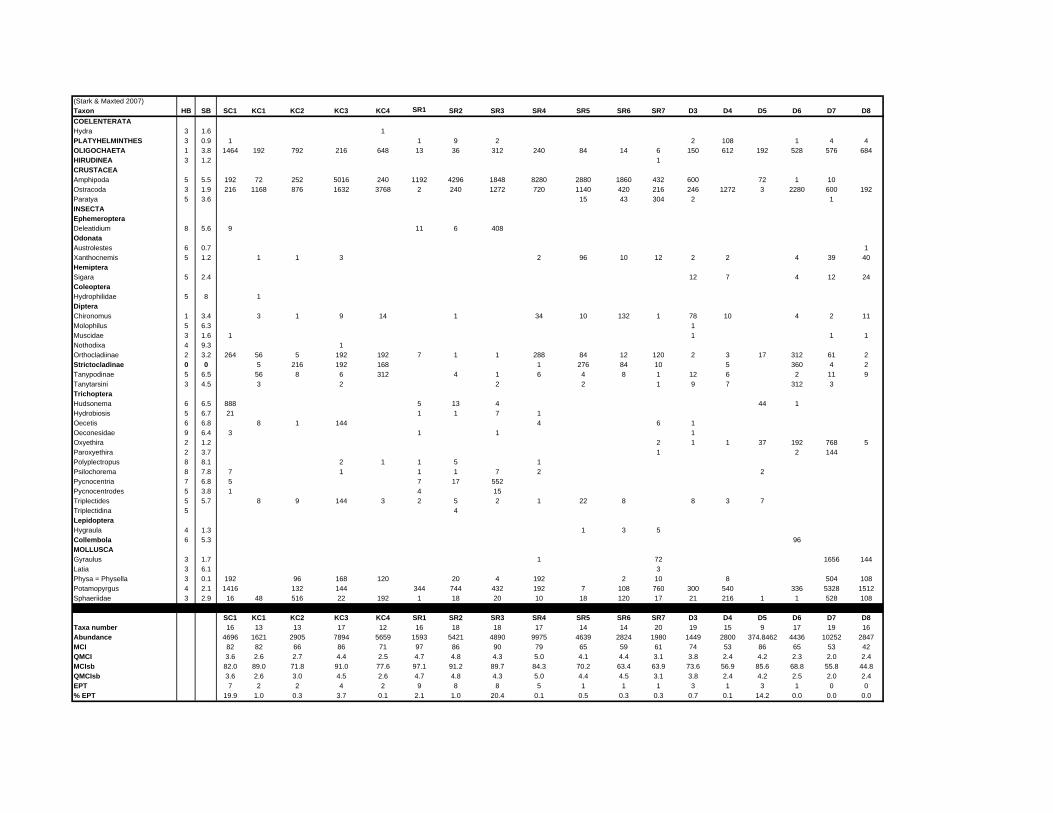
(Stark & Maxted 2007)Taxon HB SB SC1 KC1 KC2 KC3 KC4 SR1 SR2 SR3 SR4 SR5 SR6 SR7 D3 D4 D5 D6 D7 D8COELENTERATAHydra 3 1.6 1PLATYHELMINTHES 3 0.9 1 1 9 2 2 108 1 4 4OLIGOCHAETA 1 3.8 1464 192 792 216 648 13 36 312 240 84 14 6 150 612 192 528 576 684HIRUDINEA 3 1.2 1CRUSTACEAAmphipoda 5 5.5 192 72 252 5016 240 1192 4296 1848 8280 2880 1860 432 600 72 1 10Ostracoda 3 1.9 216 1168 876 1632 3768 2 240 1272 720 1140 420 216 246 1272 3 2280 600 192Paratya 5 3.6 15 43 304 2 1INSECTAEphemeropteraDeleatidium 8 5.6 9 11 6 408OdonataAustrolestes 6 0.7 1Xanthocnemis 5 1.2 1 1 3 2 96 10 12 2 2 4 39 40HemipteraSigara 5 2.4 12 7 4 12 24ColeopteraHydrophilidae 5 8 1DipteraChironomus 1 3.4 3 1 9 14 1 34 10 132 1 78 10 4 2 11Molophilus 5 6.3 1Muscidae 3 1.6 1 1 1 1Nothodixa 4 9.3 1Orthocladiinae 2 3.2 264 56 5 192 192 7 1 1 288 84 12 120 2 3 17 312 61 2Strictocladinae 0 0 5 216 192 168 1 276 84 10 5 360 4 2Tanypodinae 5 6.5 56 8 6 312 4 1 6 4 8 1 12 6 2 11 9Tanytarsini 3 4.5 3 2 2 2 1 9 7 312 3TrichopteraHudsonema 6 6.5 888 5 13 4 44 1Hydrobiosis 5 6.7 21 1 1 7 1Oecetis 6 6.8 8 1 144 4 6 1Oeconesidae 9 6.4 3 1 1 1Oxyethira 2 1.2 2 1 1 37 192 768 5Paroxyethira 2 3.7 1 2 144Polyplectropus 8 8.1 2 1 1 5 1Psilochorema 8 7.8 7 1 1 1 7 2 2Pycnocentria 7 6.8 5 7 17 552Pycnocentrodes 5 3.8 1 4 15Triplectides 5 5.7 8 9 144 3 2 5 2 1 22 8 8 3 7Triplectidina 5 4LepidopteraHygraula 4 1.3 1 3 5Collembola 6 5.3 96MOLLUSCAGyraulus 3 1.7 1 72 1656 144Latia 3 6.1 3Physa = Physella 3 0.1 192 96 168 120 20 4 192 2 10 8 504 108Potamopyrgus 4 2.1 1416 132 144 344 744 432 192 7 108 760 300 540 336 5328 1512Sphaeriidae 3 2.9 16 48 516 22 192 1 18 20 10 18 120 17 21 216 1 1 528 108
SC1 KC1 KC2 KC3 KC4 SR1 SR2 SR3 SR4 SR5 SR6 SR7 D3 D4 D5 D6 D7 D8Taxa number 16 13 13 17 12 16 18 18 17 14 14 20 19 15 9 17 19 16Abundance 4696 1621 2905 7894 5659 1593 5421 4890 9975 4639 2824 1980 1449 2800 374.8462 4436 10252 2847MCI 82 82 66 86 71 97 86 90 79 65 59 61 74 53 86 65 53 42QMCI 3.6 2.6 2.7 4.4 2.5 4.7 4.8 4.3 5.0 4.1 4.4 3.1 3.8 2.4 4.2 2.3 2.0 2.4MCIsb 82.0 89.0 71.8 91.0 77.6 97.1 91.2 89.7 84.3 70.2 63.4 63.9 73.6 56.9 85.6 68.8 55.8 44.8QMCIsb 3.6 2.6 3.0 4.5 2.6 4.7 4.8 4.3 5.0 4.4 4.5 3.1 3.8 2.4 4.2 2.5 2.0 2.4EPT 7 2 2 4 2 9 8 8 5 1 1 1 3 1 3 1 0 0% EPT 19.9 1.0 0.3 3.7 0.1 2.1 1.0 20.4 0.1 0.5 0.3 0.3 0.7 0.1 14.2 0.0 0.0 0.0

AfricaAsiaAustralia &New ZealandEuropeNorth AmericaSouth America
+ 27 11 254 4800+ 852 2562 3658
+ 61 7 3721 5400+ 44 356 21 42 30 20+ 1 800 275 3281+ 55 21 3095 9500
At Golder Associates we strive to be the most respected global group specialising in ground engineering and environmental services. Employee owned since our formation in 1960, we have created a unique culture with pride in ownership, resulting in long-term organisational stability. Golder professionals take the time to build an understanding of client needs and of the specific environments in which they operate. We continue to expand our technical capabilities and have experienced steady growth with employees now operating from offices located throughout Africa, Asia, Australasia, Europe, North America and South America.
CHRISTCHURCH
Tel [64] (3) 377 5696Fax [64] (3) 377 9944
Level 4115 Kilmore Street Christchurch 8013
(PO Box 2281Christchurch 8140)
TAKAPUNA
Tel [64] (9) 486 8068Fax [64] (9) 486 8072
Level 2Takapuna Business Park4 Fred Thomas DriveTakapuna 0740Auckland
(PO Box 33-849Takapuna 0622)
DUNEDIN
Tel [64] (3) 479 0390 Fax [64] (3) 474 9642
Level 9AJohn Wickliffe House265 Princes StreetDunedin 9016
(PO Box 1087Dunedin 9054)
TAURANGA
Tel [64] (7) 928 5335 Fax [64] (7) 928 5336
Suite 6, Level 2143 Durham Street Tauranga 3110
(PO Box 13611Tauranga CentralTauranga 3141)
NELSON
Tel [64] (3) 548 1707Fax [64] (3) 548 1727
Level 1Concordia House200 Hardy StreetNelson 7010
(PO Box 1724Nelson 7040)


