46
Copyright © 2014 Pearson Education, Inc. publishing as Prentice Hall 2 - 1
| Date post: | 16-Dec-2015 |
| Category: |
Documents |
| Upload: | preston-hudson |
| View: | 214 times |
| Download: | 1 times |

Copyright © 2014 Pearson Education, Inc. publishing as Prentice Hall 2 - 1
Copyright © 2014 Pearson Education, Inc. publishing as Prentice Hall 2 - 2
Introduction to Cost Behavior and Cost-Volume-Profit
Relationships
Chapter 2
Copyright © 2014 Pearson Education, Inc. publishing as Prentice Hall 2 - 3
When you have finished studying this chapter, you should be able to:
1. Explain how cost drivers affect cost behavior.
2. Show how changes in cost-driver levels affect variable and fixed costs.
3. Explain step- and mixed-cost behavior.
4. Create a cost-volume-profit (CVP) graph and understand the assumptions behind it.
5. Calculate break-even sales volume in total dollars and total units.
Chapter 2 Learning Objectives
Copyright © 2014 Pearson Education, Inc. publishing as Prentice Hall 2 - 4
6. Calculate sales volume in total dollars and total units to reach a target profit.
7. Differentiate between contribution margin and gross margin.
8. Explain the effects of sales mix on profits (Appendix 2A).
9. Compute cost-volume-profit (CVP) relationships on an after-tax basis (Appendix 2B).
Chapter 2 Learning Objectives
Copyright © 2014 Pearson Education, Inc. publishing as Prentice Hall 2 - 5
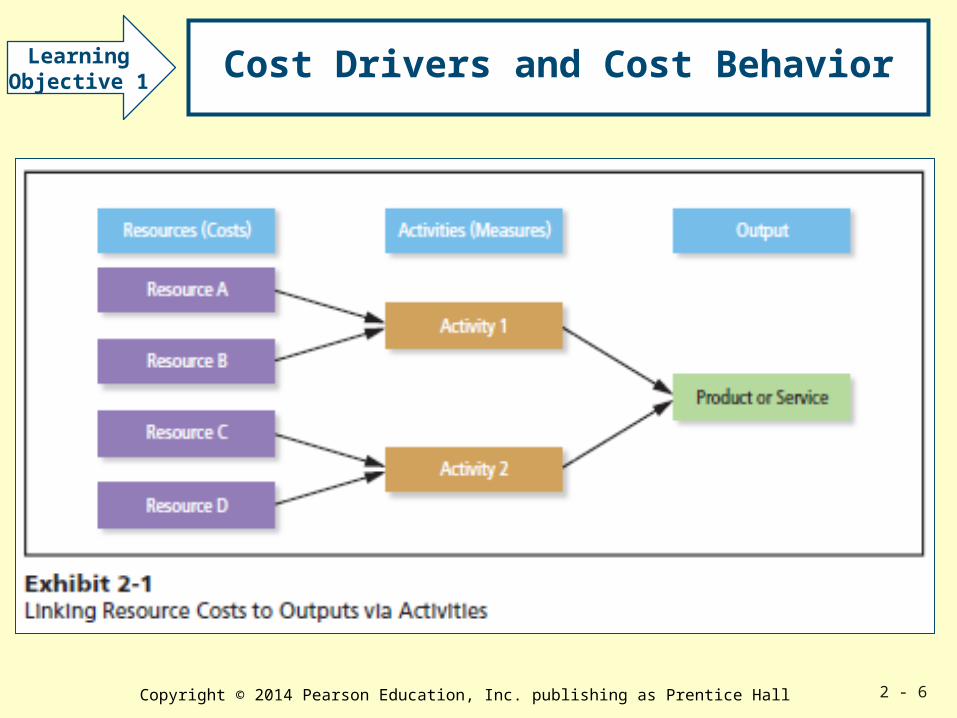
Cost Drivers and Cost Behavior
Cost behavior is how the activities of an
organization affect its costs.
Cost drivers are measuresof activities that requirethe use of resources and thereby cause costs.
Copyright © 2014 Pearson Education, Inc. publishing as Prentice Hall 2 - 6
Cost Drivers and Cost BehaviorLearningObjective 1

Copyright © 2014 Pearson Education, Inc. publishing as Prentice Hall 2 - 7
Value Chain Functions, Costs, and Cost Drivers
Value Chain Function Example Cost Drivers
And Resource Costs
Research and development
•Salaries of sales personnel Number of new product proposals
costs of market surveys
•Salaries of product and process Complexity of proposed products
engineers
Design of products, services, and
processes
•Salaries of product and process Number of engineering hours
engineers
•Cost of computer-aided design Number of distinct parts per
equipment used to develop product
prototype of product for testing

Copyright © 2014 Pearson Education, Inc. publishing as Prentice Hall 2 - 8
Value Chain Functions, Costs, and Cost Drivers
Value Chain Function Example Cost Driversand Resource Costs
Production•Labor wages Labor hours •Supervisory salaries Number of people supervised•Maintenance wages Number of mechanic hours•Depreciation of plant and machinery, Number of machine hours supplies• Energy cost Kilowatt hours
Marketing•Cost of advertisements Number of advertisements•Salaries of marketing personnel, Sales dollars travel costs, entertainment costs
Copyright © 2014 Pearson Education, Inc. publishing as Prentice Hall 2 - 9
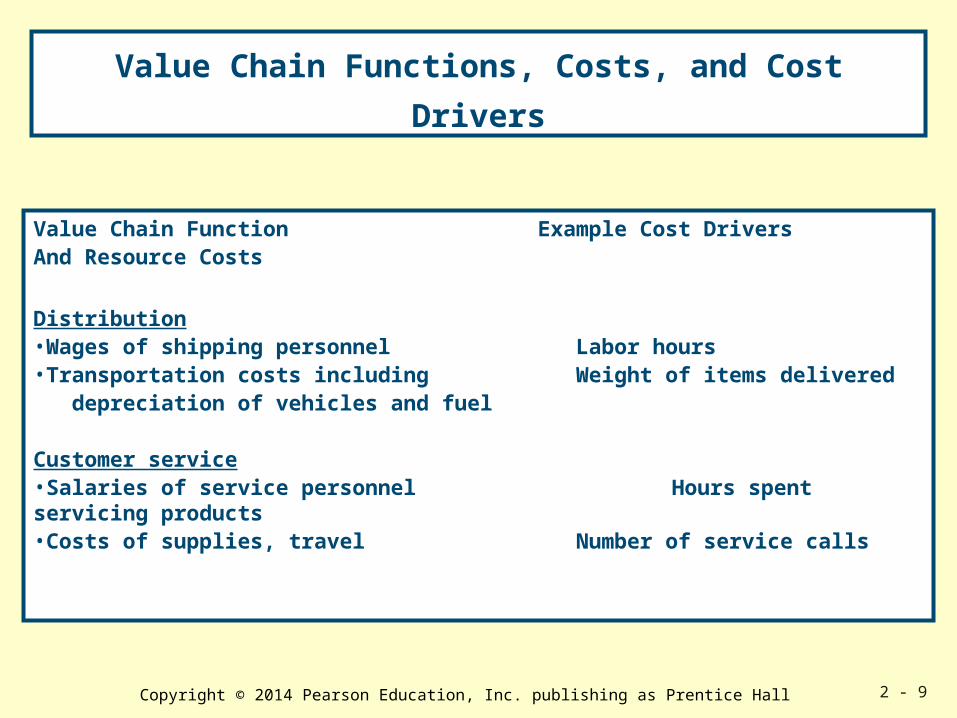
Value Chain Functions, Costs, and Cost Drivers
Value Chain Function Example Cost Drivers And Resource Costs
Distribution•Wages of shipping personnel Labor hours•Transportation costs including Weight of items delivered depreciation of vehicles and fuel
Customer service•Salaries of service personnel Hours spent servicing products•Costs of supplies, travel Number of service calls

Copyright © 2014 Pearson Education, Inc. publishing as Prentice Hall 2 - 10
Variable and Fixed Cost Behavior
A variable cost changes in direct
proportion to changes in the cost-driver level.
A fixed cost is not immediately
affected by changes in the cost-driver level.
Think of variable costs on a per-unit basis.
The per-unit variable cost remains unchanged regardless of changes in
the cost-driver.
Think of fixed costs on a total-cost basis.
Total fixed costs remain unchanged regardless of
changes in the cost-driver.
LearningObjective 2

Copyright © 2014 Pearson Education, Inc. publishing as Prentice Hall 2 - 11
Cost Behavior of Variable and Fixed
Copyright © 2014 Pearson Education, Inc. publishing as Prentice Hall 2 - 12
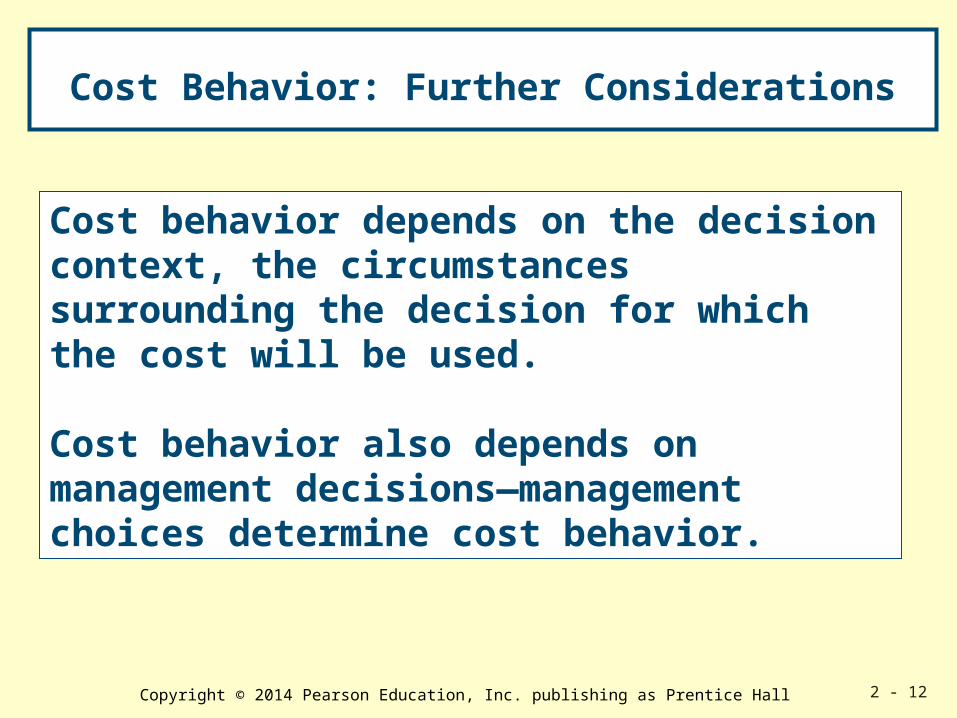
Cost Behavior: Further Considerations
Cost behavior depends on the decision context, the circumstances surrounding the decision for which the cost will be used.
Cost behavior also depends on management decisions—management choices determine cost behavior.
Copyright © 2014 Pearson Education, Inc. publishing as Prentice Hall 2 - 13
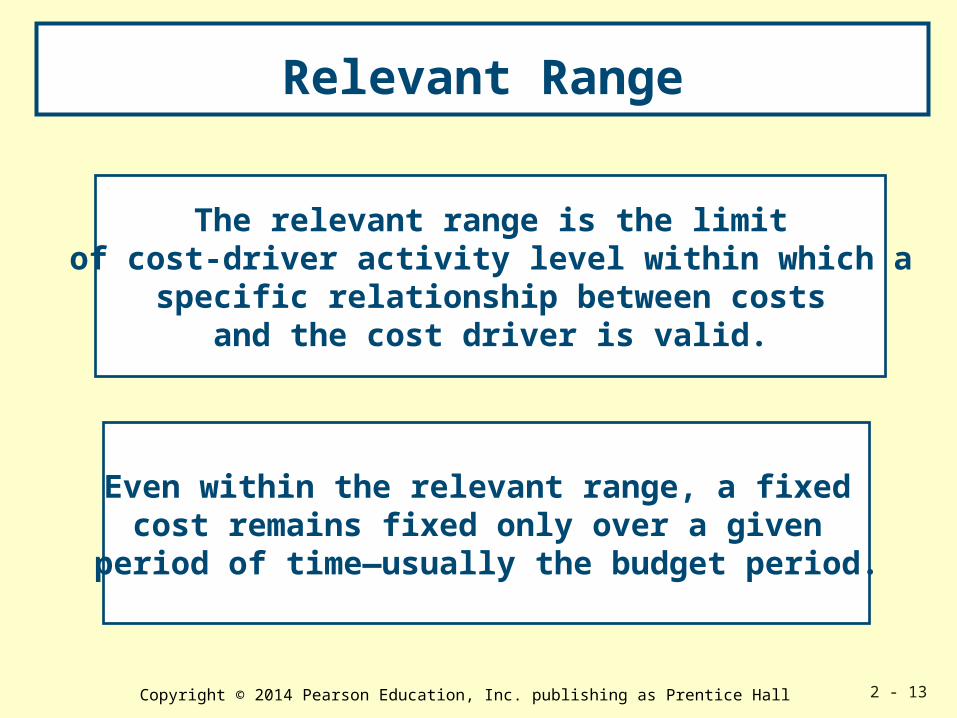
Relevant Range
The relevant range is the limitof cost-driver activity level within which a
specific relationship between costsand the cost driver is valid.
Even within the relevant range, a fixed cost remains fixed only over a given
period of time—usually the budget period.

Copyright © 2014 Pearson Education, Inc. publishing as Prentice Hall 2 - 14
Fixed Costs and Relevant Range
Copyright © 2014 Pearson Education, Inc. publishing as Prentice Hall 2 - 15
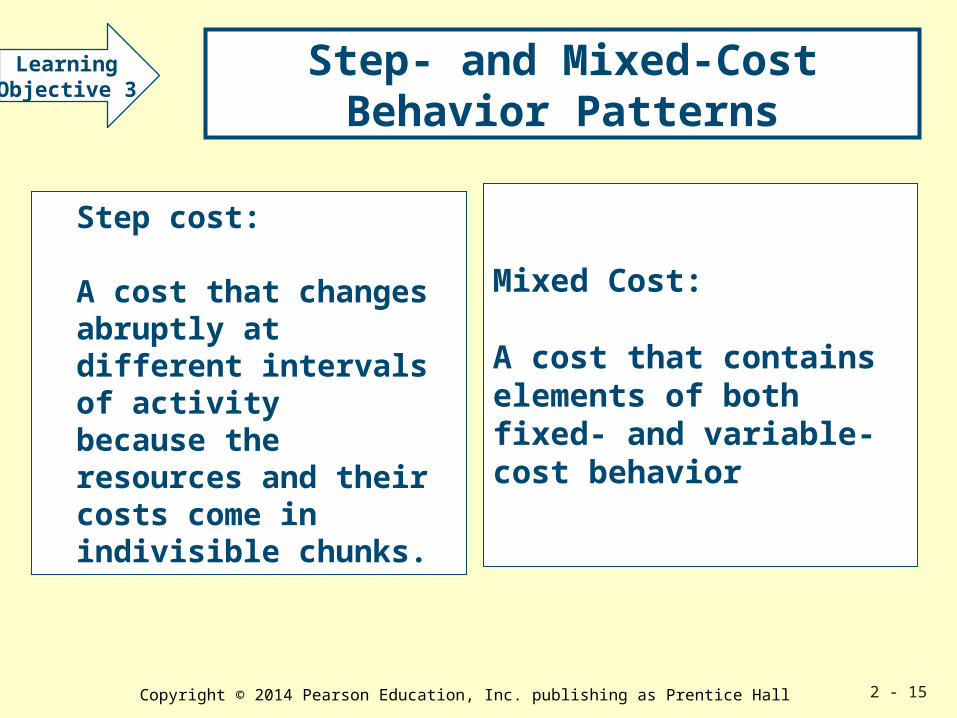
Step- and Mixed-Cost Behavior Patterns
Step cost:
A cost that changes abruptly at different intervals of activitybecause the resources and their costs come in indivisible chunks.
LearningObjective 3
Mixed Cost:
A cost that contains elements of both fixed- and variable-cost behavior
Copyright © 2014 Pearson Education, Inc. publishing as Prentice Hall 2 - 16
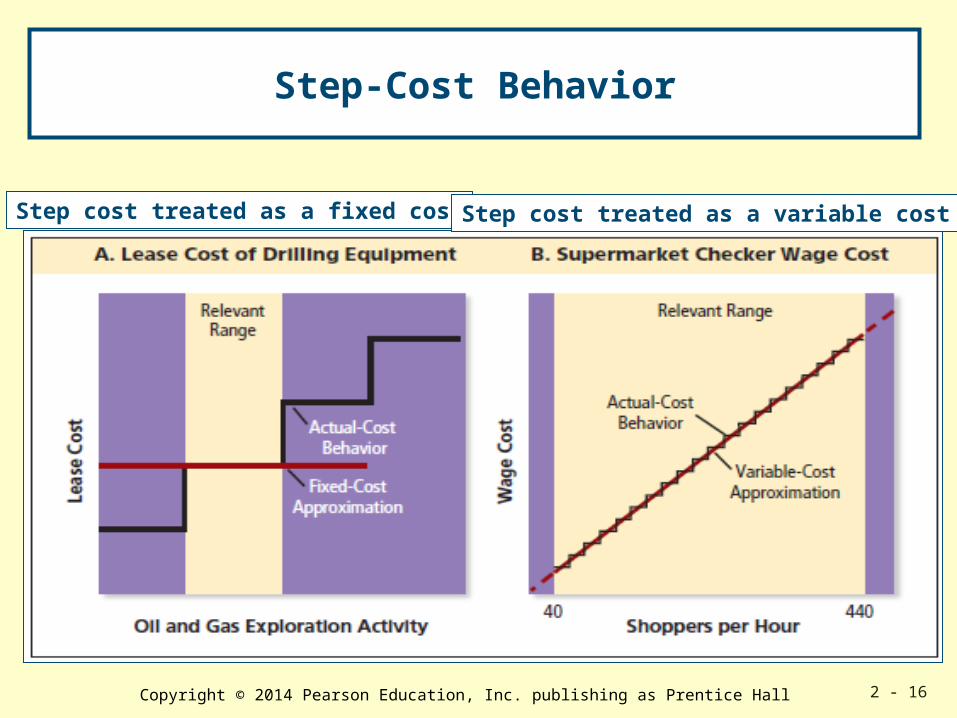
Step-Cost Behavior
Step cost treated as a fixed cost Step cost treated as a variable cost

Copyright © 2014 Pearson Education, Inc. publishing as Prentice Hall 2 - 17
Cost-volume-profit (CVP)analysis
LearningObjective 4
Managers trying to evaluate the effects of changes in volume of goods or services produced might be interested in upward changes such as increased sales expected from increases in promotion or advertising.
ANDManagers might be interested in downward changes such as decreased sales expected due to a new competitor entering the market or due to a decline in economic conditions.
Copyright © 2014 Pearson Education, Inc. publishing as Prentice Hall 2 - 18
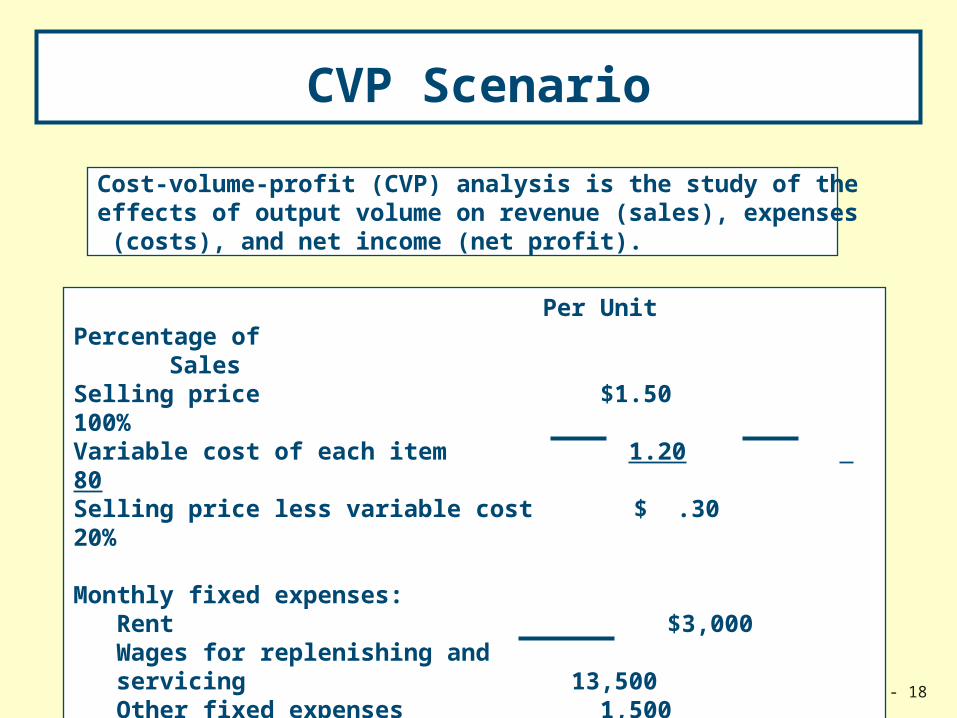
CVP Scenario
Per Unit Percentage of Sales
Selling price $1.50 100%Variable cost of each item 1.20 80Selling price less variable cost $ .30 20%
Monthly fixed expenses: Rent $3,000 Wages for replenishing and servicing 13,500 Other fixed expenses 1,500Total fixed expenses per month $18,000
Cost-volume-profit (CVP) analysis is the study of the effects of output volume on revenue (sales), expenses (costs), and net income (net profit).

Copyright © 2014 Pearson Education, Inc. publishing as Prentice Hall 2 - 19
Cost-Volume-Profit Graph
18,000
30,000
90,000
120,000
138,000
$150,000
0 10 20 30 40 50 60 70 80 90 100
Units (thousands)
Dollar
s
60,000 Total
Expenses
Sales
Net Income Area
Break-Even Point 60,000 units or
$90,000
Net Loss Area
A
C
D
B
Fixed Expenses
Variable Expense
s
Net Income
Copyright © 2014 Pearson Education, Inc. publishing as Prentice Hall 2 - 20
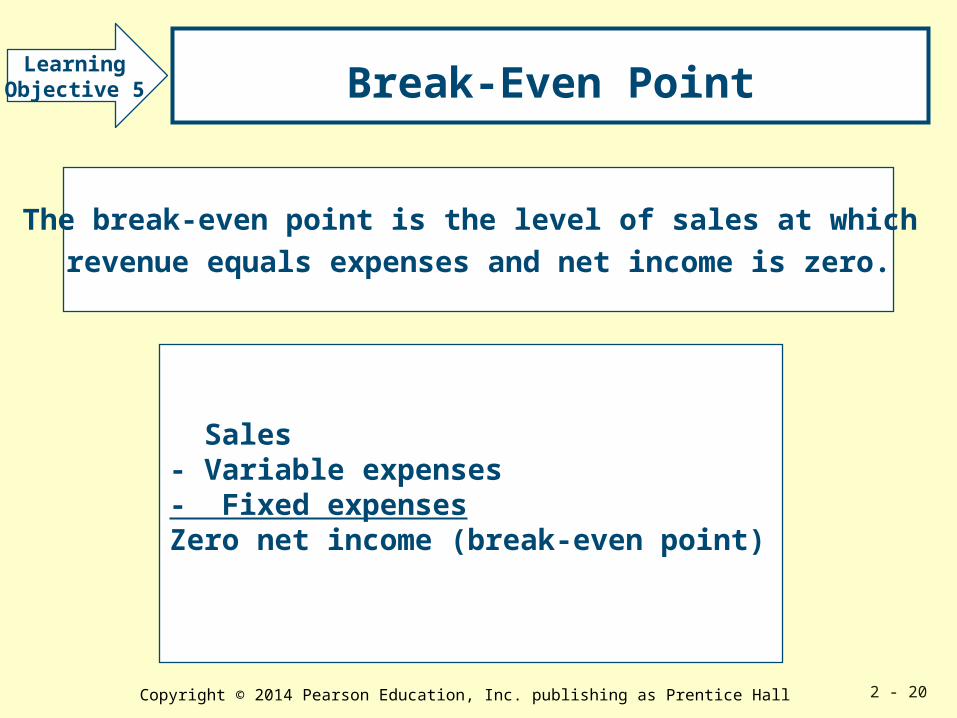
Break-Even Point
The break-even point is the level of sales at which revenue equals expenses and net income is zero.
Sales - Variable expenses- Fixed expensesZero net income (break-even point)
LearningObjective 5
Copyright © 2014 Pearson Education, Inc. publishing as Prentice Hall 2 - 21
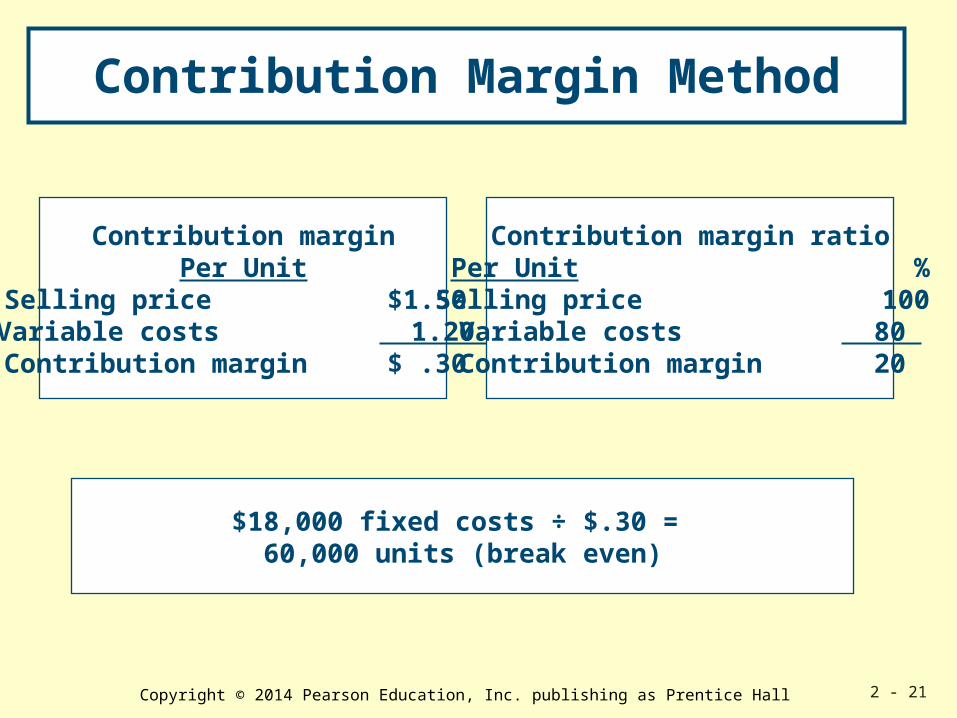
Contribution Margin Method
$18,000 fixed costs ÷ $.30 = 60,000 units (break even)
Contribution marginPer Unit
Selling price $1.50 Variable costs 1.20 Contribution margin $ .30
Contribution margin ratioPer Unit %
Selling price 100 Variable costs 80 Contribution margin 20
Copyright © 2014 Pearson Education, Inc. publishing as Prentice Hall 2 - 22
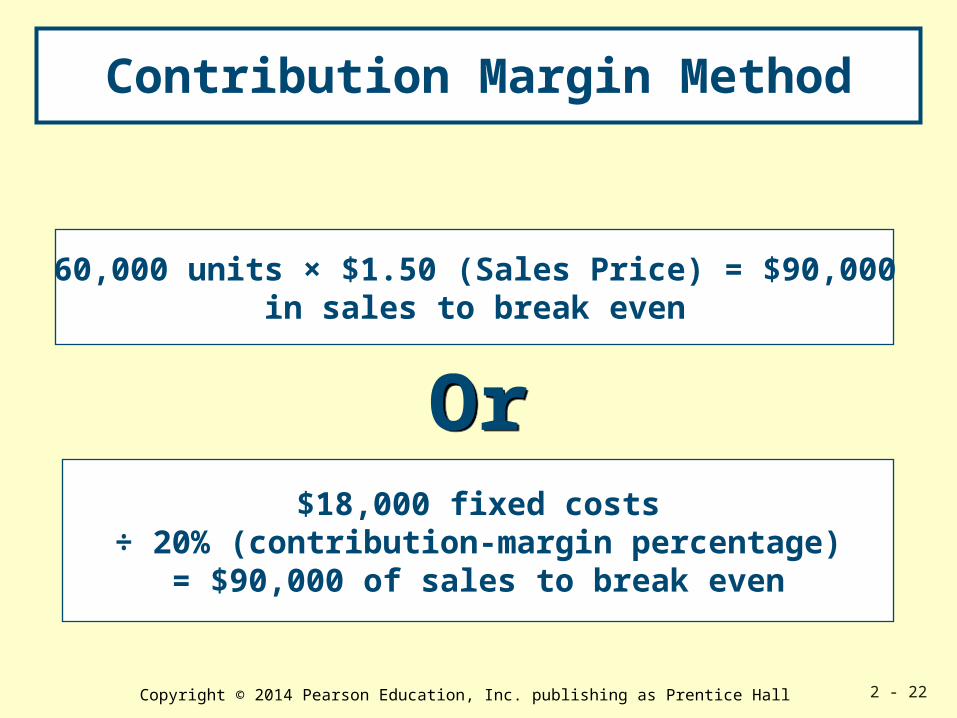
Contribution Margin Method
$18,000 fixed costs÷ 20% (contribution-margin percentage)
= $90,000 of sales to break even
60,000 units × $1.50 (Sales Price) = $90,000in sales to break even
Copyright © 2014 Pearson Education, Inc. publishing as Prentice Hall 2 - 23
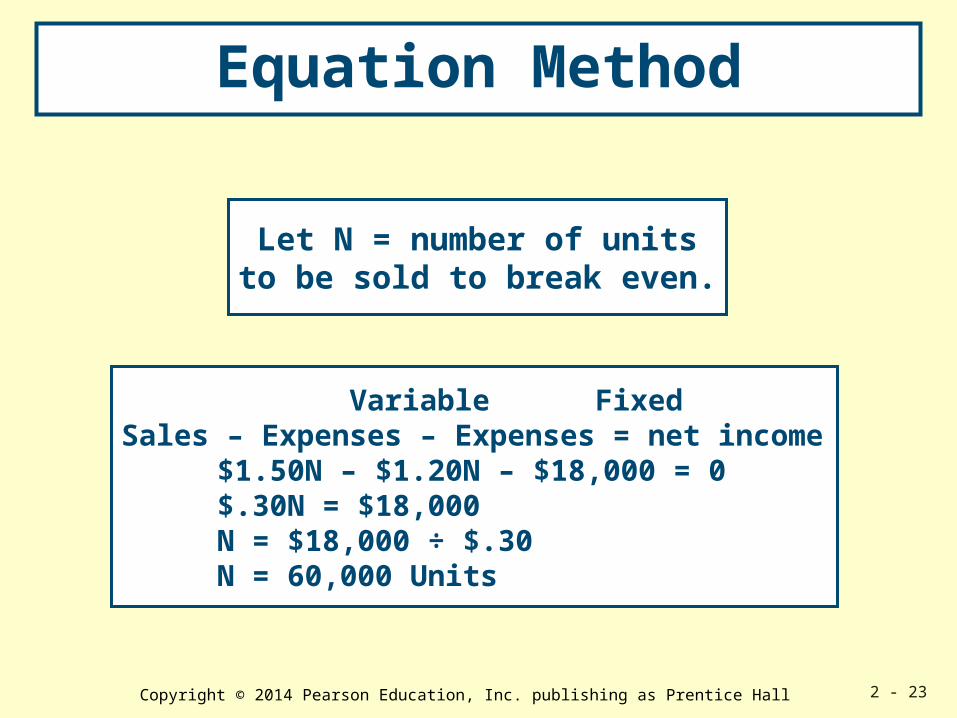
Equation Method
Variable FixedSales – Expenses – Expenses = net income
$1.50N – $1.20N – $18,000 = 0$.30N = $18,000N = $18,000 ÷ $.30N = 60,000 Units
Let N = number of unitsto be sold to break even.
Copyright © 2014 Pearson Education, Inc. publishing as Prentice Hall 2 - 24
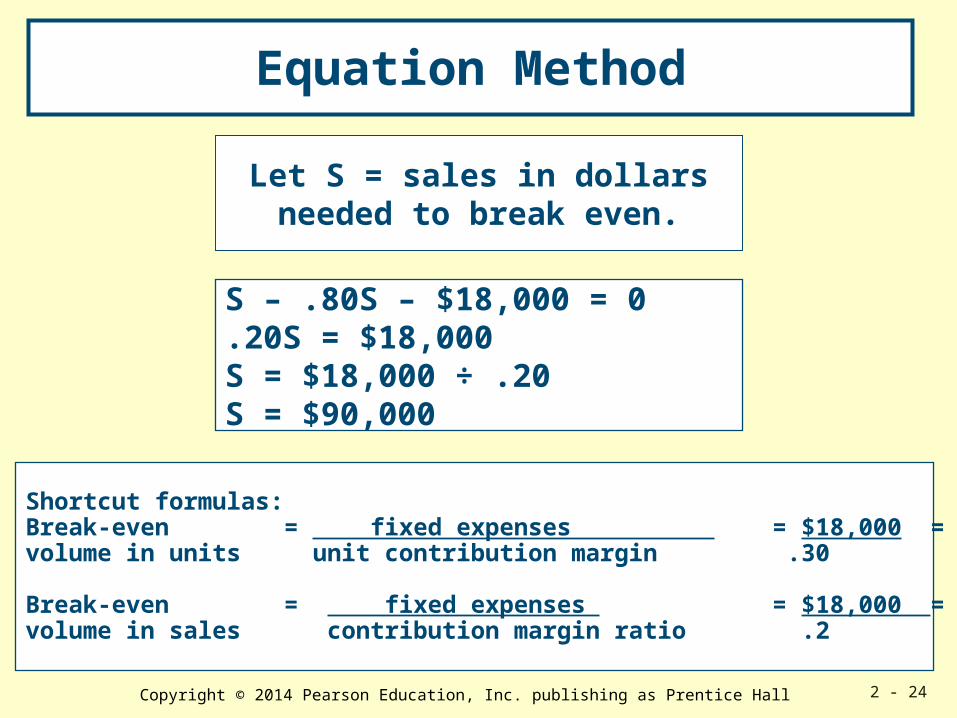
Equation Method
S – .80S – $18,000 = 0.20S = $18,000S = $18,000 ÷ .20S = $90,000
Let S = sales in dollarsneeded to break even.
Shortcut formulas:Break-even = fixed expenses = $18,000 = 60,000volume in units unit contribution margin .30
Break-even = fixed expenses = $18,000 = $90,000volume in sales contribution margin ratio .2
Copyright © 2014 Pearson Education, Inc. publishing as Prentice Hall 2 - 25
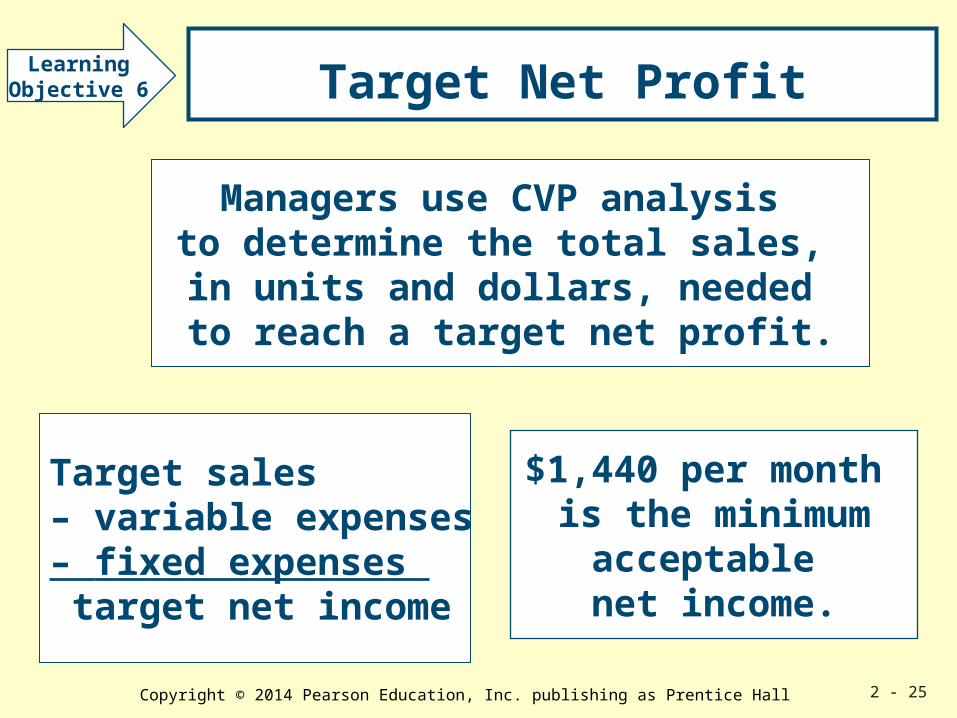
Target Net Profit
Managers use CVP analysis to determine the total sales, in units and dollars, needed to reach a target net profit.
Target sales – variable expenses – fixed expenses target net income
$1,440 per month is the minimum
acceptable net income.
LearningObjective 6
Copyright © 2014 Pearson Education, Inc. publishing as Prentice Hall 2 - 26
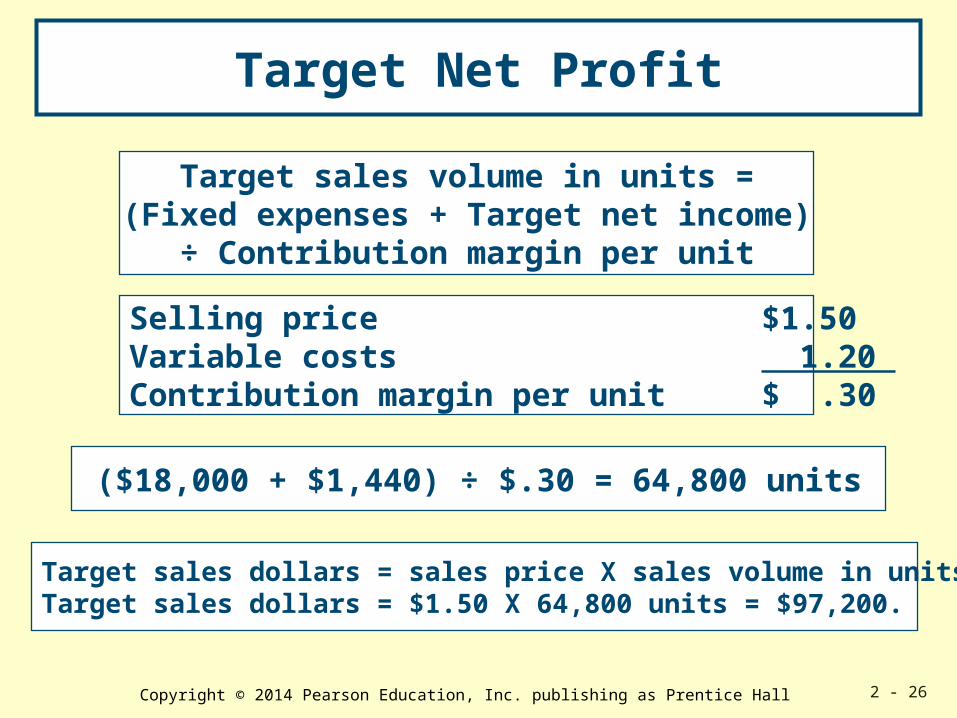
Target sales volume in units =(Fixed expenses + Target net income)
÷ Contribution margin per unit
($18,000 + $1,440) ÷ $.30 = 64,800 units
Target Net Profit
Selling price $1.50 Variable costs 1.20 Contribution margin per unit $ .30
Target sales dollars = sales price X sales volume in unitsTarget sales dollars = $1.50 X 64,800 units = $97,200.

Copyright © 2014 Pearson Education, Inc. publishing as Prentice Hall 2 - 27
Sales volume in dollars = 18,000 + $1,440 = $97,200
.20
Target Net Profit
Target sales volume in dollars =Fixed expenses + target net income
contribution margin ratio
Contribution margin ratioPer Unit %
Selling price 100 Variable costs 80 Contribution margin 20

Copyright © 2014 Pearson Education, Inc. publishing as Prentice Hall 2 - 28
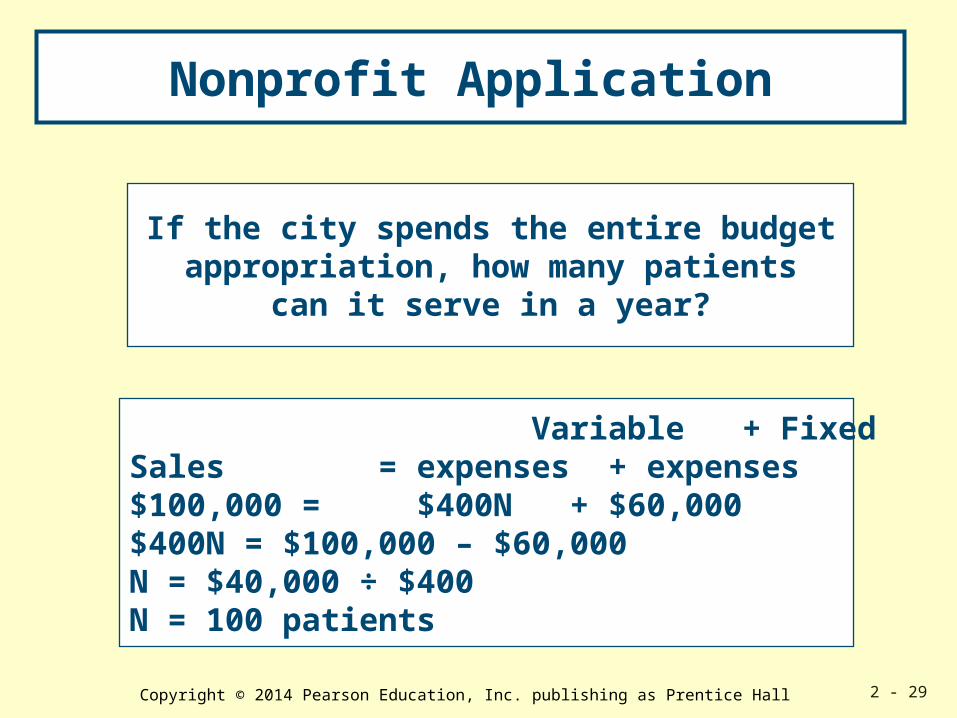
Nonprofit Application
Suppose a city has a $100,000lump-sum budget appropriation
to conduct a counseling program.
Variable costs per prescriptionare $400 per patient per day.
Fixed costs are $60,000 in therelevant range of 50 to 150 patients.
Copyright © 2014 Pearson Education, Inc. publishing as Prentice Hall 2 - 29
If the city spends the entire budgetappropriation, how many patients
can it serve in a year?
Variable + FixedSales = expenses + expenses$100,000 = $400N + $60,000$400N = $100,000 – $60,000N = $40,000 ÷ $400N = 100 patients
Nonprofit Application

Copyright © 2014 Pearson Education, Inc. publishing as Prentice Hall 2 - 30
Nonprofit Application
If the city cuts the total budget appropriation by 10%, how many patients can it serve in a year?
Variable + FixedSales = expenses + expenses$90,000 = $400N + $60,000$400N = $90,000 – $60,000N = $30,000 ÷ $400N = 75 patients
Budget after 10% Cut$100,000 X (1 - .1) = $90,000

Copyright © 2014 Pearson Education, Inc. publishing as Prentice Hall 2 - 31
Operating Leverage
Margin of safety = planned unit sales – break-even sales. How far can sales fall
below the planned level before losses occur?
Low leveraged firms have lower fixed costs and higher variable costs.
Changes in sales volume will have a smaller effect on net income.
Copyright © 2014 Pearson Education, Inc. publishing as Prentice Hall 2 - 32
Operating Leverage
Operating leverage: a firm’s ratio of fixed costs to variable costs.
Highly leveraged firms have high fixed costs and low variable costs. A small change in sales
volume = a large change in net income.
Copyright © 2014 Pearson Education, Inc. publishing as Prentice Hall 2 - 33
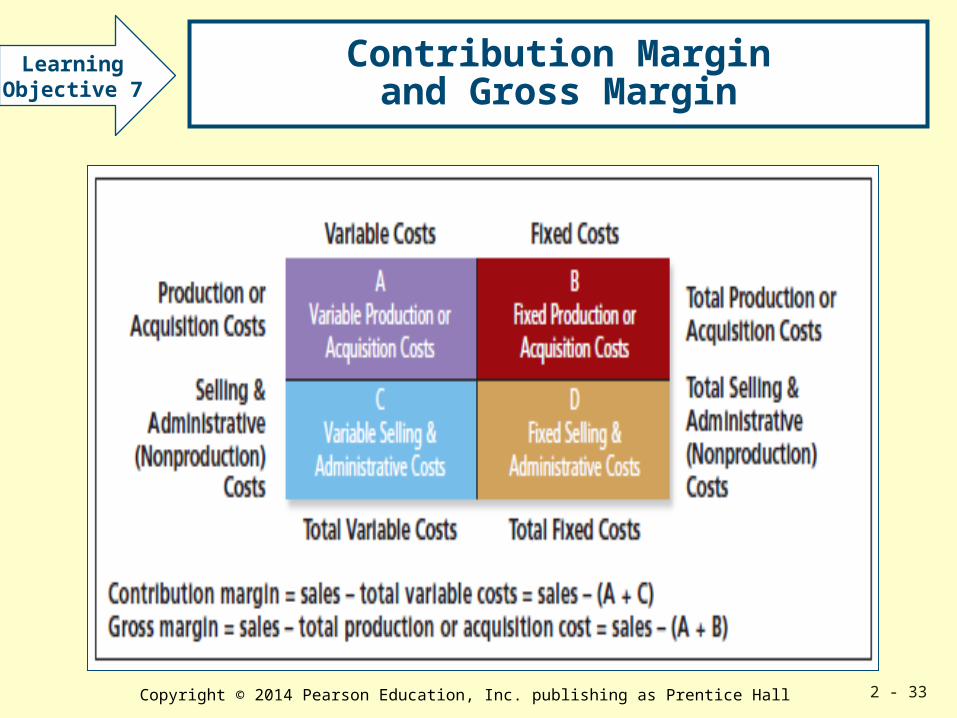
Contribution Marginand Gross Margin
LearningObjective 7
Copyright © 2014 Pearson Education, Inc. publishing as Prentice Hall 2 - 34
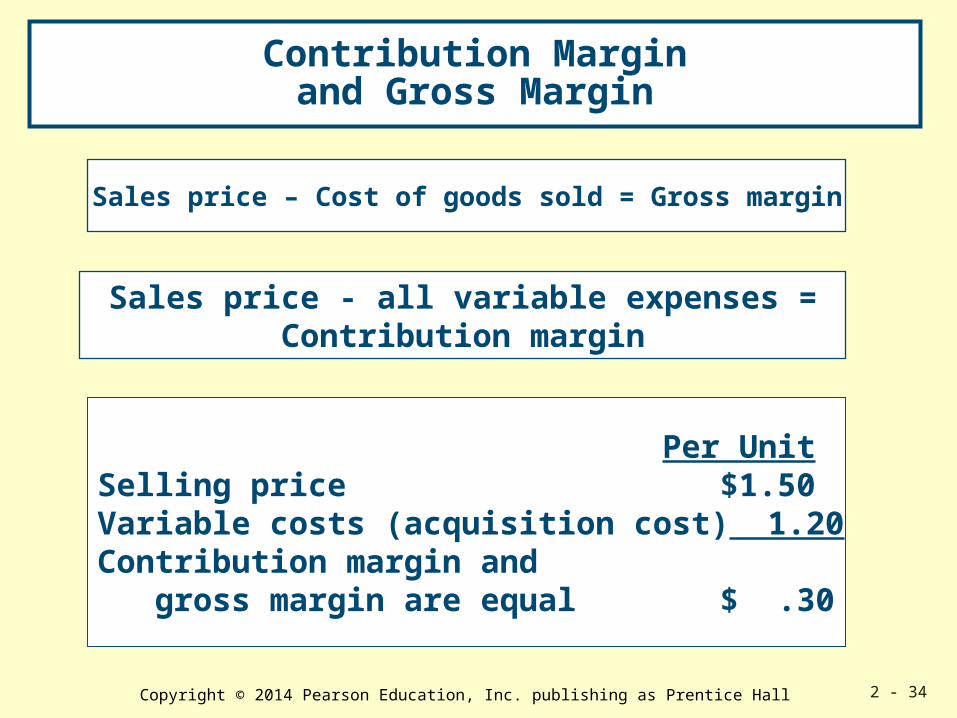
Contribution Marginand Gross Margin
Sales price – Cost of goods sold = Gross margin
Sales price - all variable expenses =Contribution margin
Per UnitSelling price $1.50Variable costs (acquisition cost) 1.20Contribution margin and gross margin are equal $ .30
Copyright © 2014 Pearson Education, Inc. publishing as Prentice Hall 2 - 35
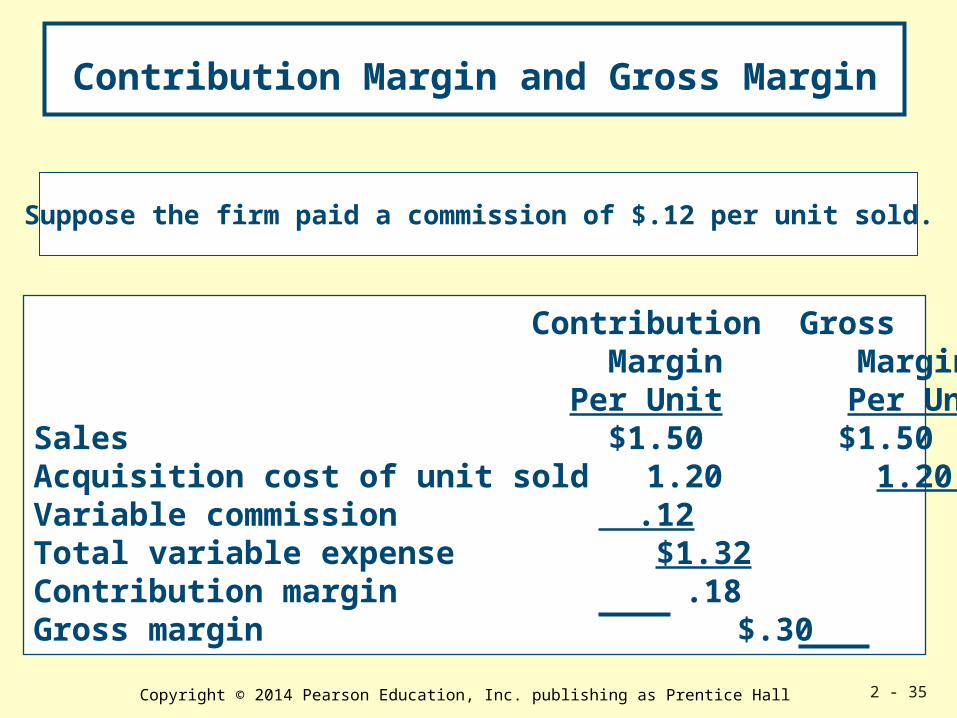
Contribution Margin and Gross Margin
Contribution Gross Margin Margin Per Unit Per Unit
Sales $1.50 $1.50 Acquisition cost of unit sold 1.20 1.20 Variable commission .12Total variable expense $1.32Contribution margin .18 Gross margin $.30
Suppose the firm paid a commission of $.12 per unit sold.

Copyright © 2014 Pearson Education, Inc. publishing as Prentice Hall 2 - 36
Appendix 2A
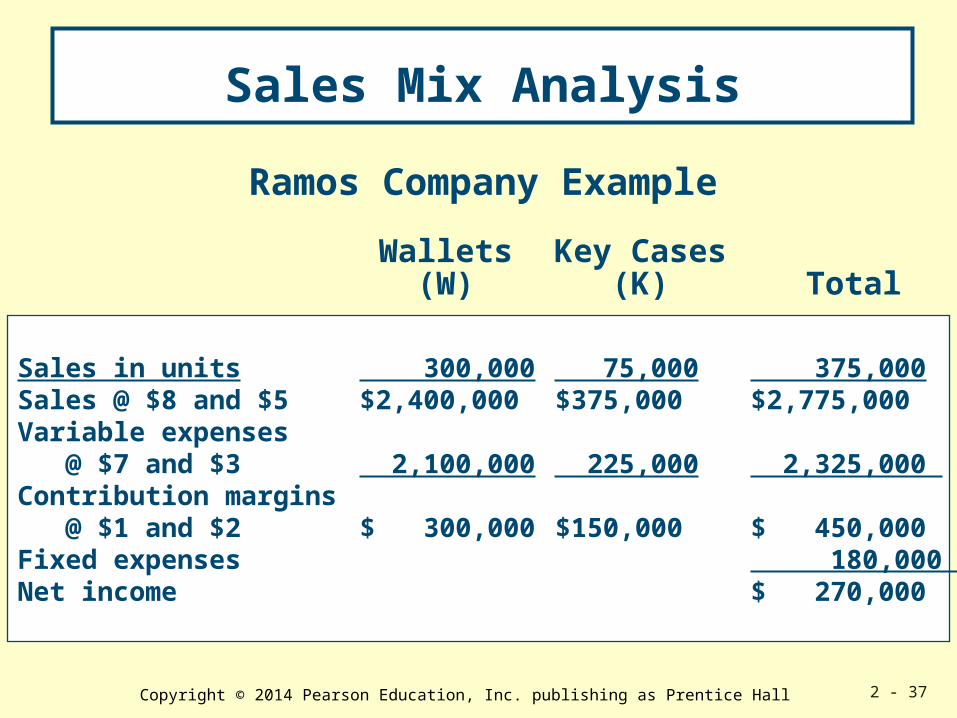
Sales Mix Analysis
Sales mix is the relative proportions orcombinations of quantities of products that comprise total sales.
If the proportions of the mix change, the cost-volume-profit relationships also change.
LearningObjective 8
Copyright © 2014 Pearson Education, Inc. publishing as Prentice Hall 2 - 37
Sales Mix Analysis
Ramos Company Example
Sales in units 300,000 75,000 375,000Sales @ $8 and $5 $2,400,000 $375,000 $2,775,000Variable expenses @ $7 and $3 2,100,000 225,000 2,325,000 Contribution margins @ $1 and $2 $ 300,000 $150,000 $ 450,000Fixed expenses 180,000 Net income $ 270,000
Wallets(W)
Key Cases(K) Total

Copyright © 2014 Pearson Education, Inc. publishing as Prentice Hall 2 - 38
Sales Mix Analysis
Break-even point for a constant sales mix of 4 units of W for every unit of K.sales – variable – fixed = zero net income expense expenses
[$8(4K) + $5(K)] – [$7(4K) + $3(K)] – $180,000 = 0 32K + 5K - 28K - 3K - 180,000 = 0
6K = 180,000 K = 30,000W = 4K = 120,000 30,000K + 120,000W = 150,000 total units (K + W).
Let K = number of units of K to break even, and 4K = number of units of W to break even.
Copyright © 2014 Pearson Education, Inc. publishing as Prentice Hall 2 - 39
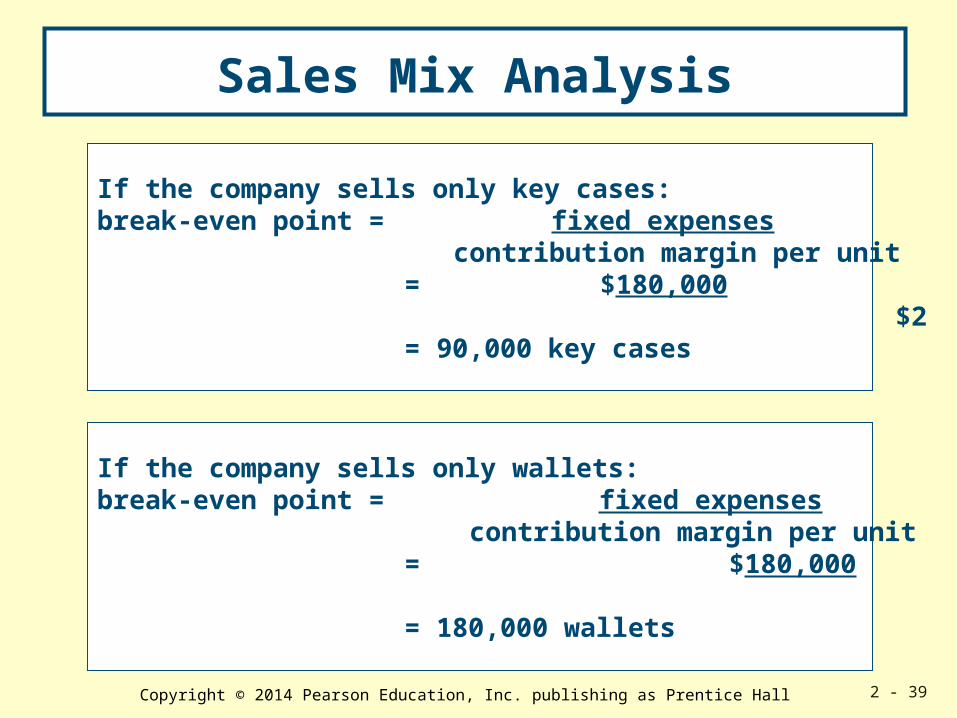
Sales Mix Analysis
If the company sells only key cases:break-even point = fixed expenses
contribution margin per unit = $180,000
$2 = 90,000 key cases
If the company sells only wallets:break-even point = fixed expenses
contribution margin per unit = $180,000
$1 = 180,000 wallets

Copyright © 2014 Pearson Education, Inc. publishing as Prentice Hall 2 - 40
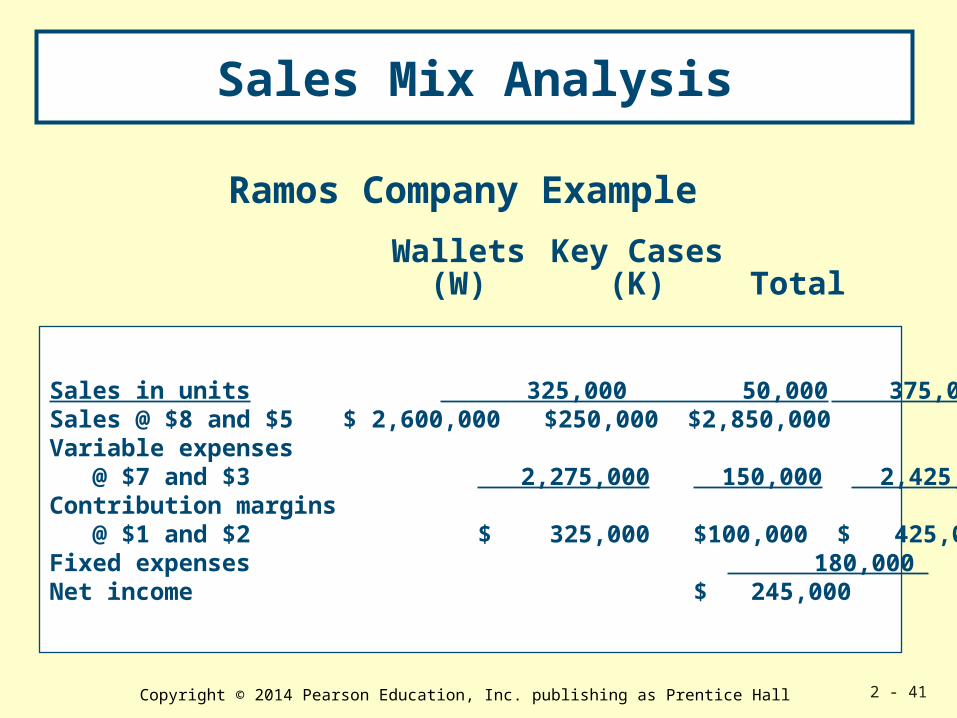
Sales Mix Analysis
Suppose total sales were equal to the
budget of 375,000 units.
However, Ramos sold only 50,000 key casesAnd 325,000 wallets.What is net income?
Copyright © 2014 Pearson Education, Inc. publishing as Prentice Hall 2 - 41
Sales Mix Analysis
Ramos Company Example
Sales in units 325,000 50,000 375,000 Sales @ $8 and $5 $ 2,600,000 $250,000 $2,850,000 Variable expenses @ $7 and $3 2,275,000 150,000 2,425,000 Contribution margins @ $1 and $2 $ 325,000 $100,000 $ 425,000 Fixed expenses 180,000 Net income $ 245,000
Wallets(W)
Key Cases(K) Total
Copyright © 2014 Pearson Education, Inc. publishing as Prentice Hall 2 - 42
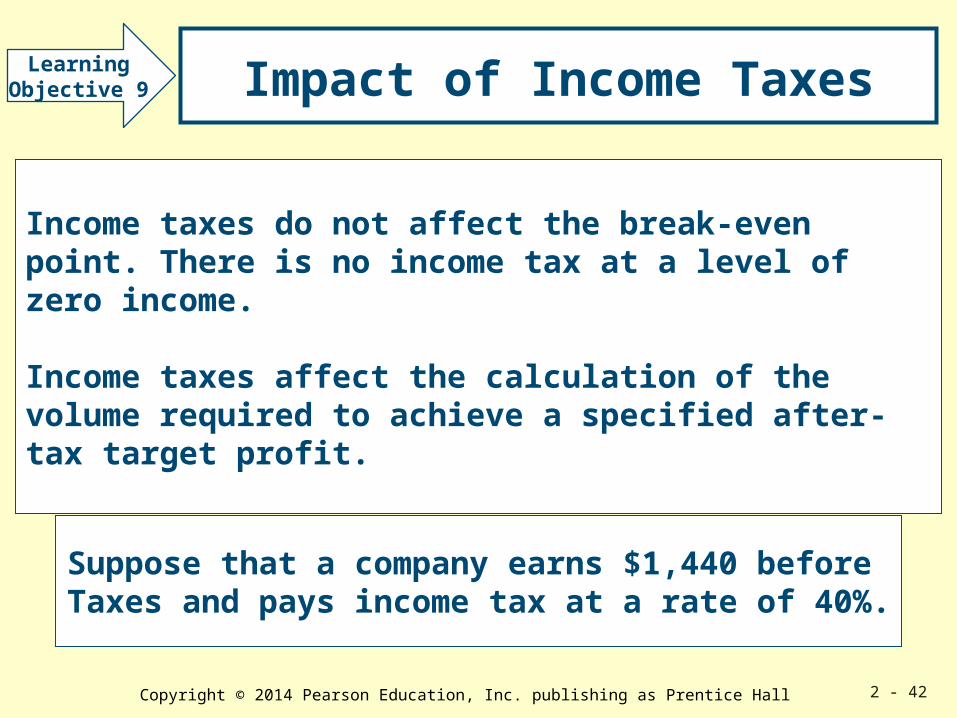
Impact of Income Taxes
Suppose that a company earns $1,440 before Taxes and pays income tax at a rate of 40%.
LearningObjective 9
Income taxes do not affect the break-even point. There is no income tax at a level of zero income.
Income taxes affect the calculation of the volume required to achieve a specified after-tax target profit.

Copyright © 2014 Pearson Education, Inc. publishing as Prentice Hall 2 - 43
Impact of Income Taxes
Target income before taxes = Target after-tax net income 1 – tax rate
Target income before taxes = $ 864 = $1,440 1 – 0.40
Suppose the target net income after taxes was $864
Copyright © 2014 Pearson Education, Inc. publishing as Prentice Hall 2 - 44
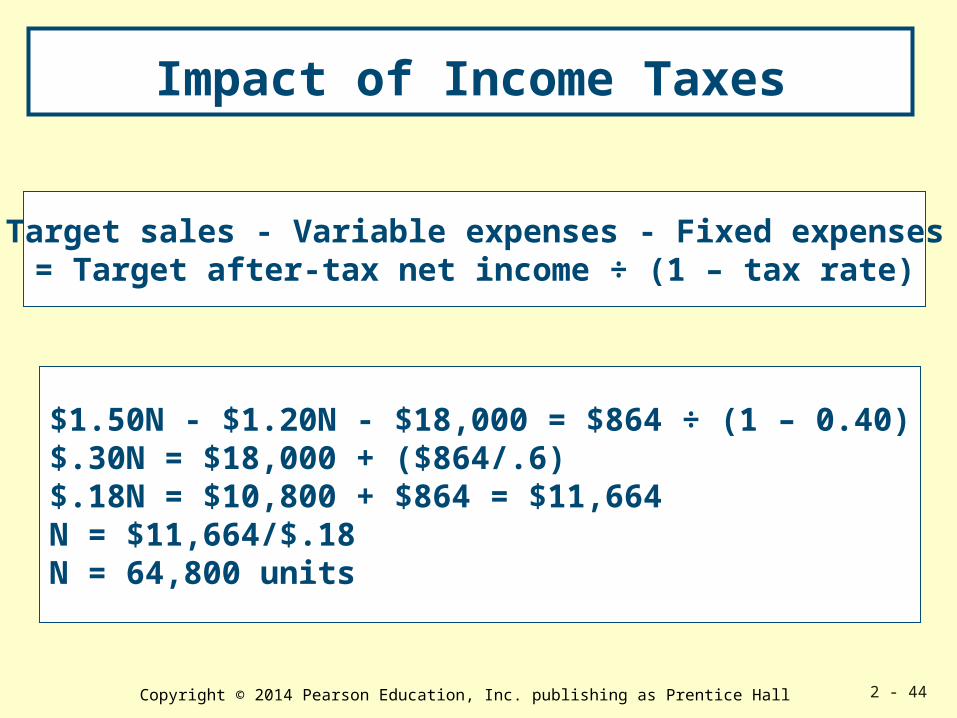
Impact of Income Taxes
Target sales - Variable expenses - Fixed expenses= Target after-tax net income ÷ (1 – tax rate)
$1.50N - $1.20N - $18,000 = $864 ÷ (1 – 0.40)$.30N = $18,000 + ($864/.6)$.18N = $10,800 + $864 = $11,664 N = $11,664/$.18 N = 64,800 units
Copyright © 2014 Pearson Education, Inc. publishing as Prentice Hall 2 - 45
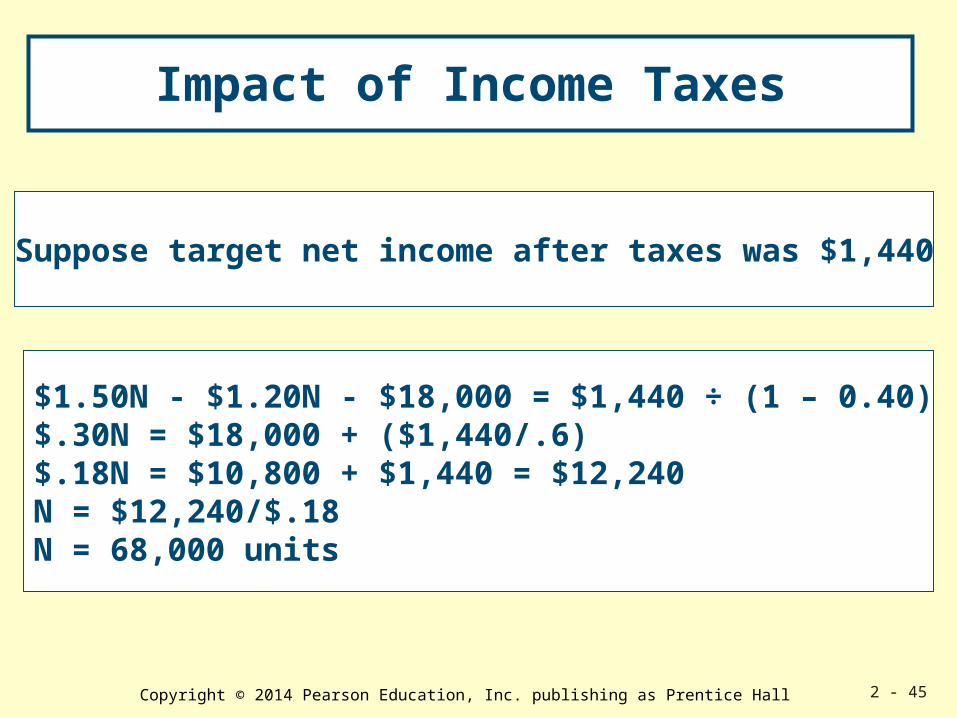
Impact of Income Taxes
Suppose target net income after taxes was $1,440
$1.50N - $1.20N - $18,000 = $1,440 ÷ (1 – 0.40)$.30N = $18,000 + ($1,440/.6)$.18N = $10,800 + $1,440 = $12,240 N = $12,240/$.18 N = 68,000 units

Copyright © 2014 Pearson Education, Inc. publishing as Prentice Hall 2 - 46
All rights reserved. No part of this publication may be reproduced, stored in a retrieval system, or transmitted, in any form or by any means, electronic, mechanical, photocopying, recording, or otherwise, without the prior written permission of the publisher. Printed in the United States of America.


