28
Corporate governance and company performance A proven link between effective corporate governance and value creation Research findings 2019

Corporate governance and company performanceA proven link between effective corporate governance and value creation
Research findings
2019


Contents
Section Page
Foreword 04
Abstract 05
About this research 06
Introduction 08
Grant Thornton corporate governance study 10
Insights for companies 12
Insights for investors 14
Insights for lenders 16
Findings from the literature review 18
Conclusions 20
Appendix A: Studies covered by our review 22
Appendix B: References 24
Appendix C: Methodology 26
AcknowledgementsSarah would like to thank Dr Nash Matinyarare for his dedication in carrying out this research and Simon Lowe for his determination to find the holy grail. Special thanks to Professor Mike Saks for providing his critique and guidance during the formulation and preparation of this white paper. Professor Mike Saks is Fellow of the Institute of Directors, the Institute of Knowledge Exchange, the Research Council for Complementary Medicine, and the Royal Society of Arts. He has published extensively, edited and single authored books with top publishers on a number of topics including regulation and research methods. He is also co-founder of the United Nations-sponsored Institute for Responsible Leadership responsible-leadership.org

4 Corporate governance and company performance
ForewordThe role of governanceGovernance and the decision-making frameworks it underpins are the foundations of trust companies and stakeholders need for capital markets to function efficiently. Evidence of the importance of governance is widely seen. Recently, a set of governance principles has been developed for large private companies in the UK, while codes for the listed markets continue to evolve.
But is it true that strong governance practices contribute to a company’s ability to create sustainable value?
Intuitively, most of the business community would see some form of governance as critical to growth. Embedded within decision-making structures, governance can bring sharper focus to strategic objectives. It can also prevent the development of micro-cultures where misaligned and/or inconsistent decision-making results in the inefficient use of capital. However, many companies only give governance the attention it deserves once something has gone wrong.
Governance – a short historyThe first formal code of governance was introduced in the UK in 1992 following the Cadbury Report. The UK Corporate Governance Code1 (the Code) sought to capture best practice and establish guidance and principles for listed companies, on a comply or explain basis. Globally, there are now more than 100 different corporate governance codes, many of which originate from the principles and approach adopted in the UK.
In the period since, investors, lenders, corporates and academics have debated the long-term benefits of applying strong corporate governance principles. Some argue that these principles now tend to be applied only to demonstrate compliance rather than to achieve any practical benefits for stakeholders. Equally, there is limited practical academic evidence of a tangible definition of strong governance and its consequential impact on corporate performance.
Purpose of this white paperWith the new Code taking effect from the beginning of 2019, this paper explores whether:
• the application of the Code provides a reliable blueprint for a governance framework which supports sustainable value creation
• applying a stronger governance approach creates sustainable value.
This paper provides corporates, lenders, investors and other stakeholders with practical evidence of the benefit of intentionally framing and understanding an organisation’s approach to governance. It also highlights key governance characteristics demonstrated by top-performing companies.
Sarah Bell Partner, Governance and Board Advisory
1 For the purposes of this research, we have used the UK Corporate Governance Code 2016
Creates value
Retains value
Corporate governance and company performance 5
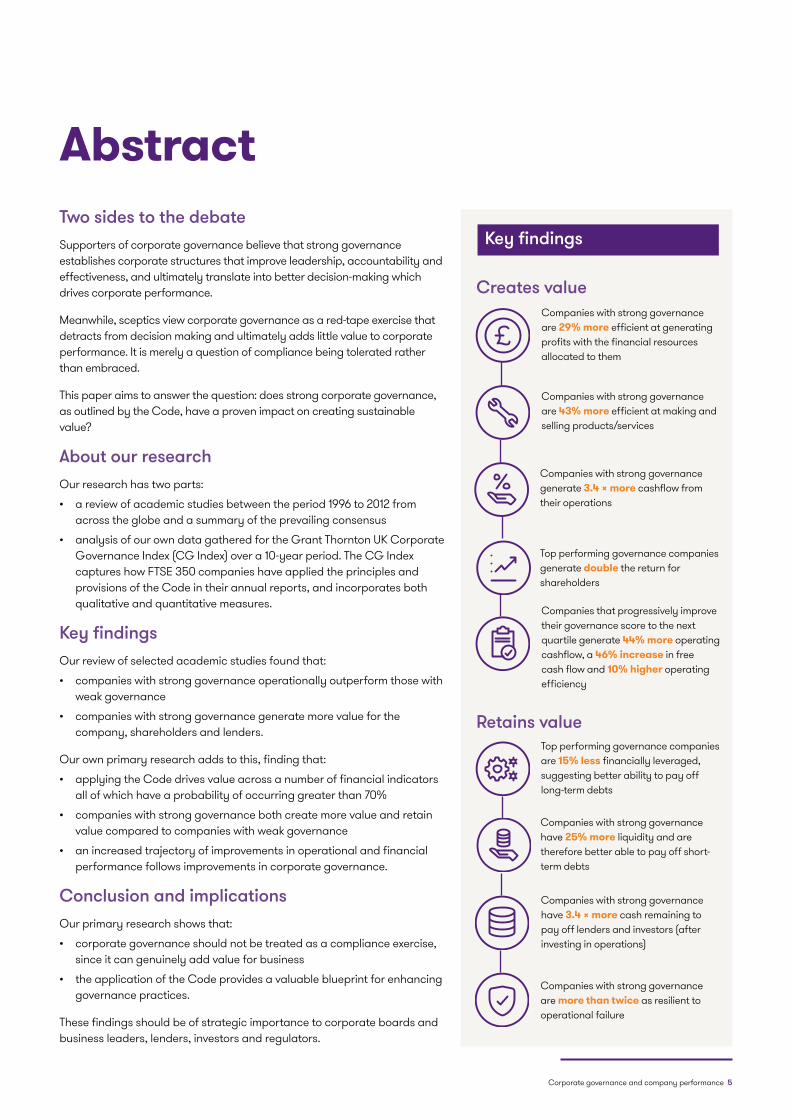
AbstractTwo sides to the debateSupporters of corporate governance believe that strong governance establishes corporate structures that improve leadership, accountability and effectiveness, and ultimately translate into better decision-making which drives corporate performance.
Meanwhile, sceptics view corporate governance as a red-tape exercise that detracts from decision making and ultimately adds little value to corporate performance. It is merely a question of compliance being tolerated rather than embraced.
This paper aims to answer the question: does strong corporate governance, as outlined by the Code, have a proven impact on creating sustainable value?
About our researchOur research has two parts:
• a review of academic studies between the period 1996 to 2012 from across the globe and a summary of the prevailing consensus
• analysis of our own data gathered for the Grant Thornton UK Corporate Governance Index (CG Index) over a 10-year period. The CG Index captures how FTSE 350 companies have applied the principles and provisions of the Code in their annual reports, and incorporates both qualitative and quantitative measures.
Key findingsOur review of selected academic studies found that:
• companies with strong governance operationally outperform those with weak governance
• companies with strong governance generate more value for the company, shareholders and lenders.
Our own primary research adds to this, finding that:
• applying the Code drives value across a number of financial indicators all of which have a probability of occurring greater than 70%
• companies with strong governance both create more value and retain value compared to companies with weak governance
• an increased trajectory of improvements in operational and financial performance follows improvements in corporate governance.
Conclusion and implicationsOur primary research shows that:
• corporate governance should not be treated as a compliance exercise, since it can genuinely add value for business
• the application of the Code provides a valuable blueprint for enhancing governance practices.
These findings should be of strategic importance to corporate boards and business leaders, lenders, investors and regulators.
Companies that progressively improve their governance score to the next quartile generate 44% more operating cashflow, a 46% increase in free cash flow and 10% higher operating efficiency
Companies with strong governance are 29% more efficient at generating profits with the financial resources allocated to them
Companies with strong governance generate 3.4 x more cashflow from their operations
Top performing governance companies generate double the return for shareholders
Companies with strong governance are 43% more efficient at making and selling products/services
Top performing governance companies are 15% less financially leveraged, suggesting better ability to pay off long-term debts
Companies with strong governance have 25% more liquidity and are therefore better able to pay off short-term debts
Companies with strong governance have 3.4 x more cash remaining to pay off lenders and investors (after investing in operations)
Companies with strong governance are more than twice as resilient to operational failure
Key findings

6 Corporate governance and company performance
About this researchWhat is the purpose of this research?
This research investigates whether there is a proven link between strong corporate governance performance and consequently, value creation. This paper is a summary of our research, which comprises two elements:
• our own analysis using data from the CG Index (the primary research)
• a selective review of existing literature in order to frame our unique insight to the debate.
How did we conduct our primary research?
The primary research is based on the CG Index, which captures the corporate governance practices of the FTSE 350, excluding around 40-55 investment trusts as they follow the AIC Code of Corporate Governance. The CG Index provides an overall annual governance score using a proprietary methodology developed over 17 years of assessing the application of the Code. This study focuses on the 10 year period, 2007– 2017. Findings from the CG Index over this period have been widely referenced by the Financial Reporting Council (the FRC) and others.
In this study, the CG Index overall governance score for each year has been broken down into 10 industry sectors and each ranked sequentially based on governance score. The 10 sectors were then individually ranked into quartiles and amalgamated to produce a representative FTSE 350* top and bottom quartile, allowing us to compare their respective financial performance in the following year.
The results have also been separately analysed according to market capitalisation bandings of 50 to confirm there is no undue influence based on size (see Appendix C for further details).
How did we conduct the literature review?
For the literature review, we used Google Scholar to search for articles with the terms ‘corporate governance’ AND ‘financial performance’. As this query returned a large number of academic studies (183,000), we distilled the studies using two criteria, namely studies:
1. done in G7, G20, BRICS and APEC economies, for the period 1996 - 2012.
2. which looked at corporate governance using four or more governance data points (eg board composition and board skills and board diversity and/or other governance elements) rather than studies that focus on a single governance factor (eg board diversity only).
We consider that composite measures are a more accurate proxy for corporate governance.
* For the purpose of the GT CGI and this research, this excludes around 40 investment trusts as they follow the AIC Code of Corporate Governance.

Corporate governance and company performance 7
What is the Grant Thornton UK Corporate Governance Index?
The CG Index is a comprehensive database founded in 2002 to capture the corporate governance practices of the FTSE 350 market. The CG Index is based on the Code and captures how FTSE 350 companies apply and adhere to all the provisions of the Code.
Specifically, the CG Index captures:
• compliance with and application of the principles and provisions of the Code (as set out in the Code and Listing Rules)
• quality and detail of narrative reporting requirements (as set out in S414c of the Companies Act 2006).
The CG Index is used in this research as a proxy to measure the strength of governance practices.
Our research takes the view that an annual report is the window into a company as it is the one consistent source of ‘assured’ information for all stakeholders. Our findings have informally been tested with corporates by sharing outputs with company secretaries, non-executive directors and/or members of the financial function.
Why did we use the Code as a proxy for strong governance?
There is no single recognised definition for what constitutes ‘strong corporate governance’. However, the Code is widely seen as a blueprint for promoting stronger governance. In addition, all premium listed companies are required to comply with the Code or explain their non-compliance.
As the Code represents the distillation of best practices evolved by the UK’s largest listed companies, we believe the Code is a good proxy for measuring underlying corporate governance.
What governance measures does the Code use?
The Code is made up of a number of provisions spanning five main categories of corporate governance: leadership, effectiveness, accountability, remuneration and shareholder relations. We capture all these elements and apply a weighted average to derive an organisation’s overall corporate governance score.
A higher corporate governance score implies better overall corporate governance practices.
How is the CG Index compiled?
The CG Index is compiled annually through a documentary review of companies’ annual reports. Annually, every listed company in the UK is required to make certain disclosures on their corporate governance practices as stipulated by the following regulatory requirements:
• Listing Rules
• Companies Act (section 414C)
• UK Corporate Governance Code 2016.
Where there is a requirement for more than a binary ‘yes’ or ‘no’ (for example, in relation to the annual election of directors) we assess the quality of disclosure using five grades, ranging from ‘none’ to ‘detailed’.

8 Corporate governance and company performance
IntroductionContextThe rate of change in the UK corporate governance landscape (and the proliferation of governance codes across the globe) aligns with the assumption that improving an organisation’s governance will increase the levels of trust between the corporate and stakeholders needed for capital markets to operate efficiently. Strong corporate governance is considered to improve performance because it:
• creates a corporate environment with a clearer purpose, and strategic and cultural intent. As a result, managers make more strategically aligned decisions, trust between stakeholders is higher, and investment is made in more value-adding projects
• reduces the diversion of company financial and non-financial capital, delivering higher value as a result
• improves risk management capacity by ensuring risk-adjusted decision-making is in line with strategy. This translates into more predictable operating performance and therefore lower cost of capital.
But is there any evidence for this?
Hypothesis The hypothesis for this paper is that strong governance, as defined by the application of the Code, has a proven link to creating sustainable value.
Background to corporate governanceIn the UK, the first governance code was established in 1992 following a series of corporate failures and scandals. Since then, the Code has evolved through at least 30 updates (see The evolution of UK corporate governance page 9).
These updates are the result of an evolutionary process that seeks to capture what most successful companies already do and share it for all rather than apply regulation based on failure. Often, revisions or the introduction of new codes appear to come about as a result of much publicised corporate failures. However, it would be a mistake to interpret this as ‘more compliance’, when in fact it is simply the capture of existing best practice.

Corporate governance and company performance 9
2018 FRC Guidance on Board Effectiveness
2018 UK Corporate Governance Code
2018 Wates Corporate Governance Principles for Large Private Companies
2016 FRC Guidance on Audit Committees
2016 UK Corporate Governance Code (2016 update)
2014 FRC Risk Guidance
2014 UK Corporate Governance Code (2014 update)
2012 FRC Guidance on Audit Committees
2012 UK Stewardship Code (2012 update)
2012 UK Corporate Governance Code (2012 update)
2011 Women on Boards
2011 FRC Guidance on Board Efectiveness
2010 FRC Guidance on Audit Committees
2010 UK Stewardship Code
2010 UK Corporate Governance Code
2009 Walker Report: A review of corporate governance in UK banks and other financial industry entities
2008 The Combined Code on Corporate Governance (2008 update)
2008 FRC Guidance on Audit Committees
2006 The Combined Code on Corporate Governance (2006 update)
2005 Internal Control: Guidance for Directors on the Combined Code
2003 Higgs Report: Independent Review of Non-Executive Directors
2003 Smith Report: Audit Committees - Combined Code Guidance
2003 Tyson Report: Recruitment and Development of Non-Executive Directors
2003 The Combined Code on Corporate Governance (2003 update)
2001 Institutional Investment in the United Kingdom (The Myners Report)
1999 Turnbull Report: Internal Control - Guidance for Directors on the Combined Code199
1998 Hampel Report: Final report - Committee on Corporate Governance
1998 The Combined Code on Corporate Governance
1995 Greenbury Report: Directors’ remuneration – report of a study group chaired by Sir Richard Greenbury
1994 Rutterman Report: Internal control and financial reporting- guidance for directors of listed companies registered in the UK
1992 Cadbury Report: Financial Aspects of Corporate Governance
The evolution of UK corporate governance

10 Corporate governance and company performance
Grant Thornton corporate governance study The rationaleHaving undertaken a meta-analysis of academic research between 1996 to 2012, we consider our own study brings a fresh perspective to the existing academic research in three key ways.
• Our research measures strong governance based on a recognised independent blueprint for companies (namely the Code). In contrast, academic research tends to take a theoretical basket of measures and/or use the researcher’s interpretation of ‘good governance drivers’ rather than building a methodology against any recognised guidance or principles. Conversely, by using the Code as the archetypal definition of strong governance and assessing how it has been applied across almost all its metrics over a 10-year period, we aimed to make the assessment of strong governance as objective and practical as possible.
• The governance score for each company, from the CG Index, goes beyond capturing whether a company is compliant or not. It also assesses the application of governance practices, adding a qualitative, objective assessment of governance that has been captured in a consistent way over 17 years.
• Our study provides a more comprehensive set of governance indicators – 74 in total – compared with an average of 31 in the academic papers. It also uses a wider base of financial metrics, measuring the relationship between governance and performance against 20 financial indicators, which have a greater than 70% probability of occurring. These financial metrics are further broken down in this research into those we felt are most relevant insights for companies, lenders and investors. The academic research uses, on average, four financial indicators.
Key findingsValue creationWe found that, compared with companies in the bottom quartile of the CG Index, companies in the top quartile perform better across a range of indicators associated with value creation. Top-quartile companies:
• generate 3.4 x more cash flow from their operations
• are 43% more efficient at making and selling products/services looking at EBIT
• are 29% more efficient at generating profits2 with the financial resources allocated to them
• generate double the return for shareholders.
These findings hold across all ten sectors covered by the research.
Value retentionWe found that, compared with companies in the bottom quartile of the CG Index, companies in the top quartile perform better across a range of indicators associated with retaining value. Top-quartile companies:
• are 15% more solvent3 and are therefore better able to pay off long-term debts
• have 25% more liquidity4 and are therefore better able to pay off short-term debts.
• have 3.4 x more cash remaining (after investment in operations) to pay off lenders and investors
• are more than twice as likely to stay in the FTSE 350.
In each case, these findings hold for most of the ten sectors covered by the research.
Continuous improvement adds valueOur research provides important evidence for organisations looking to understand the potential additional value they can generate from investing in improving their governance approach in line with the Code.
When we investigated the financial performance of companies that progressively improve their corporate governance score – moving from the bottom quartile in the CG Index – we identified a strong link between improved governance and subsequent financial performance.
Each step up between quartiles is associated with an average:
• 44% increase in operating cashflow
• 46% increase in free cashflow
• 10% increase in EBIT margin.
Key governance aspectsWe did not find a ‘one size fits all’ set of strong governance practices being applied across the top-performing companies. However, we did find that strong governance supports the board and the organisation in its decision making in six key areas:
• business model clarity and connectivity
• culture and value integration
• risk management
• internal controls
• board effectiveness
• succession planning.
Further insightWe provide further insight on these findings below and illustrate the financial impact of strong governance from three perspectives: the corporate, the investor and the lender.
2 Does not apply in Basic materials, Financials, Oil and Gas and Utilities3 Does not apply in Consumer services and Financials4 Does not apply in Consumer services, Healthcare and Utilities

Corporate governance and company performance 11
Insights

0
5
10
15
20%
Bottom quartile
Top quartile
12 Corporate governance and company performance
Insights for companies Companies with strong governance operationally outperform those with weak governance
Like the academic studies refer to page 18, our review of UK corporate governance practices finds that companies with strong governance financially outperform those with weak governance.
After normalisation, to take into account company size and sector, we found a positive correlation between strong governance and the following year’s operating performance measures: operating profit margin, contribution margin, return on capital employed and operating cashflow.
Does TQ outperform BQ? Yes
Outperformance probability 100%
TQ avg outperformance +43%
Correlation coefficient 0.179
Operating profit marginTh
Sectors conforming to trend
• Basic materials• Consumer goods• Consumer services• Financial services• Healthcare
• Industrials• Telecoms• Technology• Oil and gas• Utilities
Does TQ outperform BQ? Yes
Outperformance probability 70%
TQ avg outperformance +167%
Correlation coefficient 0.232
Sectors conforming to trend
• Healthcare• Industrials• Oil and gas
• Technology• Utilities
Contribution margin
18
7
0
10
20 Top quartile (TQ)Bottom quartile (BQ)

0
10
20
30
40
50
%
Years
Bottom quartile
Top quartile
Corporate governance and company performance 13
Return on capital employedTh Operating cashflow h
Does TQ outperform BQ? Yes
Outperformance probability 80%
TQ avg outperformance +29%
Correlation coefficient 0.221
Sectors conforming to trend
• Basic materials• Consumer goods• Consumer services• Financial services• Healthcare
• Industrials• Telecoms• Technology• Oil and gas• Utilities
3545
0
50
Top quartile (TQ)Bottom quartile (BQ)
Does TQ outperform BQ? Yes
Outperformance probability 100%
TQ avg outperformance +238%
Correlation coefficient 0.337
Sectors conforming to trend• Basic materials• Consumer goods• Consumer services• Financial services• Healthcare• Industrials
• Telecoms• Technology• Oil and gas• Utilities

£/sh
are
0
1
0.8
1.2
Bottom quartile
Top quartile
14 Corporate governance and company performance
Insights for investors Companies with strong governance deliver superior return to shareholders and have more cash to reinvest in the business
After normalising the data to take into account company size and sector, we found that companies with strong governance generate more value for shareholders in terms of free cashflow. This translates into more cashflow per share, more dividends per share and stronger total shareholder returns.
Does TQ outperform BQ? Yes
Outperformance probability 100%
TQ avg outperformance +236%
Correlation coefficient 0.231
Free cashflow
Sectors conforming to trend
• Basic materials• Consumer goods• Consumer services• Financial services• Healthcare
• Industrials• Telecoms• Technology• Oil and gas• Utilities
Does TQ outperform BQ? Yes
Outperformance probability 90%
TQ avg outperformance +50%
Correlation coefficient 0.221
Sectors conforming to trend
Cashflow per share
• Basic materials• Consumer goods• Consumer services• Financial services• Healthcare
• Industrials• Telecoms• Technology• Oil and gas• Utilities
Top quartile (TQ)Bottom quartile (BQ)
Year

£/sh
are
0
0.2
0.4
Bottom quartile
Top quartile
0.20
0.32
Corporate governance and company performance 15
Dividend per shareh Total shareholder returnh
Does TQ outperform BQ? Yes
Outperformance probability 90%
TQ avg outperformance +60%
Correlation coefficient 0.232
Sectors conforming to trend
• Healthcare• Industrials• Oil and gas
• Technology• Utilities
Bottom quartile
FTSE 350
Random portfolio
Top quartile
Sharpe ratio
Standard deviation
Top quartile 11.6 179.51
FTSE 350 9.6 173.71
Random portfolio 10.9 164.92
Bottom quartile 9.8 163.01

Arbi
trar
y un
its
Arbi
trar
y un
its
0
1
0
0.5
2 1
1.5 1.7 0.81.0
Bottom quartile
Bottom quartile
Top quartile
Top quartile
16 Corporate governance and company performance
Insights for lenders Companies with strong governance are more financially prudent and have better financial management
An understanding how corporate governance influenced risk-taking behaviour when it comes to financial management we used indicators that measure liquidity and solvency. After normalising the data to take into account company size and sector, companies with strong governance have better liquidity (quick ratio) and better solvency (financial leverage). They also have a better current ratio but the probability is below 70%. This suggests that top performing governance companies are more financially prudent and better able to pay off debts as they fall due.
Additionally, we found that companies with strong governance generate more free cashflow and therefore, are in a good position to be able to pay off debts.
Does TQ outperform BQ? Yes
Outperformance probability 50%
TQ avg outperformance +13%
Correlation coefficient 0.041
Current ratioTh
Sectors conforming to trend
• Basic materials• Consumer goods• Financial services• Industrials
• Telecoms• Technology• Oil and gas
Does TQ outperform BQ? Yes
Outperformance probability 90%
TQ avg outperformance +25%
Correlation coefficient 0.106
Sectors conforming to trend
Quick ratio
• Basic materials• Consumer goods• Financial services• Industrials
• Telecoms• Technology• Oil and gas

(£/s
hare
)
0
1 1.31.1
Bottom quartile
Top quartile
Corporate governance and company performance 17
Financial leverageTh Free cashflow
Does TQ outperform BQ? Yes
Outperformance probability 70%
TQ avg outperformance -15%
Correlation coefficient -0.318
Sectors conforming to trend
• Basic materials• Consumer goods• Healthcare• Industrials
• Telecoms• Technology• Oil and gas• Utilities
Does TQ outperform BQ? Yes
Outperformance probability 100%
TQ avg outperformance +236%
Correlation coefficient 0.231
Sectors conforming to trend
• Basic materials• Consumer goods• Consumer services• Financial services• Healthcare
• Industrials• Telecoms• Technology• Oil and gas• Utilities
Top quartile (TQ)Bottom quartile (BQ)
Year

18 Corporate governance and company performance
Findings from the literature review A vast body of academic research seeks to identify a causal relationship between corporate governance and financial performance. Despite this, the empirical evidence for such a relationship is still inconclusive and/or limited.
Part of the reason for this ambiguity is that it is hard to provide 100% correlation, as financial outcomes are subject to a wide range of variables. As a result, studies tend to limit the number of governance and financial measures they cover in order to provide more conclusive correlations.
In addition, the financial metrics chosen by academics reviewed as part of this study may not have practical relevance. The common primary metrics chosen in the academic studies tend to be shareholder based. For example: Tobin’s Q, return on assets, return on equity, market to book value, and market value of equity to sales.
Finally, strong governance can be interpreted in many ways depending on the size, nature and purpose of an organisation. Measuring it is notoriously difficult. Equally, qualitative data on governance practices is limited, so studies often rely on binary (or compliance based) outputs to measure governance and are absent on the value of application.
The selection of academic studiesTo eliminate some of this noise, the studies we selected for review:
• come from countries with relatively mature regulatory frameworks
• use a basket of governance measures (four or more) rather than that simply looking at one governance element.
Grant Thornton UK Corporate Governance IndexLiterature review
Covers 40 pieces of research from 34 different countries.
Each study used an average of 31 governance indicators against an average of 4 financial metrics.
Average population per study was 3,250 typically over a period of 5 years.
Uses 74 governance measures (based on the Code) against 20 financial metrics.
Study population of over 2,300 listed company entries over a 10-year period.
Tracks 506 individual listed companies over the period.
The value of corporate governanceTo understand the impact of governance on financial performance, academic studies generally aim to answer two fundamental questions:
• Is there a link between corporate governance and corporate performance?
• Is the association causal?
On the first question, we found most of the research shows a positive correlation between corporate governance and various measures of corporate performance (see Appendix A).
In terms of the second question – causality is more difficult to prove given the number of variables that influence corporate performance.
That said our literature review still found a number of studies that demonstrate to some degree a causal relationship between strong governance practices and improved financial performance.

Corporate governance and company performance 19
Key findings of academic literature reviewThe literature supported our primary research and highlighted three main financial benefits of strong governance.
1. Companies with strong governance practices show better operating performance
The academic research provides abundant and robust evidence that well-governed companies operationally outperform companies with weak governance.
One common reason provided is that strong corporate governance creates a corporate environment with better oversight. As a result, managers make better decisions.
The second reason is that well-governed companies are more efficient (see next point).
2. Companies with strong governance are more efficient at using financial resources and utilising assets
The research suggests that well-governed companies operationally outperform those with weak governance because companies with strong governance are more efficient at managing their financial resources and maximising asset utilisation.
The evidence goes further, suggesting that companies with weak governance tend to underperform because of inefficient use of financial resources due to:
• managerial motivation (tendency to do less work when returns are smaller) and/or lack of clarity minimising risk based decisions
• over-investment
• perquisite consumption (managers lack motivation due to abundance of managerial perks).
3. Companies with strong governance generate more value
Given that well-governed companies are run more efficiently, it is perhaps unsurprising that the research indicates that companies that are well governed create more overall value for the company itself as well as for shareholders and lenders.
There are several ways to measure the total value created by a company. The research indicates that those companies with strong governance practices generate more value in several ways.
• Better cashflow generation
Companies with strong governance are more efficient at using financial resources to generate profit and this translates into improved cashflow generation.
Positive cashflow, and the ability to generate it consistently, is critical for sustained operations since this cash is used to fund day-to-day operations as well as pay off debts and dividends. This suggests that strong governance practices are not only beneficial to companies but also to shareholders and lenders.
• Better stock market performance and returns
A number of studies show that companies that demonstrate strong governance outperform those with weak governance on the stock market and therefore yield higher shareholder returns.
The studies go further to conclude that portfolios comprised of companies with weak corporate governance constantly underperform passive investment portfolios.
This suggests that companies with strong governance deliver significantly higher return. Accordingly, Investors can therefore maximise their returns by investing in companies that demonstrate strong governance practices.
• Better value added
Using Economic Value Added (EVA) and Market Value Added (MVA) as indicators of true economic profit produced and wealth created by a company over time, the literature shows that companies with strong governance practices create more economic value and true wealth.
ConclusionWhile some pieces of research show contradictory findings, the majority indicate a positive and causal relationship between strong corporate governance and improved corporate performance, albeit on a limited basket of measures and no recognised or independent definition of strong governance.

20 Corporate governance and company performance
ConclusionsThe findings of our research confirms the hypothesis that there is a proven link between strong governance and the creation of sustainable value.
While the overall governance score consists of variables that interact to influence company performance, the positive relationship, proven through this study, shows that governance is integral to the sustainability of an organisation. It also indicates that the principles from the Code provide a reliable platform for shaping an approach to governance.
Of course, success is not guaranteed, even for a well-governed business – events can change the course of any company. However, our research indicates that top performing governance companies that apply governance principles in the following six areas have a far greater chance of creating a dynamic environment that drives better decision making and success than organisations where decision-making is poorly supported:
• business model clarity and connectivity
• culture and value integration
• risk management
• internal controls
• board effectiveness
• succession planning
While many question the purpose of the annual accounts, it is the one consistent point of contact for stakeholders that provides a reliable window into a company. It highlights how the business frames, takes and monitors the decisions that drive financial outcomes.
With new governance codes coming into effect, we hope that this research will encourage organisations globally to refresh their attitude to their governance approach. Further, we hope it will encourage investors, lenders and stakeholders to be clearer about the role governance should play in their engagement with companies and in their investment decisions.

Corporate governance and company performance 21
Appendices

22 Corporate governance and company performance
Appendix A: Studies covered by our review
Country Years covered
Period Population Findings Ref*
Argentina 2 2003-2004 65 Well-governed companies show better operational performance 1
Australia 1 1996 460 Strong corporate governance correlates with higher firm value 2
Austria 5 1999-2003 649 Strong positive correlation between strong governance and performance
16
Belgium 5 1999-2003 659 Strong positive correlation between strong governance and performance
16
Brazil 4 2002-2005 60 Companies with strong governance have higher market valuations, better cash flow rights and greater need for external funding
3
Canada 4 2002-2005 289 Strong corporate governance correlated with higher firm value and better operating performance
4
China 3 2004-2006 100 Positive correlation between strong corporate governance and higher market valuations
5
China (Hong Kong)
4 2002-2005 170 Improvements in corporate governance over time result in an increase in corporate value (and vice versa)
8
Denmark 5 1999-2003 1,115 Strong positive correlation between strong governance and performance
16
Finland 5 1999-2003 865 Strong positive correlation between strong governance and performance
16
France 5 1999-2003 5,138 Strong positive correlation between strong governance and performance
16
Germany 5 1999-2003 5,199 Strong positive correlation between strong governance and performance
16
Ghana 5 1997-2001 22 Elements of corporate governance are associated with enhanced corporate performance
7
Greece 5 1999-2003 1,970 Strong positive correlation between strong governance and performance
16
India 4 2002-2005 120 Companies with strong governance have better cash flow rights, greater need for external funding and higher market valuations
3
India 4 - 141 Strong corporate governance is a good predictor of better corporate performance
9
Indonesia 3 2002-2004 46 Corporate governance has a significant impact on company performance
10
Ireland 5 1999-2003 380 Strong positive correlation between strong governance and performance
16
Italy 1 2012 215 Strong governance leads to better operating performance 11
Italy 5 1999-2003 1,822 Strong positive correlation between strong governance and performance
16
Japan 6 1999-2004 315 Companies with strong governance outperform those with weak governance on the stock market
12

Corporate governance and company performance 23
Country Years covered
Period Population Findings Ref*
Kenya 5 1997-2001 23 Elements of corporate governance are associated with enhanced corporate performance
7
Korea 6 1998-2004 1,247 Improved corporate governance in causally related to higher market valuation, lower cashflow tunnelling, improved capital allocation and better growth decisions
13
Mexico 4 2002-2005 24 Companies with strong governance have better cash flow rights, greater need for external funding and higher market valuations
3
Netherlands 5 1999-2003 1,130 Strong positive correlation between strong governance and performance 16
Nigeria 5 1997-2001 16 Elements of corporate governance are associated with enhanced corporate performance
7
Pakistan 2 2008-2009 30 Elements of corporate governance are associated with better corporate performance
15
Portugal 5 1999-2003 556 Strong positive correlation between strong governance and performance 16
Russia 7 1999-2005 105 Strong corporate governance linked with higher market valuations 17
Saudi Arabia 4 2006-2009 94 Positive correlation between strong governance and higher firm value 18
South Africa 5 1997-2001 42 Elements of corporate governance are associated with enhanced corporate performance
7
Spain 5 1999-2003 746 Strong positive correlation between strong governance and performance 16
Sweden 5 1999-2003 2,241 Strong positive correlation between strong governance and performance 16
Turkey 4 2005-2008 100 Corporate governance has a positive influence on corporate performance 19
Turkey 2 1997-2008 41 Elements of strong corporate governance are associated with better EVA, MVA and CVA
25
Ukraine 4 2000-2003 5,000 Strong corporate governance is a good predictor of better corporate performance
21
UK 5 1999-2003 11,197 Strong positive correlation between strong governance and performance 16
UK 10 1999-2008 2,212 Strong governance is associated with better operating performance and higher stock-market returns
20
United States 15 1990-2004 68,497 Strong governance is highly correlated with better operating performance 22
United States 10 1990-1999 11,736 Clear correlation between strong governance and higher firm value and better stock-market returns
23
* See Appendix B

24 Corporate governance and company performance
Appendix B: References1 CORPORATE GOVERNANCE AND OWNERSHIP: MEASUREMENT AND IMPACT ON CORPORATE
PERFORMANCE AND DIVIDEN POLICIES IN ARGENTINA, Bebczuk, R. N. (2005), Documentos de Trabajo
2 CORPORATE GOVERNANCE AND COMPANY PERFORMANCE IN AUSTRALIA, Christensen, J., Kent, P., & Stewart, J. (2010), Australian Accounting Review, 20(4), 372-386
3 TO STEAL OR NOT TO STEAL: FIRM ATTRIBUTES, LEGAL ENVIRONMENT, AND VALUATION., Durnev, A., & Kim, E. H. (2005), The Journal of Finance, 60(3), 1461-1493.
4 CORPORATE GOVERNANCE RATING AND FINANCIAL PERFORMANCE: A CANADIAN STUDY, Sylvie Berthelot, Tania Morris, Cameron Morrill, (2010), Corporate Governance: The international journal of business in society, Vol. 10 Issue: 5, pp.635-646
5 CORPORATE GOVERNANCE IN CHINA: A STEP FORWARD, Cheung, Y.L., P. Jiang, P. Limpaphayom, and T. Lu, 2010, European Financial Management 16, 94-123
6 PRODUCT MARKET COMPETITION, CORPORATE GOVERNANCE AND FIRM PERFORMANCE: AN EMPIRICAL ANALYSIS FOR GERMANY, Januszewski, S. I., Köke, J., & Winter, J. K. (2002), Research in Economics, 56(3), 299-332
7 CORPORATE GOVERNANCE AND FIRM PERFORMANCE IN AFRICA: A DYNAMIC PANEL DATA ANALYSIS, Kyereboah-Coleman, A. (2008), Studies in Economics and econometrics, 32(2), 1-27
8 DOES CORPORATE GOVERNANCE PREDICT FUTURE PERFORMANCE? EVIDENCE FROM HONG KONG, Yan-Leung Cheung, J. Thomas Connelly, Ping Jiang, Piman Limpaphayom, Financial Management, Vol. 40, No. 1 (SPRING 2011), pp. 159-197
9 CORPORATE GOVERNANCE AS A VALUE DRIVER FOR FIRM PERFORMANCE: EVIDENCE FROM INDIA, Supriti Mishra, Pitabas Mohanty, (2014), Corporate Governance, Vol. 14 Issue: 2, pp.265-280
10 CORPORATE GOVERNANCE AND PERFORMANCE: EVIDENCE FROM AN EMERGING MARKET, Nuryanah, S., & Islam, S. (2011), Malaysian Accounting Review, 10(1)
11 CORPORATE GOVERNANCE AND FINANCIAL PERFORMANCE OF ITALIAN FIRMS. THE RESULTS OF AN EMPIRICAL RESEARCH, Rossi, M., Nerino, M., & Capasso, A. (2015), Corporate Ownership & Control, 12(2), 628-643
12 THE IMPACT OF CORPORATE GOVERNANCE ON CORPORATE PERFORMANCE: EVIDENCE FROM JAPAN, Bauer, R., Frijns, B., Otten, R., & Tourani-Rad, A. (2008), Pacific-Basin Finance Journal, 16(3), 236-251
13 HOW CORPORATE GOVERNANCE AFFECTS FIRM VALUE: EVIDENCE ON CHANNELS FROM KOREA, Black, В., W. Kim, H. Jang, and K.S. Park, 2008, SSRN Working Paper No. 844744
Corporate governance and company performance 25
14 TO STEAL OR NOT TO STEAL: FIRM ATTRIBUTES, LEGAL ENVIRONMENT, AND VALUATION., Durnev, A., & Kim, E. H. (2005), The Journal of Finance, 60(3), 1461-1493.
15 CORPORATE GOVERNANCE AND FIRM PERFORMANCE IN PAKISTAN: THE CASE FOR KARACHI STOCK EXCHANGE (KSE)-30, Yasser, Q. R., Entebang, H. A., & Mansor, S. A. (2011), Journal of economics and international finance, 3(8), 482-491
16 CORPORATE GOVERNANCE RATINGS AND COMPANY PERFORMANCE: A CROSS EAUROPEAN STUDY, Renders, A., Gaeremynck, A., & Sercu, P.(2010), Corporate Governance: An International Review, 18(2), 87–106
17 CORPORTE GOVERNANCE INDICES AND FIRMS’ MARKET VALUES: TIME SERIES EVIDENCE FROM RUSSIA., Black, B. S., Love, I., & Rachinsky, A. (2006), Emerging Markets Review, 7(4), 361-379.
18 CORPORATE GOVERNANCE AND FIRM PERFORMANCE AND VALUE IN SAUDI ARABIA, Fallatah, Y., & Dickins, D. (2012), African Journal of Business Management, 6(36), 10025-10034
19 CORPORATE GOVERNANCE AND FINANCIAL PERFORMANCE WITH A PERSPECTIVE ON INSTITUTIONAL OWNERSHIP: EMPIRICAL EVIDENCE FROM TURKEY, Gürbüz, A. O., Aybars, A., & Kutlu, Ö. (2010), Journal of Applied Management Accounting Research, 8(2)
20 BOARD GOVERNANCE AND CORPORATE PERFORMANCE, Shaukat, A., & Trojanowski, G. (2018), Journal of Business Finance & Accounting, 45(1-2), 184-208
21 DOES CORPROATE GOVERNANCE CAUSALLY PREDICT FIRM PERFORMANCE? PANEL DATA AND INSTRUMENTAL VARIABLES EVIDENCE, Zheka, V, 2006, SSRN Working Paper No. 877913
22 CORPORATE GOVERNANCE AND FIRM PERFORMANCE, Bhagat, S., & Bolton, B. (2008), Journal of Corporate Finance, 14(3), 257–273
23 CORPORATE GOVERNANCE AND EQUITY PRICES, Gompers, P., Ishii, J., & Metrick, A. (2003), Quarterly Journal of Economics, 118(1), 107–155

26 Corporate governance and company performance
Appendix C: MethodologyGovernance data: The overall governance score for each company was taken from the CG Index. To build this index, data is collected annually from the front end of the FTSE 350 annual report. The score is based on the quality of disclosures and alignment to the principles and provisions of the Code.
Governance scoring and weighting: The overall governance score is derived using a proprietary weighting calculation between the five elements of the Code (leadership, accountability, effectiveness, remuneration, relations with shareholders). The score weighting is based on the emphasis placed by the FRC on each provision and on our experienced judgement on elements that are crucial to business performance. We have validated our methodology with several internal and external stakeholders, including the FRC.
Study design: The study uses data from a 10-year period from 2007–2017. Using the CG Index, we ranked the FTSE 350 study population according to their overall governance score. We then identified top-quartile companies and bottom-quartile companies in each of the years from 2007–2017 for each of 10 sectors (detailed below). The score was accumulated to provide a representative population across the quartiles. Once the top and bottom quartiles were identified, these companies’ consequent years’ financial performance were tracked using the financial indicators outlined in the main body of this report.
Our database represents the 10 industry classification benchmark (ICB) categories used in the UK namely: basic materials (7%), consumer goods (8%), consumer services (22%), financials (22%), healthcare (4%), industrials (21%), oil & gas (6%), technology (5%), telecommunications (2%) and utilities (3%). Numbers in brackets indicate the proportion of companies in the population.
Study population: While our analysis looks at the FTSE 350 market, we exclude investment trusts as they follow the AIC Code of Corporate Governance. As a consequence, from 2007–2017, we captured corporate governance data for an average 301 companies per year, giving us 3,018 total company entries.
In terms of individual companies, over the 10-year period, a total of 506 individual companies were incorporated into the CG Index and subsequently either stayed in, were acquired, merged or delisted. We tracked all these companies over their lifecycle in the CG Index.

Corporate governance and company performance 27
Governance database stress testing: We referenced the dependability of the data by meeting with a selection of companies included in the dataset to confirm that the results reflected the company’s approach to governance.
Data-screening: To remove anomalies and maintain the integrity of the data, the financial data was screened. Historical financial data for all the companies in our analysis was obtained from the FAME financial database. Once downloaded, the data was screened for missing data fields, anomalous data and extreme outliers (greater than two standard deviations from the mean). This cleansing process provided data for 77% of the original 3,018 company entries (ie a total population of 2,309 entries with reliable data).
Key points of note/limitations: Key limitations to our study are as follows:
• It is based on the effective Code in operation over the study period.
• It assumes that disclosure equates to practice. Listed companies are subject to a variety of reporting requirements. Anecdotal testing over the 17-year period of the data collection has validated findings, however this is on an ad hoc basis. The data is also assessed and calibrated within the wider FTSE 350 population for accuracy each year.
• While a positive correlation exists between strong governance and a number of financial indicators, correlation does not automatically mean causation.
• While regression analysis also supports a positive association between strong governance and a number of financial and governance indicators, it is hard to isolate a variety of wider impacts. Reducing the population of measures would have improved correlation but affected our ability to comment on the value of strong governance being defined by the application of the Code.
• Only financial indicators were looked at as these are easily and reliably obtained from financial databases.

0041grantthornton.co.uk
© 2019 Grant Thornton UK LLP. All rights reserved.
‘Grant Thornton’ refers to the brand under which the Grant Thornton member firms provide assurance, tax and advisory services to their clients and/or refers to one or more member firms, as the context requires. Grant Thornton UK LLP is a member firm of Grant Thornton International Ltd (GTIL). GTIL and the member firms are not a worldwide partnership. GTIL and each member firm is a separate legal entity. Services are delivered by the member firms. GTIL does not provide services to clients. GTIL and its member firms are not agents of, and do not obligate, one another and are not liable for one another’s acts or omissions. This publication has been prepared only as a guide. No responsibility can be accepted by us for loss occasioned to any person acting or refraining from acting as a result of any material in this publication.


