q Helpful comments on earlier drafts were provided by Olivier Blanchard, Ricardo Caballero, Stijn Claessens, Douglas Diamond, Stephanie Flanders, Mary Kwak, Rafael La Porta, Don Lessard, Richard Locke, Florencio Lopez-de-Silanes, Stewart Myers, Andrei Shleifer, Ed Steinfeld, Scott Stern, Ksenia Yudaeva, Luigi Zingales, three anonymous referees, and seminar participants at the NBER corporate "nance workshop, the Stockholm School of Economics, and the Federal Reserve Bank of Chicago. Florencio Lopez-de-Silanes kindly provided access to unpublished data. Konstantina Drakouli and Matthew Utterback were very helpful research assistants. Generous support was provided by the MIT Entrepreneurship Center and the Russian}European Centre for Economic Policy (RECEP). * Corresponding author. Tel.: #1-617-253-8412; fax: #1-617-253-2660. E-mail address: sjohnson@mit.edu (S. Johnson). Journal of Financial Economics 58 (2000) 141}186 Corporate governance in the Asian "nancial crisis q Simon Johnson!,*, Peter Boone", Alasdair Breach#, Eric Friedman$ !Sloan School of Management, Massachusetts Institute of Technology, Cambridge, MA 02142, USA "Brunswick UBS Warburg, 52/4 Kosmodamianskaya Nab., Moscow, Russian Federation #Goldman Sachs, 22/13 Voznesensky Pereulok, Moscow, Russian Federation $Department of Economics, Rutgers University, New Brunswick, NJ 08903, USA Received 4 February 1999; received in revised form 19 October 1999 Abstract The `Asian Crisisa of 1997}98 a!ected all the `emerging marketsa open to capital #ows. Measures of corporate governance, particularly the e!ectiveness of protection for minority shareholders, explain the extent of exchange rate depreciation and stock market decline better than do standard macroeconomic measures. A possible explanation is that in countries with weak corporate governance, worse economic prospects result in more expropriation by managers and thus a larger fall in asset prices. ( 2000 Elsevier Science S.A. All rights reserved. JEL classixcation: G18; G38; K22 Keywords: Corporate governance; Investor protection; Financial crisis 0304-405X/00/$ - see front matter ( 2000 Elsevier Science S.A. All rights reserved. PII: S 0 3 0 4 - 4 0 5 X ( 0 0 ) 0 0 0 6 9 - 6
Transcript
qHelpful comments on earlier drafts were provided by Olivier Blanchard, Ricardo Caballero, StijnClaessens, Douglas Diamond, Stephanie Flanders, Mary Kwak, Rafael La Porta, Don Lessard,Richard Locke, Florencio Lopez-de-Silanes, Stewart Myers, Andrei Shleifer, Ed Steinfeld, Scott Stern,Ksenia Yudaeva, Luigi Zingales, three anonymous referees, and seminar participants at the NBERcorporate "nance workshop, the Stockholm School of Economics, and the Federal Reserve Bank ofChicago. Florencio Lopez-de-Silanes kindly provided access to unpublished data. Konstantina Drakouliand Matthew Utterback were very helpful research assistants. Generous support was provided by theMIT Entrepreneurship Center and the Russian}European Centre for Economic Policy (RECEP).
Simon Johnson!,*, Peter Boone", Alasdair Breach#,Eric Friedman$
!Sloan School of Management, Massachusetts Institute of Technology, Cambridge, MA 02142, USA"Brunswick UBS Warburg, 52/4 Kosmodamianskaya Nab., Moscow, Russian Federation
#Goldman Sachs, 22/13 Voznesensky Pereulok, Moscow, Russian Federation$Department of Economics, Rutgers University, New Brunswick, NJ 08903, USA
Received 4 February 1999; received in revised form 19 October 1999
Abstract
The `Asian Crisisa of 1997}98 a!ected all the `emerging marketsa open to capital#ows. Measures of corporate governance, particularly the e!ectiveness of protection forminority shareholders, explain the extent of exchange rate depreciation and stock marketdecline better than do standard macroeconomic measures. A possible explanation is thatin countries with weak corporate governance, worse economic prospects result in moreexpropriation by managers and thus a larger fall in asset prices. ( 2000 Elsevier ScienceS.A. All rights reserved.
0304-405X/00/$ - see front matter ( 2000 Elsevier Science S.A. All rights reserved.PII: S 0 3 0 4 - 4 0 5 X ( 0 0 ) 0 0 0 6 9 - 6
1. Introduction
What caused the large exchange rate depreciations and stock market declinesin some Asian countries during 1997}98? The three main explanations for the`Asian crisisa emphasize macroeconomic and banking issues. The standardWashington view attributes the Asian crisis to inappropriate macroeconomicpolicy during the 1990s, made worse by inept management of the initial depre-ciation in 1997 (Greenspan, 1998; Corsetti et al., 1998). In contrast, Radelet andSachs (1998a, b) and Wade and Veneroso (1998) argue that the crisis began witha mild panic that had no real foundation and was made serious only by IMFpressure to increase interest rates and to close down banks. Krugman (1998)presents a third theory based on international bank behavior, arguing there wasa `Pangloss equilibriuma that caused a bubble in asset prices. In his view, theAsian panics had their origins in implicit (and implausible) guarantees o!ered bygovernments and believed by investors.
These explanations agree that for some reason, perhaps unrelated to economicfundamentals, there was a loss of con"dence by domestic and foreign investors inall emerging markets. This led to a fall in capital in#ows and an increase in capitalout#ows that triggered, in some cases, a very large nominal depreciation anda stock market crash. At the same time, these explanations do not address exactlywhy this loss of con"dence had such large e!ects on the exchange rate and stockmarket in some emerging market countries but not in others.
This paper presents evidence that the weakness of legal institutions forcorporate governance had an important e!ect on the extent of depreciations andstock market declines in the Asian crisis. By `corporate governancea we meanthe e!ectiveness of mechanisms that minimize agency con#icts involving man-agers, with particular emphasis on the legal mechanisms that prevent theexpropriation of minority shareholders (see Shleifer and Vishny, 1997a). Thetheoretical explanation is simple and quite complementary to the usual macro-economic arguments. If expropriation by managers increases when the expectedrate of return on investment falls, then an adverse shock to investor con"dencewill lead to increased expropriation as well as lower capital in#ow and greaterattempted capital out#ow for a country. These, in turn, will translate into lowerstock prices and a depreciated exchange rate. In the case of the Asian crisis, we"nd that corporate governance provides at least as convincing an explanationfor the extent of exchange rate depreciation and stock market decline as any orall of the usual macroeconomic arguments.
The Bangkok Bank of Commerce is a well-documented example of expropri-ation by managers that worsened as the bank's "nancial troubles deepened.
As the losses mounted, Thai authorities say, more and more money was movedo!shore, much of it through a now-defunct Russian bank2 [It] came to looklike straight siphoning (The Wall Street Journal, May 10, 1999, p. A6.)
Finec=1093=KGM=VVC
142 S. Johnson et al. / Journal of Financial Economics 58 (2000) 141}186
The experience of creditors in Hong Kong who lent to "rms doing business inmainland China is similar } Hong Kong-based company liquidators are notable to recover assets of Chinese companies that default on loans (Wall StreetJournal, August 25, 1999, p. A14.) More generally, very few debt defaults fromthe Asian crisis of 1997}98 have resulted in investors receiving any liquidationvalue. The Economist (January 30, 1999, p. 59) reports that `despite the creationlast year of a bankruptcy law in Indonesia where there had been none before, itis still virtually impossible to force a defaulted debtor into liquidation (the fewcreditors that have tried are still tangled up in legal appeals).aDuring the crisis,Korean minority shareholders protested the transfer of resources out of large"rms, including Samsung Electronics and SK Telecom. Most collapses of banksand "rms in Russia after the devaluation of August 1998 were associated withcomplete expropriation; creditors and minority shareholders got nothing(Troika Dialog, 1999). Table 1 summarizes the details of leading allegations ofexpropriation in countries a!ected by the Asian crisis. Note that in many ofthese cases, controlling shareholders did not need to break any local laws inorder to expropriate from investors.
In most of these instances, management was able to transfer cash and otherassets out of a company with outside investors, perhaps to pay the manage-ment's personal debts, to shore up another company with di!erent shareholders,or to go straight into a foreign bank account. The fact that management in mostemerging markets is also the controlling shareholder makes these transferseasier to achieve. The downturns in these countries have been associated withsigni"cantly more expropriation of cash and tangible assets by managers.
Our results highlight the importance of the legal protection a!orded creditorsand minority shareholders and are closely linked to the recent "ndings of LaPorta et al. (1997, 1998, 1999b), hereafter referred to as LLSV. These authorsshow that the extent to which creditor and minority shareholder rights areprotected explains a great deal of the variation in how "rms are funded andowned across countries. In particular, LLSV (1997) provide evidence froma sample of 49 countries that weak shareholder rights and poor enforcementlead to underdeveloped stock markets. Here we show that weak enforcement ofshareholder rights has "rst-order importance in determining the extent ofexchange rate depreciation and stock market collapse in 1997}98.
Related ideas have been expressed by Yellen (1998), Rajan and Zingales (1998),and Caballero and Krishnamurthy (1998). Yellen argues that `a &relationships'model of capital allocation is extraordinarily susceptible to a deterioration inperceptions about the quality of investment decisions.a Rajan and Zingalesexplain the problems that can occur when a relationship-based "nancial system isopened up to capital in#ows. Caballero and Krishnamurthy emphasize theunderinvestment in appropriate collateral that occurs due to incentive problems.
Section 2 presents the assumptions and implications of our model. Section 3explains our sources and data on exchange rate depreciation and stock market
Finec=1093=KGM=VVC
S. Johnson et al. / Journal of Financial Economics 58 (2000) 141}186 143
Tab
le1
Alle
ged
inci
den
tsofst
ealing
inth
eA
sian"nan
cial
crisis.!
Com
pany
Cou
ntr
yD
ate
Alleg
edin
ciden
t
Ban
gkok
Ban
kof
Com
mer
ceThai
land
1996}97
Ban
km
anag
ers
mov
edm
one
yto
o!sh
ore
com
pan
ies
unde
rth
eir
contr
ol.
United
Eng
inee
rs(M
alay
sia)
Bhd
Mal
aysia
1997}98
United
Eng
inee
rsba
iled
out
its"nan
cial
lytr
oub
led
par
ent,
Ren
ong
Bhd,
by
acqu
irin
ga
33%
stak
eat
anar
ti"ci
ally
high
price
.
Mal
aysia
Air
Sys
tem
Bhd.
Mal
aysia
1998
The
chai
rman
used
com
pan
yfu
nds
tore
tire
per
sonal
deb
ts.
PT
Ban
kBal
iIn
don
esia
1997}98
Man
ager
sdi
vert
edfu
nds
inord
erto"na
nce
apol
itic
alpa
rty.
Sinar
Mas
Gro
up
Indon
esia
1997}98
Gro
up
man
ager
str
ansfer
red
fore
ign
exch
ange
loss
esfrom
am
anufa
cturing
com
-pa
nyto
agr
oup-
contr
olle
dban
k,e!
ective
lyex
pro
priat
ing
the
ban
k's
cred
itor
san
dm
inor
ity
shar
ehol
der
s.
Guan
gdong
Inte
rnat
ional
Tru
st&
Inve
stm
entC
oH
ong
Kon
g/C
hina
1998}99
Ass
etsth
athad
been
ple
dge
das
colla
tera
ldisap
pear
edfrom
the
com
pan
yw
hen
itw
ent
bank
rupt
.
Siu-F
ung
Cer
amic
sC
oH
ong
Kon
g/C
hina
1998}99
Ass
etsth
athad
been
ple
dge
das
colla
tera
ldisap
pear
edfrom
the
com
pan
yw
hen
itw
ent
bank
rupt
.
Toko
ban
kR
ussia
1998}99
Cre
ditors
who
may
hav
ebe
enlink
edto
ban
km
anag
ers
took
cont
rolofth
eba
nkan
dits
rem
ainin
gas
sets
follo
win
gde
fault.Fore
ign
cred
itor
sgo
tnoth
ing.
Men
atep
Russ
ia19
98Follo
win
gM
enat
ep's
ban
kru
ptcy
,m
anag
ers
tran
sfer
red
ala
rge
num
ber
of
re-
gion
albra
nch
esto
anoth
erban
kth
eyco
ntr
olle
d.
AO
Yuk
os
Russ
ia19
98}99
Man
ager
str
ansfer
red
Yuko
s's
mos
tva
luab
lepe
trole
um-p
rodu
cing
prop
erties
too!
shore
com
pan
ies
they
contr
olle
d.
Unex
imba
nk
Russ
ia19
99Follo
win
gU
nex
imban
k's
ban
kru
ptcy
,m
anag
ers
move
dpro"ta
ble
cred
it-c
ard
proce
ssin
gan
dcu
stodi
alope
rations
toan
oth
erban
k.
Sam
sung
Ele
ctro
nic
sC
o.
Kore
a19
97}98
Man
ager
sus
edca
shfrom
Sam
sung
Ele
ctro
nics
tosu
pport
other
mem
ber
softh
eSa
msu
nggr
oup
(not
ably
Sam
sung
Moto
rs)th
atw
ere
losing
mon
ey.
Hyu
nda
iK
ore
a19
98}99
Man
ager
sofa
Hyu
nda
i-co
ntr
olle
din
vest
men
tfu
ndch
annel
led
mone
yfrom
reta
ilin
vest
ors
tolo
ss-m
akin
g"rm
sin
the
Hyu
ndai
group
.
!Sourc
es:f
orW
allS
tree
tJo
urn
al,M
ay7,
1999
,p.A
1;A
pril
17,1
998,
p.A
12;S
epte
mbe
r21
,199
9,p.
A1;
Augu
st25
,199
9,p.A
14;A
pril
4,19
99,p
.A1;
Apr
il8,
1999
,p.A
14.The
Eco
nom
ist,
Mar
ch27
,199
9an
dSe
ptem
ber
11,1
999.
Finec=1093=KGM=VVC
144 S. Johnson et al. / Journal of Financial Economics 58 (2000) 141}186
1A referee has pointed out that we could cast the model in terms of general agency problems formanagers (e.g., shirking). Our results apply directly to any managerial agency problems that becomeworse in an economic downturn. Note that many forms of stealing are actually legal in countrieswith weak legal environments (Johnson et al., 2000).
declines during the Asian crisis. Section 4 brie#y assesses the ability of standardmacroeconomic measures to explain the magnitude of depreciation in 1997}98.Section 5 shows that measures of corporate governance provide a better ex-planation for the extent of exchange rate depreciation, and Section 6 assessesboth macroeconomic and corporate governance explanations for stock marketperformance in 1997}98. Section 7 concludes by evaluating the relative strengthof corporate governance and macroeconomic explanations for what happenedin the Asian crisis.
2. Stealing and speculative attacks
2.1. A simple static model
Consider the following simple model, which is related to LLSV (1999b)although they assume a di!erent timing for expropriation relative to investment.As in Jensen and Meckling (1976), the con#ict of interest is between insiders(managers) and outsiders (equity owners in our simple model). The managerowns share a of the "rm and outsiders own share 1!a. Retained earnings aredenoted by I. The manager steals S*0 of retained earnings and obtains utilityof S from them. We use `stealinga as shorthand for more general forms ofexpropriation by managers.
Stealing is costly and the manager expects to lose C(S)"(S2/2k) when hesteals because, for example, other people need to be paid o! and there is someprobability that the manager will be caught and punished. A higher value ofk } representing, in this case, weaker corporate governance rules or a weakerlegal system or both } means that it is less costly to steal. Thus, the value ofstealing, S!C(S), is concave in S. The marginal value of stealing falls as theamount stolen increases because it becomes harder to steal as the absoluteamount of theft increases; the stealing becomes more obvious and easier fora court to stop.1
The manager invests what he does not steal in a project that earns a gross rateof return R, which is greater than one, and from which he obtains the share a ofpro"ts. The manager's optimization problem is given by
MaxS;(S; R, k, a)"Max[aR(I!S)#S!(S2/2k)],
and the optimal amount of theft, SH, is found by solving
L;/LS"1!(SH/k)!aR"0,
Finec=1093=KGM=VVC
S. Johnson et al. / Journal of Financial Economics 58 (2000) 141}186 145
which yields
SH(R, k, a)"k(1!aR).
We assume that the parameter values are such that the manager will not attemptto steal more than the total amount of retained earnings, or SH(R, k, a))I. Thissimpli"es the analysis by avoiding a corner solution, without changing the maininsights.
The manager equalizes the marginal cost and marginal bene"t of stealing.Because the manager owns a of the "rm, he has an incentive to invest at leastsome of the "rm's cash rather than to steal it all. As a rises, the equilibriumamount of stealing falls. As k rises, the amount of stealing in equilibrium rises. Ifa'1/R, the manager's stealing is `negativea, meaning the manager puts in someof his own money into the "rm, perhaps to keep the "rm alive and enjoy`positivea stealing in the future (Friedman and Johnson, 1999). For our pur-poses, we assume that a is low enough that the manager chooses to steal.Alternatively, we could assume that the manager is credit constrained. In thisstatic model, assuming that the manager never steals less than zero does notsubstantially alter the analysis.
Di!erentiating the optimal stealing equation with respect to R gives
(LSH/LR)"!ak.
An increase in the rate of return on the invested resources reduces the amount ofstealing because it raises the marginal opportunity cost of the stolen resources.
A larger a means LSH/LR is more negative. If the manager owns more of the"rm, then a given increase in the return on investment convinces him to put moreresources into the investment project and, therefore, to steal less. Conversely, if themanager owns more but the return on investment declines, then he steals more.
A larger value of k means that LSH/LR is more negative. A lower cost ofstealing (higher k) both raises the equilibrium value of stealing and makesstealing more responsive to changes in the rate of return on investment. This isbecause higher k both shifts up the stealing function and makes it less concave(i.e., the returns to stealing do not decrease so strongly.)
The outside investor receives share (1!a) of the returns from the funds thatare actually invested in the "rm. The expected value of the equity in the "rm istherefore
P"R(I!k(1!aR)),
where P is the equity value of the "rm. This is the value of all the equity held byboth outsiders and managers, which equals the total value of the "rm minus thevalue of stealing.
Di!erentiating with respect to R gives the `absolute responsiveness,a
o!"LP/LR"I!k#2Rka,
Finec=1093=KGM=VVC
146 S. Johnson et al. / Journal of Financial Economics 58 (2000) 141}186
2 In order to make the main point, we have presented a simpli"ed model that ignores generalequilibrium e!ects. Assuming a is exogenous, the expected return for an outside investor variesbetween countries that have a di!erent value of k. In equilibrium this would not occur becauseoutside investors would want to invest more in the country with a higher return. A complete modelwould include these general equilibrium e!ects.
3Di!erentiating absolute responsiveness with respect to k gives:
Lo!/Lk"L2P/LRLk"(!LS/Lk)#[!R(L2S/LRLk)].
The "rst term is always negative: a higher value of k increases the absolute level of stealing. But thesecond term is positive }when k is higher, a given change in R induces a smaller change in the level ofstealing (due to the convex stealing costs). When the second term is relatively large in absolute terms,i.e., when R is high, then L2P/LRLk will be positive.
which is the sensitivity of "rm value to changes in R. This is always positivebecause we have assumed that the optimal level of stealing is less than I. Themaximum value of stealing, given by the "rst-order condition when aR is zero, isk. We have already assumed that there cannot be `negativea stealing, so k)I,and thus is su$cient to ensure that o
!'0.
There are two e!ects of a higher R. The "rst, direct e!ect is to raise theexpected payo! and thus increase the amount that the investor is willing to putinto the "rm. Holding the level of stealing constant, the direct e!ect shows thatthe value of the "rm rises. The second, indirect e!ect works because higherreturns from investment reduce the optimal level of stealing, so LS*/LR(0.Lower stealing also raises the expected payo! for outside investors and increasesthe value of the "rm.2
What is the e!ect on LP/LR of changing the penalty for managerial theft, k?The e!ect on the absolute responsiveness is
Lo!/Lk"2Ra!1.
For low values of aR, such that Ra(1/2, a higher value of k (a lower penalty)implies a fall in LP/LR. For high values of aR, however, a higher value ofk implies an increase in LP/LR. The intuition for this result is that when aR issmall the manager is already stealing a great deal, so P is already low in absoluteterms and thus further changes in R do not induce much additional theft.3
However, we can obtain an unambiguous prediction for the relative respon-siveness,
o3"(LP/LR)/P"(I!k(1!aR)#Rka)/R(I!k(1!aR)),
which is the sensitivity of "rm value in percentage terms. The derivative of thischange with respect to k is
Lo3/Lk"Ia/(I!k#Rka)2'0.
This e!ect is positive regardless of the value of a. Note that the relation betweenabsolute and relative responsiveness is
L(o!)/Lk"L(Po
3)/Lk"P[Lo
3/Lk]#[LP/Lk](o
3).
Finec=1093=KGM=VVC
S. Johnson et al. / Journal of Financial Economics 58 (2000) 141}186 147
The "rst term is positive. The second term contains LP/Lk, which is negative.A higher value of k (i.e., a weaker legal environment) implies that (LP/LR)/Pincreases, so that the value of the "rm, P, becomes more sensitive in percentageterms to a change in the rate of return, R. The same result holds if we allow "rmsto borrow debt as well as issue equity. However, the presence of debt impliesa range of values for R within which a lower value of R actually means lessstealing because the manager steals less (or even transfers funds into the "rm ifthat is possible) in order to enable the "rm to service its debt and thereforepreserve the possibility of future stealing. If R falls su$ciently low, however, thenthe manager will choose to loot the "rm and it will go out of existence. In thedata, therefore, we will look at percentage changes in "rms' values.
2.2. Implications for the exchange rate
Our model so far has dealt exclusively with the e!ect of a loss of con"dence onthe value of a single "rm. Aggregating similar "rms to create an economy-widecollapse of "rms' values is straightforward. We can also reasonably assume thatforeign investors and many domestic investors care about returns in dollars. Wethen have the result that a fall in R, which is now a loss of con"dence aboutreturns in dollars, can trigger a fall in "rms' values in dollars (i.e., the value of thestock market in dollar terms). Note that "rms' values could fall sharply, even ifthere is not much actual stealing, because the value of "rms' to outsiders isdetermined by expected expropriation.
But will such a collapse of "rms' values occur alongside an exchange ratecollapse? Theoretically, a sharp fall in stock prices need not a!ect the exchangerate. Outside investors can choose to bring more capital into the country if, forexample, they are more patient than domestic investors. The exchange rate onlydepreciates if the loss of con"dence about R also triggers a fall in capital in#owsor larger capital out#ows. Greenspan (1998, p. 3) explains the depreciation spiraland its spread across countries as follows: `The loss of con"dence can triggerrapid and disruptive changes in the pattern of "nance, which, in turn feeds backon exchange rates and asset prices. Moreover, investor concerns that weak-nesses revealed in one economy may be present in others that are similarlystructured means that the loss of con"dence can be quickly spread to othercountries.a In fact, if the foreign exchange market is forward looking, the mereprospect of a reduction in net capital in#ows should be enough to cause animmediate depreciation.
There are "ve reasons why a loss of con"dence can cause the net capital in#owto fall and why this fall can be larger when corporate governance is weaker.First, when the expected return to outside investors is lower, investing ina country is less attractive. Outside investors receive less because the actualreturns on investment projects are lower and because managers steal more. Fora given level of expected risk, lower expected returns tend to reduce the net
Finec=1093=KGM=VVC
148 S. Johnson et al. / Journal of Financial Economics 58 (2000) 141}186
capital in#ow to a particular country. In a full model, if investors learn that theexpected return in a country is lower, while risk is unchanged or has even increased,their preference for assets in this country will be reduced. This is one reason whymany global investment funds cut their positions in emerging markets in 1997}98(see International Organization of Securities Commissions (1998)). Weaker corpo-rate governance means lower short-term expected returns or more risk or both.
Second, there are important agency-related reasons why traders who havejust lost a great deal of money cannot immediately invest more in a country,even if they believe that the expected returns are high. Shleifer and Vishny(1997b) develop a model in which traders cannot persuade their "nancialbackers that they should be allowed to invest more, because having lost moneymay indicate that the trader has bad judgment: `The seemingly perverse behav-ior of taking money away from an arbitrageur after noise trader sentimentdeepens, i.e., precisely when his expected return is greatest, is a rational responseto the problem of trying to infer the arbitrageur's (unobserved) ability and futureopportunities jointly from past returnsa, (p. 41.) In reaction to a fall in assetprices, "nancial backers might insist that the trader cut his or her position ina country even further. Shleifer and Vishny (1997b) make this argument forhedge funds involved in arbitrage, but the same argument can be applied tolarge international banks lending to countries. As these investors pull theirmoney out, the exchange rate depreciates.
Third, there could be particular institutional reasons why commercial banksrefuse to roll over their loans. This might be due to regulatory rules andprocedures that limit a bank's `value at riska (Cornelius, 1999). When prices fallin a market, the value-at-risk models used by international banks can generatethe direct requirement that the bank reduce its exposure to that country(Folkerts-Landau and Garber, 1998.) Unless the borrower defaults when theloans are not rolled over, this constitutes a capital out#ow. Even if the borrowerdefaults, there will still be a reduction in new capital in#ow. The details ofvalue-at-risk models vary, but a bigger fall in asset prices, due to worse corpo-rate governance, can plausibly trigger a larger reduction in the bank's invest-ment position in all the assets of that country.
The fourth reason that a loss of con"dence can trigger a decline in net capitalin#ow is that when managers choose to steal more of the corporate cash, theymight take the money outside the country. For this to happen, managers mustcare about their returns in foreign currency terms, perhaps because they havepersonal expenses in dollars or because they feel that local-currency-denominated assets, such as bank deposits, are not the right place to keep theproceeds of what they have stolen (e.g., because they want to avoid taxes.)Weaker corporate governance means that more is stolen for a given reduction inexpected R, leading to more capital #ight and deeper currency depreciation.
Finally, as an important complement to the previous four explanations, theremight be no safe haven for investors in local-currency-denominated assets.
Finec=1093=KGM=VVC
S. Johnson et al. / Journal of Financial Economics 58 (2000) 141}186 149
Management of local commercial banks can also engage in theft, raising theprobability that these banks will default. The government could guarantee bankdeposits but in most emerging markets there is a signi"cant risk that thegovernment will default. In fact, in some emerging market countries, such asIndonesia and Thailand, there was no liquid market for government securities at thetime of the crisis. In the view of many investors during the Asian crisis, theprobability of government default went up as the value of "rms and tax receiptswent down. The only government that actually defaulted on domestic currency debtduring the crisis was Russia, but a number of other governments appear to havecome close. Thus, when the value of "rms began to fall in each emerging marketcountry, both domestic and foreign investors tried to withdraw their money from alldomestic-currency-denominated assets, leading to greater capital out#ows for coun-tries with weaker corporate governance. Note that there can be a net capitalout#ow even if foreign investors remain con"dent. A loss of con"dence in local-currency-denominated assets by domestic investors can be just as damaging.
These arguments suggest that the extent of exchange rate depreciation can bea!ected by corporate governance institutions. As long as a larger fall in "rms'values means that investors are less inclined to buy their securities, then capitalcan #ow out of the country. The evidence in fact shows a sharp reduction incapital in#ows to emerging markets after July 1997, turning into capital out-#ows by September (Brunswick Warburg, 1999). The World Bank (1999,pp. 25}26) estimates that capital out#ows from emerging markets increased by$80 million between 1996 and 1997. We do not have precise estimates of capital#ows, including capital #ight, by country. Net capital in#ows to emergingeconomies peaked at $330 billion in 1996 but fell to less than half that in theAsian crisis (Goldman Sachs, Emerging Markets Quarterly, July 1999, p. 3).
2.3. Corporate governance and volatility
In our model, there need not be any actual expropriation by managers whiletimes are good, for example when aR*1. Typically, in most emerging marketsa is above 0.3 (i.e., much higher than is usual in the U.S.), so a reasonablyoptimistic expectation for R might be enough to remove the incentive formanagerial theft. Detailed examination of insider ownership in some emergingmarkets is in La Porta et al. (1999) and LLSV (1999b), who "nd, for example,that the median cash #ow rights (in companies where insiders control more than20% of the votes) are 41% in Argentina, 26% in Korea, 28% in Hong Kong,34% in Mexico, 20% in Israel, and 31% in Singapore. This suggests that the`institutionsa that protect investors' rights are not important as long as growthlasts, because managers do not want to steal. It may even be possible to attracta great deal of outside capital during a period when the economy expands. Butwhen growth prospects decline, the lack of good corporate governance becomesimportant. Without e!ective shareholder protection, a mild shock can entail
Finec=1093=KGM=VVC
150 S. Johnson et al. / Journal of Financial Economics 58 (2000) 141}186
a large increase in stealing, which in turn causes a large depreciation. This explains,for example, how a country can grow rapidly even if its institutions are #awed.Prime Minister Mahathir of Malaysia argues that rapid growth implies that theinstitutions are good: `We were growing at the rate of more than 8% a year foralmost ten years. You must give us credit for knowing how to run the countrya (TheFar Eastern Economic Review, July 2, 1998, p. 15.) However, our model showsthat institutions matter most when an economy experiences a downturn.
According to this argument, a country can grow rapidly for an inde"nite periodeven if it has weak protection for shareholder rights. But weak institutions of thiskind make a country vulnerable, in the sense that a small negative shock to expectedfuture earnings can have a large e!ect on the economy. If this theory is correct,institutions a!ect volatility, speci"cally the size of the decline in asset values andexchange rates when there is an adverse shock to expected future earnings.
Our argument suggests two empirical issues to investigate. First, across countrieswhere there is some initial loss of con"dence, does the exchange rate depreciatemore when corporate governance is weaker? We deal with this in Section 5. Oursimple model is silent on whether de facto or de jure shareholder and creditor rightsmatter more. We can test these alternatives by examining which kinds of rights weremore important in determining the extent of exchange rate depreciation in 1997}98.Second, the model predicts that countries with poor corporate governance shouldalso have weaker ex post stock market performance if we include the 1997}98 crisis.We examine the evidence on this point in Section 6.
3. Data
3.1. Measuring the crisis
Our basic sample is 25 emerging markets: Argentina, Brazil, Chile, China,Colombia, the Czech Republic, Greece, Hong Kong, Hungary, India, Indonesia,Israel, Korea, Malaysia, Mexico, Philippines, Poland, Portugal, Russia, Sin-gapore, Thailand, Turkey, Taiwan, South Africa, and Venezuela. The list in-cludes six countries from Latin America, four from Eastern Europe, ten fromAsia, plus Greece and Portugal in Europe, Turkey and Israel in the Middle East,and South Africa. There is no universally accepted de"nition of the `emergingmarketsa involved in the Asian crisis, but our sample of 25 includes almost allthe countries regarded as `emerginga by the International Finance Corporation,The Economist, J.P. Morgan, Goldman Sachs, and Flemings Research. This isthe set of developing countries with relatively large "nancial markets andrelatively open capital accounts.
According to the IFC (Emerging Markets Factbook 1997, p. 334), at the end of1996 there was completely free entry and exit of capital (with regard to listedstocks) in 12 of our countries: Argentina, Brazil, the Czech Republic, Greece,
Finec=1093=KGM=VVC
S. Johnson et al. / Journal of Financial Economics 58 (2000) 141}186 151
Hungary, Malaysia, Mexico, Poland, Portugal, Russia, South Africa, and Tur-key. There was also `relatively free entrya and free exit in Chile, Korea,Thailand, and Venezuela. There was `relatively free entrya and `some restric-tionsa on exit in Indonesia. Formally, there was free entry and exit only forspecial classes of shares in China and the Philippines, although the anecdotalevidence suggests that these capital controls have only really been e!ective inChina. Only authorized investors were allowed into Colombia and India, butfree exit was allowed. The tightest market access, according to the IFC measure,was in Taiwan, where only authorized investors were allowed in and there were`some restrictionsa on the repatriation of income and capital. The IFC did notclassify Hong Kong, Israel, and Singapore.
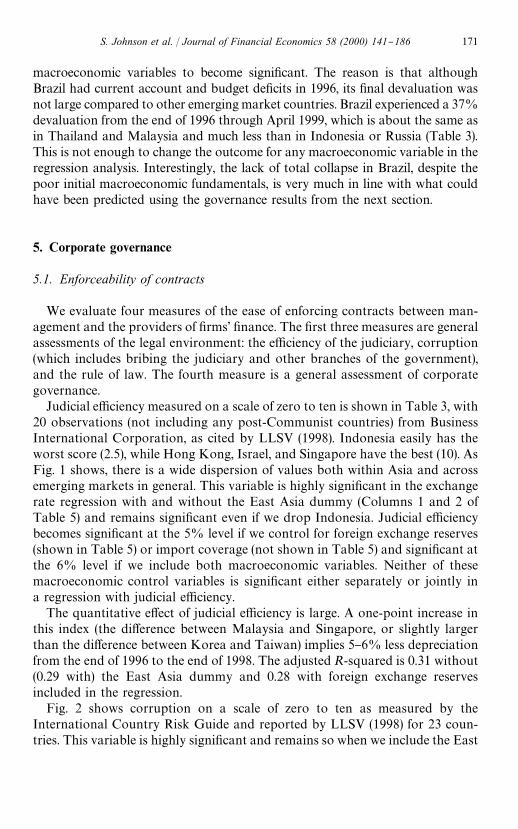
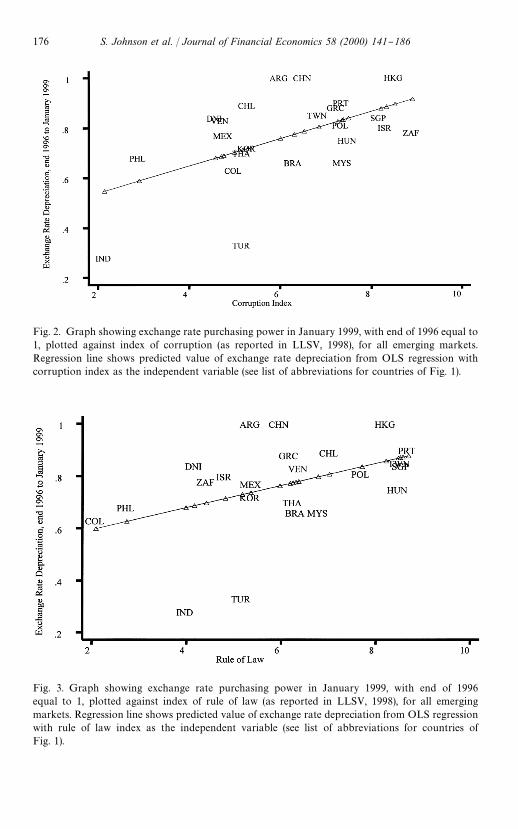
We follow the literature on the Asian crisis by regarding the extent of thenominal exchange rate depreciation as the key variable to be explained. Speci"-cally, our most important dependent variable is the change in the nominalexchange rate from the end of 1996 to January 1999. We take the end of 1996 asthe starting point and measure the change in purchasing power over the nexttwo years of currencies relative to the U.S. dollar. If the exchange rate depreci-ates from 2,500 to 10,000 to the dollar (as with the Indonesian rupiah), it has lostthree-quarters of its purchasing power (i.e. four times as many rupiah are neededto buy one dollar). Alternatively, its purchasing power now is one-quarter of itsformer level and this country would score 0.25 in our index of change inpurchasing power. Table 2 shows the exchange rates and change in purchasingpower of exchange rates for alternative ending points for the 25 countries in oursample.
The crisis clearly began in summer 1997 with the initial devaluation ofThailand. However, there is no agreement on when the crisis ended. There werebasically four phases: fall 1997, when the major problems were in Asia and a fewcountries in Latin America; spring 1998, when the crisis is perceived to havespread to Russia and Brazil; summer 1998, when Russia devalued; and fall 1998,when Brazil struggled against devaluation. The crisis from Brazil's point of viewcontinued at least through the eventual devaluation in January 1999, althoughby this time most of the Asian countries were starting to recover (and theirexchange rates were actually appreciating). All our regressions use mid-January1999 as the ending point. None of our results are a!ected by including orexcluding Brazil's January 1999 devaluation, and we also perform similarregression results using March 1998, July 1998, September 1998, November1998, and April 1999 as alternative ending points. Table 2 presents the rawexchange rate data for these alternative dates. We report these robustnesschecks in more detail as we move through the analysis.
For stock markets, we use the International Finance Corporation's InvestableIndex (published in the IFC's 1998 and 1999 Emerging Markets Factbook andupdated daily in the Financial Times) which measures stock market returns fora selected set of companies in U.S. dollars. This index includes the largest and
Finec=1093=KGM=VVC
152 S. Johnson et al. / Journal of Financial Economics 58 (2000) 141}186
most liquid stocks in each market. Using the IFC's Investable Index reduces theusual problem whereby posted prices in illiquid markets are not real transactionprices. Table 3 reports the value of this IFC index at the end of 1998 and at itslowest point in 1998, assuming that the value for each country was equal to 100at the end of 1996. The IFC does not report an index for Hong Kong orSingapore, so we use the standard Hang Seng Stock Index and Straits TimesStock Index respectively, converted into U.S. dollars.
Some countries begin to show de"nite signs of economic recovery in thesecond half of 1998, just as other countries are experiencing the full e!ects of thecrisis. For example, the Korean index we use reaches a low point of 23.6 at theend of September, but recovers to 53.1 by the end of the year. In our mainregressions we therefore look at the lowest point in the stock market during1998 to measure how far the market falls as a result of the crisis. We also checkour results using the end of 1998 as an alternative end point.
In terms of the model, our empirical tests assume that R and a are constantacross countries. We test whether k, as measured by corporate governancevariables, has an independent impact. This assumption is reasonable to a "rstapproximation because the anecdotal evidence suggests there was a similarshock across all emerging markets. Most of the essays in Hunter et al. (1999)argue or assume that there was a similar shock of some kind across all emergingmarkets (see also Biers, 1998). We do not know if the size of this initial shock tocon"dence was exactly the same in all countries, but the evidence indicates boththat the initial loss of con"dence was small and that, at least in fall 1997, almostevery emerging market was a!ected (International Monetary Fund, 1997.) It ispossible that the shock was larger in countries with weaker institutions forreasons that are unrelated to institutions. However, there is no evidence of sucha pattern to the shock. The anecdotal evidence suggests that there was a smallloss of investor con"dence that began in Thailand, spread through Asia, andthen suddenly included other emerging markets, marked by a surprising sell-o!in Hong Kong from October 1997. By November 1997 there had been somesmall loss of con"dence or questioning of future prospects in almost all emergingmarkets.
3.2. Measuring economic conditions
To measure prior economic conditions we use standard macroeconomicaggregates (the raw data are in Table 3). We use the versions of these datapublished by two investment banks, J.P. Morgan (Emerging Markets: EconomicIndicators, Dec. 5, 1997) and Goldman Sachs (Emerging Markets Biweekly, Dec.10, 1997). Both of these organizations build their databases using the availableinformation from national statistical o$ces and international organizations,most notably the IMF and the World Bank, but they also put a great deal ofe!ort into ensuring that the data are comparable across countries. In addition,
Finec=1093=KGM=VVC
S. Johnson et al. / Journal of Financial Economics 58 (2000) 141}186 153
Tab
le2
Ext
ent
ofex
chan
gera
tede
pre
ciat
ion
inem
ergi
ngm
arket
s,19
97}99
.!
Purc
hasing
pow
erofcu
rren
cyExc
han
gera
tes
Mar
ch19
98/
end
1996
July
1998
/en
d19
96
Sept
1998
/en
d19
96
Nov
1998
/en
d19
96
Jan
1999
/en
d19
96
Apr
1999
/en
d19
96End-
1996
Mar
ch-
98Ju
ly-
98Se
ptem
ber
-98
Nov.
1998
Janu
ary- 99
Apr
il- 99
Arg
entina
1.00
1.00
1.00
1.00
1.00
1.00
0.99
981
11
11
1Bra
zil
0.92
0.90
0.88
0.87
0.66
0.63
1.04
1.13
1.16
1.18
1.19
1.58
1.66
Chi
le0.
940.
900.
900.
920.
890.
8942
4.35
453
471
473
462
478
479
Chi
na
1.00
1.00
1.00
1.00
1.00
1.00
8.30
8.28
8.28
8.28
8.28
8.28
8.28
Colo
mbia
0.74
0.74
0.67
0.64
0.63
0.63
1,00
61,
354
1,35
21,
498
1,56
71,
595
1,59
4C
zech
0.80
0.83
0.89
0.93
0.88
0.78
27.2
334
32.9
30.5
29.4
31.1
35G
reec
e0.
860.
810.
840.
880.
880.
8224
6.71
287
306
295
280
279
300
Hong
Kon
g1.
001.
001.
001.
001.
001.
007.
737.
747.
757.
757.
747.
757.
75H
ung
ary
0.77
0.73
0.73
0.75
0.75
0.69
161.
6520
922
022
221
521
623
4In
dia
0.91
0.85
0.84
0.85
0.84
0.84
35.8
339
.542
.242
.642
.342
.542
.8In
dones
ia0.
240.
160.
200.
270.
280.
272,
363
9,65
014
,500
11,7
008,
850
8,47
58,
625
Isra
el0.
910.
890.
850.
760.
800.
813.
253.
583.
663.
834.
294.
054.
03K
ore
a0.
540.
620.
620.
640.
720.
7084
5.50
1565
1371
1362
1312
1167
1214
Mex
ico
0.92
0.88
0.76
0.79
0.77
0.83
7.87
8.58
8.93
10.3
89.
9410
.17
9.51
Mal
aysia
0.66
0.61
0.66
0.66
0.66
0.66
2.53
3.81
4.15
3.8
3.8
3.8
3.8
Phili
ppi
nes
0.66
0.64
0.60
0.67
0.68
0.69
26.3
039
.841
.443
.939
.438
.438
.2Pola
nd0.
820.
820.
790.
830.
810.
722.
863.
483.
493.
623.
433.
533.
98Port
ugal
0.83
0.83
0.88
.0.
900.
8215
5.25
186
186
177
173.
417
3.43
189.
2
Finec=1093=KGM=VVC
154 S. Johnson et al. / Journal of Financial Economics 58 (2000) 141}186
Rus
sia
0.93
0.93
0.33
0.36
0.24
0.22
5.59
66
1715
.63
23.2
25.8
Singa
pore
0.86
0.83
0.81
0.87
0.84
0.83
1.41
1.64
1.69
1.74
1.62
1.68
1.69
Thai
land
0.58
0.61
0.63
0.70
0.70
0.68
25.6
444
.442
.141
36.6
36.5
37.6
Turk
ey0.
470.
410.
390.
380.
330.
2910
9,09
523
2,15
526
7,53
027
6,40
029
0,12
032
9,00
037
9,28
0Tai
wan
0.86
0.80
0.79
0.85
0.85
0.84
27.5
032
34.4
34.6
32.5
32.3
32.9
Ven
ezue
la0.
920.
860.
810.
840.
830.
8147
6.26
519
555
587
567
571
589
South
Afric
a0.
950.
780.
750.
840.
780.
774.
684.
936.
016.
245.
576
6.08
!Sou
rces
(1)The
Eco
nom
ist
for
Mar
ch19
98,Ju
ly19
98,Sep
tem
ber
1998
,N
ovem
ber
1998
,Ja
nua
ry19
99,a
nd
April19
99M
arch
exch
ange
rate
sar
eM
arch
4ofea
chye
ar(fr
omThe
Eco
nom
ist,
Mar
ch7t
h,19
98)
July
exch
ange
rate
sar
eJu
ly1
(fro
mThe
Eco
nom
ist,
July
4th,1
998)
Sept
ember
exch
ange
rate
sar
eSep
tem
ber
9th
(from
The
Eco
nom
ist,
Sep
tem
ber
12th
,19
98)
Nove
mber
exch
ange
rate
sar
eN
ovem
ber
4th
(from
The
Eco
nom
ist,
Nov
embe
r7t
h,1
998;
this
issu
edid
not
repo
rta
rate
for
Por
tuga
l);t
he
Nov
embe
r19
98ex
chan
gera
tefo
rP
ortu
galis
from
the
Inte
rnat
iona
lF
inan
ceC
orpora
tion's
Em
ergi
ngM
arket
sD
atab
ase
(199
9).
Janu
ary
1999
exch
ange
rate
sar
eJa
nuar
y20
th(fr
omThe
Eco
nom
ist,
Janua
ry23
rd,19
99);
Por
tuga
lis
from
the
Wal
lSt
reet
Jour
nal,
Janu
ary
28A
pril19
99ex
chan
gera
tes
are
Apr
il21
st(fro
mThe
Eco
nom
ist,
April24
th,1
999)
;Por
tuga
lis
from
the
Fin
anci
alTim
esA
pril
23(2
)IF
C19
98,p.
32fo
ren
dof19
96(T
heIF
Cdo
esno
tre
port
anex
chan
gera
tefo
rH
ong
Kon
gan
dSin
gapo
re;t
hese
are
from
The
Eco
nom
ist,
Janu
ary
2nd,
1999
)The"rs
tsix
colu
mns
show
the
chan
gein
purc
has
ing
pow
erofth
ecu
rren
cy,ta
king
the
end
of19
96as
equal
toone.
Chan
gein
purc
hasing
pow
eris
calc
ula
ted
asth
eex
chan
gera
teat
the
end
of19
96div
ided
by
the
exch
ange
rate
in19
98or
1999
.The
exch
ange
rate
atth
een
dof
1996
isgi
ven
inth
ese
venth
colu
mn.
Exc
han
gera
tes
for
1998
and
1999
are
inth
e8t
h}14
thco
lum
ns.
All
exch
ange
rate
sar
elo
calcu
rren
cyunits
per
U.S
.dolla
r.The
sam
ple
isth
e25`e
mer
ging
mar
ket
s,a
asvi
ewed
byin
tern
atio
nal
inve
stor
s.Thes
ear
ere
lative
lyla
rge
dev
elop
ing
countr
ies
open
toca
pital#ow
s.W
eus
eth
ese
tofc
ountr
ies
clas
si"ed
asem
ergi
ng
mar
kets
by
The
Eco
nom
ist(a
lthou
ghP
ortu
galw
asdro
pped
from
this
group
in19
98),
J.P.M
org
an,
and
Gold
man
Sach
s.
Finec=1093=KGM=VVC
S. Johnson et al. / Journal of Financial Economics 58 (2000) 141}186 155
Tab
le3
Dat
aus
edin
regr
ession
s.!
Mac
roec
onom
icva
riab
les
Gov
ernm
ent
budg
etba
lance
asa
Per
cent
1996
Bro
adm
oney
grow
th,
%per
annu
m,
1996
Curr
ent
acco
unt
asa
per
cent
ofG
DP
,19
96
Tota
lre
serv
es,
billi
ons
ofU
Sdolla
rsat
the
end
of19
96
Import
cove
rage
,m
onth
sof
import
s,at
the
end
of19
96
Tota
lfo
reig
ndeb
t,m
illio
ns
of
US
dolla
rs,
atth
een
dof
1996
Fore
ign
debtas
aper
centof
expo
rts,
for
1996
Sho
rt-ter
mde
btan
dam
ortiza
tion
asa
per
cent
ofre
serv
es,
for
1996
Inte
rest
paym
ents
asa
perc
ent
ofex
port
s,fo
r19
96
Ext
ernal
debt-
GD
Pra
tio,
end
of
1996
Arg
entina
!2.
019
.8!
1.3
18.1
5.8
105,
388
311
111
18.6
0.35
Bra
zil
!3.
928
.9!
3.3
60.1
5.7
194,
046
296
148
20.6
0.26
Chi
le2.
223
.6!
3.3
14.8
8.7
24,4
4911
432
6.5
0.34
Chi
na
!0.
925
.30.
910
7.0
8.8
150,
541
7039
2.6
0.18
Colo
mbia
!1.
121
.0!
5.4
9.6
6.3
26,8
9816
062
13.7
0.31
Cze
ch!
0.1
9.2
!8.
012
.43.
420
,412
6062
6.0
0.39
Gre
ece
!7.
413
.3!
3.7
17.5
5.8
55,3
3621
916
83.
70.
37H
ong
Kon
g1.
318
.31.
963
.83.
949
1,10
014
4n.
a.n.
a.2.
2H
ung
ary
!3.
320
.9!
3.2
9.8
3.5
27,6
4699
6310
.70.
64In
dia
!5.
016
.5!
1.1
20.2
5.2
95,7
9717
293
10.1
0.27
Indo
nes
ia0.
029
.6!
3.4
18.3
4.6
121,
374
198
152
11.7
0.53
Isra
el!
4.3
25.0
!7.
011
.43.
147
,600
231
n.a.
190.
504
Kore
a!
1.8
16.2
!4.
733
.21.
510
6,92
267
377
3.6
0.22
Mex
ico
0.4
30.5
!0.
619
.42.
116
9,67
512
224
211
.70.
51M
alay
sia
!0.
520
.6!
6.3
27.0
2.6
38,5
5338
742.
40.
39
Finec=1093=KGM=VVC
156 S. Johnson et al. / Journal of Financial Economics 58 (2000) 141}186
Phili
ppi
nes
!0.
215
.8!
4.5
10.0
2.1
56,6
1611
719
46.
60.
68Pola
nd
!2.
529
.0!
1.0
17.8
5.3
41,6
2810
314
4.2
0.31
Port
ugal
!2.
35.
6!
1.4
21.9
5.7
65,0
1025
5n.
a.16
.30.
607
Rus
sia
!7.
833
.72.
111
.33.
112
3,11
712
912
27.
30.
27Si
nga
pore
7.0
9.8
15.2
76.8
6.0
288,
500
188
n.a.
n.a.
3.00
Thai
land
1.5
16.6
!4.
337
.74.
498
,368
124
134
3.5
0.65
Turk
ey!
8.2
120.
5!
2.4
16.5
3.5
79,7
4715
219
78.
70.
43Tai
wan
!8.
77.
84.
088
.06.
942
,797
3037
1.4
0.15
Ven
ezue
la1.
448
.313
.111
.88.
834
,037
120
648.
30.
39So
uth
Afric
a!
5.6
13.6
!1.
60.
91.
532
,927
8918
86.
70.
26
Sourc
eJP
Morg
anan
dse
ebe
low
Gol
dm
anSa
chs
and
see
belo
w
JPM
org
anan
dse
ebe
low
JPM
org
anan
dse
ebe
low
JPM
org
anan
dse
ebe
low
JPM
org
anan
dse
ebe
low
JPM
org
anan
dse
ebe
low
JPM
org
anJP
Morg
anan
dse
ebe
low
JPM
orga
nan
dse
ebe
low
Coun
trie
sm
issing
Non
eN
one
Non
eN
one
Non
eN
one
Non
eIs
rael
Hong
Kon
gN
one
Por
tuga
lSin
gapo
reH
ong
Kon
gSi
ngap
ore
Sam
ple
size
2525
2525
2525
2521
2325
Finec=1093=KGM=VVC
S. Johnson et al. / Journal of Financial Economics 58 (2000) 141}186 157
Tab
le3
(con
tinu
ed) C
orpo
rate
gove
rnan
ceva
riab
les
Judic
ial
e$ci
ency
Corr
uption
Rule
of
law
Enfo
rcea
ble
min
ority
shar
edhol
der
righ
ts
Ant
i-di
rect
ors
righ
tsC
reditors
righ
ts
Acc
ounting
stan
dar
ds,
1990
Arg
entina
6.0
6.0
5.4
3.0
41
45Bra
zil
5.8
6.3
6.3
3.0
31
54C
hile
7.3
5.3
7.0
3.5
52
52C
hina
n.a.
6.5
6.0
n.a.
n.a.
n.a.
n.a.
Colo
mbia
7.3
5.0
2.1
n.a.
30
50C
zech
n.a.
n.a.
n.a.
2.0
n.a.
n.a.
n.a.
Gre
ece
7.0
7.3
6.2
n.a.
21
55H
ong
Kon
g10
.08.
58.
23.
05
469
Hung
ary
n.a.
7.5
8.5
3.0
n.a
.n.a
.n.
a.In
dia
8.0
4.6
4.2
2.0
54
57In
dones
ia2.
52.
14.
01.
02
4n.
a.Is
rael
10.0
8.3
4.8
3.0
34
64K
ore
a6.
05.
35.
41.
02
362
Mex
ico
6.0
4.8
5.4
3.0
10
60M
alay
sia
9.0
7.4
6.8
2.0
44
76
Finec=1093=KGM=VVC
158 S. Johnson et al. / Journal of Financial Economics 58 (2000) 141}186
Phili
ppi
nes
4.8
2.9
2.7
3.0
30
65Pola
nd
n.a.
7.4
7.7
4.0
n.a
.n.a
.n.
a.Port
ugal
5.5
7.4
8.7
n.a.
31
36R
uss
ian.
a.n.a
.n.a
.2.
0n.a
.n.a
.n.
a.Si
nga
pore
10.0
8.2
8.6
4.0
44
78Thai
land
3.3
5.2
6.3
2.0
23
64Turk
ey4.
05.
25.
22.
02
251
Tai
wan
6.8
6.9
8.5
3.0
32
65V
enez
uela
6.5
4.7
6.4
n.a.
1n.
a.40
South
Afric
a6.
08.
94.
42.
55
370
Sourc
eL
LSV
"19
98LL
SV19
98LLSV
1998
Fle
min
gsLL
SV19
98LLSV
1998
LLSV
1998
Coun
trie
sm
issing
Chi
na
Cze
chC
zech
Rep
ublic
Chi
na
Chin
aC
hin
aC
hina
Cze
chR
ussia
Rus
sia
Colo
mbi
aC
zech
Rep
ubl
icC
zech
Rep
ublic
Cze
chR
epub
licH
ung
ary
Gre
ece
Hung
ary
Hung
ary
Hung
ary
Pola
nd
Por
tuga
lPola
nd
Pola
ndPola
nd
Rus
sia
Ven
ezue
laR
ussia
Russ
iaR
ussia
Ven
ezue
laIn
dones
ia
Sam
ple
size
2023
2320
2019
19
Finec=1093=KGM=VVC
S. Johnson et al. / Journal of Financial Economics 58 (2000) 141}186 159
Tab
le3
(con
tinu
ed)
IFC
inve
stab
lein
dex
inat
low
est
poin
tin
1998
(with
end
of19
96"
100)
IFC
inve
stab
lein
dex
aten
dof
1998
(with
end
of19
96"
100)
Mont
hin
whic
hIF
Cin
vest
able
inde
xre
ached
low
estpoin
tin
1998
Arg
entina
68.9
83.9
Aug
ust
Bra
zil
69.4
69.4
Sept
ember
Chi
le62
.472
.8A
ugus
tC
hina
29.0
35.5
Aug
ust
Colo
mbia
51.6
69.4
Oct
obe
rC
zech
59.4
72.3
Augu
stIn
dia
75.0
81.5
Nove
mber
Gre
ece
124.
925
5.5
Janu
ary
Hong
Kon
g41
.147
.8Se
ptem
ber
Hung
ary
103.
914
2.6
Sept
ember
Indo
nes
ia8.
519
.0Se
ptem
ber
Isra
el94
.710
2.2
Oct
ober
Kore
a30
.668
.7Se
ptem
ber
Mex
ico
73.7
90.5
Augu
stM
alay
sia
12.8
26.3
Augu
stPhili
ppi
nes
22.7
41.9
Augu
stPola
nd
63.3
71.5
Augu
stPort
ugal
158.
819
9.8
Sept
ember
Russ
ian.
a.n.
a.Se
ptem
ber
Singa
pore
40.8
61.2
Sept
ember
Thai
land
14.3
28.5
Augu
stTurk
ey90
.798
.4O
ctobe
rTai
wan
66.3
75.6
Augu
stV
enez
uela
37.5
62.3
Aug
ust
South
Afric
a49
.760
.0A
ugus
t
Finec=1093=KGM=VVC
160 S. Johnson et al. / Journal of Financial Economics 58 (2000) 141}186
Sourc
eIF
C#
1999
IFC
1999
IFC
1999
Coun
trie
sm
issing
Rus
sia
Rus
sia
Sam
ple
size
2424
!Add
itio
nalnu
mbe
rsto"ll
gaps
(at
reco
mm
endat
ion
ofre
fere
e)ar
efrom
:Fisca
lde"ci
tin
Isra
el,P
ortu
gal,
and
Ven
ezue
la(fr
omW
orld
Ban
k,19
99)
Bro
adm
oney
grow
thin
Gre
ece,
Isra
el,a
ndP
ortu
gal(fr
om
Wor
ldBan
k,19
99)
Cur
rentac
coun
tin
Isra
elan
dPort
uga
l(fr
omW
orld
Ban
k,19
99)
Tota
lre
serv
esin
Isra
elan
dP
ortg
ual
(from
Wor
ldB
ank,
1999
)Im
port
cove
rage
inIs
rael
,P
ortu
gal,
and
Sin
gapo
re(fr
om
World
Ban
k,19
99);
dat
afo
rH
ong
Kong
calc
ula
ted
from
Pol
itic
alR
isk
Ser
vice
s(1
999)
,w
ww
.cou
ntr
ydat
a.co
m.
Tota
lfo
reig
ndeb
tfo
rH
ong
Kon
g,Is
rael
and
Singa
por
e(fr
om
Gol
dm
anSac
hs19
99);
dat
afo
rPor
tuga
lfrom
Polit
ical
Risk
Ser
vice
s(1
999)
,w
ww
.cou
ntr
ydat
a.co
m.
Fore
ign
deb
tas
aper
centof
expor
tsfo
rH
ong
Kong
and
Sin
gapor
e(fr
om
Gol
dman
Sach
sE
mer
ging
Mar
ket
sQ
uar
terly,
July
1999
);dat
afo
rP
ort
uga
lan
dIs
rael
from
Polit
ical
Risk
Ser
vice
s(1
999)
,w
ww
.cou
ntr
ydat
a.co
m.
Inte
rest
pay
men
tsas
aper
cent
ofex
port
sfo
rIs
rael
from
Pol
itic
alR
isk
Ser
vice
s19
99Ext
ernal
Deb
t-G
DP
ratio
forH
ong
Kong
and
Sin
gapore
(from
Gol
dm
anSa
chs,
Em
ergi
ngM
arke
tsQ
uart
erly
,199
9);d
ata
forIs
rael
and
Por
tuga
lfrom
Polit
ical
Risk
Ser
vice
s(1
999)
,w
ww
.cou
ntr
ydat
a.co
m.
Note
that
the
info
rmat
ion
onde
bt/ex
por
tsan
din
tere
stpay
men
ts/e
xport
san
ddeb
t/G
DP
for
Hong
Kong
and
Singa
pore
isfo
rea
rly
1999
Var
iable
de"nitio
nsnot
give
nin
colu
mn
head
ings
Judic
ialE$
cien
cy,T
able
1in
LLSV
(199
8)de
scribe
sth
isva
riab
leas
follow
s.A
sses
smen
toft
he`e$
cien
cyan
din
tegr
ity
oft
hele
gale
nvironm
entas
ita!
ects
busines
s,par
ticu
larly
fore
ign"rm
sapr
odu
ced
byth
eco
untr
y-risk
rating
agen
cyB
usin
ess
Inte
rnat
iona
lC
orpor
atio
n.It`m
aybe
taken
tore
pres
entin
vest
ors'as
sess
men
tsofc
ond
itio
nsin
the
countr
yin
que
stio
n.aA
vera
gebet
wee
n19
80an
d19
83.S
cale
from
0to
10,w
ith
low
ersc
ores
[mea
nin
g]lo
wer
e$ci
ency
leve
ls.
Cor
ruption
The
dat
afo
rC
hina,
Hun
gary
,Pol
and
are
not
inLL
SV(1
998)
but
wer
epro
vide
dby
Lope
z-de-
Sila
nes
(199
8).T
able
1in
LLSV
(199
8)de
scribe
sth
isva
riab
leas
follow
s.IC
R's
asse
ssm
entofth
eco
rrup
tion
ingo
vern
men
t.Low
ersc
ores
indic
ate
that`h
igh
gove
rnm
ento$
cial
sar
elik
ely
todem
and
spec
ialpa
ymen
tsa
and
`ille
gal
pay
men
tsar
ege
nera
llyex
pec
ted
thro
ugh
out
low
erle
vels
ofgo
vern
men
tain
the
form
of`b
ribes
conne
cted
with
import
and
expo
rtlic
ense
s,ex
chan
geco
ntro
ls,t
axas
sess
men
t,po
licy
pro
tect
ion,o
rlo
ans.a
Ave
rage
ofth
em
ont
hs
ofA
prilan
dO
ctobe
rof
the
mont
hly
inde
xbet
wee
n19
82an
d19
95.S
cale
from
0to
10,w
ith
low
ersc
ore
sfo
rhi
gher
leve
lsof
corr
upt
ion.(W
e[L
LSV
]ch
ange
dth
esc
ale
from
its
orig
inal
range
goin
gfrom
0to
6.)
Finec=1093=KGM=VVC
S. Johnson et al. / Journal of Financial Economics 58 (2000) 141}186 161
Tab
le3
Footnot
e(c
ontinu
ed)
Rul
eofl
aw.
The
dat
afo
rC
hin
a,H
unga
ry,P
olan
dw
ereag
ain
provi
ded
by
Lop
ez-d
e-Si
lane
s.Tab
le1
inLLSV
(199
8)des
crib
esth
isva
riab
leas
follo
ws.
Ass
essm
ent
ofth
ela
wan
dor
der
trad
itio
nin
the
count
rypro
duce
dby
the
countr
y-risk
rating
agen
cyIn
tern
atio
nal
Coun
try
Risk
(IC
R).
Ave
rage
ofth
em
ont
hs
ofA
pril
and
Oct
obe
rofth
em
onth
lyin
dex
bet
wee
n19
82an
d19
95.
Scal
efrom
0to
10,w
ith
low
ersc
ores
for
less
trad
itio
nfo
rla
wan
dor
der
.(W
e[L
LSV
]ch
ange
dth
esc
ale
from
its
orig
inal
rang
ego
ing
from
0to
6.)
Ant
i-direc
tor
righ
ts.
Tab
le1
inL
LSV
(199
8)des
crib
esth
isva
riab
leas
follo
ws.
An
index
aggr
egat
ing
the
shar
ehold
errigh
tsw
hich
we
label
edas`y
anti-d
irec
torrigh
ts.a
The
inde
xis
form
edby
addin
g1
when
:(1)
the
countr
yal
low
ssh
areh
older
sto
mai
lthei
rpro
xyvo
teto
the"rm
;(2)
shar
ehol
der
sar
eno
tre
quired
todep
ositth
eirsh
ares
priorto
the
Gen
eral
Shar
ehold
ers'
Mee
ting;
(3)
cum
ula
tive
voting
orpro
por
tion
alre
pres
enta
tion
ofm
inorities
inth
ebo
ard
ofdirec
tors
isal
low
ed;(
4)an
oppr
esse
dm
inorities
mec
han
ism
isin
pla
ce;(
5)th
em
inim
um
perc
enta
geof
shar
eca
pita
ltha
ten
titles
ash
areh
old
erto
call
foran
Ext
raor
dinar
yShar
ehol
ders'M
eeting
isle
ssth
anoreq
ualt
o10
per
cent
(the
sam
ple
med
ian)
;or
(6)sh
areh
olde
rshav
epre
empt
ive
righ
tsth
atca
nonly
be
wai
ved
bya
shar
ehol
ders'vo
te.The
inde
xra
nges
from
0to
6.
Cre
ditor
righ
ts.
Tab
le1
inL
LSV
(199
8)de
scribe
sth
isva
riab
leas
follow
s.A
nin
dex
aggr
egat
ing
di!
eren
tcr
editor
righ
ts.T
he
index
isfo
rmed
by
addi
ng
1w
hen
(1)t
he
count
ryim
pose
sre
strict
ions,
such
ascr
editors'co
nsen
tor
min
imum
divi
den
dsto"le
forre
org
aniz
atio
n;(2
)sec
ure
dcr
editors
are
able
toga
inpo
sses
sion
ofth
eirse
curity
once
the
reor
ganiz
atio
npe
tition
hasbee
nap
prove
d(n
oau
tom
atic
stay
);(3
)se
cure
dcr
editors
are
ranked"rs
tin
the
distr
ibution
ofth
epr
ocee
ds
that
resu
ltfrom
the
dispo
sition
ofth
eas
sets
of
aban
kru
pt"rm
;and
(4)t
he
deb
tordoe
snotre
tain
the
adm
inistr
atio
nof
itspro
per
type
ndi
ng
the
reso
lution
oft
here
org
aniz
atio
n.T
he
index
rang
esfrom
zero
tofo
ur.
Acc
ounting
stan
dar
ds.
Tab
le1
inL
LSV
(199
8)des
crib
esth
isva
riab
leas
follo
ws.
Inde
xcr
eate
dby
exam
inin
gan
dra
ting
com
panie
s'19
90an
nua
lre
port
son
thei
rin
clusion
or
om
ission
of90
item
s.Thes
eitem
sfa
llin
tose
ven
cate
gories
(gen
eral
info
rmat
ion,
inco
me
stat
emen
ts,b
alan
cesh
eets
,fun
ds#ow
stat
emen
t,ac
coun
ting
stan
dard
s,st
ock
dat
a,an
dsp
ecia
litem
s.)A
min
imum
ofth
ree
com
panie
sin
each
coun
try
wer
est
udie
d.The
com
pan
iesre
pre
sent
acr
ossse
ctio
nofv
ario
usin
dust
rygr
oup
s;in
dus
tria
lcom
panie
sre
pres
ente
d70
perc
ent,
and"nan
cial
com
panie
sre
pre
sente
dth
ere
mai
nin
g30
perc
ent.
"LLSV
1998
isLa
Port
a,Lop
ez-d
e-Sila
nes
,Sh
leife
ran
dV
ishny
(199
8).
#IF
C19
99is
the
Inte
rnat
ional
Fin
ance
Corp
orat
ion'
s(1
999)
Em
ergi
ngM
arke
tF
actb
ook.
Finec=1093=KGM=VVC
162 S. Johnson et al. / Journal of Financial Economics 58 (2000) 141}186
using these sources helps us examine whether information actually available tothe "nancial markets before the crisis is useful in predicting the exchange rate.Following the suggestion of a referee, we "ll gaps in these data using numbersfrom the World Bank and the IMF (details are in Table 3).
3.3. Measuring institutions
We use the measures for e$ciency of the legal system, corruption, rule of law,and strength of corporate governance reported in LLSV (1998). E$ciency of thelegal system is the assessment by an independent organization, Business Inter-national Corporation, of `the e$ciency and integrity of the legal environment asit a!ects businessa (LLSV, 1998, p. 1124). Corruption is an assessment byanother independent organization, International Country Risk Services, of theextent of corruption in the government, particularly the extent to which busi-nesses have to pay bribes. The rule of law is also an assessment by InternationalCountry Risk Services and is their opinion of the `law and order traditiona inthe country (LLSV 1998, Table 1). Corporate governance is LLSV's (1998)assessment of the de jure rights of shareholders (particularly what they call`anti-directora rights). LLSV (1998) also provide measures of creditor rights. The"nal LLSV (1998) measure we use is their index of accounting standards. The rawdata and precise de"nitions for all these measures are reported in Table 3.
All of these measures are calculated well before the Asian crisis. E$ciency ofthe legal system pertains to 1980}83. The measures of corruption and law andorder cover 1982}95. The measures of corporate governance are calculatedprimarily using data for the early and mid-1990s.
In their Global Emerging Markets (June, 1998) Flemings Research develops analternative measure of corporate governance across emerging markets. Theyasked their country specialists to consider `the disclosure of information, trans-parency of ownership structures, management and special interest groups,adequacy of the legal system, whether the standards that are set are actuallyenforced, and if the boards of companies are independent and the rights ofminority shareholders are uphelda (p. 19). This index therefore tries to capturethe extent of shareholder rights in practice. The index runs from one to "ve witha higher score meaning more rights and they note that `a score of 5 would beawarded to the US } our model marketa (p. 20). One disadvantage of thismeasure is that it was published in spring 1998, and therefore could in partre#ect reassessments of shareholder rights in light of the Asian crisis.
We test the importance of alternative measures of macroeconomic policy andinstitutional structure using regressions with the change in the value of thenominal exchange rate on the left-hand side. We then test the leading contendersusing additional control variables and in multiple regressions. Our regressionsalso include a dummy variable for being in East Asia, in case there is anAsian-speci"c element to the crisis (e.g., countries are a!ected just because they
Finec=1093=KGM=VVC
S. Johnson et al. / Journal of Financial Economics 58 (2000) 141}186 163
are close to each other or because Asian countries faced a di!erent shock). TheEast Asia dummy is equal to one for China, Hong Kong, Indonesia, Korea,Malaysia, Philippines, Singapore, Thailand, and Taiwan. We do not includeIndia because it seems that "nancial markets regard India as part of South Asia.Nothing substantive changes if we allow the Asian dummy to include India. Thisdummy can also partly capture the notion that there was herding in the idea thatinvestors should `sell Asia.a
Some of our regressions have fewer than 25 observations, because we usuallylack comparable data on a few countries. We check the robustness of our resultsby using alternative samples, in particular so as to judge the macroeconomic andcorporate governance variables using the same set of countries. Because we do nothave a full set of corporate governance data for "ve transition economies (China,the Czech Republic, Hungary, Poland, and Russia) we also report summaryresults for the macroeconomic regressions without these "ve countries.
4. Macroeconomic measures
Much of the debate over the Asian crisis has focused on the relative import-ance of "ve macroeconomic variables: the budget de"cit, monetary policy, thecurrent account, foreign exchange reserves, and foreign debt. The raw data forthese measures are presented in Table 3. The dependent variable used in thissection is the percent loss of purchasing power of exchange rates in emergingmarkets from the end of 1996 to January 1999.
4.1. Fiscal and monetary policy
Table 3 shows government "scal balance as a percent of gross domesticproduct (GDP) in 1996 for 25 countries (a minus sign indicates a budget de"cit).It is striking that Indonesia had a balanced government budget and none of theAsian countries that experienced a large depreciation had a serious "scal de"cit.Not surprisingly, the "rst two columns of Table 4 show that the governmentbudget de"cit is not signi"cant in the exchange rate regression, either by itself orwith the inclusion of the East Asia dummy. The R-squared is 0.09 before weinclude the East Asia dummy and rises to only 0.10 with that dummy.
In the standard theory of balance of payments crises (Krugman, 1979), thebudget de"cit should a!ect the exchange rate through a!ecting the moneysupply. Even if budget de"cits have no discernible direct e!ect, there could be animpact via money growth. Table 3 shows the growth rate of broad money in1996 for 25 countries. It is just signi"cant in the exchange rate regressions at the10% level with or without the East Asia dummy (columns 3 and 4 of Table 4)when we drop Turkey, which is an extreme outlier with 120% money growth.With Turkey in the sample, broad money growth is signi"cant and negative atthe 5% level.
Finec=1093=KGM=VVC
164 S. Johnson et al. / Journal of Financial Economics 58 (2000) 141}186
Tab
le4
Mac
roec
ono
mic
variab
les.!
Dep
enden
tva
riab
le:ex
chan
gera
tepu
rchas
ing
pow
erin
Janu
ary
1999
(end
ofD
ecem
ber
1996
"1)
Eas
tA
sia
dum
my
!0.
02!
0.07
!0.
01!
0.13
!0.
03(0
.10)
(0.0
8)(0
.1)
(0.1
)(0
.1)
Fis
cal
and
mon
etar
ypo
licy
Gove
rnm
entbudg
etba
lanc
e0.
020.
02(0
.01)
(0.0
1)
Bro
adm
oney
grow
th!
0.00
7H!
0.00
8H(0
.004
)(0
.004
)
Cur
rent
acco
unt
and
rese
rves
Cur
rentac
coun
t0.
006
0.00
6(0
.008
)(0
.008
)
Tota
lre
serv
es0.
0024
0.00
4HH
(0.0
02)
(0.0
02)
Impo
rtco
vera
ge0.
04H
0.04H
(0.0
2)(0
.02)
R-s
quar
ed0.
090.
10.
120.
150.
020.
030.
110.
170.
160.
16
Adj
ust
edR
-squar
ed0.
050.
020.
080.
07!
0.02
!0.
070.
070.
10.
120.
08
Obse
rvat
ions
2525
2424
2525
2525
2525
Coe$
cien
tan
dst
andar
der
ror
0.00
70.
009
!0.
004
!0.
005
0.01
0.01
0.00
20.
004HH
0.03H
0.03H
ifdr
optr
ansition
coun
trie
s(0
.010
)(0
.010
)(0
.004
)(0
.004
)(0
.007
)(0
.008
)(0
.002
)(0
.002
)(0
.017
)(0
.018
)
Cou
ntr
ies
notin
regr
ession
Turk
eyTurk
ey
Finec=1093=KGM=VVC
S. Johnson et al. / Journal of Financial Economics 58 (2000) 141}186 165
Tab
le4
(con
tinu
ed)
Dep
ende
ntva
riab
le:ex
chan
gera
tepu
rcha
sing
pow
erin
Janu
ary
1999
(end
ofD
ecem
ber
1996
"1)
Eas
tA
sia
dum
my
!0.
03!
0.06
!0.
01!
0.09
!0.
01(0
.10)
(0.1
1)(0
.10)
(0.1
2)(0
.10)
Ext
erna
lde
btTota
lfo
reig
nde
bt
0.00
03!
0.00
04(0
.004
)(0
.000
5)
Fore
ign
deb
t/ex
por
ts!
0.00
2!
0.00
04(0
.000
6)(0
.000
7)
Short
-ter
mde
btan
dam
ort
izat
ion
aspe
rcen
tofre
serv
es
!0.
0007
!0.
0007
(0.0
005)
(0.0
006)
Inte
rest
paym
ents
aspe
rcen
tofex
por
ts!
0.00
5!
0.00
9(0
.01)
(0.0
1)
Deb
t-G
DP
ratio
!0.
33!
0.33
(0.3
2)(0
.33)
R-s
quar
ed0.
030.
030.
010.
020.
080.
080.
050.
050.
060.
06
Adj
ust
edR
-squar
ed!
0.02
!0.
07!
0.05
!0.
090.
040.
08!
0.03
!0.
060.
005
!0.
05
Obse
rvat
ions
2525
2525
2121
2323
2525
Coe$
cien
tan
dst
andar
der
ror
!0.
0004
!0.
0005
!0.
0001
!0.
0005
!0.
0007
!0.
0007
!0.
005
!0.
01!
0.56HH
!0.
55if
drop
tran
sition
coun
trie
s(0
.000
)(0
.004
)(0
.000
6)(0
.000
8)(0
.000
5)(0
.000
6)(0
.01)
(0.0
1)(0
.31)
(0.3
3)
Coun
trie
snotin
regr
ession
Isra
elIs
rael
Hong
Kon
gH
ong
Kon
gP
ortu
gal
Por
tuga
lSin
gapo
reSin
gapo
reH
ong
Kon
gH
ong
Kon
gSin
gapo
reSin
gapo
re
Finec=1093=KGM=VVC
166 S. Johnson et al. / Journal of Financial Economics 58 (2000) 141}186
!Note
sA
llre
sults
are
for
OL
Sre
gres
sion
sw
ith
exch
ange
rate
purc
has
ing
pow
eras
the
depen
den
tva
riab
le.
Exc
han
gera
tepu
rcha
sing
pow
eris
low
erin
Janu
ary
1999
rela
tive
toth
een
dof
1996
ifth
ere
has
been
mor
ede
pre
ciat
ion.
Ther
efor
e,a
pos
itiv
eco
e$ci
enton
ava
riab
lem
eans
itis
asso
ciat
edw
ith
less
dep
reci
atio
n.
All
regr
ession
suse
the
full
sam
ple
for
whic
hda
tais
avai
lable
,bu
tTurk
eyis
dro
ppe
dfrom
the
money
grow
thre
gres
sion.
De5
nition
ofva
riab
les
used
inre
gres
sion
sG
ove
rnm
entbud
get
bala
nce
isth
ece
ntra
lgo
vern
men
t's
bud
get
de"ci
t(if
nega
tive
)or
surp
lus
(ifpo
sitive
)as
aper
centofG
DP
in19
96.
Bro
adm
oney
grow
this
the
grow
thof
abro
adm
oney
aggr
egat
ein
1996
.C
urr
entac
count
isth
eco
unt
ry's
curr
ent
acco
unt
de"ci
t(if
nega
tive
)or
surp
lus
(ifpos
itiv
e)as
aper
cent
ofG
DP
in19
96.
Tota
lre
serv
esar
ece
ntra
lba
nkre
serv
esin
billi
ons
ofdol
lars
atth
een
dof
1996
.Im
port
cove
rage
isth
era
tio
ofim
port
sto
rese
rves
,m
easu
red
inm
onth
sofim
port
s,in
1996
.Tota
lfo
reig
nde
btis
the
stoc
kof
priv
ate
and
public
debt
info
reig
ncu
rren
cyou
tsta
ndin
gat
the
end
of19
96,i
nU
Sdol
lars
.Sh
ort
-ter
mde
btan
dam
ortiza
tion
asa
per
cent
ofre
serv
esm
easu
res
pay
men
tson
fore
ign
deb
tin
1996
.In
tere
stpa
ymen
tsas
ape
rcen
tof
expo
rts
wer
ein
1996
.D
ebt-G
DP
ratio
isth
era
tio
offo
reig
ndeb
tout
stan
ding
atth
een
dof
1996
toG
DP
in19
96.
The
tran
sition
countr
ies
are
Chin
a,C
zech
Rep
ublic
,Hun
gary
,Pola
nd,a
ndR
uss
ia.
The
Eas
tA
sia
dum
my
iseq
ual
toone
for
Chi
na,
Hong
Kong
,In
dones
ia,K
orea
,M
alay
sia,
Phili
ppin
es,S
inga
pore
,Thai
land,
and
Tai
wan
.
The
dep
ende
ntva
riab
leis
the
pur
chas
ing
pow
erof
the
curr
ency
vis-
a-vi
sth
eU
Sdolla
rin
Janu
ary
1999
,ta
king
the
end
of19
96as
equa
lto
100.
The
valu
esus
edar
ein
Tab
le1.
HSig
ni"ca
ntat
10%
leve
l.HH
Sig
ni"ca
ntat
5%le
vel.
Stan
dar
der
rors
are
inbra
cket
s.
Finec=1093=KGM=VVC
S. Johnson et al. / Journal of Financial Economics 58 (2000) 141}186 167
This result should be treated with care. Of the countries with large deprecia-tions, only Russia had signi"cant de"cit-induced money growth. Indonesia hadhigh money growth in 1996 and a large depreciation in 1996}98, but its budgetwas essentially balanced before the crisis. If we drop Indonesia and Turkey,money growth in 1996 is not signi"cant.
4.2. Current account and reserves
The current account as a percent of GDP in 1996 is shown in Table 3 with 25observations. There are two outliers, Singapore and Venezuela, with a very highcurrent account surplus. This measure of the current account is not signi"cant inexplaining the exchange rate depreciation by itself (Table 4). Even if we dropSingapore and Venezuela there is no signi"cant result using the current accountas an explanatory variable.
If the exchange rate collapses involved a loss of con"dence by investors,irrespective of macroeconomic fundamentals, then we would expect reserves offoreign exchange at the central bank to be signi"cant explanatory variables.Countries with more reserves should be able to withstand an out#ow of capitalor speculation against their currency.
The simplest measure is total reserves in dollar terms. We use total reserves inU.S. dollars for 25 countries at the end of 1996 (see Table 3). Table 4 shows thattotal reserves are not quite signi"cant at the 10% level in the basic regressionbut with the East Asia dummy included they become signi"cant at the 5% level.The adjusted R-squared is 0.1. The quantitative e!ect of higher reserves is small:$10 billion extra reserves implies 4% less depreciation in the exchange rate from1997 to 1998 (in addition to the e!ect of being in East Asia). This suggests thatonly in countries with huge reserves, such as China, Taiwan, Singapore, andHong Kong, was there really a signi"cant impact on the exchange rate fromholding more reserves.
Table 3 shows the months of imports (`import coveragea) provided byreserves in 25 countries. There is a positive correlation in the regression,signi"cant at the 5% level without the East Asia dummy and at 10% with thisdummy, meaning that a higher degree of import coverage is associated with lessdepreciation (Table 4). The adjusted R-squared is 0.12. For a country such asChina, which held almost ten months' worth of reserves, there is a large positivee!ect relative to Korea, which held under two months' worth.
4.3. Foreign debt
There is a general view among economists that Asian countries must, in somesense, have overborrowed. As Yellen (1998) explains, capital in#ows can easilyand rapidly become capital #ight when there has been a great deal of short-termlending.
Finec=1093=KGM=VVC
168 S. Johnson et al. / Journal of Financial Economics 58 (2000) 141}186
There are several reasonable ways to measure foreign indebtedness. Wecan look at total debt directly or, alternatively, we can assess the `debt burdenaof an economy by comparing debt relative to the size of the economy or itsability to generate foreign exchange earnings through exports. We can alsoconsider the maturity structure of the debt, interest payments as a percent ofexports, and the ratio of debt to GDP. All the debt numbers here include bothpublic and private debt (to the extent it is known) denominated in foreigncurrency.
The simplest measure of external debt is the total dollar amount of indebted-ness, both public and private, of a country. According to the available numbersfor 25 countries in our sample, at the end of 1996 Brazil had a high level ofindebtedness at nearly $200 billion, while Russia and Indonesia both hadaround $120 billion (Table 3). Total indebtedness is insigni"cant in our ex-change rate regressions both without and with the East Asia dummy (Table 4).This variable is insigni"cant even if we drop Hong Kong, which had the highestlevel of gross indebtedness. Gross indebtedness numbers for Hong Kong andSingapore are only available from investment banks' research reports, whichwere probably not calculated and published until after the crisis broke. Ourresults without both Hong Kong and Singapore are not substantively changed.We look at four other reasonable foreign debt measures: debt as a percent ofexports, short-term debt plus amortization as a percent of reserves, interestpayments as a percent of exports, and the Debt-GDP ratio. None are signi"cantin the regressions reported in Table 4.
4.4. Robustness checks
We have not found any speci"cation in which combinations of macroeco-nomic variables have stronger e!ects than individual variables. Combiningother macroeconomic variables with measures of reserves, for example, usuallyreduces the signi"cance of the reserves.
We construct a composite variable measuring foreign debt net of foreignexchange reserves. The result for this variable is weaker than that for reserves,presumably because while the total level of foreign exchange reserves hasa strong e!ect, total debt has a weak e!ect, so by putting them together we areconstructing a weaker variable that is only marginally signi"cant in the ex-change rate regression.
We also control for the size of rescue packages o!ered to various countriesbetween July 1997 and October 1998. The total amount of funds pledged, in U.S.dollars, was $42.3 billion to Indonesia, $58.2 billion to Korea, $17.2 billion toThailand, $22.6 billion to Russia, and $41.0 billion to Brazil (The World Bank,1999, p. 91, Table 3.2). A bigger rescue package (in terms of funds pledged) isactually correlated with more depreciation, but this could be an endogenousoutcome in the sense that more money was pledged to countries more likely to
Finec=1093=KGM=VVC
S. Johnson et al. / Journal of Financial Economics 58 (2000) 141}186 169
Fig. 1. Graph showing exchange rate purchasing power in January 1999, with end of 1996 equalto 1, plotted against e$ciency of the judiciary (as reported in LLSV, 1998), for all emerging markets.Regression line shows predicted value of exchange rate depreciation from OLS regression withe$ciency of judiciary as the independent variable. Abbreviations for countries used in "gures:ARG } Argentina, BRA } Brazil, CHL } Chile, CHN } China, COL } Colombia, CZE } Czech,GRC } Greece, HKG } Hong Kong, HUN } Hungary, DNI } India, IND } Indonesia, ISR } Israel,KOR } Korea, MEX }Mexico, MYS }Malaysia, PHL } Philippines, POL } Poland, PRT }Portugal, RUS } Russia, SGP } Singapore, THA } Thailand, TUR } Turkey, TWN } Taiwan,VEN } Venezuela and ZAF } South Africa.
fail. Including this variable does not a!ect the signi"cance of any of themacroeconomic variables.
The funds actually disbursed during 1997}98 in these rescue packages weresubstantially less than the amounts pledged: $9.5 billion to Indonesia, $27.2 billionto Korea, $12.7 billion to Thailand, $4.5 billion to Russia, and $8.6 billion toBrazil (The World Bank, 1999, p. 91, Table 3.2.) The amount of the rescue packageactually disbursed is not signi"cantly correlated with the extent of exchange ratedepreciation, presumably because only countries that perform relatively wellactually receive money. Again, including this variable does not a!ect the signi"-cance of the other macroeconomic variables. Note that both receiving a pledge of"nancial assistance and having loans actually disbursed are endogenous out-comes rather than exogenous factors. The results using this variable are drivenprimarily by the large depreciation of Russia and Indonesia.
Our sample period ends just before Brazil's devaluation. However, even if weextend our sample period through late January 1999 (to capture the initialsharp devaluation) or April 1999 (to include the "rst three months of amore freely #oating exchange rate in Brazil), this does not help any of the
Finec=1093=KGM=VVC
170 S. Johnson et al. / Journal of Financial Economics 58 (2000) 141}186
macroeconomic variables to become signi"cant. The reason is that althoughBrazil had current account and budget de"cits in 1996, its "nal devaluation wasnot large compared to other emerging market countries. Brazil experienced a 37%devaluation from the end of 1996 through April 1999, which is about the same asin Thailand and Malaysia and much less than in Indonesia or Russia (Table 3).This is not enough to change the outcome for any macroeconomic variable in theregression analysis. Interestingly, the lack of total collapse in Brazil, despite thepoor initial macroeconomic fundamentals, is very much in line with what couldhave been predicted using the governance results from the next section.
5. Corporate governance
5.1. Enforceability of contracts
We evaluate four measures of the ease of enforcing contracts between man-agement and the providers of "rms' "nance. The "rst three measures are generalassessments of the legal environment: the e$ciency of the judiciary, corruption(which includes bribing the judiciary and other branches of the government),and the rule of law. The fourth measure is a general assessment of corporategovernance.
Judicial e$ciency measured on a scale of zero to ten is shown in Table 3, with20 observations (not including any post-Communist countries) from BusinessInternational Corporation, as cited by LLSV (1998). Indonesia easily has theworst score (2.5), while Hong Kong, Israel, and Singapore have the best (10). AsFig. 1 shows, there is a wide dispersion of values both within Asia and acrossemerging markets in general. This variable is highly signi"cant in the exchangerate regression with and without the East Asia dummy (Columns 1 and 2 ofTable 5) and remains signi"cant even if we drop Indonesia. Judicial e$ciencybecomes signi"cant at the 5% level if we control for foreign exchange reserves(shown in Table 5) or import coverage (not shown in Table 5) and signi"cant atthe 6% level if we include both macroeconomic variables. Neither of thesemacroeconomic control variables is signi"cant either separately or jointly ina regression with judicial e$ciency.
The quantitative e!ect of judicial e$ciency is large. A one-point increase inthis index (the di!erence between Malaysia and Singapore, or slightly largerthan the di!erence between Korea and Taiwan) implies 5}6% less depreciationfrom the end of 1996 to the end of 1998. The adjusted R-squared is 0.31 without(0.29 with) the East Asia dummy and 0.28 with foreign exchange reservesincluded in the regression.
Fig. 2 shows corruption on a scale of zero to ten as measured by theInternational Country Risk Guide and reported by LLSV (1998) for 23 coun-tries. This variable is highly signi"cant and remains so when we include the East
Finec=1093=KGM=VVC
S. Johnson et al. / Journal of Financial Economics 58 (2000) 141}186 171
Asia dummy. A one-point increase in this index (meaning lower corruption,again approximately the di!erence between Malaysia and Singapore) implies5% less depreciation from December 1996 to December 1998. The adjustedR-squared is 0.21 with (0.2 without) the East Asia dummy. When we control forforeign exchange reserves, the corruption variable remains signi"cant at the 6%level and the foreign exchange reserves variable is not signi"cant. The adjustedR-squared rises only slightly to 0.25. If we control for import coverage separate-ly or jointly with reserves, the corruption variable is signi"cant at the 5% leveland the macroeconomic control variables are not signi"cant.
The third index is the rule of law, again from the International Country RiskGuide as reported in LLSV (1998) for 23 countries (see Fig. 3). Table 5 showsthat this variable is signi"cant with and without the dummy variable for EastAsia. A one-point increase in this index implies 4% less depreciation from theend of 1996 to the end of 1998. The adjusted R-squared is 0.15 without (0.12with) the East Asian dummy. The R-squared is 0.27 once we include the foreignexchange reserve variable, and in that case none of the variables are signi"cant(but they are jointly signi"cant at the 5% level). The same is true if we use importcoverage instead of reserves (now they are jointly signi"cant at the 10% level.) Ifwe include both reserves and import coverage, none of the explanatory variablesare signi"cant jointly or separately.
The fourth index is corporate governance as measured by Flemings Researchexperts on particular countries. Their results for 20 countries in our sample areshown in Fig. 4. This variable is signi"cant at the 5% level with and without theEast Asia dummy. It remains signi"cant at the 5% level when we also control forreserves (see the last column of Table 5). A one-point increase in this index implies13}14% less depreciation from the end of 1996 to the end of 1998. Theadjusted R-squared is 0.26 without (0.22 with) the East Asian dummy and 0.17when we include the macroeconomic variables. If we control for import coverageeither separately or together with reserves, corporate governance remains signi"-cant at the 10% level and neither of the macroeconomic variables is signi"cant.
5.2. Shareholder rights
LLSV (1998) also provide a number of more detailed indices for particularaspects of corporate governance, such as shareholder rights, creditor rights, andaccounting standards. Data on shareholder or `anti-directora rights are avail-able for all the countries in our sample except the "ve transition economies.Data on creditor rights are not available for the "ve transition economies andVenezuela. Data on accounting standards are not available for the "vetransition countries and Indonesia.
We look at each measure in turn and also evaluate the product of these rightsand three measures of contract enforceability. Rights on paper are good, but weare particularly interested in evaluating the implications of how these rights are
Finec=1093=KGM=VVC
172 S. Johnson et al. / Journal of Financial Economics 58 (2000) 141}186
Tab
le5
Enf
orc
eabili
tyof
cont
ract
s.! D
epen
den
tva
riab
le:ex
chan
gera
tepur
chas
ing
pow
erin
Janu
ary
1999
(end-
Dec
ember
1996
"1)
Eas
tA
sia
dum
my
!0.
06!
0.1
!0.
005
!0.
09!
0.05
!0.
130.
040.
01(0
.07)
(0.0
9)(0
.07)
(0.0
9)(0
.07)
(0.0
9)(0
.09)
0.12
Enf
orce
abili
tyof
cont
ract
sJu
dic
ialE$
cien
cy0.
05HH
0.05HH
0.05HH
(0.0
2)(0
.02)
(0.0
2)
Corr
uption
0.05HH
0.05HH
0.04H
(0.0
2)(0
.02)
(0.0
2)
Rule
ofla
w0.
04HH
0.04HH
0.03
(0.0
2)(0
.02)
(0.0
2)
Enf
orce
able
shar
ehol
der
righ
tsC
orp
orat
ego
vern
ance
0.14HH
0.14HH
0.13HH
(0.0
5)(0
.05)
(0.0
6)
Mac
roec
onom
icco
ntro
lva
riab
leR
eser
ves
0.00
20.
002
0.00
30.
001
(0.0
02)
(0.0
02)
(0.0
02)
(0.0
02)
R-s
quar
ed0.
340.
370.
390.
280.
280.
360.
190.
20.
270.
30.
310.
31
Adju
sted
R-s
qua
red
0.31
0.29
0.28
0.2
0.21
0.25
0.15
0.12
0.14
0.26
0.22
0.18
Obse
rvat
ions
2020
2023
2323
2323
2320
2020
Missi
ngco
untr
ies
Chi
na
Chi
na
Chi
na
Rus
sia
Rus
sia
Rus
sia
Rus
sia
Rus
sia
Rus
sia
Chi
na
Chi
na
Chi
na
Hun
gary
Hun
gary
Hun
gary
Cze
chR
.Cze
chR
.Cze
chR
.Cze
chR
.Cze
chR
.Cze
chR
.C
olo
mbi
aC
olo
mbi
aC
olo
mbi
aPola
ndPola
ndPola
ndG
reec
eG
reec
eG
reec
eR
ussia
Rus
sia
Rus
sia
Port
uga
lPort
uga
lPort
uga
lC
zech
R.C
zech
R.C
zech
R.
Ven
ezuel
aV
enez
uel
aV
enez
uel
a
Finec=1093=KGM=VVC
S. Johnson et al. / Journal of Financial Economics 58 (2000) 141}186 173
Tab
le5
(con
tinu
ed)
Shar
ehol
der
pro
tect
ion,c
redi
tor
righ
ts,a
nd
acco
unting
stan
dar
ds
Dep
enden
tva
riab
le:ex
chan
gera
tepur
chas
ing
pow
erin
Janu
ary
1999
(end
ofD
ecem
ber
1996
"1)
Eas
tA
sia
dum
my
!0.
06!
0.13
!0.
1!
0.11
!0.
06!
0.11
!0.
1!
0.11
!0.
06!
0.12
0.03
!0.
02(0
.08)
(0.1
0)(0
.10)
(0.1
0)(0
.08)
(0.1
0)(0
.07)
(0.1
0)(0
.10)
(0.1
2)(0
.10)
(0.1
2)
Shar
ehol
der
prot
ecti
onA
ntidi
rect
orrigh
ts0.
06H
0.06H
0.05H
(0.0
3)(0
.03)
(0.0
3)
Antidi
rect
orrigh
ts]
judic
iale$
cien
cy0.
007HH
0.00
7HH
0.00
7HH
(0.0
03)
(0.0
03)
(0.0
03)
Antidi
rect
orrigh
ts]
corr
upt
ion
0.00
8HH
0.00
8HH
0.00
7HH
(0.0
03)
(0.0
03)
(0.0
03)
Antidi
rect
orrigh
ts]
rule
ofla
w0.
01HH
0.01HH
0.01HH
(0.0
03)
(0.0
03)
(0.0
04)
Cre
dito
rri
ghts
!0.
007
0.00
7!
0.00
3C
redi
tor
righ
ts(0
.03)
(0.0
3)(0
.04)
Acc
ount
ing
stan
dard
s!
0.00
08!
0.00
2!
0.00
5A
ccoun
ting
stan
dar
ds
(0.0
03)
(0.0
1)(0
.01)
Mac
roec
onom
icco
ntro
lva
riab
le
Res
erve
s0.
003
0.00
20.
002
0.00
10.
003
0.00
2(0
.002
)(0
.002
)(0
.002
)(0
.002
)(0
.002
)(0
.002
)
R-S
quar
ed0.
170.
20.
290.
260.
30.
350.
250.
280.
330.
290.
370.
380.
003
0.00
20.
160.
004
0.00
90.
06
Adju
sted
R-S
qua
red
0.13
0.11
0.16
0.22
0.22
0.23
0.21
0.2
0.21
0.25
0.3
0.26
!0.
06!
0.1
!0.
02!
0.05
!0.
12!
0.13
Obse
rvat
ions
2020
2020
2020
2020
2020
2020
1919
1919
1919
Missing
coun
trie
sC
hina
Chi
na
Chi
na
Chi
na
Chi
na
Chi
na
Chi
na
Chi
na
Chi
na
Chi
na
Chi
na
Chi
na
Chi
na
Chi
na
Chi
na
Chi
na
Chi
na
Chi
na
Hun
gary
Hun
gary
Hun
gary
Hun
gary
Hun
gary
Hun
gary
Hun
gary
Hun
gary
Hun
gary
Hun
gary
Hun
gary
Hun
gary
Hun
gary
Hun
gary
Hun
gary
Hun
gary
Hun
gary
Hun
gary
Pola
ndPola
ndPola
ndPola
ndPola
ndP
ola
ndP
ola
ndPola
ndPola
ndP
ola
ndPola
ndPola
ndPola
ndPola
ndP
ola
ndP
ola
ndPola
ndPola
ndR
ussia
Rus
sia
Rus
sia
Rus
sia
Rus
sia
Rus
sia
Rus
sia
Rus
sia
Rus
sia
Rus
sia
Rus
sia
Rus
sia
Rus
sia
Rus
sia
Rus
sia
Rus
sia
Rus
sia
Rus
sia
Cze
chR
.Cze
chR
.Cze
chR
.Cze
chR
.Cze
chR
.Cze
chR
.Cze
chR
.Cze
chR
.Cze
chR
.C
zech
R.
Cze
chR
.C
zech
R.
Cze
chR
.C
zech
R.
Cze
chR
.C
zech
R.
Cze
chR
.C
zech
R.
Ven
ezuel
aV
enez
uel
aV
enez
uel
aIn
don
esia
Indon
esia
Indon
esia
Finec=1093=KGM=VVC
174 S. Johnson et al. / Journal of Financial Economics 58 (2000) 141}186
!Not
esD
e5ni
tion
ofva
riab
les
used
inre
gres
sion
Judic
iale$
cien
cyis
anin
dex
from
0to
10,f
or
the
period
1980}83
,with
ahig
her
score
mea
ning
am
ore
e$ci
entle
galsy
stem
from
the
pers
pec
tive
offo
reig
nbu
sines
spe
opl
e.C
orr
uption
isan
index
from
0to
10,f
or
the
period
1982}95
,with
ahig
her
score
mea
ning
that
ther
eis
less
brib
ery
among
gove
rnm
ent
o$ci
als.
Rule
ofla
wis
anin
dex
from
0to
10,f
or
the
peri
od19
82}95
,with
ahig
her
score
mea
ning
ast
ronge
rtr
aditio
nofla
wan
dord
er.
Corp
orat
ego
vern
ance
isan
index
from
1to
5,fo
rea
rly
1998
,with
ahig
her
score
indi
cating
better
trea
tmen
tfo
rm
inority
shar
ehold
ers.
Antidi
rect
orrigh
tsis
anin
dex
from
0to
6,fo
r19
96}97
,with
ahig
her
score
indi
cating
better
prot
ection
for
min
ority
shar
ehold
ers.
Cre
dito
rrigh
tsis
anin
dex
from
0to
4,fo
r19
96}97
,w
ith
ahi
gher
scor
ein
dic
atin
gbet
ter
pro
tect
ion
for
cred
itor
s.A
ccoun
ting
stan
dar
ds
isan
inde
xfrom
0to
90,fo
r19
90,w
ith
ahig
her
score
indi
cating
more
discl
osu
rein
com
pany
annua
lre
port
s.T
otal
rese
rves
are
cent
ralba
nk
rese
rves
inbi
llions
ofdol
lars
atth
een
dof
1996
.
Fou
rm
easu
res
are
cons
truct
edth
roug
hm
ultip
lyin
gin
dic
esto
geth
er.
Antidi
rect
orrigh
ts]
Judi
cial
e$ci
ency
isth
epro
duct
ofan
tidi
rect
orrigh
tsan
dju
dici
ale$
cien
cy.
Antidi
rect
orrigh
ts]
corr
uption
isth
epr
oduc
tofan
tidirec
tor
righ
tsan
dco
rrupt
ion.
Antidi
rect
orrigh
ts]
rule
ofla
wis
the
pro
duct
ofan
tidi
rect
orrigh
tsan
dru
leofla
w.
The
Eas
tA
sia
dum
my
iseq
ualto
one
for
Chin
a,H
ong
Kon
g,In
don
esia
,K
ore
a,M
alay
sia,
Phi
lippi
nes
,Si
nga
pore
,Tha
iland,
and
Tai
wan
.
The
dep
ende
ntva
riab
leis
the
purc
has
ing
pow
erof
the
curr
ency
vis-
a-vi
sth
eU
Sdol
lar
inJa
nua
ry19
99,t
akin
gth
een
dof
1996
aseq
ual
to1.
The
valu
esuse
dar
ein
Tab
le1.
HSig
ni"ca
ntat
10%
leve
l.HH
Sig
ni"ca
ntat
5%le
vel.
Stan
dard
erro
rsar
ein
brac
kets
.
Finec=1093=KGM=VVC
S. Johnson et al. / Journal of Financial Economics 58 (2000) 141}186 175
Fig. 3. Graph showing exchange rate purchasing power in January 1999, with end of 1996equal to 1, plotted against index of rule of law (as reported in LLSV, 1998), for all emergingmarkets. Regression line shows predicted value of exchange rate depreciation from OLS regressionwith rule of law index as the independent variable (see list of abbreviations for countries ofFig. 1).
Fig. 2. Graph showing exchange rate purchasing power in January 1999, with end of 1996 equal to1, plotted against index of corruption (as reported in LLSV, 1998), for all emerging markets.Regression line shows predicted value of exchange rate depreciation from OLS regression withcorruption index as the independent variable (see list of abbreviations for countries of Fig. 1).
Finec=1093=KGM=VVC
176 S. Johnson et al. / Journal of Financial Economics 58 (2000) 141}186
Fig. 4. Graph showing exchange rate purchasing power in January 1999, with end of 1996 equal to1, plotted against index of corporate governance (as reported in Flemings, 1998), for all emergingmarkets. Regression line shows predicted value of exchange rate depreciation from OLS regressionwith corporate governance index as the independent variable (see list of abbreviations for countriesof Fig. 1).
enforced. We use a very simple measure, the product of legal de jure rights andthe enforceability of these rights. Because it is hard to know exactly how rightsare enforced we use the three indices of general legal environment used in theprevious section: judicial e$ciency, corruption, and the rule of law. This enablesus to check for a robust pattern in the data.
Table 3 shows the LLSV (1998) aggregate index of minority shareholderrights on a scale of zero to six, which they call `anti-directora rights. Asiancountries show a wide range of values, with lower scores in countries thatexperienced greater depreciation: Indonesia scores a two on this index, whileMalaysia scores a four and Hong Kong scores a "ve. On the other hand, Mexicoand Venezuela, with much less depreciation, have even lower scores thanIndonesia.
Table 5 shows that this variable is signi"cant at the 10% level with andwithout the East Asia dummy. A one-point increase in this index implies a 6%smaller depreciation from 1997 to 1998. The R-squared is 0.13. When we includeforeign exchange reserves, the index of shareholder rights keeps its signi"canceat the 10% level and reserves are not signi"cant. Including import coveragegives the same result: shareholder rights are signi"cant at the 10% and themacroeconomic control variable is not signi"cant.
For the product of anti-director rights and judicial e$ciency, the regressioncoe$cient is signi"cant in all three of the usual speci"cations. The adjusted
Finec=1093=KGM=VVC
S. Johnson et al. / Journal of Financial Economics 58 (2000) 141}186 177
R-squared is consistently 0.22}0.23. Using the product of anti-director rightsand corruption or the product of anti-director rights and the rule of law givessimilar results. Using import coverage rather than reserves does not make thegovernance variable insigni"cant in any speci"cation, and in one case (theproduct of corruption and anti-director rights), the e!ect is to make the gover-nance variable signi"cant at the 5% level.
The LLSV (1998) index of creditor rights shows that several countries withrelatively high creditor rights experience a great deal of depreciation, such asIndonesia, Malaysia, Thailand, and Korea (Table 3). Table 5 shows that there isno signi"cant relation between creditor rights and the exchange rate deprecia-tion; the R-squared is only 0.003. The product of creditor rights and thee$ciency of the judiciary or the corruption index does not give a signi"cantresult. There also does not appear to be any kind of relation between exchangerate depreciation and accounting standards (Table 5).
5.3. Robustness checks
We check our results using money growth in 1996 as an alternative macroeco-nomic control variable. If we drop Turkey, then the legal environment (judiciary,rule of law, and corruption) variables remain signi"cant at close to their originallevels (the corruption variable slips slightly) and money growth is not signi"cant.The only variable to lose its signi"cance is the index of anti-director rights. If weinclude Turkey, all the corporate governance variables, except anti-directorrights, remain signi"cant and money growth is signi"cant at the 5% level.
We also include a dummy variable for Latin America which is one forArgentina, Brazil, Chile, Colombia, Mexico, and Venezuela in our sample. Thisdoes not a!ect the signi"cance of any of the governance variables and is itselfinsigni"cant in all the exchange rate regressions. The Latin America dummy isnegative, with a coe$cient of around !30 in the stock market regressions, butthe only e!ect on governance variables is to make corruption insigni"cant. Totalreserves become positive and signi"cant in the stock market regression; theother results for macroeconomic variables are not a!ected.
For robustness checks, we examine the results using sample periods ending inMarch 1998, August 1998, or September 1998. The same corporate governanceresults hold for these periods. Controlling for the size of IMF packages (eitherpledged or actually disbursed) does not a!ect the signi"cance of the governancevariables. Controlling for combinations of macroeconomic variables also doesnot make any of our governance variables insigni"cant. (These results areavailable from the authors.)
The percent depreciation of the exchange rate plus the nominal interest rate ata moment in time is an alternative dependent variable (thanks to RicardoCaballero for this suggestion). This captures the possibility that a country facesstrong pressure to devalue but is able to hold o! the inevitable for a while
Finec=1093=KGM=VVC
178 S. Johnson et al. / Journal of Financial Economics 58 (2000) 141}186
through substantial increases in interest rates. All of our corporate governancemeasures are signi"cant with the right sign using this measure, calculated atmoments of crisis such as September and November 1998, so this actuallystrengthens our "ndings (results available upon request). The only macroeco-nomic variable that is signi"cant in this regression is total foreign exchangereserves. When we combine these macroeconomic and governance measures, thegovernance results remain strong while foreign exchange reserves become insig-ni"cant. The robust result is that governance measures are correlated with theintensity of the exchange rate depreciation.
A referee suggests that we control for log GDP per capita in 1994 asa measure of non-"nance-related institutional development. In this case,the e$ciency of the judiciary variable loses its signi"cance. However,corruption, rule of law, and corporate governance are jointly signi"cantwith log GDP per capita (none of the variables are individually signi"cant.)The anti-director rights variable remains signi"cant at the 10% level byitself. The other governance variables lose their individual signi"cance but arehighly signi"cant jointly with log GDP per capita. There is a high level ofcorrelation between log GDP per capita and judicial e$ciency (0.7) and rule oflaw and corruption, but low correlation with anti-director rights (0.05 and notsigni"cant). These results suggest that while corporate governance variableshave some e!ects independent of the level of non-"nancial institutional develop-ment, there is also substantial overlap. For more on the correlation betweencorporate governance and other measures of institutional development, seeLa Porta et al. (1999a).
6. The stock market
6.1. Macroeconomic measures
The dependent variable is the change in stock market value in dollar terms (asmeasured by the International Finance Corporation's Investable Index) fromthe end of 1996 to the lowest point of 1998 and to the end of 1998. A comparisonin dollars is appealing because this is how most international investors and theIFC evaluate stock market performance. Obviously, the dollar value of marketsis heavily in#uenced by exchange rate movements. However, the correlation isnot one-to-one. Table 3 shows the values of this index.
Our regression analysis using macroeconomic variables shows very littlecorrelation with stock market performance (Table 6). We report results for fourvariables that represent the key macroeconomic issues: the current account atthe end of 1996, the level of reserves at the end of 1996, the debt-to-GDP ratio atthe end of 1996, and the budget de"cit in 1996. None of the "rst three variablesare signi"cant in any speci"cation. Import coverage and other measures of debt
Finec=1093=KGM=VVC
S. Johnson et al. / Journal of Financial Economics 58 (2000) 141}186 179
Table 6Change in stock market value and macroeconomic policies.!
Stock market value at lowest point in 1998 with end 1996"100
East Asia dummy !49.5HH !61.2HH !53.3HH !41.7**(12.0) (14.1) (12.6) (11.7)
Current account !0.7 0.05(1.4) (1.1)
Total reserves !0.3 0.35(0.3) (0.25)
Debt-GDP ratio !7.2 8(11.8) (9.6)
Governmentbudget balance
!5.0HH !3.0HH(1.9) (1.6)
Observations 25 25 25 25 25 25 25 25
R-squared 0.01 0.45 0.05 0.5 0.02 0.47 0.25 0.53
AdjustedR-squared
!0.03 0.4 0.01 0.45 !0.03 0.42 0.21 0.49
!Notes:Government budget balance is the central government's budget de"cit (if negative) or surplus (if
positive) as a percent of GDP in 1996.Current account is the country's current account de"cit (if negative) or surplus (if positive) as
a percent of GDP in 1996.Total reserves are central bank reserves in billions of dollars at the end of 1996.Debt-GDP ratio is the ratio of foreign debt outstanding at the end of 1996 to GDP in 1996.
The East Asia dummy is equal to one for China, Hong Kong, Indonesia, Korea, Malaysia,Philippines, Singapore, Thailand, and Taiwan.
The dependent variable is the value of the IFC Investable Index, measured in U.S. dollars, at itslowest point in 1998, taking the value of this index at the end of 1996 to equal 100. The values usedare in Table 2.HSigni"cant at 5% level.HHSigni"cant at 10% level.Standard errors are in parentheses.
are also not signi"cant. Table 6 reports results using the lowest point of 1998 (seeTable 3 for the month in each case); none of the results change signi"cantly if weuse the end of 1998.
A larger initial budget de"cit is correlated with less depreciation. This impliesthat countries with a larger budget surplus (or smaller budget de"cit) at the endof 1996 had worse stock market performance in the crisis. For example, a 1%`bettera budget implies a 5% lower stock market from the end of 1996 to thelowest point in 1998.
Finec=1093=KGM=VVC
180 S. Johnson et al. / Journal of Financial Economics 58 (2000) 141}186
6.2. Corporate governance
In contrast, the results using our legal variables are much stronger (seeTable 7). The judicial e$ciency variable is not signi"cant, but the other legalenvironment variables are signi"cant in most speci"cations.
Corruption, plotted against stock market performance in Fig. 5, is signi"cantboth by itself and with the East Asia dummy. The regression coe$cient impliesthat a one-point improvement in the corruption index is associated with 7.6%better cumulative stock market performance. The adjusted R-squared is 0.09without the East Asia dummy. Corruption becomes more signi"cant and hasa larger coe$cient when we control for reserves, but it is insigni"cant when weinclude both reserves and the East Asia dummy.
The rule of law variable is signi"cant in three out of four speci"cations. It isnot signi"cant by itself but is signi"cant at the 5% level when we also control forreserves. This coe$cient implies that a one point better score on the rule of lawindex is associated with ten percentage points' better stock market performance.The coe$cient declines to just over seven and the signi"cance level falls to 10%when we control for East Asia and when we include both the East Asia dummyand reserves.
The corporate governance variable is signi"cant until we bring in the East Asiadummy. The coe$cient is over 12 and the R-squared rises to 0.22 when we includereserves. Interestingly, with the East Asia dummy included, reserves have the rightsign: an $10 billion of reserves implies a 4% better stock market performance.However, this is the only signi"cant stock market result for reserves.
Neither anti-director rights nor accounting standards are signi"cant in thestock market regressions, even if we multiply these measures with the indicesrepresenting legal institutions. Creditor rights actually have a signi"cant nega-tive coe$cient in the stock market regression for 1997}98, implying that coun-tries with better protection for creditors experience worse stock marketperformance, although this coe$cient loses its signi"cance when we include theEast Asia dummy.
6.3. Robustness checks
Using December 1998 as the ending point for our sample does not change theessence of the results. The macroeconomic variables are still not signi"cant, withthe exception of the "scal policy variable, which consistently has the wrong sign.The same three legal variables remain robustly signi"cant.
Controlling for money growth in 1996 does not a!ect the results.Corruption and corporate governance remain signi"cant, as does the ruleof law (if we also include reserves). Money growth is not signi"cant in anyspeci"cation. The same results hold if we control for money growth whiledropping Turkey.
Finec=1093=KGM=VVC
S. Johnson et al. / Journal of Financial Economics 58 (2000) 141}186 181
Tab
le7
Chan
gein
stoc
km
arke
tva
lue
and
lega
lin
stitutions
.! Sto
ckM
arke
tV
alue
atlo
wes
tin
1998
with
end
1996
"10
0
Eas
tA
sia
dum
my
!50
.1HH
!63
.6HH
!48
.2HH!
55.0HH
!53
.8HH!
56.0HH
!41
.3HH
!53
.4HH
(13.
6)(1
5.9)
(11.
3)(1
5.0)
(10.
5)(1
3.5)
(8.4
)(1
0.1)
E$
cien
cyof
judic
iary
22.
81.
80.
003
(4.2
)(4
.5)
(3.2
)(3
.3)
Corr
upt
ion
7.6H
9.4HH
5.9H
4.9
(4.3
)(4
.2)
(3.2
)(3
.5)
Rule
ofla
w6
10.0HH
7.5H
7.1HH
(4.2
)(4
.3)
(2.8
)(3
.3)
Corp
ora
tego
vern
ance
12.9H
15.0H
6.3
1.7
(7.5
0)(7
.60)
(5.0
0)(5
.3)
Mac
roec
onom
icco
ntro
lva
riab
leR
eser
ves
!0.
30.
5!
0.5H
!0.
2!
0.6
0.7
!0.
300.
4H(0
.4)
(0.3
)(0
.3)
(0.3
)(0
.3)
(0.3
)(0
.3)
(0.2
)
Obs
2020
2020
2323
2323
2323
2323
1919
1919
R-s
quar
ed0.
010.
040.
450.
520.
130.
240.
540.
560.
090.
260.
610.
610.
150.
220.
660.
73
Finec=1093=KGM=VVC
182 S. Johnson et al. / Journal of Financial Economics 58 (2000) 141}186
Adj
ust
edR
-squ
ared
!0.
04!
0.08
0.39
0.43
0.09
0.17
0.5
0.49
0.05
0.18
0.57
0.55
0.1
0.12
0.62
0.67
Chi
na
Chi
na
Chi
na
Chi
na
Cou
ntr
ies
missing
Chin
aC
hina
Chi
na
Chi
na
Cze
chC
zech
Cze
chC
zech
Cze
chC
zech
Cze
chC
zech
Col
om
bia
Col
om
bia
Col
om
bia
Col
ombia
Cze
chC
zech
Cze
chC
zech
Rus
siaR
ussia
Russ
iaR
ussia
Rus
siaR
uss
iaR
ussia
Rus
sia
Gre
ece
Gre
ece
Gre
ece
Gre
ece
Hung
ary
Hung
ary
Hung
ary
Hunga
ryP
ortu
gal
Por
tuga
lPor
tuga
lPor
tuga
lPola
ndPola
ndPola
ndPola
ndV
enez
uela
Ven
ezue
laV
enez
uela
Ven
ezue
laR
ussia
Russ
iaR
ussia
Rus
sia
Russ
iaR
uss
iaR
uss
iaR
ussia
!Note
s:Ju
dic
iale$
cien
cyis
anin
dex
from
0to
10,f
or
the
per
iod
1980}83
,with
ahig
her
scor
em
eani
ng
am
ore
e$ci
entle
galsy
stem
from
the
per
spec
tive
offo
reig
nbu
sines
speo
ple
.C
orr
upt
ion
isan
index
from
0to
10,f
or
the
period
1982}95
,with
ahi
gher
scor
em
eani
ng
that
ther
eis
less
bribe
ryam
ong
gove
rnm
ent
o$
cial
s.R
ule
ofla
wis
anin
dex
from
0to
10,fo
rth
eper
iod
1982}95
,with
ahig
her
score
mea
nin
ga
stro
nge
rtr
aditio
nofla
wan
dord
er.
Corp
ora
tego
vern
ance
isan
index
from
1to
5,fo
rea
rly
1998
,w
ith
ahi
gher
scor
ein
dic
atin
gbet
ter
trea
tmen
tfo
rm
inor
ity
shar
ehol
der
s.
The
Eas
tA
sia
dum
my
iseq
ual
toone
for
Chin
a,H
ong
Kong
,In
dones
ia,K
ore
a,M
alay
sia,
Phili
ppi
nes,
Sin
gapore
,Thai
land,
and
Tai
wan
.
Thedep
enden
tva
riab
leis
theva
lueoft
heIF
Cin
vest
able
index
,mea
sure
din
U.S
.dolla
rs,a
titslo
wes
tpoi
ntin
1998
,tak
ing
the
valu
eoft
his
index
atth
een
dof
1996
toeq
ual
100.
The
valu
esus
edar
ein
Tab
le2.
HSig
ni"
cant
at5%
leve
l.HH
Sig
ni"ca
ntat
10%
leve
l.St
anda
rder
rors
are
inpar
enth
eses
.
Finec=1093=KGM=VVC
S. Johnson et al. / Journal of Financial Economics 58 (2000) 141}186 183
If we control for log GDP per capita and reserves in the corruption regression,the independent variables are jointly signi"cant, but none of the variables areindividually signi"cant. In the same regression for rule of law, only the level ofreserves is signi"cant (but with a negative sign.) Judicial e$ciency, the Flemingscorporate governance measure, and the measure of anti-director rights are notsigni"cant. Log GDP per capita is signi"cant in several speci"cations; given that itis highly correlated with the general legal environment, it could be picking up thestrength of some institutions (although probably not anti-director rights).
The stock market results for measures of investor protection are moredependent on outliers than is the case for our exchange rate results. In particu-lar, if we drop Indonesia, the rule of law result is unchanged, but corruption andthe corporate governance variable lose their signi"cance. However, it should bekept in mind that we are missing data on two countries in all the stock marketregressions. Russia, a country with very weak investor protection, had a largefall in its stock market (on the order of Indonesia) but joined the IFC index onlyin November 1997, so we do not have the requisite stock market information.Russia's IFC Investable Index fell 84.2% in 1998 (IFC, 1999); the change in thisindex for 1997 is not available. The Czech Republic has struggled to establishinvestor protection, but only by 1997 was beginning to institute a reasonable setof safeguards (Glaeser et al., 2001). Its stock market (measured by the IFC'sInvestable Index) fell 22% in 1997 and only 7.3% in 1998. If Russia and theCzech Republic were included, our results would be stronger and the depend-ence on Indonesia reduced.
Our results show that ex post returns including the crash of 1997}98 are lowerwhere institutions are weaker and where there is, as a result, more risk. This isnot inconsistent with the argument that ex ante expected returns in the stockmarket should be higher where governance is weaker. We do not have evidenceabout expected returns before the crisis in these markets.
7. Conclusion
A simple model shows that managerial agency problems can make countrieswith weak legal systems vulnerable to the e!ects of a sudden loss of investorcon"dence. Countries with only weakly enforceable minority shareholder rightsare particularly vulnerable. If such a country experiences even a small loss ofcon"dence, outside investors reassess the likely amount of expropriation bymanagers and adjust the amount of capital they are willing to provide. Theresult can be a fall in asset values and a collapse of the exchange rate.
In cross-country regressions, corporate governance variables explain more of thevariation in exchange rates and stock market performance during the Asian crisisthan do macroeconomic variables. This result is not sensitive to changing thesample period, altering the precise de"nition of variables, or dropping outliers.
Finec=1093=KGM=VVC
184 S. Johnson et al. / Journal of Financial Economics 58 (2000) 141}186
Fig. 5. Graph showing dollar value of stock market at lowest point in 1998, with end of 1996 equalto 100, plotted against index of corruption (as reported in LLSV, 1998), for all emerging markets.Regression line shows predicted value of stock market index from OLS regression with corruptionindex as the independent variable (see list of abbreviations for countries of Fig. 1).
This does not mean that macroeconomic explanations are not important inthe Asian crisis. While there is no agreement among economists about therelative importance of the current account, reserves, foreign debt, monetary policy,and "scal policy for emerging markets in 1997}98, there is widespread agreementthat macroeconomic policies are important in particular instances. However, as ourresults show, these variables do not have simple or direct e!ects in determining theextent of the crisis across emerging market countries in 1997}98.
Our evidence suggests that corporate governance in general, and the de factoprotection of minority shareholder rights in particular, matters a great deal forthe extent of exchange rate depreciation and stock market decline in 1997}98.Although our results do not indicate which countries are vulnerable to a loss ofcon"dence, they do suggest that the extent of exchange rate and stock marketcollapse in response to a loss of con"dence is a!ected by investor protection.Corporate governance can be of "rst-order importance in determining theextent of macroeconomic problems in crisis situations.
References
Biers, D. (Ed.) 1998. Crash of '97: How the Financial Crisis is Reshaping Asia. Review PublishingCompany Limited (Far Eastern Economic Review), Hong Kong.
Brunswick Warburg 1999. Russia Value Monitor. Moscow, June.Caballero, R., Krishnamurthy, A., 1998. Emerging markets crises: an asset markets perspective.
Unpublished working paper. MIT, Cambridge, MA.Cornelius, P., 1999. The value-at-risk of countries. Unpublished working paper, Harvard Institute
for International Development, Cambridge, MA.
Finec=1093=KGM=VVC
S. Johnson et al. / Journal of Financial Economics 58 (2000) 141}186 185
Corsetti, G., Pesenti, P., Roubini, N., 1998. What caused the Asian currency and "nancial crisis?Unpublished working paper, New York University, New York, NY.
Folkerts-Landau, D., Garber, P., 1998. Capital Flows from Emerging Markets in a ClosingEnvironment. Deutsche Bank Research, Global Emerging Markets, London.
Friedman, E., Johnson S., 1999. Propping and looting in a weak legal environment. Unpublishedworking paper, MIT, Cambridge, MA.
Glaeser, E., Johnson, S., Shleifer, A. 2001. Coase versus The Coasians. Quarterly Journal ofEconomics, forthcoming.
Greenspan, A., 1998. Testimony of Chairman Alan Greenspan Before the Committee on Bankingand Financial Services. U.S. House of Representatives, January 30.
Hunter, W., G. Kaufman G., Krueger T. (Eds.) 1999. The Asian Financial Crisis: Origins, Implica-tions, and Solutions. Kluwer Academic Publishers, Boston/Dordrecht/London.
International Monetary Fund (IMF) 1997. World Economic Outlook. Interim Assessment. Interna-tional Monetary Fund, Washington DC, December.
International Organization of Securities Commissions 1998. Causes, E!ects and Regulatory Im-plications of Financial and Economic Turbulence in Emerging Markets: Interim Report. Emerg-ing Markets Committee, September.
Jensen, M., Meckling, W., 1976. Theory of the "rm: managerial behavior, agency costs andownership structure. Journal of Financial Economics 3, 305}360.
Johnson, S., La Porta, R., Lopez-de-Silanes, F., Shleifer, A. 2000. Tunnelling. American EconomicReview, May 90(2) 22}27.
Krugman, P., 1979. A model of balance of payments crises. Journal of Money, Credit, and Banking11, 311}325.
Krugman, P. 1998. What Happened to Asia? Unpublished working paper. MIT, Cambridge, MA.La Porta, R., Lopez-de-Silanes, F., Shleifer, A., 1999. Corporate ownership around the world.
Journal of Finance 54, 471}517.La Porta, R., Lopez-de-Silanes, F., Shleifer, A., Vishny, R., 1997. Legal determinants of external"nance. Journal of Finance 52, 1131}1150.
La Porta, R., Lopez-de-Silanes, F., Shleifer, A., Vishny, R., 1998. Law and "nance. Journal ofPolitical Economy December 106, 1113}1155.
La Porta, R., Lopez-de-Silanes, F., Shleifer, A., Vishny, R., 1999a. The quality of government.Journal of Law, Economics and Organization 15, 222}279.
La Porta, R., Lopez-de-Silanes, F., Shleifer, A., Vishny, R. 1999b. Investor protection and corporatevaluation. Unpublished working paper, Harvard University and University of Chicago,Cambridge, MA and Chicago, IL.
Radelet, S., Sachs, J. 1998a. The onset of the East Asian "nancial crisis. Unpublished working paper,Harvard University, Cambridge, MA.
Radelet, S., Sachs, J. 1998b. The East Asian "nancial crisis: diagnosis, remedies, prospects. BrookingsPapers on Economic Activity, 1998:1, pp. 1}90.
Rajan, R. Zingales, L., 1998. Which capitalism? Lessons from the East Asian crisis. Journal ofApplied Corporate Finance.
Shleifer, A., Vishny, R. 1997a. A Survey of Corporate Governance. The Journal of Finance, Vol. LII,No.2, June, pp. 737}783.
Shleifer, A., Vishny, R. 1997b. The Limits of Arbitrage. The Journal of Finance, Vol. LII, No.1,March, pp. 35}55.
Troika Dialog 1999. Corporate Governance in Russia. Moscow, May.Wade, R., Veneroso, F. 1998. The Asian crisis: the high debt model vs. The Wall Street-Treasury-
IMF Complex. New Left Review, March}April 1998.World Bank, 1999. Global Development Finance: Analysis and Summary Tables. Washington DC.Yellen, J. 1998. Lessons from the Asian Crisis. Speech at Council on Foreign Relations, New York,
April 15.
Finec=1093=KGM=VVC
186 S. Johnson et al. / Journal of Financial Economics 58 (2000) 141}186