36
Corporate Presentation March 2018

Corporate Presentation
March 2018

SAFE HARBOR STATEMENT
Forward-Looking InformationThis presentation includes “forward-looking statements” within the meaning of the federal securities laws. These forward-looking statements are statements that are not historical facts including statements about our beliefs and expectations and statements, and may contain the words “may,” “could,” “would,” “should,” “believe,” “expect,” “anticipate,” “plan,” “estimate,” “target,” “project,” “intend,” “foresee,” and similar expressions. There are a number of risks and uncertainties that could cause actual results to differ materially from the forward-looking statements made herein, including but not limited to, risks related to the Company’s liquidity and financial position, the substantial uncertainties inherent in the acceptance of existing and future products, the difficulty of commercializing and protecting new technology, the impact of competitive products and pricing, general business and economic conditions, risks associated with the expansion of our business including the implementation of any businesses we acquire, our indebtedness, and the other factors discussed in our public filings, including the section entitled “Risk Factors” in our most recent Quarterly Report on Form 10-Q, our Annual Report on Form 10-K and other periodic reports filed with the Securities and Exchange Commission (the “SEC”) and available on the SEC’s website, www.sec.gov. Readers are cautioned not to place undue reliance on these forward-looking statements, which speak only as of the date of this presentation. Except as required by law, Turtle Beach Corporation (the “Company”) undertakes no obligation to publicly release any revision to its forward-looking statements to reflect events or circumstances after the date of this presentation. All of the forward-looking statements in this presentation are qualified by such cautionary statements, and subject to the protection of the safe harbor for forward-looking statements contained in the Private Securities Litigation Reform Act of 1995. This presentation also contains trademarks and trade names that are property of their respective owners.
Non-GAAP Financial MeasuresThis presentation contains certain financial measures, including adjusted EBITDA and non-GAAP earnings per share (“EPS”), that are not calculated under the standards or rules of U.S. GAAP, which are referred to as "non-GAAP financial measures." These non-GAAP financial measures, as calculated by the Company, are not necessarily comparable to similarly titled measures reported by other companies. Additionally, these non-GAAP financial measures are not measurements of financial performance or liquidity under GAAP and should not be considered an alternative to the Company’s other financial information determined under GAAP. Management believes that these non-GAAP financial measures, when read in conjunction with the Company's reported results, can provide useful supplemental information for investors analyzing period to period comparisons of the Company's results. “Adjusted EBITDA” is defined by the Company as net income (loss) before interest, taxes, depreciation and amortization, stock-based compensation (non-cash), and certain special items that we believe are not representative of core operations. The Adjusted EBITDA outlook for the first quarter and full year 2018 has not been reconciled with the Company’s net loss outlook for the same periods because of the variability, complexity and lack of visibility with respect to certain reconciling items between adjusted EBITDA and net loss, including other income (expense), provision for income taxes and stock-based compensation. These items cannot be reasonably and accurately predicted without the investment of undue time, cost and other resources and, accordingly, a reconciliation of the Company’s adjusted EBITDA outlook to its net loss outlook for such periods is not available without unreasonable effort. These reconciling items could be material to the Company’s actual results for such periods.
© 2018 Turtle Beach Corporation. All Rights Reserved.
2

WHO WE ARE
• Key player in $100 billion gaming market
• Critical accessory provider to esports fans and players
• Dominant market leader in gaming headsets
• Strong brand with high consumer loyalty
• Global distribution & partnerships
• Full line of differentiated products
• Extensive & valuable patent portfolio
• Strengthening balance sheet
• Well positioned for a strong 2018
• Opportunities to drive double-digit long-term growth
• Experienced board & management team
3

KEY PLAYER IN $100B GLOBAL GAMING MARKET
4
PC Gaming: $33B5.9% YOY Growth(1)
Mobile Gaming: $38B10.8% YOY Growth(1)
Console Gaming: $35B17.2% YOY Growth (1)
$106BGlobal Gaming Opportunity(1)
Esports: $0.7B41.3% YOY Growth(2)
Virtual Reality: $6.4B73% YOY Growth(3)
$7B Opportunity(2)(3)
(1) DFC Intelligence Video Game Worldwide Market Forecast (March 2017)
(2) 2017 Newzoo - 2017 Global esports Market Report
(3) Statista Virtual Reality Worldwide Market Size

AUDIO HEADSETS ARE A CRITICAL ACCESSORY FOR GAMERS
5
Gaming Headsets Provide…
• Good microphone for multi-player gaming• More immersive audio for a better gaming experience• Competitive advantage in picking up key audio cues• Privacy of game and chat audio
Headsets, $1,088
Mice, $527
Keyboards, $459
Other, $106
Global Gaming Accessory Market $2,180B(1)
(1) NewZoo Report
Americas and Europe are over 75% of the market
…And Are Largest Segment In $2+B Accessory Market With over 700M Gamers and 175M esports fans in the Americas and Europe(1)

WE ARE THE DOMINANT LEADER IN GAMING HEADSETS
6
#1 gaming headsetprovider for Xbox & PlayStation
Longstanding position with higher share than next 3 players combined
Source: The NPD Group, Inc., Video Games Console Headset Update 1.11.18
5 of the top 10 sellers overall (1st & 3rd party) are Turtle Beach
4 of the top 5 selling 3rd party headsets are Turtle Beach

STRONG BRAND WITH HIGH CONSUMER LOYALTY
7(1) Source: Bowen Research (June 2015); (2) Source: Survey Sampling International Research (April 2017), showing main Console Gaming Headset competitors; (3) Source: Simply Measured Service, June 2017.
Consumers’ Favorite Gaming Headset Brand¹
Facebook “Likes”³Unaided Brand Awareness²
#1 rated headset based on audio quality¹
#1 rated headset based on comfort¹
+52 Net Promoter Score²36%
30%
12%8%
5% 4% 3% 3%
Comp #1 Comp #2 Comp #3 Comp #4 Comp #5 Comp #6 Comp #7
23%21%
6% 5%2%
Comp #1 Comp #2 Comp #3 Comp #4
654,090
251,349201,407 200,719
129,94861,981
Comp #1 Comp #2 Comp #3 Comp #4
Comp #1 Comp #2 Comp #3 Comp #4 Comp #5

Strong Retail Presence Great partnerships 10,000+ Interactive Displays
Sample retailers
GLOBAL DISTRIBUTION & PARTNERSHIPS
8
Product sales in 42 countries with over 260,000 points of
distribution
Partnerships with industry-leading brands
Market leader in deploying interactive gaming headset
displays

STRONG PRESENCE IN ESPORTS
9
Optic Gaming#1 Console esports organization in the world, top ranked teams across Halo, Gears of War and Call of Duty
AstralisOne of world’s best CS:GO teams, Major Champions; one of Europe’s top Call of Duty teams
Key Partnerships
SplyceEurope’s top Call of Duty team
69% of esports fans play on Xbox One or
PS4(1)
(1) Nielsen Esports Playbook (2017)

FULL LINE OF PRODUCTS…WITH COMPELLING NEW LAUNCHES
ASP TB Key FeaturesSample Products
• Wireless game & chat • Active noise-cancellation & Bluetooth®• DTS Headphone:X® 7.1 surround sound• Superhuman Hearing• Magnetic base station
• Immersive surround sound• Xbox Wireless (connects directly to Xbox One)• Active noise-cancellation & Bluetooth (700 only)• Glasses friendly design• Superhuman Hearing
• Large, powerful 50mm speakers• High-sensitivity mic• Durable, fan-favorite headset ID• Superhuman Hearing (PX24)
• High-quality 40mm speakers• High-sensitivity mic• Lightweight comfort
• Innovative open earcup• Glasses friendly design
• Tournament-grade game & chat audio• Unmatched comfort with glasses friendly design &
cooling gel-infused ear cushions• Powerful amplified audio w/ DTS Headphone:X® 7.1
surround sound and Superhuman Hearing™ (PC Edition)
> $200
$100 - $200
$50 - $100
< $50
Varies
10
Entry-Level Gamer
< 4 hours per week
Casual Gamer4-6 hours per week
Enthusiast Gamer
7-15 hours per week
Core Gamer16+ hours per week
EsportsPC Edition
LaunchedJuly & Oct.
2017
LaunchedSept. 2017
LaunchedJuly & Oct.
2017
LaunchedApr. 2017
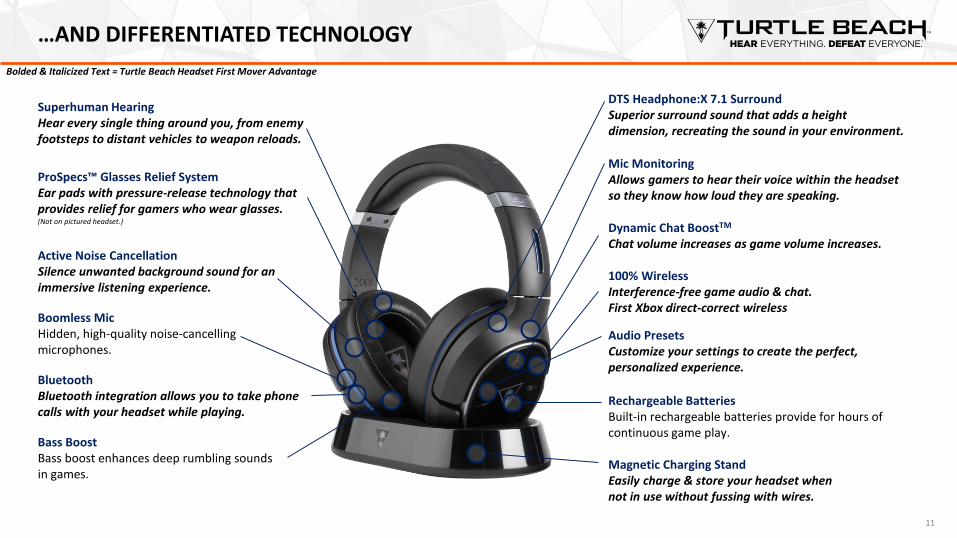
…AND DIFFERENTIATED TECHNOLOGY
11
Rechargeable BatteriesBuilt-in rechargeable batteries provide for hours of continuous game play.
100% WirelessInterference-free game audio & chat.First Xbox direct-correct wireless
DTS Headphone:X 7.1 Surround Superior surround sound that adds a height dimension, recreating the sound in your environment.
Audio PresetsCustomize your settings to create the perfect, personalized experience.
Dynamic Chat BoostTM
Chat volume increases as game volume increases.
Mic MonitoringAllows gamers to hear their voice within the headset so they know how loud they are speaking.
Magnetic Charging StandEasily charge & store your headset when not in use without fussing with wires.
Bolded & Italicized Text = Turtle Beach Headset First Mover Advantage
Active Noise CancellationSilence unwanted background sound for an immersive listening experience.
BluetoothBluetooth integration allows you to take phone calls with your headset while playing.
Bass BoostBass boost enhances deep rumbling sounds in games.
Superhuman HearingHear every single thing around you, from enemy footsteps to distant vehicles to weapon reloads.
ProSpecs™ Glasses Relief SystemEar pads with pressure-release technology that provides relief for gamers who wear glasses. (Not on pictured headset.)
Boomless MicHidden, high-quality noise-cancelling microphones.

OVERVIEW OF UNIQUE HYPERSOUND TECHNOLOGY
12
New Sound Delivery Mechanism▪ Thin panels generate ultrasound beam
▪ Audio is injected into the ultrasound beam
▪ Sound is created in the air along the beam
▪ Fundamentally new and different approach to audio
▪ Fully functional from glass emitters enabling glass “speakers”
Multiple, Innovative Benefits▪ Highly controlled direction of sound
▪ Full 3D surround sound with 2 emitters (vs. 5 or 7 speakers)
▪ Significantly higher level of audio clarity to the listener
Monetization via Licensing or Sale▪ 55 issued and 22 pending patents
▪ Small team engaged with prospective licensees
▪ Also exploring Strategic Alternatives

HYPERSOUND APPLICATIONS
13
Commercial Audio
Enables retailers and retail display manufacturers to add focused zone of audio to retail displays / kiosks
Healthcare
Improves sound clarity and listening benefits for people with hearing loss. Early indications of benefits for sufferers of Tinnitus
Market Application
Enterprise Audio
Enables private zone of audio in office/enterprise environments
Consumer Audio
Utilize the 3D nature of HyperSound to create individual surround sound experience with two emitters
HyperSound Glass
Directional audio with all benefits and applications above but from glass panel. Creates glass speaker which can be stand-alone or integrated into video displays
Demos available at:HyperSound Glass DemoHyperSound Glass Integrated into Desktop Monitors
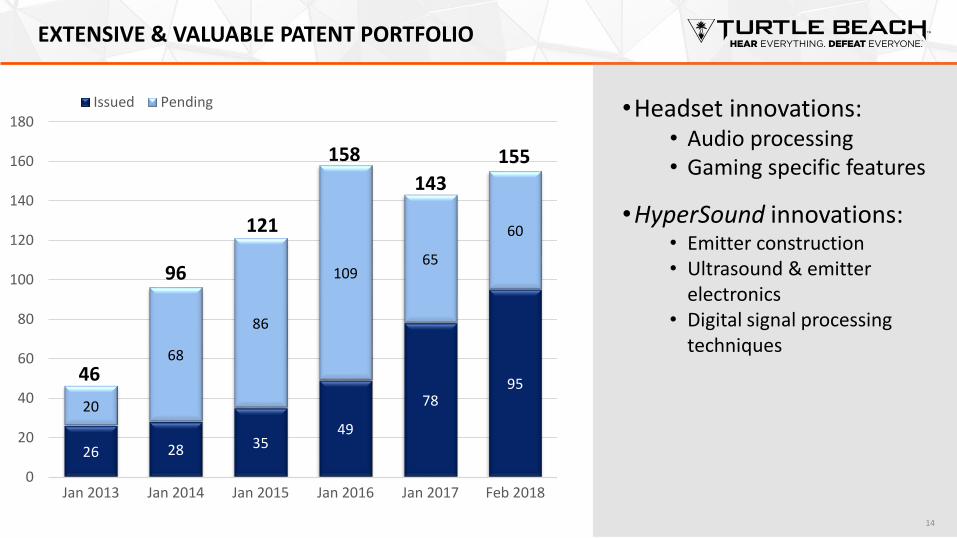
EXTENSIVE & VALUABLE PATENT PORTFOLIO
14
26 28 3549
7895
20
68
86
10965
60
0
20
40
60
80
100
120
140
160
180
Jan 2013 Jan 2014 Jan 2015 Jan 2016 Jan 2017 Feb 2018
Issued Pending
121
96
46
158
143
155
•Headset innovations:• Audio processing• Gaming specific features
•HyperSound innovations:• Emitter construction• Ultrasound & emitter
electronics• Digital signal processing
techniques

REVENUE PROFILE
15
$163$174
$149$157
2015 2016 2017 2018E³
Company Revenues (1)
Millions
Channel Inventory Adjustments
$211 $217 $215$228
2015 2016 2017 TTM Jan 2018
Company Product Retail Sell-Through in Core Markets (2)
Millions
1) Company net revenues=wholesale revenues.2) NPD and GFK reported retail revenue value of Turtle Beach headset sell-through for North America and UK representing vast majority of company global sales. January 2018 numbers are unaudited.3) Guidance effective on March 6, 2018.

EBITDA PROFILE
16
-$11.4
$4.0
$11.6 $12.0
2015 2016 2017 2018E²
Adjusted EBITDA (1)
Millions
2016:Returned headset business to profitability. Converted HyperSound to licensing model. Entered esports, VR, streaming mic categories.
2017:Focused on core headset business and continued profitability improvements. Laid groundwork for 2018+ growth initiatives.
2018:Continue to deliver good profitability in headset business. Lower cost of debt. Make select investments to drive future growth.
1) See appendix for a reconciliation of non-GAAP measures.2) Guidance effective on March 6, 2018.

STRONG FREE CASH FLOW GROWTH
17
-$19.8
-$1.3
$5.2 $6.0
-$25.0
-$20.0
-$15.0
-$10.0
-$5.0
$0.0
$5.0
$10.0
2015 2016 2017 2018E²
Strong free cash flow generation…
• Positioned the company to amend and improve debt agreements Mar 2018
• Allows important growth investments throughout 2018
Free Cash Flow (1)
Millions
1) Free cash flow defined as consolidated adjusted EBITDA less capital expenditures, less cash interest.
2) Guidance effective on March 6, 2018.
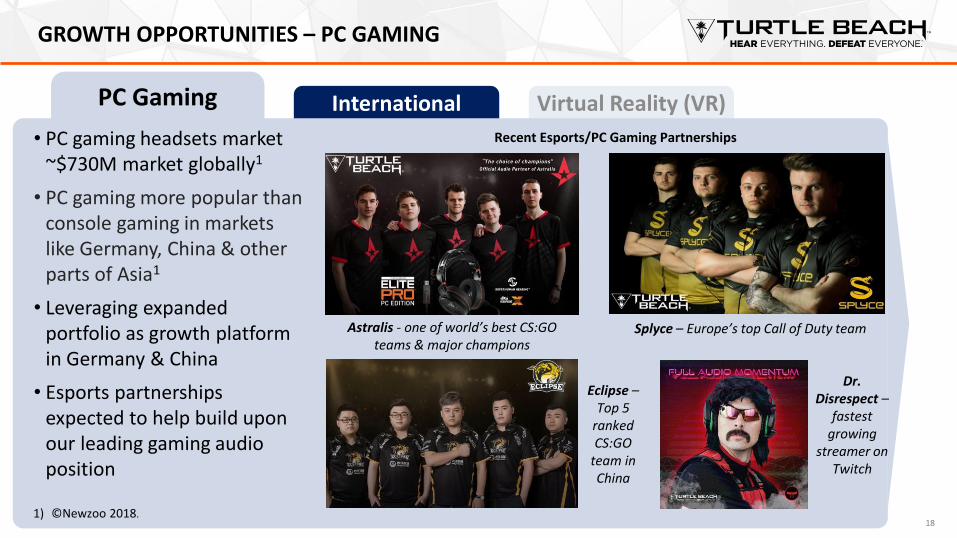
GROWTH OPPORTUNITIES – PC GAMING
18
Virtual Reality (VR)PC Gaming International
• PC gaming headsets market ~$730M market globally1
• PC gaming more popular than console gaming in markets like Germany, China & other parts of Asia1
• Leveraging expanded portfolio as growth platform in Germany & China
• Esports partnerships expected to help build upon our leading gaming audio position
1) ©Newzoo 2018.
Recent Esports/PC Gaming Partnerships
Astralis - one of world’s best CS:GO teams & major champions
Eclipse –Top 5
ranked CS:GO
team in China
Splyce – Europe’s top Call of Duty team
Dr. Disrespect –
fastest growing
streamer on Twitch

GROWTH OPPORTUNITIES – CHINA
19
Virtual Reality (VR)InternationalPC Gaming
China Opportunity• 573M Chinese gamers1
• 114M esports audience in China of which 53.8M are esports Enthusiasts1
• Turtle Beach has establish presence and making modest investments in 2018 with further activities planned for 2019
Latin America Opportunity• 205M estimated gamers1
• Turtle Beach in 15 countries & 113 retailers in Latin America
$32.5B
$42.0B
2017 2020E
Chinese Games Market Forecast¹
1.©Newzoo 2018.

GROWTH OPPORTUNITIES – VR
20
PC Gaming Virtual Reality (VR)International
1) https://www.statista.com/statistics/550461/virtual-reality-market-size-worldwide/2) NPD data from 2016, 2017, through January 2018 .
• According to SuperData Research, VR hardware market expected to reach $17.8B by 2020 from $1.5B in 2016 (85% CAGR)¹
• Consoles likely to be key driver of non-mobile VR as evidenced by Sony PSVR having 69% revenue share of major non-mobile VR headsets since Oct ’16 launch²
• STEALTH 350VR, our first gaming headset designed for VR devices, launched in Oct 2016 is now the leader in this category in North America²
STEALTH 350VR

Balance Sheet Highlights
• Revolver typically peaks in Q4 and lowest in Q1 after holiday receipts. 2017 average Revolver balance was $12.4M.
• $49.0M federal, $21.0M state net operating losses @ Dec 31, 2016 offset taxable income (not scheduled to expire until 2029)
• $60M line of credit and Mar 5, 2018 refinancing anticipated to provide sufficient capital to make various growth investments
BALANCE SHEET
21
Capitalization
@12-31-16 @12-31-17
Cash & Equivalents $6.2M $5.2M
Debt
Revolver (asset-based) $35.9M $38.5M
Term Loans $14.4M $11.7M
Subordinated Notes $19.4M $21.9M
Total Debt $69.7M $72.1M
Series B - Preferred Stock¹ $17.5M $18.9M
Leverage Ratio² 7.4x 2.1x
1) Due in October 2030 and has 8% per annum PIK interest.
2) Defined as total term loans outstanding and average trailing twelve month revolving debt, divided by consolidated trailing twelve month adjusted EBITDA.

AMENDED LENDING AGREEMENTS
•Amended lending agreements on Mar 6, 2018
• Improved terms include:
–Reduction in the interest rate and greater availability on revolving credit line
–Significant reduction in the interest rates on term loans (e.g., Crystal rate reduced by 3.5%)
–Reduction in the interest rate on sub debt with Stripes (e.g., majority reduced by 1.4%)
–Ability to use funds from the term loan to reduce sub debt, subject to certain conditions
–Elimination of EBITDA coverage covenants on the term loans
–Extension of the loans to 2023
•Expected interest savings of at least $3.5 million over the next five years
22
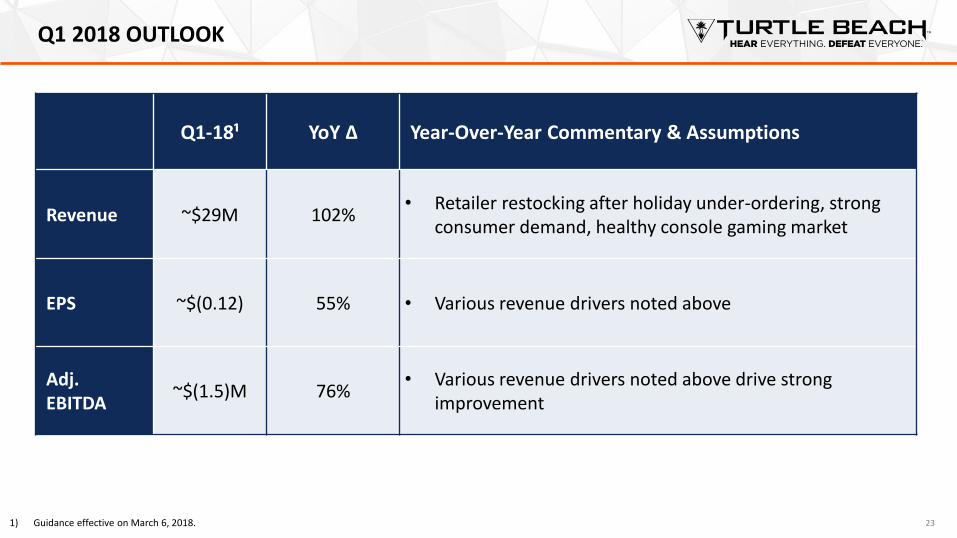
Q1 2018 OUTLOOK
23
Q1-18¹ YoY ∆ Year-Over-Year Commentary & Assumptions
Revenue ~$29M 102%• Retailer restocking after holiday under-ordering, strong
consumer demand, healthy console gaming market
EPS ~$(0.12) 55% • Various revenue drivers noted above
Adj. EBITDA
~$(1.5)M 76%• Various revenue drivers noted above drive strong
improvement
1) Guidance effective on March 6, 2018.

2018 OUTLOOK
24
2017 2018¹ Year-Over-Year Commentary & Assumptions
Total Revenue $149.1M ~$157MQuarterly revenue profile expected to shift revenue mix
from Q4 to earlier quarters similar to 2016
Gross Margin 34.2% ~34.2% Upper end of 33-35% targeted range
EPS $(0.07) ~$(0.03) Expecting continued improvements in EPS
Adj. EBITDA $11.6M ~$12MIncludes several million dollars of investments to drive
future growth
1) Guidance effective on March 6, 2018.

KEY TAKEAWAYS
▪ #1 console gaming headset brand with dominant share
▪ $106B global gaming market
▪ Critical accessory for gaming and esports
▪ Disruptive, cutting-edge technologies & patents
▪ Significantly improved balance sheet and lower cost of debt
▪ Projecting revenue growth in 2018
▪ Q1 off to a very strong start
▪ Room to grow in PC, esports, VR, and International markets
25
CONTACT US
Investor Relations: Media Contact:Cody Slach Maclean MarshallLiolios Turtle Beach Corporation949.574.3860 858.914.5093 [email protected] [email protected]
26
COMPANY WEBSITES
www.turtlebeachcorp.com www.turtlebeach.com www.hypersound.com
Investor Relations: Media Contact:Cody Slach Maclean MarshallLiolios Turtle Beach Corporation949.574.3860 858.914.5093 [email protected] [email protected]

APPENDIX
287
EXPERIENCED BOARD OF DIRECTORS
29
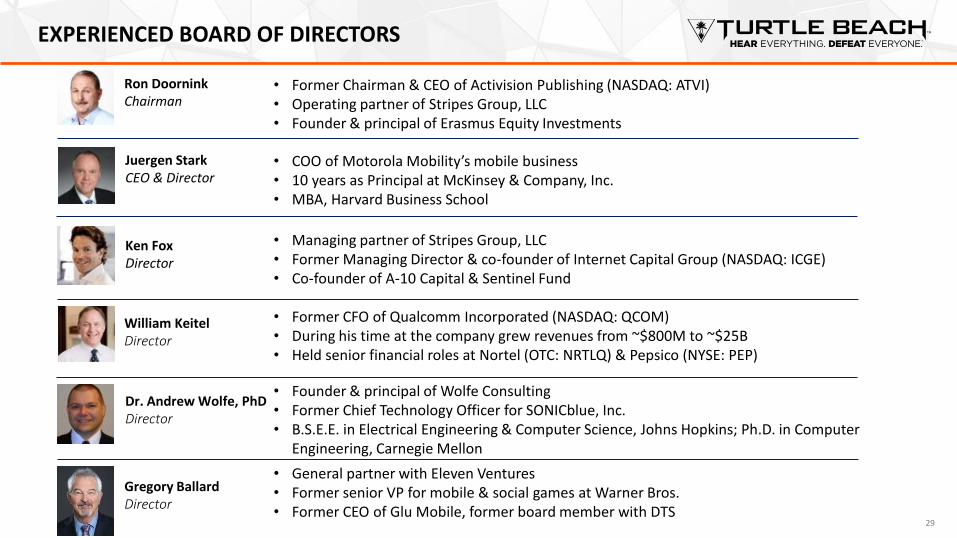
• Former Chairman & CEO of Activision Publishing (NASDAQ: ATVI)• Operating partner of Stripes Group, LLC• Founder & principal of Erasmus Equity Investments
Ron DoorninkChairman
Juergen StarkCEO & Director
• COO of Motorola Mobility’s mobile business• 10 years as Principal at McKinsey & Company, Inc.• MBA, Harvard Business School
Ken FoxDirector
• Managing partner of Stripes Group, LLC• Former Managing Director & co-founder of Internet Capital Group (NASDAQ: ICGE)• Co-founder of A-10 Capital & Sentinel Fund
William KeitelDirector
• Former CFO of Qualcomm Incorporated (NASDAQ: QCOM)• During his time at the company grew revenues from ~$800M to ~$25B• Held senior financial roles at Nortel (OTC: NRTLQ) & Pepsico (NYSE: PEP)
Dr. Andrew Wolfe, PhDDirector
• Founder & principal of Wolfe Consulting• Former Chief Technology Officer for SONICblue, Inc.• B.S.E.E. in Electrical Engineering & Computer Science, Johns Hopkins; Ph.D. in Computer
Engineering, Carnegie Mellon
Gregory BallardDirector
• General partner with Eleven Ventures• Former senior VP for mobile & social games at Warner Bros.• Former CEO of Glu Mobile, former board member with DTS

EXPERIENCED MANAGEMENT TEAM
30
Juergen StarkCEO
John HansonCFO
Cris Keirn SVP, Global Sales
Matt SeymourVP, Product Management
Megan Wynne General Counsel
• COO of Motorola Mobility’s mobile business
• 10 years as principal at McKinsey & Company
Joe StachulaCTO & VP Development
Andrew LilienVP of Marketing
Jose RosadoVP Global Operations
Scott RankinVP Global Logistics
• 20+ years in consumer electronics
• 12 years at Plantronics engineering audio headsets
• 20+ years of brand, consumer & retail marketing experience
• Past experience at ESPN, Fleer Trading Cards & National Media Group
• Former Sr. Director, Global Supply Chain Operations for HP
• 22 years of supply chain management with Motorola, On Semiconductor, HP, Cisco
• 20+ years of logistics, transportation & operations experience
• 11+ years at Turtle Beach
• EVP & CFO at Dialogic
• CFO at One Communications Corp
• Led headset transition as VP of business planning & strategy
• 17 years with Motorola in product management, operations, quality & customer relations
• 20+ years in the Consumer Electronics industry• Previously with Sony leading television portfolio
planning & development, product marketing
• 5 years with I-Flow, a Kimberly-Clark Health Care Company
• 13 years with Morris Polich & Purdy law firm
RECONCILIATION OF GAAP & NON-GAAP EARNINGS
31
Three Months Ended Year Ended
December 31,
2017 December 31,
2016 December 31,
2017 December 31,
2016
Net Income (Loss)
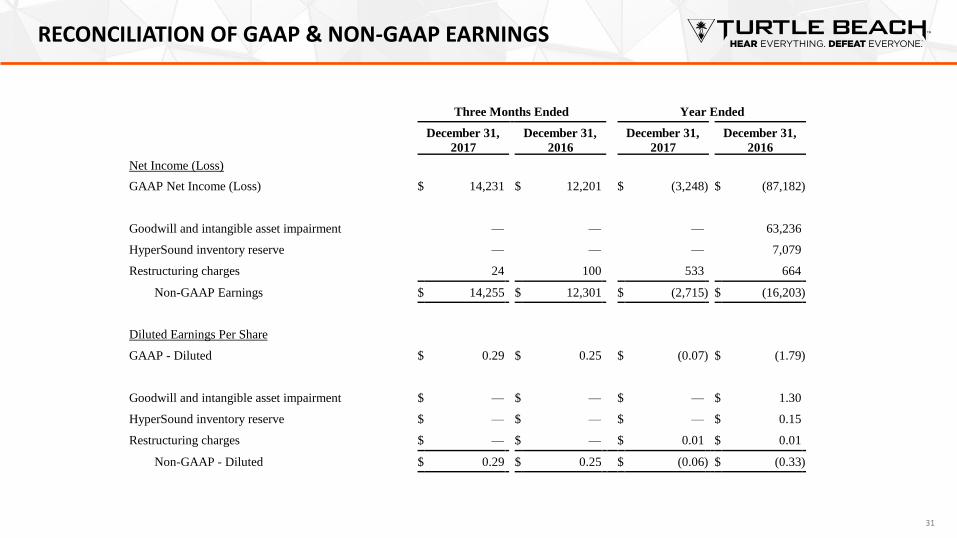
GAAP Net Income (Loss) $ 14,231 $ 12,201 $ (3,248 ) $ (87,182 )
Goodwill and intangible asset impairment — — — 63,236
HyperSound inventory reserve — — — 7,079
Restructuring charges 24 100 533 664
Non-GAAP Earnings $ 14,255 $ 12,301 $ (2,715 ) $ (16,203 )
Diluted Earnings Per Share
GAAP - Diluted $ 0.29 $ 0.25 $ (0.07 ) $ (1.79 )
Goodwill and intangible asset impairment $ — $ — $ — $ 1.30
HyperSound inventory reserve $ — $ — $ — $ 0.15
Restructuring charges $ — $ — $ 0.01 $ 0.01
Non-GAAP - Diluted $ 0.29 $ 0.25 $ (0.06 ) $ (0.33 )

GAAP TO ADJUSTED EBITDA RECONCILIATION – THREE MONTHS ENDED DEC 31, 2017
32(1) Other includes business transition costs and restructuring charges.
Three Months Ended
December 31, 2017
As
Reported Adj
Depreciation Adj
Amortization
Adj
Stock
Compensation
Other (1) Adj
EBITDA
Net Revenue $ 79,696 $ — $ — $ — $ — $ 79,696
Cost of Revenue 49,748 (99 ) — — 120 49,769
Gross Profit 29,948 99 — — (120 ) 29,927
Operating Expense 13,969 (975 ) (89 ) (243 ) (24 ) 12,638
Operating income (loss) 15,979 1,074 89 243 (96 ) 17,289
Interest expense 2,199
Other non-operating (income) expense, net 54 54
Earnings before income tax benefit 13,726
Income tax benefit (505 )
Net income $ 14,231 Adjusted EBITDA $ 17,235
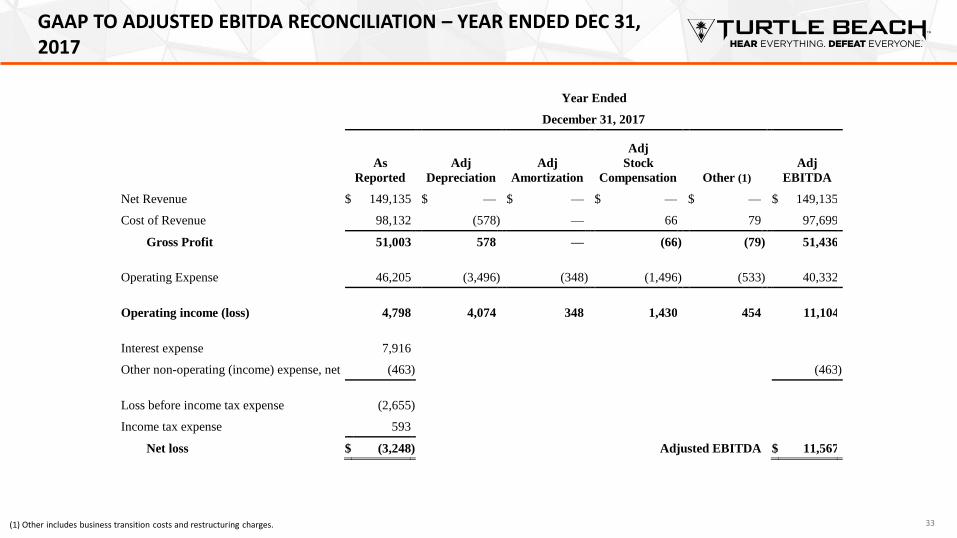
GAAP TO ADJUSTED EBITDA RECONCILIATION – YEAR ENDED DEC 31, 2017
33
Year Ended
December 31, 2017
As
Reported Adj
Depreciation Adj
Amortization
Adj
Stock
Compensation
Other (1) Adj
EBITDA
Net Revenue $ 149,135 $ — $ — $ — $ — $ 149,135
Cost of Revenue 98,132 (578 ) — 66 79 97,699
Gross Profit 51,003 578 — (66 ) (79 ) 51,436
Operating Expense 46,205 (3,496 ) (348 ) (1,496 ) (533 ) 40,332
Operating income (loss) 4,798 4,074 348 1,430 454 11,104
Interest expense 7,916
Other non-operating (income) expense, net (463 ) (463 )
Loss before income tax expense (2,655 )
Income tax expense 593
Net loss $ (3,248 ) Adjusted EBITDA $ 11,567
(1) Other includes business transition costs and restructuring charges.

GAAP TO ADJUSTED EBITDA RECONCILIATION – THREE MONTHS ENDED DEC 31, 2016
34(2) Other includes goodwill and other intangible asset impairment, business transition and restructuring charges.
Three Months Ended
December 31, 2016
As
Reported Adj
Depreciation Adj
Amortization
Adj
Stock
Compensation Other (2) Adj
EBITDA
Net Revenue $ 82,204 $ — $ — $ — $ — $ 82,204
Cost of Revenue 51,996 (151 ) — (159 ) — 51,686
Gross Profit 30,208 151 — 159 — 30,518
Operating Expense 14,912 (729 ) (100 ) (579 ) (100 ) 13,405
Operating income (loss) 15,296 880 100 738 100 17,113
Interest expense 2,116
Other non-operating (income) expense, net 1,026 1,026
Earnings before income tax benefit 12,154
Income tax benefit (47 )
Net income $ 12,201 Adjusted EBITDA $ 16,087

GAAP TO ADJUSTED EBITDA RECONCILIATION – YEAR ENDED DEC 31, 2016
35
Year Ended
December 31, 2016
As
Reported Adj
Depreciation Adj
Amortization
Adj
Stock
Compensation Other (2) Adj
EBITDA
Net Revenue $ 173,978 $ — $ — $ — $ — $ 173,978
Cost of Revenue 131,368 (571 ) (3,660 ) (557 ) (7,079 ) 119,501
Gross Profit 42,610 571 3,660 557 7,079 54,477
Operating Expense 120,311 (4,496 ) (468 ) (3,403 ) (63,900 ) 48,045
Operating income (loss) (77,701 ) 5,067 4,128 3,960 70,979 6,432
Interest expense 7,447
Other non-operating (income) expense, net 2,421 2,421
Loss before income tax benefit (87,569 )
Income tax benefit (387 )
Net loss $ (87,182 ) Adjusted EBITDA $ 4,011
(2) Other includes goodwill and other intangible asset impairment, business transition and restructuring charges.

GAAP TO ADJUSTED EBITDA RECONCILIATION
36
December 31, 2017 December 31, 2016 December 31, 2015
Consolidated
Net Income (Loss) (3,248) (87,182) (82,907)
Depreciation 4,075 5,066 5,901
Amortization of intangibles 349 4,128 2,015
Interest 7,916 7,447 5,100
Taxes 592 (387) 2,392
Stock Compensation 1,429 3,960 5,897
Restructuring Expense 533 664 399
Goodwill Impairment - 63,236 49,822
Business Transaction Expense (79) 7,079 -
Adj EBITDA 11,567 4,011 (11,381)


