HAL Id: hal-02056009 https://hal.archives-ouvertes.fr/hal-02056009 Submitted on 15 Oct 2019 HAL is a multi-disciplinary open access archive for the deposit and dissemination of sci- entific research documents, whether they are pub- lished or not. The documents may come from teaching and research institutions in France or abroad, or from public or private research centers. L’archive ouverte pluridisciplinaire HAL, est destinée au dépôt et à la diffusion de documents scientifiques de niveau recherche, publiés ou non, émanant des établissements d’enseignement et de recherche français ou étrangers, des laboratoires publics ou privés. Corporate social responsibility and M&A uncertainty Mohamed Arouri, Mathieu Gomes, Kuntara Pukthuanthong To cite this version: Mohamed Arouri, Mathieu Gomes, Kuntara Pukthuanthong. Corporate social responsibil- ity and M&A uncertainty. Journal of Corporate Finance, Elsevier, 2019, 56, pp.176-198. 10.1016/j.jcorpfin.2019.02.002. hal-02056009
Transcript
HAL Id: hal-02056009https://hal.archives-ouvertes.fr/hal-02056009
Submitted on 15 Oct 2019
HAL is a multi-disciplinary open accessarchive for the deposit and dissemination of sci-entific research documents, whether they are pub-lished or not. The documents may come fromteaching and research institutions in France orabroad, or from public or private research centers.
L’archive ouverte pluridisciplinaire HAL, estdestinée au dépôt et à la diffusion de documentsscientifiques de niveau recherche, publiés ou non,émanant des établissements d’enseignement et derecherche français ou étrangers, des laboratoirespublics ou privés.
Corporate social responsibility and M&A uncertaintyMohamed Arouri, Mathieu Gomes, Kuntara Pukthuanthong
To cite this version:Mohamed Arouri, Mathieu Gomes, Kuntara Pukthuanthong. Corporate social responsibil-ity and M&A uncertainty. Journal of Corporate Finance, Elsevier, 2019, 56, pp.176-198.�10.1016/j.jcorpfin.2019.02.002�. �hal-02056009�
Corporate social responsibility and M&A uncertainty
Mohamed Arouri Université Côte d’Azur, Nice, France
Mathieu Gomes
Université Clermont Auvergne, Clermont-Ferrand, France
Kuntara Pukthuanthong University of Missouri
An ulterior version of this paper has been published in Journal of Corporate Finance:
Arouri, M., Gomes, M., & Pukthuanthong, K. (2019). Corporate social responsibility and M&A uncertainty. Journal of Corporate Finance, 56, 176-198. DOI:
https://doi.org/10.1016/j.jcorpfin.2019.02.002
Abstract
We contribute to the corporate social responsibility (CSR) literature by investigating whether
the CSR of acquirers impacts mergers and acquisitions (M&A) completion uncertainty. Using
arbitrage spreads following initial acquisition announcements as a measure of deal
uncertainty, we document –for an international sample of 726 M&A operations spanning the
2004-2016 period– a negative association between arbitrage spreads and acquirers’ CSR.
Specifically, we show arbitrage spreads are reduced by 1.10 percentage points for each
standard deviation unit-increase in the acquirer’s CSR score. Findings are qualitatively similar
when we focus on individual CSR dimensions (environmental, social, and governance). Our
results suggest the CSR of acquirers is an important determinant of the way market
participants assess the outcome of M&As worldwide.
Keywords: Corporate Social Responsibility (CSR), Mergers and Acquisitions (M&A), Risk
Arbitrage
JEL Classification: G34, M1
1
1. Introduction
Enormous amounts of money flow each year as a result of mergers and acquisitions (M&A,
henceforth) transactions. In 2016, for example, no less than 48,736 M&A transactions took
place worldwide, representing an aggregate value of $3.6 trillion, according to the Institute
for Mergers, Acquisitions, and Alliances (IMAA)1. These substantial capital flows, coupled with
M&As’ potential ability to create synergies but also conflicts of interest, render the study of
M&As important to academics and practitioners. However, not all M&As attempts turn out to
be successful, which raises the issue of completion risk, i.e., the risk that a deal may not be
consummated. A deal can fail for a variety of reasons including shareholder opposition,
regulatory intervention, financing problems or internal target resistance (Parker, 2005). In
other words, the outcome of a M&A bid depends on the assessment and opinion of many of
an acquirer’s stakeholders2. As a result, the way a company treats its stakeholders should play
a role in the expected outcome of M&A deals.
A firm’s policies and behaviors towards its stakeholders are often referred to as
corporate social responsibility (CSR, henceforth). Interest in CSR has been strongly increasing
for the past two decades, as evidenced by the constantly growing share of companies
adopting CSR reporting3 and the similarly growing role played by Socially Responsible
Investment (SRI) funds4. The substantial increase in CSR awareness has fueled an important
1 Source: https://imaa-institute.org/ 2 There is no common consensus as to what the concept of a stakeholder means, with hundreds of different definitions existing in the literature (Miles, 2012). According to Freeman (1984), stakeholders are “any group or individual who can affect or is affected by the achievements of the organizations objectives”, i.e. shareholders, customers, employers, NGOs, governments, communities, etc. 3 King and Bartels (2015)’s KPMG survey documents that 73 percent of surveyed companies worldwide issued CSR reporting in 2015 (a 32 percentage point increase relative to 2005), and that CSR reporting was undertaken by 92 percent of the world’s largest 250 companies. 4 According to the US SIF Foundation's 2016 Report on Sustainable and Responsible Investing Trends in the United States, more than one out of every five dollars under professional management in the United States –$8.72 trillion or more– was invested according to SRI strategies as of year-end 2015. This represents a 33-percent increase since 2014.
2
body of academic research on the financial consequences of CSR. Recent studies show that
CSR impacts the market value of firms (Buchanan et al., 2018; Fauver et al., 2018; Ferrell et
al., 2016; Gao and Zhang, 2015; Jiao, 2010; Lins et al., 2017; Servaes and Tamayo, 2013), the
cost of capital (El Ghoul et al., 2011; Dhaliwal et al, 2014; Martínez-Ferrero et al., 2016; Ng
and Rezaee, 2015), the financial risk of companies (Kim et al., 2014; Diemont et al., 2016) and
the value of cash holdings (Arouri and Pijourlet, 2017; Cheung, 2016; Ghaly et al., 2015).
However, existing research work has yet to achieve consensus, and whether shareholders’
interests are consistent with those of other stakeholders is still an open question that
deserves further empirical analysis.
In this study, we specifically examine whether the CSR of acquirers impacts the
uncertainty preceding M&A deal completion, and thus contribute to the thin literature
studying CSR in the M&A context. Indeed, while there is considerable research focusing on
M&A on the one side, and on the relationship between CSR and capital markets on the other
side, the association between CSR and M&A is scarcely analyzed. This is surprising as M&A
operations offer an excellent platform to better understand the financial impacts of CSR
expenditures as a waste of valuable resources resulting in benefits enjoyed by non-financial
stakeholders at the expense of shareholders. Following this view, M&As conducted by high-
CSR acquirers should be characterized by more uncertainty than operations initiated by low-
CSR acquirers because of increased risk of shareholder opposition and reduced access to
capital.
In this paper, we contribute to the open debate on the capital market consequences
of CSR activities and evaluate these two opposite views by empirically assessing the impact of
acquirer’s CSR on M&A completion uncertainty, proxied by arbitrage spreads, using an
international sample of 726 deals spanning the 2004-2016 period. Our measure of acquirer’s
CSR comes from ASSET4 – Thomson Reuters ESG Research Data. Our main findings offer
strong evidence that M&A completion uncertainty is negatively related to the CSR of
acquirers. Indeed, we find that a one-standard deviation increase in the acquirer’s CSR score
reduces the deal’s arbitrage spread by 1.10 percentage points. Results are qualitatively similar
5 Corporations represent a nexus of implicit and explicit contracts between shareholders and stakeholders (Coase, 1937; Fama and Jensen, 1983; Shleifer and Summers, 1988). Explicit contracts refer to those contracts that have legal binding whereas implicit contracts have no legal binding. For implicit contracts, firms can miss their promise without being sued by other stakeholders. The value of implicit contracts depends on trust. High-CSR firms tend to have the reputation of being trustworthy and reliable; and are therefore expected to commit to implicit contracts (Kristoffersen et al., 2005; Liang et al., 2017).
4
when we focus on individual CSR dimensions (environmental, social, and governance). Our
evidence is robust to a battery of sensitivity tests, including alternative proxies of completion
uncertainty, alternative sample specifications, and various approaches to address potential
endogeneity. Our findings support arguments in the literature in favor of stakeholder theory.
To the best of our knowledge, our paper is the first international study that examines
the effect of CSR on M&A completion uncertainty. Our paper is related to the literature that
analyzes CSR within the M&A context6. The paper closest to ours is Deng et al. (2013), who
study a sample of US merger deals and find that M&A operations by high CSR acquirers take
less time to complete and are less likely to fail than M&A operations by low CSR acquirers.
They also show that high CSR acquirers realize higher merger announcement returns, higher
announcement returns on the value-weighted portfolio of the acquirer and the target, and
larger increases in post-merger long-term operating performance. We advance this strand of
the literature in several ways. First and foremost, while Deng et al. (2013) focus on US
transactions, we take an international perspective. This international perspective is
particularly important when studying the M&A-CSR link. Indeed, from a firm perspective, the
motivation underlying the adoption of CSR is not straightforward. As Liang and Renneboog
(2017) argue, it is not clear whether firms “do well by doing good”, or “do good by doing
well”. In addition, the authors emphasize that CSR is not necessarily a purely voluntary
initiative and that CSR adoption depends on legal rules, institutional arrangements and
societal preferences. As such, to study the impact of CSR, it is important to consider firms
across different countries. What’s more, the volume of North American deals7 as a proportion
of global M&A activity has fallen from 90.2% of global M&A activity (in US$ value) in 1985 to
6 See, for example, Aktas et al. (2011), Bereskin et al. (2018), Boone and Uysal (2018), Deng et al. (2013), Gomes and Marsat (2018), and Liang et al. (2017). 7 Deals in which the target firm was located in North America.
5
51.3% in 20168. This trend towards increased internationalization of corporate combinations
raises the need to take an international perspective when studying M&A. We exploit the
richness of our M&A dataset and study our research question in an international framework.
Second, as Fransen (2013) highlights, it is important to examine the various dimensions of CSR
separately rather than only focus on the concept as a whole. Therefore, in addition to the
overall CSR, we also analyze the environmental, social, and governance dimensions
individually. Third, while Deng et al. (2013) analyze the impact of CSR on the observed
probability of completion and time to completion, we use a related and intuitive measure of
completion risk, i.e., arbitrage spreads. In finance, most research studies rely on ex post risk
instead of ex ante risk as the latter is more difficult to estimate. The ex ante risk is an opinion
about risk formed at the time the decision is made and thus incorporated by investors in their
decision-making calculations. The ex post risk is often a biased proxy of ex ante risk as the
latter may reflect fears of adverse events that did not materialize (Jorion and Goetzmann,
1999). Fortunately, the M&A process offers a framework in which ex ante completion risk is
readily observable through arbitrage spreads. The arbitrage spread is the difference between
the offer price (to be paid in cash and/or in acquirer’s stock) and the market price of the
target immediately following the M&A announcement. This spread provides us with an
excellent proxy for ex ante uncertainty as it conveys market expectations regarding a deal’s
expected outcome (Jindra and Walkling, 2004). In this sense, it gives us insight into what the
market thinks of the chances of a deal succeeding. Using arbitrage spreads as a measure of
completion risk allows us to evaluate directly how market participants perceive CSR in the
M&A context and to examine whether investors actually price the impact of CSR on M&A risk.
8 Source: https://imaa-institute.org/
6
Fourth, we explicitly control for target’s CSR in additional tests to make sure the impact of
acquirers’ CSR on deal uncertainty does not depend on target’s CSR performance.
Also related to our study is Liang et al. (2017) who investigate the impact of acquirers’
engagement in employee issues in the M&A context. Our study differs from theirs in two
important ways. First, while Liang et al. (2017) analyze M&A wealth effects, we focus on M&A
completion uncertainty. Second, we do not focus only on employee relations but consider all
dimensions of CSR (environment, social, and governance).
Finally, our study also contributes to the literature on the determinants of merger
arbitrage spreads by showing that the CSR attributes of acquirers matter in explaining the
cross-sectional variance of arbitrage spreads.
The remainder of this article is organized as follows. Section 2 presents the concept of
risk arbitrage, the related literature, and motivates how an acquirer’s CSR activities may
impact M&A completion uncertainty. Section 3 describes the data and provides summary
statistics for the different variables we use. Section 4 presents empirical results, and Section 5
concludes.
2. Risk arbitrage, corporate social responsibility, and M&A uncertainty
This section serves three purposes. First, we review previous research studies on M&A and
risk-arbitrage. Second, we discuss the main findings of research works on CSR. Finally, we
relate the two previous literatures and motivate how CSR can be expected to impact M&A
uncertainty.
7
2.1. M&A and risk-arbitrage
When an acquisition bid is announced, the market stock price of the acquiring firm usually
goes down while the market stock price of the target firm usually adjusts upward without
exactly reaching the level of the offer price (to be paid in cash and/or stock of the acquiring
firm). The difference between the target stock price immediately following the acquisition
announcement and the offer price is called the speculation or arbitrage spread. Arbitrage
spreads are theoretically set conditional on the features of a particular acquisition and
anticipating the outcome of the offer. While the bid price provides information about the
bidder’s valuation of the target, the arbitrage spread conveys information about the market’s
pricing of the target conditional on the existence of the bid (Jindra and Walkling, 2004). The
arbitrage spread can therefore be seen as a result from wagers on the expected outcome of
the operation by market participants: the greater the perceived risk of failure, the wider the
arbitrage spread.
Risk arbitrage (sometimes called merger arbitrage) –for which investors seem to have
been regaining interest recently9– is the investment strategy aimed at profiting from this
spread. In the case where the bid is successful, the arbitrageur pockets the arbitrage spread.
However, if the deal fails, the arbitrageur suffers a loss usually much greater than the profit
realized if the deal succeeds. For risk-arbitrageurs, the appropriate positions to undertake
depend on the deal consideration structure. In cash bids, the acquirer offers to exchange cash
for the target’s equity. In this case, the arbitrageur simply purchases the target company’s
stock and earns the arbitrage spread if the offer eventually succeeds. In stock bids (all-stock
or stock-and-cash deals), the arbitrageur still purchases the target company’s stock but also
sells short a given amount of the acquirer’s stock.
Our sample is geographically diverse with 45 countries involved. Table 2 shows a detailed
distribution of deal offers across countries along with their values for the top 20 target and
acquiring countries based on the number of deal offers. Not surprisingly, the United States
are by far the most active market over the sample period, both as an acquirer and as a target,
with 294 offers as acquirer (totaling $2,437 billion) and 325 offers as target (totaling $2,647
billion). Australia, Canada, France, Japan and the UK are the other main countries involved in
10 To check whether our results are robust to the inclusion of outliers, we also conduct our tests without winsorizing. Results are similar and are available upon request.
17
deal attempts, both as acquirers and targets (with these countries cumulatively totaling
$1,185 billion as acquirers and $962 billion as targets).
[Insert Table 2 about here]
4.2. Summary statistics results
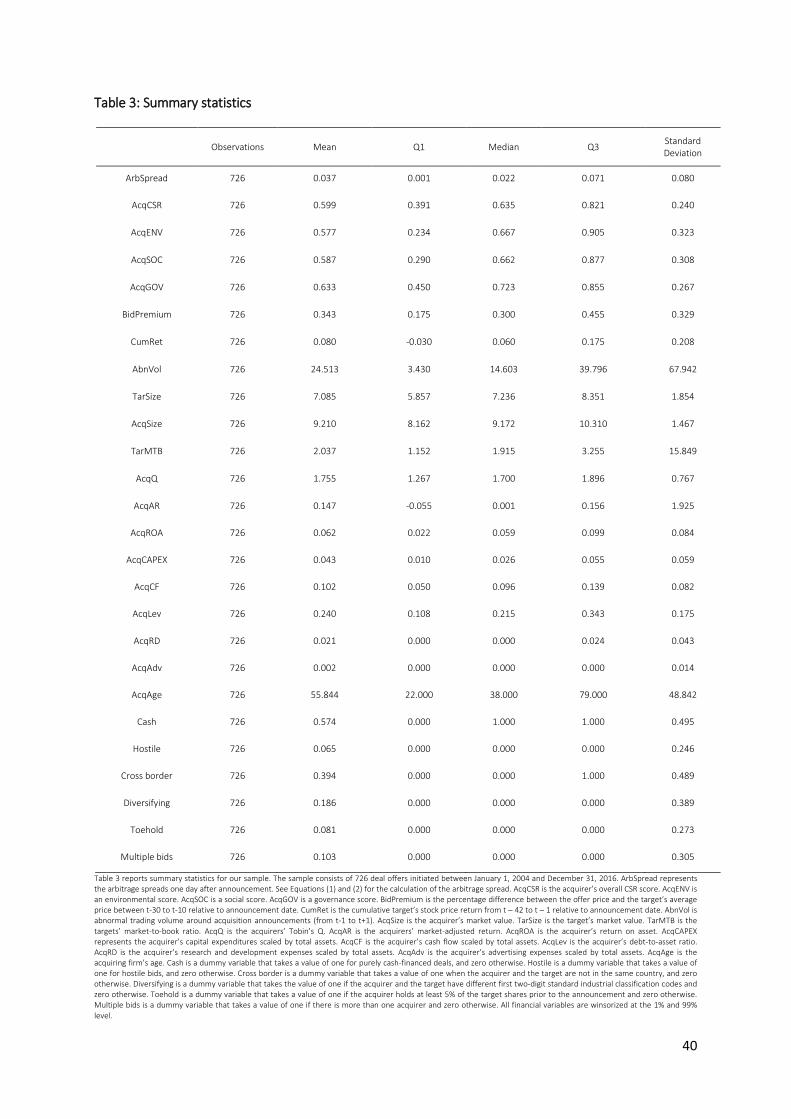
Table 3 reports summary statistics related to our set of variables. The mean and median
arbitrage spreads are 3.70% and 2.20% respectively, with a standard deviation of 7.10%. The
average acquiring firm in our sample has a CSR score of 59.90% and a market-to-book ratio of
3.20. The average premium offered for the target is 34.30%. Correlations among these
explanatory variables are reported in Table 4. None of our variables are highly correlated,
ruling out potential multicollinearity issues. Interestingly, the correlation between arbitrage
spreads and acquirers’ CSR scores is significantly negative. In addition, we see that arbitrage
spreads are positively correlated with the bid premium, and negatively correlated with the
target’s cumulative returns and acquirer size. These facts are in line with what we described
above.
[Insert Table 3 about here]
[Insert Table 4 about here]
4.3. Multivariate analysis of the link between CSR and M&A uncertainty
As discussed in the introduction, despite increased academic interest in CSR and a
large volume of research on M&A, we still know very little about how CSR relates to M&A risk.
The purpose of our study is to address this gap in the literature by empirically examining the
link between acquirers’ CSR and M&A arbitrage spreads. To assess the impact of acquirers’
18
CSR on M&A perceived uncertainty, we regress the arbitrage spread on a measure of
acquirer’s CSR and the set of control variables previously described. Our main model is as
follows11:
(3)
where AcqCSRi is the acquirer’s CSR score and Controls is a vector of control variables
(introduced in section 3.4. and described in Table A1 of the appendix). , , and represent
year, industry, and country fixed-effects, respectively12. In order to better assess how the CSR
of acquirers impacts the arbitrage spread, we test the overall CSR score as well as the scores
for each ASSET4 CSR dimensions, namely Environment, Social, and Governance. AcqCSR is the
acquirer’s overall CSR score in column 1 of Table 5, the acquirer’s environmental score
(AcqENV) in column 2, the social score (AcqSOC) in column 3, and the governance score
(AcqGOV) in column 4. To address potential endogeneity concerns, we perform Ramsey’s
(1969) Regression Specification Error Test (RESET) for omitted variables. Results fail to reject
the null hypothesis of no omitted variable, and therefore suggest our model does not suffer
from this misspecification.
Table 6 presents our results. In column 1, we run our main model using the overall
ASSET4 CSR score as our CSR measure. The coefficient associated with AcqCSR is negative and
statistically significant at the 1% level. This suggests that arbitrage spreads are negatively
related to the acquirer’s CSR. More precisely, the coefficient associated with the acquirer’s
11 In unreported tests, we also specify a model including a squared CSR term to account for potential non-linearity in the relationship between CSR and arbitrage spreads. We find no evidence of non-linear association. 12 Using country and year dummies assumes that whatever is going on in a given year affects all of the countries the same. To make sure this assumption is acceptable, we also run our model using country-year fixed effects. Results are similar under this specification and are available upon request.
19
CSR, AcqCSR is -0.046 (t-statistic = -2.92). Descriptive statistics presented in Table 3 report
that the standard deviation of AcqCSR is 0.240. Therefore, the regression coefficient implies
that arbitrage spreads are reduced by 1.10 percentage points for each standard deviation
unit-increase in the acquirer’s CSR score.13 For a target valued at $100 million, a one-standard
deviation increase in acquirer CSR would result in a $1.1 million decrease in the arbitrage
spread’s dollar-value, which can be seen as the completion uncertainty expressed in terms of
potential market capitalization, or the amount to be monetized by risk-arbitrage investors.
This 1.10-percentage point reduction amounts to approximately 30% of the average arbitrage
spread (3.73%), making it economically significant. In addition, we also test scores for each
individual CSR dimension, namely Environment, Social, and Governance. Results are
presented in columns 2 to 4 and show that each CSR dimension is negatively related to
arbitrage spreads at usual significance levels (5%). In terms of economic interpretation,
results imply that an increase of one standard deviation in the acquirer’s environmental,
social, and governance performance, are associated with a reduction in arbitrage spreads of
0.84, 0.92, and 0.75 percentage points, respectively14.
Coefficients associated with control variables are mostly in line with what we expected.
Similar to Jindra and Walkling (2004), we find that the bid premium is positively linked to
arbitrage spreads. An increase in target’s share price before the announcement as measured
by cumulative price return can be an indicator of shifts in ownership distribution, which is
associated with increased speculative activity, the accumulation of shares in more neutral
13 1.10 percentage points represents the product of the coefficient associated with acquirer’s CSR reported in column 1 of Table 5 and the standard deviation of acquirer’s CSR reported in Table 3 or -0.046 multiplied by 0.240, respectively. 14 In additional tests, we replace AcqCSR by a dummy variable taking the value of one for high CSR acquirers (i.e., acquirers with a CSR score located above the median of our sample). Results remain strong and robust. They are available upon request.
20
hands, and therefore a decrease in arbitrage spreads (Jindra and Walkling, 2004). Hostile
deals are often associated with multiple bidders, target resistance and a higher likelihood of
bid revision, thereby decreasing spreads (Jennings and Mazzeo, 1993). In contrast to Jindra
and Walking (2004) who find abnormal volume and toehold are negatively related to
arbitrage spreads, we find they are insignificant. In a recent study, Buehlmaier and Zechner
(2017) study how returns of merger arbitrage spread are determined by content of media
and find that the bid premium, acquirer’s size and cash flow, and target’s size and market-to-
book ratio do not significantly impact arbitrage spread. In contrast to Buehlmaier and Zechner
(2017), we find that the bid premium, target’s size and market-to-book ratio are positively
associated with arbitrage spreads while acquirer’s size is negatively linked to arbitrage
spreads. As target’s size and valuation increase, so do target’s resources to oppose the
attempt (Hoffmeister and Dyl, 1981) and because the probability of takeover success
therefore decreases, arbitrage spreads should be wider as a result. Regarding acquirer size,
larger acquirers might be able to hire prestigious underwriters whose expertise allows them
to estimate the offer price maximizing the probability of success, thereby decreasing
arbitrage spreads. In addition, large acquirers may enjoy an easier access to capital, reducing
deal financing uncertainty and therefore reducing arbitrage spreads. Although some
coefficients associated with our controls may differ in terms of statistical significance from
those available in the extant literature, the signs of these coefficients are consistent with
those predicted by theory. The difference in statistical significance between our results and
the extant literature is mainly due to sample differences including period, countries, and
model specifications. Our sample period is from 2004 to 2016 covering 45 countries, Jindra
and Walking (2004)’s sample is from 1981 to 1995 covering only US firms, and Buehlmaier
and Zechner (2017) focus on US firms from 1999 to 2009. In addition, cash deals, and deals
21
involving multiple bidders appear to be associated with narrower arbitrage spreads, again
confirming the expected association. Acquirer proxies of management quality (Tobin’s Q and
previous market-adjusted return) as well as other acquirer characteristics (ROA, CAPEX, Cash
flows, R&D, advertising and age) do not appear to have an influence. The cross-border nature
of deals does not seem to impact arbitrage spreads. Overall, our results suggest that more
socially responsible firms are perceived by the market as more capable of successfully and
timely completing mergers and acquisitions15.
To confirm this interpretation and make sure the findings of Deng et al. (2013) are
robust across countries, we follow their methodology and analyze the impact of CSR on the
probability of deal completion using Probit regression in which the dependent variable is a
dummy variable that equals one if the deal is completed and zero otherwise. Results are
reported in Table 6 and show that the probability of completion increases with the acquirer’s
CSR score. Analyzing individual dimensions, we report that environmental performance
(column 2) and social performance (column 3) are both positively associated with the
probability of deal completion while governance (column 4) has no impact. Overall, these
results suggest that CSR affects the likelihood of deal completion and that market participants
anticipate this as evidenced by smaller merger arbitrage spreads.
[Insert Table 5 about here]
[Insert Table 6 about here]
15 To further control for country or institutional factors, we also run our model focusing on US deals only. Results are not materially different under this specification and are not reported due to limited space. They are available upon request.
22
4.4. Robustness tests
4.4.1. Alternative measure of M&A uncertainty
Arbitrage spreads are usually computed one day after deal announcement. However,
following Branch and Wang (2008), we also test the arbitrage spread two days after
announcement in order to allow the market more time to absorb the deal-related
information fully. Results are reported in column 1 of Table 7 and confirm the negative
relationship between acquirers’ CSR and M&A uncertainty, albeit at a slightly lower level of
significance (5%).
4.4.2. Accounting for the financial crisis
Our sample comprises various deals initiated during the 2007-2009 financial crisis. It is
therefore possible that our results could be biased by particular behaviors characterizing
periods of economic distress. In addition, if the impact of CSR on firms is more salient during
periods of market stress (Lins et al., 2017), including deals announced over this crisis period
could results in misestimating the impact of CSR on arbitrage spreads. In this sub-section, we
control for this potential issue by removing from our sample all deals announced during the
financial crisis period as defined by the National Bureau of Economic Research (NBER), i.e.,
ranging from December 2007 to June 2009. There are 56 deals in our sample that were
announced during this period. We remove them and re-estimate our model. Results are
presented in column 2 of Table 7 and confirm the negative and statistically significant (at the
1% level) relationship between acquirer’s CSR and M&A uncertainty.
23
4.4.3. Removing financial firms
Several papers (Jindra and Walkling, 2004; Deng et al., 2013) exclude financial firms from their
investigations as financial industries have different reporting policies and are subject to
different regulations. To make sure our results are not biased by the inclusion of financial
firms, we remove deals involving financial firms and re-estimate our model. The exclusion of
financial industry deals reduces the sample size by 122 deals. Results are reported in column
3 of Table 7. Again, acquirer’s CSR appears to bear a negative and statistically significant
relationship with arbitrage spreads, confirming our previous conclusions.
4.4.4. Excluding negative arbitrage spreads
In this sub-section, we remove from our sample the deals that exhibit negative arbitrage
spreads. Negative arbitrage spreads may be less intuitive to understand. In fact, they occur as
a result of increased speculation regarding the possibility of an offer price revision by the
current bidder, or an expected higher offer coming from a competitive bidder. This, in turn,
could bias our results by adding to the conditional pricing of the deal an extra layer of
speculation on top of the assessment of completion risk. Removing these deals reduces our
sample to 545 deals. Results are reported in column 4 of Table 7, and confirm our previous
findings. Indeed, the association between acquirer’s CSR and arbitrage spreads remains
negative and statistically significant (at the 1% level).
4.4.5. Excluding US deals
The US are the largest covered country and US deals account for a significant proportion
(33%) of our sample (237 out of 726 deals). In order to address a potential sample bias and
make sure our results are not driven by the US, we remove these US deals from our sample.
24
The exclusion of those deals reduces the sample size to 489 observations. Results are
reported in column 5 of Table 7. Again, acquirer’s CSR appears to bear a negative and
statistically significant relationship with arbitrage spreads (at the 1% level).
[Insert Table 7 about here]
4.4.6. Accounting for target’s CSR
Recent studies show that CSR similarity between acquirer and target can have an impact on
M&A operations. For example, Bereskin et al. (2018) find that firms that are similar in terms
of CSR are more likely to merge and that these mergers are associated with greater synergies,
superior long-run operating performance, and fewer goodwill impairments. Lee et al. (2018)
reach similar conclusions focusing on human capital relatedness while Boone and Uysal
(2018) show similar findings by analyzing the environmental dimension. Target’s stand-alone
CSR could also have an influence on arbitrage spreads. Indeed, as shown by Cumming et al.
(2016), manipulation (which can be thought of as the negative of CSR) by target insiders can
increase the risk of deal withdrawal. In light of these elements, target’s CSR policies could also
play a role in driving deal completion uncertainty. In order to make sure our results are not
biased by the omission of target’s CSR data, we include target’s CSR score in our model:
(4)
where AcqCSRi is the acquirer’s CSR score, TarCSRi is the target’s CSR score and Controls is a
vector of control variables (introduced in section 3.4. and described in Table A1 of the
appendix). , , and represent year, industry, and country fixed-effects, respectively. The
25
additional requirement of having CSR data for both the acquirer and target reduces our
sample size from 726 to 404 deals. Results are presented in Table 8 and confirm our previous
findings in that acquirer’s CSR remains negatively related to arbitrage spreads at conventional
statistical significance levels while target’s CSR does not seem to have an impact16.
[Insert Table 8 about here]
4.4.7. Accounting for endogeneity
One could argue that endogeneity could be a concern in this context. First of all, our
dependent variable, i.e., the arbitrage spread, includes the offer price made by the acquirer
and it could be argued that the acquirer’s bidding behavior might be correlated with its CSR
characteristics. We alleviate this concern by 1) including the bid premium in our model and 2)
showing that the bid premium is not correlated with CSR as evidenced in Table 417.
Another potential concern would be that of CSR being a proxy for management
quality. To address this omitted variable concern, we explicitly include proxies of
management quality in our regression, namely Tobin’s Q and previous market-adjusted return
(Deng et al., 2013; Lang et al., 1989). To make sure CSR does not proxy for other financial
characteristics and does not result from the availability of limited resources (Sun and Gunia,
2018), our model also includes measures of performance (ROA), investment (CAPEX and
R&D), and advertising expenses.
16 We also tried replacing target’s CSR by the CSR difference between acquirer and target. Results are similar in that only acquirer’s CSR impacts arbitrage spreads. They are available upon request. 17 To confirm this fact in a multivariate context, we also regress the CSR of acquirers on the bid premium and the list of controls included in equation 3. The absence of association between CSR and the bid premium is confirmed.
26
One could also argue that managers may opportunistically invest in CSR activities in
order to improve their odds of being successful acquirers, raising the issue of reverse
causality. However, because acquiring CSR capabilities is a lengthy and complicated process,
investing in CSR for the sole purpose of increasing the probability of deal completion would
probably be a valid consideration for frequent acquirers only. In order to address these
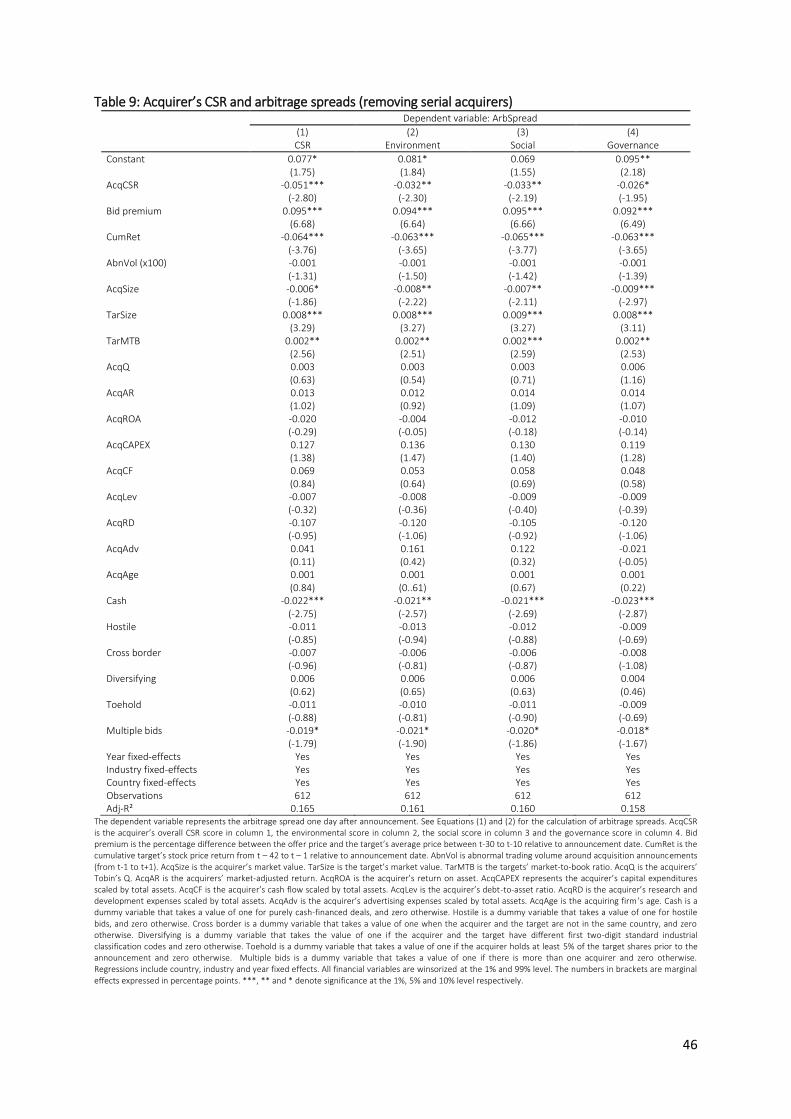
concerns, we repeat our analysis excluding serial acquirers from our sample18. Specifically, we
follow Billett and Qian (2008) and define serial acquirers as firms that acquire at least two
targets within any five-year horizon. There are 114 such firms in our sample and their
exclusion therefore reduces our sample to 612 observations. We report the results in Table 9.
We see that the removal of serial acquirers does not alter our previous conclusions in that
CSR scores (overall and by dimensions) are negatively related to arbitrage spreads.
[Insert Table 9 about here]
To further address potential endogeneity problems, we also estimate instrumental variable
regressions (two-stage-least-squares or 2SLS). In the first stage, we estimate ordinary least
square regressions to predict the value of AcqCSR, AcqENV, AcqSOC and AcqGOV, i.e., we
regress our CSR measure on explanatory variables used in Equation 3 and on two
instrumental variables. For the choice of instruments, we base our work on Ioannou and
Serafeim (2012) who show that CSR is determined by both country and industry
characteristics. More precisely, a firm’s CSR is impacted by a time-invariant component
associated with its membership in the country-industry pair, and a time-varying component at
the country level (Cheng et al., 2014). In other words, a firm’s CSR is impacted by the CSR of
18 Removing serial acquirers also solves the potential issue of deals dependences within the same firms.
27
other firms within the same industry-country pair, and by the CSR of other firms in the same
country over time. We follow Cheng et al. (2014), Arouri and Pijourlet (2017), and Gomes and
Marsat (2018), and use as instruments the country-year mean of CSR scores and the country-
industry mean of CSR scores, computed using the entire ASSET4 ESG database. To further
support our choice of instruments, in each 2SLS regressions we perform the following two
tests: (1) a Cragg and Donald (1993) instrument relevance test to ensure the relevance of our
instruments (i.e., high correlations between the instruments and adjusted CSR), and (2) a
Sargan (1958) overidentification test to investigate the exogeneity of our instruments (i.e., no
significant correlation between the instruments and the residuals in the arbitrage spread
regressions)19. Results are presented in Table 10.
[Insert Table 10 about here]
In the first-stage regressions reported in columns 1, 3, 5 and 7, we see that both instruments
are statistically significant, which seems to validate their use. In the second-stage regressions,
we substitute the predicted values of our CSR measures for the actual CSR scores and report
results in columns 2, 4, 6 and 8. These results confirm our previous findings in that the
predicted values of our CSR measures for overall, environment, social, and governance
performance are negatively associated with arbitrage spreads at usual significance levels.
19 In unreported results, we control for potential self-selection bias by following the Heckman (1979) two-stage procedure. Indeed, Firms with certain characteristics could choose to become high-CSR firms. Specifically, in the first stage, we run a Probit regression in which the dependent variable is equal to one if the firm’s CSR is higher than the sample median and zero otherwise and the independent variables are the instrumental and control variables used in Tables 6 and 10. In the second stage, we estimate an ordinary least square (OLS) regression of arbitrage spreads on acquirer’s CSR, the inverse Mills ratio and the control variables used in Table 6. Results remain qualitatively similar, indicating that self-selection bias is unlikely to affect our findings.
28
4.5. Discussion
Overall, our results suggest that high CSR by the acquirer tends to reduce the uncertainty
surrounding mergers and acquisitions and leads to narrower arbitrage spreads. In accordance
with the stakeholder view, one could explain this fact by arguing that strong CSR attributes
possibly reduce the probability of a breach in implicit contracts, and increase stakeholders’
support towards a firm. More specifically, this reduction in M&A perceived uncertainty may
come from four sources. First, we argue that target firms’ stakeholders are less likely to
oppose the acquisition attempt if it comes from a socially responsible firm, because of the
increased reputation associated with corporate social performance (Martinez-Ferrero et al.,
2016)20. Indeed, a M&A attempted by a socially irresponsible firm could lead target’s
stakeholders to protest and lobby against the takeover, and this lobbying pressure could in
turn potentially convince the board to consider alternatives to the takeover (Liang et al.,
2017). In addition, negative reputation spillovers coming from a low-CSR acquirer would
potentially decrease the value of the target firm relative to other acquirers with better CSR
credentials (Boone and Uysal, 2018), and the target firm should therefore be more inclined to
oppose a M&A attempt coming from a low CSR bidder. Strong CSR by the acquirer should
therefore lead to a reduced probability of target resistance. Second, we also explain the
impact of CSR on M&A uncertainty by the reduction of conflict-of-interest risk between
shareholders and other stakeholders, which facilitates the acquisition process and leads to
faster integration (Deng et al., 2013). Indeed, a strong CSR performance is often associated
with a stronger commitment to explicit and implicit contracts with key stakeholders (Deng et
al., 2013; Liang et al., 2017). This stronger commitment to explicit and implicit contracts has
20 This result is confirmed within our sample. Using Fortune’s World’s most admired companies ranking, we find that firms present in the index feature a CSR score which is 17% higher on average, compared with firms which are not present in the index. Results are not reported for the sake of brevity but are available upon request.
29
an impact on the wealth gains of acquiring firms’ shareholders (Shleifer and Summers, 1988;
Rhodes-Kropf and Robinson, 2008; Masulis et al., 2016; Liang et al., 2017). As a result,
acquirers’ shareholders should be less likely to oppose deals conducted by high CSR firms.
Third, we argue that CSR reduces M&A completion uncertainty through its impact on deal
financing, as empirical studies have shown that a strong CSR commitment leads to a lower
cost of equity capital (El Ghoul et al., 2011; Dhaliwal et al., 2014; Martínez-Ferrero et al.,
2016), a lower cost of debt (Goss and Roberts, 2011; Oikonomou et al., 2014)21, and an easier
access to finance (Cheng et al., 2014). As a result, M&A operations conducted by high-CSR
firms should embed less financing uncertainty. Fourth, a strong CSR commitment could
potentially improve a firm’s image among regulators (Hong and Liskovich, 2015) and reduce
the probability of regulatory intervention during the M&A process.
We also show that the negative impact of acquirer’s CSR on deal uncertainty does not
depend upon the CSR credentials of target firms.
Finally, our study interestingly complements the findings of Deng et al. (2013) in that
we find the negative link between CSR and M&A completion risk holds internationally. Our
study confirms this reduction in M&A completion risk associated with strong CSR is priced by
market participants before deal conclusion, ruling out a potential anomaly in the conditional
pricing of targets.
5. Conclusion
In this paper, we conduct the first international study on the impact of Corporate Social
Responsibility (CSR) on Mergers & Acquisitions (M&A)completion uncertainty as measured by
21 Our sample also confirms this relationship. High CSR acquirers (see definition in section 4.1.) have a weighted average cost of capital that is 2.1 percentage points lower on average than Low CSR acquirers. Results are not reported for the sake of brevity but are available upon request.
30
arbitrage spreads. We rely on the literature on CSR and develop two competing views
(shareholder view vs. stakeholder view) about the effect of an acquirer’s CSR on M&A
uncertainty. The shareholder view suggests that high-CSR acquirers should face higher
uncertainty when conducting acquisitions; as a result, M&As undertaken by high-CSR
acquirers should be characterized by wider arbitrage spreads. In contrast, the stakeholder
view predicts that high-CSR acquirers should be more capable of quickly and successfully
completing M&As; therefore, M&As undertaken by high-CSR acquirers should be
characterized by less uncertainty and narrower arbitrage spreads.
Using an international sample of 726 deals announced between 2004 and 2016 and
controlling for other determinants previously identified in the literature, we find that deals
conducted by firms with strong CSR are associated with lower uncertainty as evidenced by
narrower arbitrage spreads. This empirical result is consistent with the stakeholder view. In
addition, we also examine the individual impact of each CSR dimension (Environment, Social,
and Governance) and find that performance in all dimensions is negatively associated with
M&A uncertainty. Our results demonstrate robustness in terms of alternative measures of
arbitrage spreads as well as different sample specifications. In addition, we show that the
negative impact of acquirer’s CSR on deal uncertainty holds regardless of the CSR
performance of the target. We also show our results are not affected by endogeneity bias.
Overall, our findings contribute to the M&A and CSR literatures by showing how CSR
influences the way markets assess the expected outcome of M&As. We show that CSR is an
important determinant of the perceived risk surrounding M&A operations.
31
Acknowledgement
We thank the “Value & CSR” chair for providing the CSR data. We are grateful to Douglas
Cumming (the editor), and two anonymous referees for their constructive comments. We
also thank Sylvain Marsat for helpful comments. The ideas, methodology, and findings
expressed in this paper remain our sole responsibility.
References
Aktas, N., De Bodt, E., Cousin, J. G., 2011. Do financial markets care about SRI? Evidence from mergers and acquisitions. Journal of Banking and Finance 35, 1753-1761. Arouri, M., Pijourlet, G., 2017. CSR Performance and the value of cash holdings: International evidence. Journal of Business Ethics 140(2), 263-284. Baker, M., Savasoglu, S., 2002. Limited arbitrage in mergers and acquisitions. Journal of Financial Economics 64, 91-115. Barnea, A., Rubin, A., 2010. Corporate social responsibility as a conflict between shareholders. Journal of Business Ethics 97, 71-86. Barney, J. B., Hansen, M. H., 1994. Trustworthiness as a source of competitive advantage. Strategic Management Journal 15, 175-190. Bereskin, F. L., Byun, S. K., Officer, M. S., Oh, J. M., 2018. The effect of cultural similarity on mergers and acquisitions: Evidence from corporate social responsibility. Journal of Financial and Quantitative Analysis, Forthcoming. Billett, M.T., Qian, Y., 2008. Are overconfident managers born or made? Evidence of self- attribution bias from frequent acquirers. Management Science 54, 1037-1051. Boone, A., Uysal, V.B., 2018. Reputational concerns in the market for corporate control. Journal of Corporate Finance, Forthcoming. Branch, B.S., Wang, J., 2008. Risk-arbitrage spreads and performance of risk arbitrage. The Journal of Alternative Investments 11, 9-22. Branco, M.C., Rodrigues, L.L., 2006. Corporate social responsibility and resource-based perspectives. Journal of Business Ethics 69, 111-132. Buchanan, B., Cao, C.X., Chen, C., 2018. Corporate social responsibility, firm value, and influential institutional ownership. Journal of Corporate Finance 52, 73-95.
32
Buehlmaier, M.M.M., Zechner, J. 2017. Financial media, price discovery, and merger arbitrage. Working paper. Available at SSRN: https://ssrn.com/abstract=2858999. Burns, D.J., Collett, N., 2017.A Stakeholder Framework for Evaluating the Impact of Mergers and Acquisitions. In Cary L. Cooper , Sydney Finkelstein (ed.) Advances in Mergers and Acquisitions(16), Emerald Publishing Limited. Campbell, J.L. 2007. Why would corporations behave in socially responsible ways? An institutional theory of corporate social responsibility. Academy of Management Review 32, 946-967. Cheng, B., Ioannou, I., Serafeim, G., 2014. Corporate social responsibility and access to finance. Strategic Management Journal 35, 1-23. Cheung, A.W.K., 2016. Corporate social responsibility and corporate cash holdings. Journal of Corporate Finance 37(C), 412-430. Coase, R.H., 1937. The nature of the firm. Econometrica 4, 386-405. Cornelli, F., Li, D., 2001. Risk arbitrage in takeovers. Review of Financial Studies 15, 837- 868. Cornell, B., Shapiro, A.C., 1987. Corporate stakeholder and corporate finance. Financial Management 16, 5-14. Cumming, D.J., Ji, S., Johan, S., Tarsalewska, M., 2016. Manipulation and M&As. Working paper. Available at: http://www.fmaconferences.org/Vegas/Papers/cjjt.pdf. Cragg, J.G., Donald, S.G., 1993. Testing identifiability and specification in instrumental variable models. Econometric Theory 9, 222-240. Deng, X., Kang, J.K., Low, B.S., 2013. Corporate social responsibility and stakeholder value maximization: Evidence from mergers. Journal of Financial Economics 110, 87-109. Dhaliwal, D., Li, O.Z., Tsang, A., Yang, Y.G., 2014. Corporate social responsibility disclosure and the cost of equity capital: The roles of stakeholder orientation and financial transparency. Journal of Accounting and Public Policy 33, 328-355. Diemont, D., Moore, K., Soppe, A., 2016. The downside of being responsible: corporate social responsibility and tail risk. Journal of Business Ethics 137, 213-229. Donaldson T., Preston L.E., 1995. The stakeholder theory of the corporation: Concepts, evidence, and implications. Academy of Management Review 20, 65-91. El Ghoul, S., Guedhami, O., Kwok, C.C., Mishra, D.R., 2011. Does corporate social responsibility affect the cost of capital? Journal of Banking and Finance 35, 2388-2406.
Fama, E.F., Jensen, M.C., 1983. Separation of Ownership and Control. Journal of Law and Economics 26(2), 301-325. Fauver, L., McDonald, M.B., Taboada, A.G., 2018. Does it pay to treat employees well? International evidence on the value of employee-friendly culture. Journal of Corporate Finance 50, 84-108. Ferrell, A., Liang, H., Renneboog, L., 2016. Socially responsible firms. Journal of Financial Economics 122(3), 585-606. Fombrun, C. J., Gardberg, N. A., Barnett, M. L., 2000. Opportunity platforms and safety nets: Corporate citizenship and reputational risk. Business and Society Review 105, 85-106. Fransen, L., 2013. The embeddedness of responsible business practice: Exploring the interaction between national-institutional environments and corporate social responsibility. Journal of Business Ethics, 115(2), 213-227. Freeman, R.E., 1984. Strategic management: A stakeholder approach, Marshfield, Pitman. Friedman, M., 1970. The Social Responsibility of Business is to Increase its Profits. The New-York Times Magazine, Sept-70, 32-33. Gao, L., Zhang, J.H., 2015. Firms’ earnings smoothing, corporate social responsibility, and valuation. Journal of Corporate Finance 32, 108-127. Ghaly, M., Dang, V.A., Stathopoulos, K., 2015. Cash holdings and employee welfare. Journal of Corporate Finance 33, 53-70. Gomes, M., Marsat, S., 2018. Does CSR impact premiums in M&A transactions?. Finance Research Letters 26, 71-80. Goss, A., Roberts, G.S., 2011. The impact of corporate social responsibility on the cost of bank loans. Journal of Banking and Finance 35(7), 1794-1810. Hawn, O., 2013. How social legitimacy helps overcome low home country legitimacy: Corporate social responsibility and emerging market multinationals. Paper presented at the 2013 Academy of Management annual meeting, Orlando, Florida. Hoffmeister, J., Dyl, E., 1981. Predicting outcomes of cash tender offers. Financial Management 10, 50-58. Hong, H., Liskovich, I., 2015. Crime, punishment and the halo effect of corporate social responsibility Working paper 21215. National Bureau of Economic Research. Available at: http://www.nber.org/papers/w21215 Ioannou, I., Serafeim, G., 2012. What drives corporate social performance? The role of nation-level institutions. Journal of International Business Studies 43, 834-864.
Jensen, M.C., 2001. Value maximization, stakeholder theory, and the corporate objective function. Journal of Applied Corporate Finance 14, 8-21. Jetley, G., Ji, X., 2010. The shrinking merger arbitrage spread: Reasons and implications. Financial Analysts Journal 66, 54-68. Jennings, R., Mazzeo, M.A., 1993. Competing bids, target management resistance and the structure of takeover bids. Review of Financial Studies, 6, 883-909. Jiao, Y., 2010. Stakeholder welfare and firm value. Journal of Banking and Finance 34, 2549-2561. Jindra, J., Walkling R.A., 2004. Speculation spreads and the market pricing of proposed acquisitions. Journal of Corporate Finance 10, 495-526. Jorion, P., Goetzmann, W. N., 1999. Global stock markets in the twentieth century. The Journal of Finance 54(3), 953-980. Kim, Y., Li, H., Li, S., 2014. Corporate social responsibility and stock price crash risk. Journal of Banking and Finance 43, 1-13. King, A., Bartels, W., 2015. KPMG Survey of Corporate Responsibility Reporting 2015. Kristoffersen, I., Gerrans, P., Clark-Murphy, M., 2005. The corporate social responsibility and the theory of the firm. Finance and Economics & FIMARC Working Paper Series, Edith Cowan University. Lakonishok, J., Vermaelen, T., 1990. Anomalous price behavior around repurchase tender offers. Journal of Finance 45, 455-477. Lang, L., Stulz, R.M., Walkling, R.A., 1989. Managerial performance, Tobin’s q, and the gain from successful tender offers. Journal of Financial Economics 24, 137-154. Larcker, D.F., Lys, T., 1987. An empirical analysis of the incentives to engage in costly information acquisition: The case of risk arbitrage. Journal of Financial Economics 18, 111-126. Levitt, T., 1958. The dangers of social responsibility. Harvard Business Review 36, 41-50. Lee, K.H., Mauer, D.C., Xu, Q.E., 2018. Human capital relatedness and mergers and acquisitions. Journal of Financial Economics, Forthcoming. Doi: 10.1016/j.jfineco.2018.03.008 Liang, H., Renneboog, L., 2017. On the Foundations of Corporate Social Responsibility. The Journal of Finance 72(2), 853–910.
35
Liang, H., Renneboog, L., Vansteenkiste, C., 2017. Corporate employee-engagement and merger outcomes. Working paper. Available at SSRN: https://ssrn.com/abstract=2926479. Lins, K.V., Servaes, H., Tamayo, A., 2017. Social capital, trust, and firm performance: The value of corporate social responsibility during the financial crisis. The Journal of Finance 72(4), 1785-1824. Martínez-Ferrero, J., Banerjee, S., García-Sánchez, I.M., 2016. Corporate social responsibility as a strategic shield against costs of earnings management practices. Journal of Business Ethics 133, 305-324. Masulis, R., Wang, C., Xie, F., 2016. Employee-manager alliances and shareholder returns from acquisitions. Working paper. Available at SSRN: https://papers.ssrn.com/sol3/papers.cfm?abstract_id=2895745. Miles, S., 2012. Stakeholder: Essentially contested or just confused? Journal of Business Ethics 108, 285-298. Mitchell, M., Pulvino T., 2001. Characteristics of risk and return in risk arbitrage. Journal of Finance 56, 2135-2175. Ng, A.C., Rezaee, Z., 2015. Business sustainability performance and cost of equity capital. Journal of Corporate Finance 34, 128-149. Oikonomou, I., Brooks, C., Pavelin, S., 2014. The effects of corporate social performance on the cost of corporate debt and credit ratings. Financial Review 49(1), 49-75. Parker, V.R., 2005. Managing Hedge Fund Risk: Strategies and Insights from Investors, Counterparties, Hedge Funds and Regulators. Risk Books; 2nd edition. Porter, M.E., Kramer, M.R., 2006. The link between competitive advantage and corporate social responsibility. Harvard Business Review 12, 78-92. Ramsey, J.B., 1969. Tests for specification errors in classical linear least-squares regression analysis. Journal of the Royal Statistical Society, Series B (Methodological), 350-371. Rhodes-Kropf, M., Robinson, D.T., 2008. The market for mergers and the boundaries of the firm. Journal of Finance 63, 1169–1211. Sargan, J.D., 1958. The estimation of economic relationships with instrumental variables. Econometrica 26, 393-415. Schreck, P., 2011. Reviewing the business case for corporate social responsibility: New evidence and analysis. Journal of Business Ethics 103(2), 167-188. Servaes, H., Tamayo, A. (2013). The impact of corporate social responsibility on firm value: The role of customer awareness. Management science 59(5), 1045-1061.
Shah, R.H., Swaminathan, V., 2008. Factors influencing partner selection in strategic alliances: The moderating role of alliance context. Strategic Management Journal 29, 471-494. Shane, P.B., Spicer, B.H., 1983. Market response to environmental information produced outside the firm. The Accounting Review 58, 521-538. Shleifer, A., Summers, L.H., 1988. “Breach of trust in hostile takeovers,” in Alan J. Auerbach (eds.), Corporate takeovers: Causes and consequences. Chicago: The University of Chicago Press. Sun, X., Gunia, B.C., 2018. Economic resources and corporate social responsibility. Journal of Corporate Finance 51, 332-351. Stellner, C., Klein, C., Zwergel, B., 2015. Corporate social responsibility and Eurozone corporate bonds: The moderating role of country sustainability. Journal of Banking and Finance 59, 538-549. Teoh, S.H., Welch I., Wazzan, C.P., 1999. The effect of socially activist investment policies on the financial markets: evidence from the South African boycott. Journal of Business 72, 35–89. Walkling, R., 1985. Predicting tender offer success: A logistic analysis, Journal of Financial and Quantitative Analysis 20(4), 461-478. Withisuphakorn, P., Jiraporn, P., 2016. The effect of firm maturity on corporate social responsibility (CSR): do older firms invest more in CSR?. Applied Economics Letters 23(4), 298-301.
37
Appendix Table A1: Description of variables
Variable Description Expected sign
ArbSpread Arbitrage spread one day after announcement. It is computed for cash and stock deals as per equations 1 and 2, respectively.
Bid premium Following Jindra and Walkling (2004), we compute the bid premium as follows: Bid premium = (offer price – average price before bid) / average price before bid. Average price before bid is computed from t – 30 to t – 10 relative to the announcement date.
+
CumRet Following Jindra and Walkling (2004), we measure cumulative return as the target’s stock price return from t – 42 to t – 1 relative to announcement date.
-
AbnVol Cumulative abnormal trading volume around acquisition announcements using Lakonishok and Vermaelen’s method (1990):
where normal volume is the average trading volume between t – 50 and t – 25 relative to announcement date.
-
TarSize Natural logarithm of target’s market value +
AcqSize Natural logarithm of acquirer’s market value -
TarMTB Market-to-Book ratio of the target. -
AcqQ Tobin’s Q of the acquirer. -
AcqAR Acquirer’s buy-and-hold abnormal return estimated using 200 trading days of return data ending 11 before deal announcement (as in Deng et al., 2013). Given our international dataset, the market return used is the return on the primary stock market of the country in which the firm’s headquarter is located (as in Liang et al., 2017).
-
AcqROA Return on asset of the acquirer. +/-
AcqCAPEX Acquirer’s capital expenditures scaled by total assets. +/-
AcqCF Acquirer’s cash flow (FFO) scaled by total assets. +/-
AcqLev Acquirer’s debt-to-total assets ratio. +/-
AcqRD Acquirer’s research and development expenses scaled by total assets. +/-
AcqAdv Acquirer’s advertising expenses (from Factset) scaled by total assets. +/-
AcqAge Acquiring firm’s age +/-
Cash Dummy variable that takes the value of one when the form of consideration is cash-only, and zero otherwise.
-
Hostile Dummy variable that takes the value of one when the takeover attempt is considered hostile, and zero otherwise.
+/-
Cross border Dummy variable that takes the value of one when the deal involves a target and an acquirer coming from two different countries, and zero otherwise.
+
Diversifying Dummy variable that takes the value of one if the acquirer and the target have different first two-digit standard industrial classification codes and zero otherwise.
+
Toehold Dummy variable that takes a value of one if the acquirer holds at least 5% of the target shares prior to the announcement and zero otherwise.
-
Multiple bids Dummy variable that takes a value of one if there is more than one acquirer and zero otherwise.
-
Table A1 reports the description of the control variables used in our multivariate regressions as well as the sign of their predicted relationship with arbitrage spreads. All variables whose timing is not mentioned are the latest available data before deal announcement.
38
Table 1: Average speculation spreads over the sample period
Year Number of deal offers
Average arbitrage spread
(%)
% of cases with negative arbitrage spreads
Number of successful
deals
Number of cash deals
Number of hostile deals
Number of cross-border deals
2004 6 10.90 16.67 1 1 1 1
2005 9 2.88 11.11 7 5 0 4
2006 36 3.28 30.56 26 21 4 16
2007 40 3.24 37.50 30 24 4 25
2008 39 5.14 23.08 25 25 5 18
2009 28 4.89 21.43 21 15 2 11
2010 63 2.34 38.10 48 33 3 27
2011 68 3.61 29.41 56 47 4 25
2012 84 4.43 15.48 68 54 1 33
2013 64 3.94 23.44 49 40 0 21
2014 88 3.28 25.00 65 50 2 35
2015 152 4.50 20.39 104 74 17 54
2016 49 2.62 20.41 28 28 4 16
Total 726 3.73 24.93 529 417 47 286
Table 1 reports average arbitrage spreads and number of deal offers over the sample period. See Equations (1) and (2) for the calculation of the arbitrage spread. Our sample includes 726 deal offers announced between January 1, 2004, and December 31, 2016. Arbitrage spreads are computed one day after deal announcement.
39
Table 2: Deal offers by acquirer and target countries
Acquirer Target
Domestic deals Cross-border deals
All deals Domestic deals Cross-border deals
All deals
# Value (US$M)
# Value (US$M)
# Value (US$M) # Value
(US$M) # Value
(US$M) # Value
(US$M)
USA 237 2,048,496 57 388,791 294 2,437,287 USA 237 2,048,496 88 598,475 325 2,646,970
Table 2 reports descriptive statistics on all attempted domestic and cross-border deals along with information on deal values. The deal offers are listed by country of origin of the target and acquirer. The data are obtained from the SDC database. Reported values are denominated in US dollars (not adjusted for inflation). # indicates the number of deals.
40
Table 3: Summary statistics
Observations Mean Q1 Median Q3
Standard Deviation
ArbSpread 726 0.037 0.001 0.022 0.071 0.080
AcqCSR 726 0.599 0.391 0.635 0.821 0.240
AcqENV 726 0.577 0.234 0.667 0.905 0.323
AcqSOC 726 0.587 0.290 0.662 0.877 0.308
AcqGOV 726 0.633 0.450 0.723 0.855 0.267
BidPremium 726 0.343 0.175 0.300 0.455 0.329
CumRet 726 0.080 -0.030 0.060 0.175 0.208
AbnVol 726 24.513 3.430 14.603 39.796 67.942
TarSize 726 7.085 5.857 7.236 8.351 1.854
AcqSize 726 9.210 8.162 9.172 10.310 1.467
TarMTB 726 2.037 1.152 1.915 3.255 15.849
AcqQ 726 1.755 1.267 1.700 1.896 0.767
AcqAR 726 0.147 -0.055 0.001 0.156 1.925
AcqROA 726 0.062 0.022 0.059 0.099 0.084
AcqCAPEX 726 0.043 0.010 0.026 0.055 0.059
AcqCF 726 0.102 0.050 0.096 0.139 0.082
AcqLev 726 0.240 0.108 0.215 0.343 0.175
AcqRD 726 0.021 0.000 0.000 0.024 0.043
AcqAdv 726 0.002 0.000 0.000 0.000 0.014
AcqAge 726 55.844 22.000 38.000 79.000 48.842
Cash 726 0.574 0.000 1.000 1.000 0.495
Hostile 726 0.065 0.000 0.000 0.000 0.246
Cross border 726 0.394 0.000 0.000 1.000 0.489
Diversifying 726 0.186 0.000 0.000 0.000 0.389
Toehold 726 0.081 0.000 0.000 0.000 0.273
Multiple bids 726 0.103 0.000 0.000 0.000 0.305
Table 3 reports summary statistics for our sample. The sample consists of 726 deal offers initiated between January 1, 2004 and December 31, 2016. ArbSpread represents the arbitrage spreads one day after announcement. See Equations (1) and (2) for the calculation of the arbitrage spread. AcqCSR is the acquirer’s overall CSR score. AcqENV is an environmental score. AcqSOC is a social score. AcqGOV is a governance score. BidPremium is the percentage difference between the offer price and the target’s average price between t-30 to t-10 relative to announcement date. CumRet is the cumulative target’s stock price return from t – 42 to t – 1 relative to announcement date. AbnVol is abnormal trading volume around acquisition announcements (from t-1 to t+1). AcqSize is the acquirer’s market value. TarSize is the target’s market value. TarMTB is the targets’ market-to-book ratio. AcqQ is the acquirers’ Tobin’s Q. AcqAR is the acquirers’ market-adjusted return. AcqROA is the acquirer’s return on asset. AcqCAPEX represents the acquirer’s capital expenditures scaled by total assets. AcqCF is the acquirer’s cash flow scaled by total assets. AcqLev is the acquirer’s debt-to-asset ratio. AcqRD is the acquirer’s research and development expenses scaled by total assets. AcqAdv is the acquirer’s advertising expenses scaled by total assets. AcqAge is the acquiring firm’s age. Cash is a dummy variable that takes a value of one for purely cash-financed deals, and zero otherwise. Hostile is a dummy variable that takes a value of one for hostile bids, and zero otherwise. Cross border is a dummy variable that takes a value of one when the acquirer and the target are not in the same country, and zero otherwise. Diversifying is a dummy variable that takes the value of one if the acquirer and the target have different first two-digit standard industrial classification codes and zero otherwise. Toehold is a dummy variable that takes a value of one if the acquirer holds at least 5% of the target shares prior to the announcement and zero otherwise. Multiple bids is a dummy variable that takes a value of one if there is more than one acquirer and zero otherwise. All financial variables are winsorized at the 1% and 99% level.
Table 4 reports correlation coefficients between variables for our sample. ArbSpread represents the arbitrage spreads one day after announcement. See Equations (1) and (2) for the calculation of the arbitrage spread. AcqCSR is acquirers’ last available CSR score before announcement. AcqENV is an environmental score. AcqSOC is a social score. AcqGOV is a governance score. Bid premium is the percentage difference between the offer price and the target’s average price between t-30 to t-10 relative to announcement date. CumRet is the cumulative target’s stock price return from t – 42 to t – 1 relative to announcement date. AbnVol is abnormal trading volume around acquisition announcements (from t-1 to t+1). AcqSize is the acquirer’s market value. TarSize is the target’s market value. TarMTB is the targets’ market-to-book ratio. AcqQ is the acquirers’ Tobin’s Q. AcqAR is the acquirers’ market-adjusted return. AcqROA is the acquirer’s return on asset. AcqCAPEX represents the acquirer’s capital expenditures scaled by total assets. AcqCF is the acquirer’s cash flow scaled by total assets. AcqLev is the acquirer’s debt-to-asset ratio. AcqRD is the acquirer’s research and development expenses scaled by total assets. AcqAdv is the acquirer’s advertising expenses scaled by total assets. AcqAge is the acquiring firm’s age. Cash is a dummy variable that takes a value of one for purely cash-financed deals, and zero otherwise. Hostile is a dummy variable that takes a value of one for hostile bids, and zero otherwise. Cross border is a dummy variable that takes a value of one when the acquirer and the target are not in the same country, and zero otherwise. Diversifying is a dummy variable that takes the value of one if the acquirer and the target have different first two-digit standard industrial classification codes and zero otherwise. Toehold is a dummy variable that takes a value of one if the acquirer holds at least 5% of the target shares prior to the announcement and zero otherwise. Multiple bids is a dummy variable that takes a value of one if there is more than one acquirer and zero otherwise. All financial variables are winsorized at the 1% and 99% level. Bold denoted significance at the 5% level or lower.
42
Table 5: Acquirer’s CSR and arbitrage spreads Dependent variable: ArbSpread
The dependent variable represents the arbitrage spread one day after announcement. See Equations (1) and (2) for the calculation of the arbitrage spread. AcqCSR is the acquirer’s overall CSR score in column 1, the environmental score in column 2, the social score in column 3 and the governance score in column 4. Bid premium is the percentage difference between the offer price and the target’s average price between t-30 to t-10 relative to announcement date. CumRet is the cumulative target’s stock price return from t – 42 to t – 1 relative to announcement date. AbnVol is abnormal trading volume around acquisition announcements (from t-1 to t+1). AcqSize is the acquirer’s market value. TarSize is the target’s market value. TarMTB is the targets’ market-to-book ratio. AcqQi is the acquirers’ Tobin’s Q. AcqAR is the acquirers’ market-adjusted return. AcqROA is the acquirer’s return on asset. AcqCAPEX represents the acquirer’s capital expenditures scaled by total assets. AcqCF is the acquirer’s cash flow scaled by total assets. AcqLev is the acquirer’s debt-to-asset ratio. AcqRD is the acquirer’s research and development expenses scaled by total assets. AcqAdv is the acquirer’s advertising expenses scaled by total assets. AcqAge is the acquiring firm’s age. Cash is a dummy variable that takes a value of one for purely cash-financed deals, and zero otherwise. Hostile is a dummy variable that takes a value of one for hostile bids, and zero otherwise. Cross border is a dummy variable that takes a value of one when the acquirer and the target are not in the same country, and zero otherwise. Diversifying is a dummy variable that takes the value of one if the acquirer and the target have different first two-digit standard industrial classification codes and zero otherwise. Toehold is a dummy variable that takes a value of one if the acquirer holds at least 5% of the target shares prior to the announcement and zero otherwise. Multiple bids is a dummy variable that takes a value of one if there is more than one acquirer and zero otherwise. Regressions include country, industry and year fixed effects. All financial variables are winsorized at the 1% and 99% level. T-statistics are in parentheses. ***, ** and * denote significance at the 1%, 5% and 10% level respectively.
43
Table 6: Acquirer’s CSR and likelihood of deal success Probit regression
Table 7 reports the results of Probit regression. The dependent variable is a dummy variable that equals one if the deal is completed and zero otherwise. AcqCSR is the acquirer’s overall CSR score in column 1, the environmental score in column 2, the social score in column 3 and the governance score in column 4. Bid premium is the percentage difference between the offer price and the target’s average price between t-30 to t-10 relative to announcement date. CumRet is the cumulative target’s stock price return from t – 42 to t – 1 relative to announcement date. AbnVol is abnormal trading volume around acquisition announcements (from t-1 to t+1). AcqSize is the acquirer’s market value. TarSize is the target’s market value. TarMTB is the targets’ market-to-book ratio. AcqQ is the acquirers’ Tobin’s Q. AcqAR is the acquirers’ market-adjusted return. AcqROA is the acquirer’s return on asset. AcqCAPEX represents the acquirer’s capital expenditures scaled by total assets. AcqCF is the acquirer’s cash flow scaled by total assets. AcqLev is the acquirer’s debt-to-asset ratio. AcqRD is the acquirer’s research and development expenses scaled by total assets. AcqAdv is the acquirer’s advertising expenses scaled by total assets. AcqAge is the acquiring firm’s age. Cash is a dummy variable that takes a value of one for purely cash-financed deals, and zero otherwise. Hostile is a dummy variable that takes a value of one for hostile bids, and zero otherwise. Cross border is a dummy variable that takes a value of one when the acquirer and the target are not in the same country, and zero otherwise. Diversifying is a dummy variable that takes the value of one if the acquirer and the target have different first two-digit standard industrial classification codes and zero otherwise. Toehold is a dummy variable that takes a value of one if the acquirer holds at least 5% of the target shares prior to the announcement and zero otherwise. Multiple bids is a dummy variable that takes a value of one if there is more than one acquirer and zero otherwise. Regressions include country, industry and year fixed effects. All financial variables are winsorized at the 1% and 99% level. The numbers in brackets are marginal effects expressed in percentage points. ***, ** and * denote significance at the 1%, 5% and 10% level respectively.
In column 1, our dependent variable is the arbitrage spread two day after announcement. See Equations (1) and (2) for the calculation of the arbitrage spread. In column 2, we restrict our sample to the non-crisis period. In column 3, we restrict our sample to non-financial firms. In column 4, we restrict our sample to deals exhibiting positive arbitrage spreads. In column 5, we restrict our sample to non-US deals. Control variables are the same as in Equation 3 and coefficients associated with them are not reported for the sake of brevity. Regressions include country, industry and year fixed effects. All variables are winsorized at the 1% and 99% level. T-statistics are in parentheses. ***, ** and * denote significance at the 1%, 5% and 10% level respectively.
45
Table 8: Acquirer’s CSR and arbitrage spreads (accounting for target’s CSR) Dependent variable: ArbSpread
The dependent variable represents the arbitrage spreads one day after announcement. See Equations (1) and (2) for the calculation of the arbitrage spread.
AcqCSR is the acquirer’s overall CSR score in column 1, the environmental score in column 2, the social score in column 3 and the governance score in column 4.
TarCSR is the target’s overall CSR score in column 1, the environmental score in column 2, the social score in column 3 and the governance score in column 4. Bid
premium is the percentage difference between the offer price and the target’s average price between t-30 to t-10 relative to announcement date. CumRet is the
cumulative target’s stock price return from t – 42 to t – 1 relative to announcement date. AbnVol is abnormal trading volume around acquisition announcements
(from t-1 to t+1). AcqSize is the acquirer’s market value. TarSize is the target’s market value. TarMTB is the targets’ market-to-book ratio. AcqQi is the acquirers’
Tobin’s Q. AcqAR is the acquirers’ market-adjusted return. AcqROA is the acquirer’s return on asset. AcqCAPEX represents the acquirer’s capital expenditures
scaled by total assets. AcqCF is the acquirer’s cash flow scaled by total assets. AcqLev is the acquirer’s debt-to-asset ratio. AcqRD is the acquirer’s research and
development expenses scaled by total assets. AcqAdv is the acquirer’s advertising expenses scaled by total assets. AcqAge is the acquiring firm’s age. Cash is a
dummy variable that takes a value of one for purely cash-financed deals, and zero otherwise. Hostile is a dummy variable that takes a value of one for hostile
bids, and zero otherwise. Cross border is a dummy variable that takes a value of one when the acquirer and the target are not in the same country, and zero
otherwise. Diversifying is a dummy variable that takes the value of one if the acquirer and the target have different first two-digit standard industrial
classification codes and zero otherwise. Toehold is a dummy variable that takes a value of one if the acquirer holds at least 5% of the target shares prior to the
announcement and zero otherwise. Multiple bids is a dummy variable that takes a value of one if there is more than one acquirer and zero otherwise.
Regressions include country, industry and year fixed effects. All financial variables are winsorized at the 1% and 99% level. T-statistics are in parentheses. ***, **
and * denote significance at the 1%, 5% and 10% level respectively.
46
Table 9: Acquirer’s CSR and arbitrage spreads (removing serial acquirers) Dependent variable: ArbSpread
The dependent variable represents the arbitrage spread one day after announcement. See Equations (1) and (2) for the calculation of arbitrage spreads. AcqCSR is the acquirer’s overall CSR score in column 1, the environmental score in column 2, the social score in column 3 and the governance score in column 4. Bid premium is the percentage difference between the offer price and the target’s average price between t-30 to t-10 relative to announcement date. CumRet is the cumulative target’s stock price return from t – 42 to t – 1 relative to announcement date. AbnVol is abnormal trading volume around acquisition announcements (from t-1 to t+1). AcqSize is the acquirer’s market value. TarSize is the target’s market value. TarMTB is the targets’ market-to-book ratio. AcqQ is the acquirers’ Tobin’s Q. AcqAR is the acquirers’ market-adjusted return. AcqROA is the acquirer’s return on asset. AcqCAPEX represents the acquirer’s capital expenditures scaled by total assets. AcqCF is the acquirer’s cash flow scaled by total assets. AcqLev is the acquirer’s debt-to-asset ratio. AcqRD is the acquirer’s research and development expenses scaled by total assets. AcqAdv is the acquirer’s advertising expenses scaled by total assets. AcqAge is the acquiring firm’s age. Cash is a dummy variable that takes a value of one for purely cash-financed deals, and zero otherwise. Hostile is a dummy variable that takes a value of one for hostile bids, and zero otherwise. Cross border is a dummy variable that takes a value of one when the acquirer and the target are not in the same country, and zero otherwise. Diversifying is a dummy variable that takes the value of one if the acquirer and the target have different first two-digit standard industrial classification codes and zero otherwise. Toehold is a dummy variable that takes a value of one if the acquirer holds at least 5% of the target shares prior to the announcement and zero otherwise. Multiple bids is a dummy variable that takes a value of one if there is more than one acquirer and zero otherwise. Regressions include country, industry and year fixed effects. All financial variables are winsorized at the 1% and 99% level. The numbers in brackets are marginal effects expressed in percentage points. ***, ** and * denote significance at the 1%, 5% and 10% level respectively.
47
Table 10: Instrumental Variables Estimations CSR Environment Social Governance
First stage Second stage First stage Second stage First stage Second stage First stage Second stage
Table 10 presents our two-stage least square estimations. In the first stage, CSR scores (overall, environment, social, and governance) are regressed on two instruments, which are the country-year mean of CSR scores
and the country-industry mean of CSR scores, computed using the entire ASSET4 ESG database. AcqCSR_adj is the predicted value of the overall CSR score in column 2, the environment score in column 4, the social
score in column 6 and the governance score in column 8. Control variables are the same as in Equation 3 and coefficients associated with them are not reported for the sake of brevity. Regressions include country and
year fixed effects. T-statistics are in parentheses. ***, ** and * denote significance at the 1%, 5% and 10% level respectively.