Correlation study of multi-wavelength transient emission of selected CRTS cataclysmic variables H Szegedi, A Odendaal and PJ Meintjes Department of Physics, University of the Free State, PO Box 339, Bloemfontein, 9300, South Africa E-mail: [email protected]Abstract. A sample of cataclysmic variable systems, showing high levels of transient emission, have been identified in the Catalina Real-Time Transient Survey archive. This study involved the identification of rapidly varying transient sources which met the criteria for intensive multi-wavelength follow-up studies. The selection criteria are discussed, as well as the PSF photometry process that was used to obtain light curves for the selected sample. The follow-up studies will be aimed at better understanding the processes driving thermal and non-thermal transient phenomena in several disc-fed and disc-less cataclysmic variable sources. Further optical observations will include photometric observations with the UFS/Boyden 1.5-m telescope at the Boyden Observatory and spectroscopic observations with the SAAO 1.9-m telescope, located at the South African Astronomical Observatory (SAAO). 1. Introduction The Catalina Real-Time Transient Survey (CRTS) is aimed at discovering sources that undergo transient variations in brightness, e.g. cataclysmic variables (CVs), supernovae and blazars [1]. It provides a detailed survey that includes extremely faint sources of up to 20 magnitudes. The CRTS makes use of three dedicated telescopes which, combined, cover ∼ 30000 deg 2 of sky in the declination range of -75 ◦ <δ< 65 ◦ . The telescopes run separate sub-surveys which are known as the Catalina Schmidt Survey (CSS), the Mount Lemmon Survey (MLS) and the Siding Spring Survey (SSS), respectively [2]. The CRTS started operating in 2007 and has since identified more than 1300 CV candidates, making it the largest sample of CVs from a single survey to date. Due to the survey’s success, it is the ideal database to mine for sources that show high levels of transient emission, e.g. the CVs. CVs are close binary systems in which a Roche lobe filling low-mass star (secondary) transfers matter to a white dwarf (WD) primary [1, 3]. These are compact systems, with a separation of ∼ 1R between the binary components, and with orbital periods (P orb ) of a few hours or less [4]. The intensity of the WD’s magnetic field determines the accretion process. CVs where the primary has a weak magnetic field (B ? < 1 MG), are known as non-magnetic CVs (NMCVs) and material is accreted via an accretion disc. If the primary has a strong magnetic field, then the CV is either an Intermediate Polar (IP) (B ? ∼ 1 - 10 MG) or a Polar (B ? ∼ 10 - 150 MG) [5]. Polars channel material towards the magnetic poles and IPs accrete material via a disrupted accretion disc and an accretion stream to the primary’s poles. Many CVs exhibit dramatic outbursts, which are classified according to the outburst recurrence time and magnitude range. These outbursts are essentially caused by either runaway Proceedings of SAIP2016 SA Institute of Physics ISBN: 978-0-620-77094-1 279
Transcript
Correlation study of multi-wavelength transient
emission of selected CRTS cataclysmic variables
H Szegedi, A Odendaal and PJ MeintjesDepartment of Physics, University of the Free State, PO Box 339, Bloemfontein, 9300, SouthAfrica
Abstract. A sample of cataclysmic variable systems, showing high levels of transient emission,have been identified in the Catalina Real-Time Transient Survey archive. This study involvedthe identification of rapidly varying transient sources which met the criteria for intensivemulti-wavelength follow-up studies. The selection criteria are discussed, as well as the PSFphotometry process that was used to obtain light curves for the selected sample. The follow-upstudies will be aimed at better understanding the processes driving thermal and non-thermaltransient phenomena in several disc-fed and disc-less cataclysmic variable sources. Furtheroptical observations will include photometric observations with the UFS/Boyden 1.5-m telescopeat the Boyden Observatory and spectroscopic observations with the SAAO 1.9-m telescope,located at the South African Astronomical Observatory (SAAO).
1. IntroductionThe Catalina Real-Time Transient Survey (CRTS) is aimed at discovering sources that undergotransient variations in brightness, e.g. cataclysmic variables (CVs), supernovae and blazars [1].It provides a detailed survey that includes extremely faint sources of up to 20 magnitudes. TheCRTS makes use of three dedicated telescopes which, combined, cover ∼ 30000 deg2 of skyin the declination range of −75◦ < δ < 65◦. The telescopes run separate sub-surveys whichare known as the Catalina Schmidt Survey (CSS), the Mount Lemmon Survey (MLS) and theSiding Spring Survey (SSS), respectively [2]. The CRTS started operating in 2007 and has sinceidentified more than 1300 CV candidates, making it the largest sample of CVs from a singlesurvey to date. Due to the survey’s success, it is the ideal database to mine for sources thatshow high levels of transient emission, e.g. the CVs.
CVs are close binary systems in which a Roche lobe filling low-mass star (secondary) transfersmatter to a white dwarf (WD) primary [1, 3]. These are compact systems, with a separation of∼ 1 R� between the binary components, and with orbital periods (Porb) of a few hours or less[4]. The intensity of the WD’s magnetic field determines the accretion process. CVs where theprimary has a weak magnetic field (B? < 1 MG), are known as non-magnetic CVs (NMCVs)and material is accreted via an accretion disc. If the primary has a strong magnetic field, thenthe CV is either an Intermediate Polar (IP) (B? ∼ 1 − 10 MG) or a Polar (B? ∼ 10 − 150 MG)[5]. Polars channel material towards the magnetic poles and IPs accrete material via a disruptedaccretion disc and an accretion stream to the primary’s poles.
Many CVs exhibit dramatic outbursts, which are classified according to the outburstrecurrence time and magnitude range. These outbursts are essentially caused by either runaway
Proceedings of SAIP2016
SA Institute of Physics ISBN: 978-0-620-77094-1 279
Figure 1. Schematic illustration of an opti-cally thick boundary layer. The secondary’sRoche lobe overflow is accreted by the WDwith a weak magnetic field (Adopted from [8,p. 156, Fig. 6.2].
Figure 2. Schematic illustration of theaccretion column typically seen in a Polar.The WD has a strong magnetic field causingaccretion material to channel through themagnetic poles. (Adopted from [8, p. 178,Fig. 6.11].
thermonuclear burning of the accreted material on the WD’s surface, as in classical novae (CNe)and recurrent novae (RNe), or a release of gravitational energy caused by a temporary increasein the mass transfer rate of the accretion disc, as in dwarf novae (DNe) [6]. The vast majority ofthese eruptive systems are NMCVs, as outbursts in magnetic CVs are rare events. V1500 Cyg(novae outburst in 1975) [7], and GK Per (dwarf nova outburst in 2015) [8], are two magneticCVs who exhibited such eruptive behaviour. In a fourth class of systems, the so-called nova-likes,large eruptions as in novae or DNe have not been observed.
The most common CV type detected is DNe, since most CVs accrete material onto the WDvia an accretion disc [2]. During an outburst, a DN shows a typical increase in brightness of 2 -5 magnitudes. The outburst can last for a few days and recurs on a timescale of days to years[6]. DNe are sub-divided into three distinct types, namely U Gem, Z Cam and SU UMa stars.SU UMa stars occasionally have superoutbursts which last ∼ 5 times as long as an ordinaryoutburst. The knowledge gained from monitoring CVs and studying the physical processesrelated to gravitation, viscosity and magnetic fields, will contribute to the understanding ofe.g. planet formation and larger accreting systems, such as Active Galactic Nuclei (AGNs).
CVs emit energy almost across the whole electromagnetic spectrum [9]. The regions wherethe strongest emission occurs in non-magnetic and magnetic CVs are illustrated in figure 1and figure 2, respectively. In NMCVs, the accretion disc often dominates the luminosity ofthe system, making the primary and secondary almost invisible in the optical spectrum. Theboundary layer, which is the transition region between the accretion disc and the WD, is theregion where particles decelerate to match the surface velocity of the WD. Soft X-rays andextreme ultraviolet (EUV) emission are detected from this region when the boundary layer isoptically thick [6]. An optically thin boundary layer emits hard X-rays. Infrared radiation comesfrom the outer regions of the disc. In magnetic CVs, high energy radiation, such as hard X-rays,are emitted from a region in the accretion column where supersonic accretion flow produces astand-off shock. Soft X-rays and ultraviolet radiation are emitted where the hot subsonic settlingflow interacts with the WD’s photosphere. Radio emission is also observed due to synchrotron
Proceedings of SAIP2016
SA Institute of Physics ISBN: 978-0-620-77094-1 280
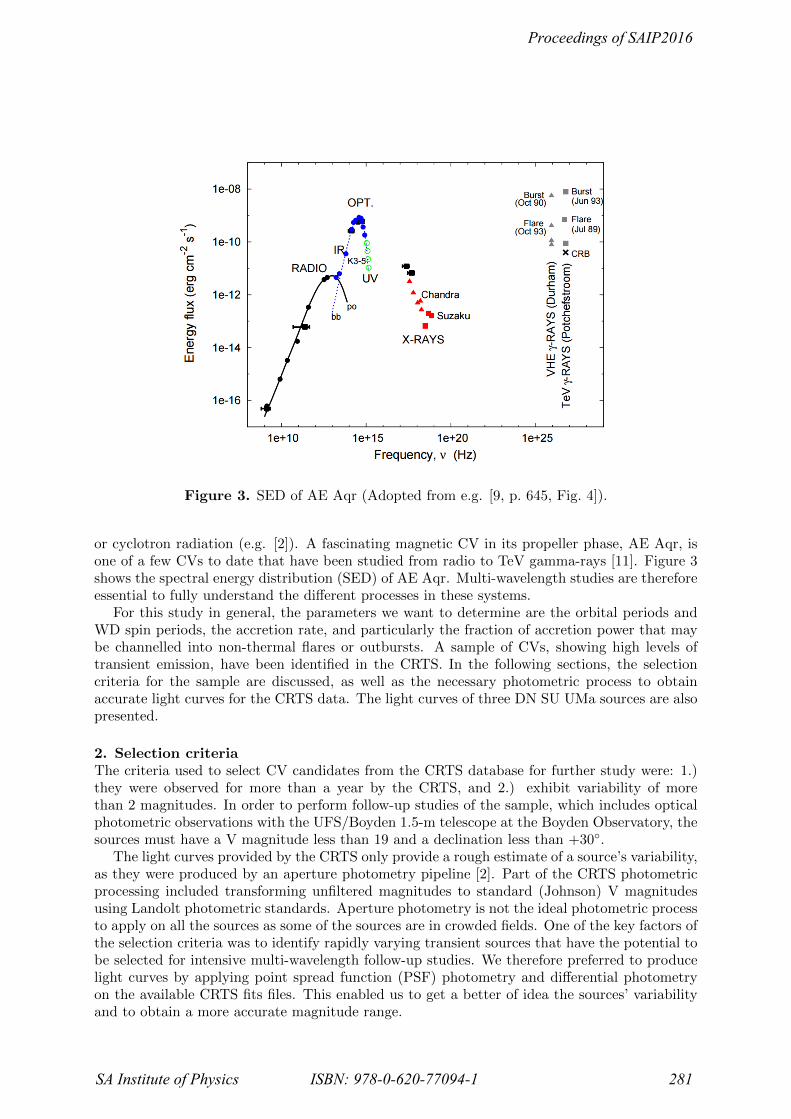
Figure 3. SED of AE Aqr (Adopted from e.g. [9, p. 645, Fig. 4]).
or cyclotron radiation (e.g. [2]). A fascinating magnetic CV in its propeller phase, AE Aqr, isone of a few CVs to date that have been studied from radio to TeV gamma-rays [11]. Figure 3shows the spectral energy distribution (SED) of AE Aqr. Multi-wavelength studies are thereforeessential to fully understand the different processes in these systems.
For this study in general, the parameters we want to determine are the orbital periods andWD spin periods, the accretion rate, and particularly the fraction of accretion power that maybe channelled into non-thermal flares or outbursts. A sample of CVs, showing high levels oftransient emission, have been identified in the CRTS. In the following sections, the selectioncriteria for the sample are discussed, as well as the necessary photometric process to obtainaccurate light curves for the CRTS data. The light curves of three DN SU UMa sources are alsopresented.
2. Selection criteriaThe criteria used to select CV candidates from the CRTS database for further study were: 1.)they were observed for more than a year by the CRTS, and 2.) exhibit variability of morethan 2 magnitudes. In order to perform follow-up studies of the sample, which includes opticalphotometric observations with the UFS/Boyden 1.5-m telescope at the Boyden Observatory, thesources must have a V magnitude less than 19 and a declination less than +30◦.
The light curves provided by the CRTS only provide a rough estimate of a source’s variability,as they were produced by an aperture photometry pipeline [2]. Part of the CRTS photometricprocessing included transforming unfiltered magnitudes to standard (Johnson) V magnitudesusing Landolt photometric standards. Aperture photometry is not the ideal photometric processto apply on all the sources as some of the sources are in crowded fields. One of the key factors ofthe selection criteria was to identify rapidly varying transient sources that have the potential tobe selected for intensive multi-wavelength follow-up studies. We therefore preferred to producelight curves by applying point spread function (PSF) photometry and differential photometryon the available CRTS fits files. This enabled us to get a better of idea the sources’ variabilityand to obtain a more accurate magnitude range.
Proceedings of SAIP2016
SA Institute of Physics ISBN: 978-0-620-77094-1 281
3. PSF photometryThe Image Reduction and Analysis Facility (IRAF) package is freeware that is mainly used forgeneral image processing (reduction and analysis) of astronomical data [13]. It includes packagesto do accurate photometric processing. A Python- and PyRAF-based script was developed whichautomated PSF photometry in IRAF. The standard routines of the DAOPHOT package wereused. By automating PSF photometry, the PST package in DAOPHOT automatically identifiesstars to create a PSF. The problem with the CRTS data is that some of the stars in the imagesare saturated and cannot be used to create a PSF. This was overcome by setting a maximumdetection value in the DAOFIND package to ensure that the saturated stars were not identifiedand used to create a PSF.
A differential photometry method largely based on the method described by Everett andHowell [14] was included in the automated script. For the purpose of differential photometry,three comparison stars were chosen near the source. Another pitfall of the CRTS data is thatthe source is not centred in the images and have an extreme positional shift between frames.This limited the number of comparison stars that could be used for differential photometry,as the chosen comparison stars are not in the field of view for all the frames. The script wasprogrammed to identify the comparison stars that were visible in most of the frames and thathad the lowest corrected magnitude variance values. This helped to eliminate the possibilitythat the chosen comparison stars are also variable stars and ensured that the best differentialphotometry results were obtained.
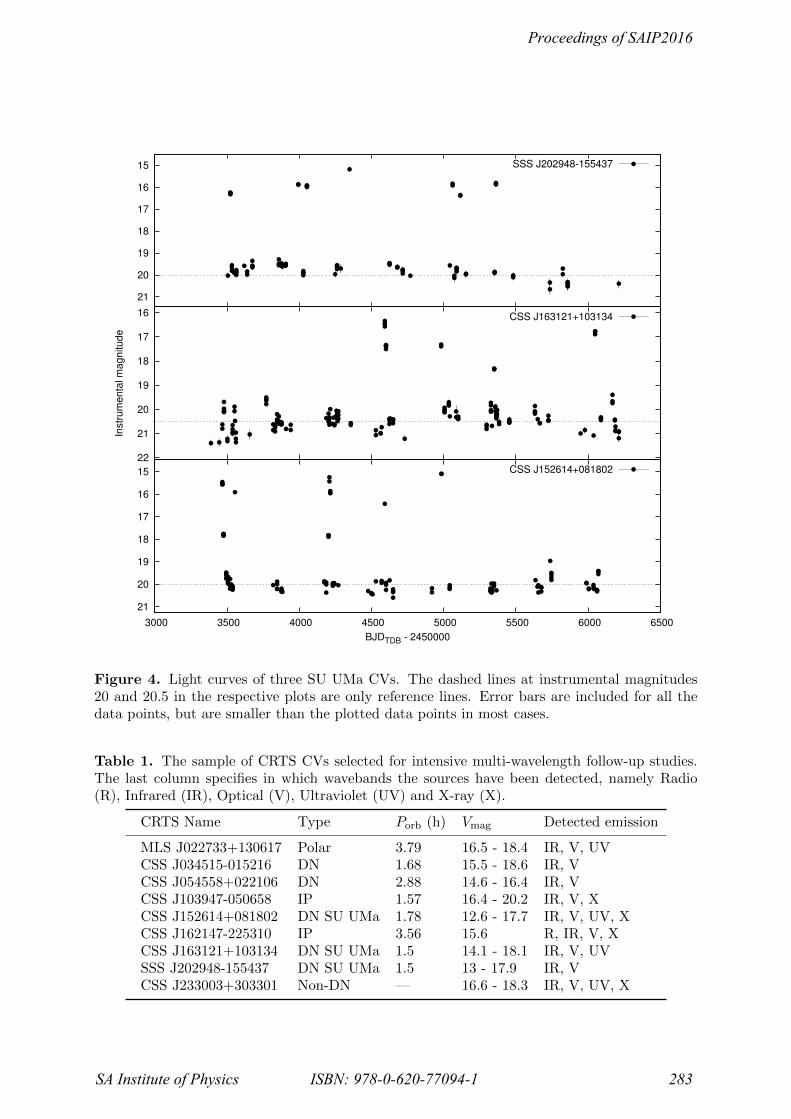
Figure 4 shows the light curves (with error bars) obtained for SSS J202948-155437, CSSJ163121+103134 and CSS J152614+081802. All three sources are classified as SU UMa DNeand show prominent outbursts. During quiescence, the sources vary by ∼ 1 magnitude, whichis a clear indication that there must be other processes at hand that cause variability, otherthan the release of gravitational energy. This lower magnitude range variability is visible whenthe light curves are compared to the reference lines (dashed lines) included in the plots. Theerror bars are extremely small, indicating the high degree of accuracy associated with the PSFphotometry process. All three sources are included in the sample and further observations willassist in narrowing down the causes of variability.
The sample of sources that was selected for intensive multi-wavelength follow-up studies isdiscussed in the next section.
4. The sample from CRTSThe CRTS CV sample that was chosen for the multi-wavelength follow-up study is given intable 1. The CV classifications and the orbital periods Porb were obtained from the Outburstcatalogue of cataclysmic variables [15], accessible through the CDS Vizier website [16]. The Vmagnitudes are the values specified by the CRTS [1]. CDS Vizier was also used to determinein which wavelengths the CVs have been observed or detected. This is for an indication of howextensive the multi-wavelength studies can potentially be.
5. Prospects for future workOptical observations of the sample will be undertaken, and other archives, e.g. GALEX, WISE,XMM-Newton and Fermi, will be investigated in an attempt to match outbursts detected byCRTS. The new observations will include photometric observations with the UFS/Boyden 1.5-m telescope at the Boyden Observatory, and spectroscopic observations with the SAAO 1.9-m telescope, located at the South African Astronomical Observatory (SAAO). The increasedsensitivity of instruments, such as the currently constructed MeerKAT, will increase the numberof radio detections in CVs. In the near future, we wish to utilise MeerKAT, more specificallyThunderKAT (The HUNt for Dynamic and Explosive Radio transients with MeerKAT), to helpus better understand the processes causing non-thermal outbursts in the system.
Proceedings of SAIP2016
SA Institute of Physics ISBN: 978-0-620-77094-1 282
15
16
17
18
19
20
21
3000 3500 4000 4500 5000 5500 6000 6500
BJDTDB - 2450000
CSS J152614+081802
16
17
18
19
20
21
22
Instr
um
en
tal m
ag
nitu
de
CSS J163121+103134
15
16
17
18
19
20
21
SSS J202948-155437
Figure 4. Light curves of three SU UMa CVs. The dashed lines at instrumental magnitudes20 and 20.5 in the respective plots are only reference lines. Error bars are included for all thedata points, but are smaller than the plotted data points in most cases.
Table 1. The sample of CRTS CVs selected for intensive multi-wavelength follow-up studies.The last column specifies in which wavebands the sources have been detected, namely Radio(R), Infrared (IR), Optical (V), Ultraviolet (UV) and X-ray (X).
CRTS Name Type Porb (h) Vmag Detected emission
MLS J022733+130617 Polar 3.79 16.5 - 18.4 IR, V, UVCSS J034515-015216 DN 1.68 15.5 - 18.6 IR, VCSS J054558+022106 DN 2.88 14.6 - 16.4 IR, VCSS J103947-050658 IP 1.57 16.4 - 20.2 IR, V, XCSS J152614+081802 DN SU UMa 1.78 12.6 - 17.7 IR, V, UV, XCSS J162147-225310 IP 3.56 15.6 R, IR, V, XCSS J163121+103134 DN SU UMa 1.5 14.1 - 18.1 IR, V, UVSSS J202948-155437 DN SU UMa 1.5 13 - 17.9 IR, VCSS J233003+303301 Non-DN — 16.6 - 18.3 IR, V, UV, X
Proceedings of SAIP2016
SA Institute of Physics ISBN: 978-0-620-77094-1 283
AcknowledgmentsThe financial assistance of the National Research Foundation (NRF) towards this research ishereby acknowledged. This research has made use the SIMBAD database as well as the VizieRcatalogue access tool, CDS, Strasbourg, France.
References[1] Drake A J et al. 2009 ApJ 696 870–884[2] Breedt E, Gansicke B T, Drake A J, Rodrıguez-Gil P, Parsons S G, Marsh T R, Szkody P, Schreiber M R
and Djorgovski S G 2014 MNRAS 443 3174–3207[3] Szkody P and Gansicke B T 2012 Journal of the American Association of Variable Star Observers (JAAVSO)
40 563–571[4] Hellier C 2001 Cataclysmic Variable Stars - How and why they vary (Chichester: Praxis Publishing Ltd)[5] Singh K P 2015 Recent Trends in the Study of Compact Objects (RETCO-II): Theory and Observation
(Astronomical Society of India Conference Series vol 12) pp 29–34[6] Warner B 1995 Cataclysmic Variable Stars vol 28 (Cambridge: Cambridge University Press)[7] Stockman H S, Schmidt G D and Lamb D Q 1988 ApJ 332 282–286[8] Yuasa T, Hayashi T and Ishida M 2016 MNRAS 459 779–788[9] Giovannelli F 2008 Chinese Journal of Astronomy and Astrophysics Supplement 8 237–258
[10] Frank J, King A and Raine D J 2002 Accretion Power in Astrophysics 3rd ed (Cambridge: CambridgeUniversity Press)
[11] Meintjes P 2015 The Golden Age of Cataclysmic Variables and Related Objects - III (Golden2015) p 7[12] Meintjes P J, Oruru B and Odendaal A 2012 Mem. S.A.It. 83 643–650[13] Tody D 1980 Conference on Applications of Digital Image Processing to Astronomy (SPIE vol 264) ed Elliott
D A pp 171–179[14] Everett M E and Howell S B 2001 PASP 113 1428–1435[15] Coppejans D L, Kording E G, Knigge C, Pretorius M L, Woudt P A, Groot P J, Van Eck C L and Drake
A J 2016 MNRAS 456 4441–4454[16] Genova F et al. 2000 A&AS 143 1–7
Proceedings of SAIP2016
SA Institute of Physics ISBN: 978-0-620-77094-1 284